HIMALAYAN FORESTS UNDER DIFFERENT MANAGEMENT REGIMES… - 206.pdf · FORESTS UNDER DIFFERENT...
31
206 STRUCTURE OF CENTRAL HIMALAYAN FORESTS UNDER DIFFERENT MANAGEMENT REGIMES: AN EMPIRICAL STUDY Sunil Nautiyal INSTITUTE FOR SOCIAL AND ECONOMIC CHANGE 2008 WORKING PAPER
Transcript of HIMALAYAN FORESTS UNDER DIFFERENT MANAGEMENT REGIMES… - 206.pdf · FORESTS UNDER DIFFERENT...

206STRUCTURE OF CENTRALHIMALAYAN FORESTSUNDER DIFFERENTMANAGEMENT REGIMES:AN EMPIRICAL STUDY
Sunil Nautiyal
INSTITUTE FOR SOCIAL AND ECONOMIC CHANGE2008
WORKING
PAPER
1
STRUCTURE OF CENTRAL HIMALAYAN
FORESTS UNDER DIFFERENT MANAGEMENT
REGIMES: AN EMPIRICAL STUDY
Sunil Nautiyal*
Abstract
The conservation, management and sustainable resource utilisation of forests are
crucial issues keeping in view the growth in population. Among the conservation
approaches, three are commonly known in the Indian Central Himalaya. They are:
(1) Traditional Conserved Forests (TCF), (2) Government Conserved Forests (GCF),
and (3) Community Conserved Forests (CCF). The important indicators were
identified for the assessment of these forests. Based on a comparative study, CCF
was found diverse and rich in comparison to other forest types of the region.
Introduction
Forested landscapes are important ecological, economic, and social/
cultural resources that provide the basis for the sustainability of any region
and contribute significantly to the quality of life of the local people . The
extent of forest land within the landscape, in general, has a positive
effect on the quality of the landscape (Brabyn, 2005). Sustainable
management and utility of forest resources requires accurate information
about their extent and spatial distribution (Lu et al., 2004). To understand
the quality and structure of forests, data pertaining to forest species,
density and average stand diameter are important.to assess. Human and
forest ecosystem interaction and resource conservation, management
and development in such natural reservoirs are of major concern all over
the world (Liu, 2001). Understanding the human influences on forested
landscape needs additional attention in developing countries in view of
complex interaction between human and forest ecosystems. Furthermore,
in the mountainous region the topography and environmental
*Centre for Ecological Economics and Natural Resources, Institute for Social and
Economic Change, Dr. V.K.R.V. Rao Road, Nagarabhavi, Bangalore - 560 072,
India.

2
heterogeneity needs further emphasis as unsustainable forest resource
management and overexploitation of the resources accelerates erosion,
which partly contributes to devastating floods in the plains (Ives and
Messerli 1989; Saxena et al. 2001).
The Himalayas in India account for more than 50 percent of its forest
cover and comprise 40 percent of the species endemic to the Indian
subcontinent. Various approaches exist in the Himalayan region for the
conservation and management of forest resources. Among them three
viz., sacred groves Traditional Conserved Forests (TCF), Government
Conserved Forests (GCF) and Community Conserved Forests (CCF) have
been selected for detail study. Here the hypothesis is introduced - How
do forest structures differ from each other under the three conservation
approaches and which conservation approach yields more fruitful results.
To evaluate the hypothesis, important indicators (quantified information
that help to summarise the complex information) such as species richness,
diversity, frequency, density, total basal cover and importance value index
(sum of relative values of frequency, density, and dominance) were chosen
for the present study to understand pattern and vegetation dynamics
across three different conservation regimes in the mountains of the Indian
Himalayas.
Study area and climate
The study sites for this research are located in Pithoragarh, Chamoli
and Tehri administrative districts of Uttarakhand State (Central Himalayas)
of India. The forests types located in these administrative districts come
under the Himalayan moist temperate forests category as per Champion
and Seth’s (1967) classification. The forests—TCF (Thalkedar of
Pithoragarh district), GCF (Urgam of Chamoli district) and CCF (Jardhar
of Tehri district)—were studied in detail (Table 1). These forests represent
the whole mid-high elevational landscape of the Central Himalayas.

3
Table 1: Some characteristics of studied Forests
Parameters Forests types
TCF GCF CCF
Traditional Government Community
Conserved Conserved Conserved
Forest Forest Forest
Approximate area (ha) 1300 800 850
Altitude 1600-2450 1800-2300 1500-1935
Slope 30-40 35-45 25-35
Forest types Mixed Mixed Mixed
Category of the forest Moist Temperate Moist Temperate Moist
Temperate
Ground vegetation Dense Comparatively Moderately
sparse Dense
Management regimes Traditional Government Community
socio-cultural control rules
Description of the study sites, forests and
conservation theories
• Traditional Conserved Forest (TCF): The TCF or sacred
forests, are guarded by the common village folk who safeguard them of
green through their own set of rules, in the form of taboos, religious
sanctions and belief systems. The sacred forest of Thalkedar is one such
example (Negi 2005). The sacred forests are undisturbed ecosystems
that are dedicated to the local deity and therefore not exploited for the
sake of a livelihood. The Hariyali (Sinha and Maikhuri 1998; Ramakrishnan,
et al,1998) and Kartik Swami landscapes of Central Himalayas, Konthoujam
Lairembi, Mahabali, Laggol Thongak Lairembi and Heingang Marjing of
north-east India (Khumbongmayum et al. 2006) and Oorani and
Olagapuram in south India are examples of sacred groves where local
people intertwine their socio-cultural and religious practices for the
conservation and management of resources (Ramanujam and Kadamban
2001). Undoubtedly, the concept of sacred groves has saved the
biodiversity to a great extent for many generations. But, due to a variety
4
of factors, most of the world’s sacred groves have disappeared and
only a few still exist today (Ramakrishnan et al, 1998). Unfortunately,
minimal efforts are being made for their better conservation. Empirical
studies indicate that change in socio-cultural and religious beliefs, and
migrants with different cultural value systems and beliefs adversely
affect such traditional reservoirs (Saikia 2006).
• Government Conserve Forest (GCF): The forest
department of a government ministry is the responsible and accountable
for managing GCF through policies that include the Wildlife Protection
Act 1972, Forest Conservation Act 1980, and Forest Policy 1988. Due to
changes over time, the rights of communities have been taken away by
the government, alienating them from management practices (Guha 1998
p. 95 cited in Bandhopadhyay et al. 2005; Wakeel et al. 2005). These
forests are controlled by the forest department and the villagers are
excluded from their management. Sometimes the government may also
delegate the management to a panchayat (village council), non
governmental organisations and adjacent residential communities but
the forest department retains full ownership, command and direction of
the forests. Hence it is not legally necessary to inform the people or
stakeholders regarding management decisions taken by the forest
department (IUCN 2002).
• Community Conserved Forests (CCF): The CCF have
recently drawn the attention of conservationists, researchers and
environmentalists. These forests are conserved through community
efforts, and rules and regulations are setup to use the resources. All
villagers, involved in the management of community forests, are
responsible for the conservation of the resources from CCFs. This is a
socio-ecological setup, that helps to maintain the forest resources while
also using the forest produce needed for sustainable livelihood in rural
areas (Kothari et al. 1998). The Jardhar forest in Tehri district is an
example of the community-based conservation in the mountains of the
Indian Himalayas. The external factors are not the big concern and locals

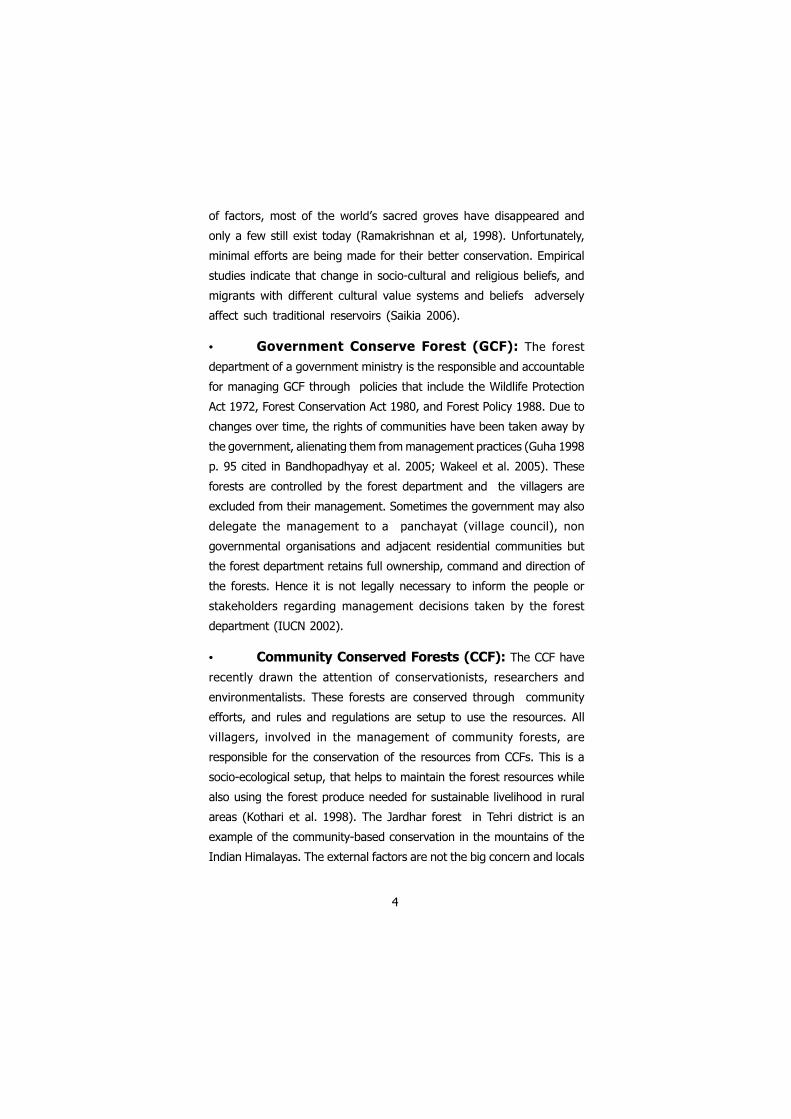
Sampling plot for treespecies (plot size 10x10m)
Sub-plot fortree sapling, seedlingand shrub Species (sub plot 5x5m)
Saplings/seedlings of all the tree species are identified and consequently completed the phytosociological attributes-frequency, abundance, density, relative values IVI basal area (m2/ha) etc.
This is an important aspect to assess the regeneration potential of forests and as well for regeneration potential of the individual species.
For monitoring and evaluation of the second vegetation layer (shrubs species.
All tree species are identified and phytosociological study (frequency, abundance, density, relative values, IVI and basal area m2ha1) completed based on the data from sampling plots to understand the forest structure.
Random sampling plots in the forest site
5
are more responsible for the conservation of their forests. The theory
behind community-based conservation is that “in a given case it is not
necessary that community development objectives are consistent with
the objectives setup for conservation” therefore, community-based
conservation supports conservation theory in a positive way (Berkes 2004).
Methodology
The forests were visited and analysed for structure using established
methods (Cottam and Curtis 1956; Ralhan et al. 1982; Saxena and Singh
1982, Nayak et al. 2000). The preliminary studies on TCF (Negi and
Nautiyal 2005) and CCF (Semwal et al., 1999) were helpful to take this
integrated approach for studying the different forests having different
management regimes in the mountains of the Indian Himalayas. However,
for this study the framework of methodology was revised and considered
the entire forest in one forest stand (Figure 1).
Figure 1: Framework to collect the ground data on forest structure and
regeneration pattern
6
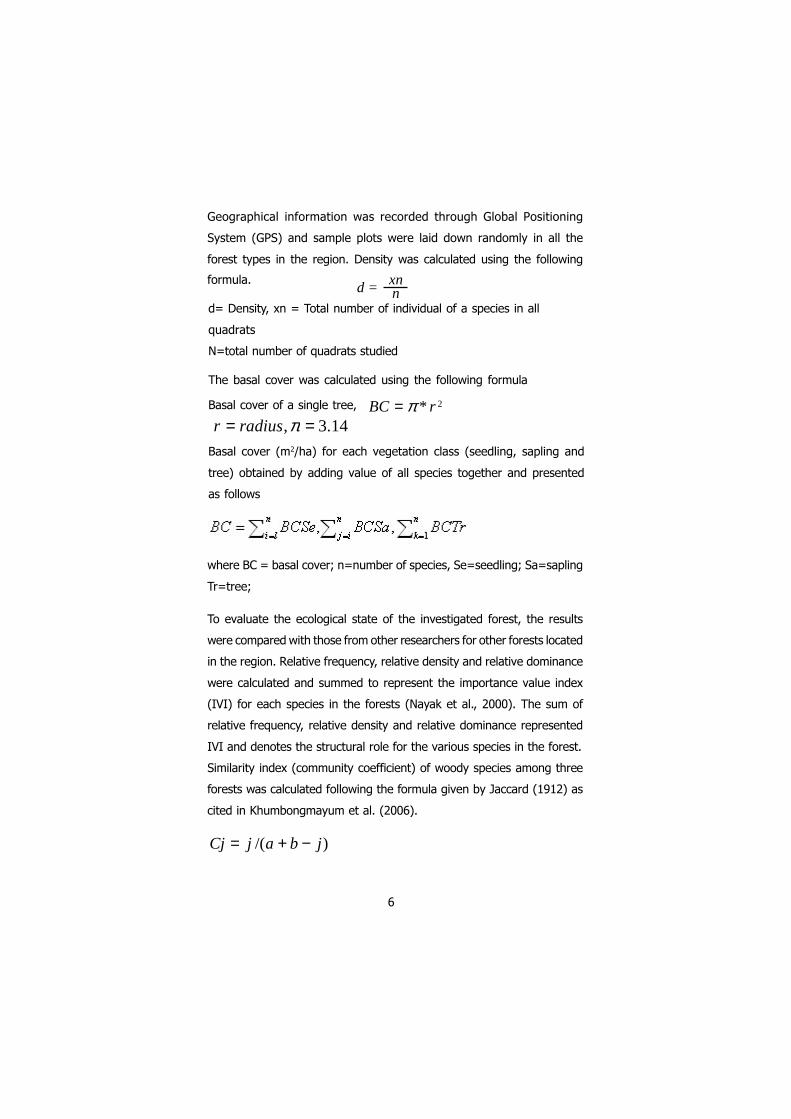
Geographical information was recorded through Global Positioning
System (GPS) and sample plots were laid down randomly in all the
forest types in the region. Density was calculated using the following
formula.d = xn
nd= Density, xn = Total number of individual of a species in all
quadrats
N=total number of quadrats studied
The basal cover was calculated using the following formula
Basal cover of a single tree, 2* rBC π=
Basal cover (m2/ha) for each vegetation class (seedling, sapling and
tree) obtained by adding value of all species together and presented
as follows
14.3, == πradiusr
where BC = basal cover; n=number of species, Se=seedling; Sa=sapling
Tr=tree;
To evaluate the ecological state of the investigated forest, the results
were compared with those from other researchers for other forests located
in the region. Relative frequency, relative density and relative dominance
were calculated and summed to represent the importance value index
(IVI) for each species in the forests (Nayak et al., 2000). The sum of
relative frequency, relative density and relative dominance represented
IVI and denotes the structural role for the various species in the forest.
Similarity index (community coefficient) of woody species among three
forests was calculated following the formula given by Jaccard (1912) as
cited in Khumbongmayum et al. (2006).
)/( jbajCj −+=
7
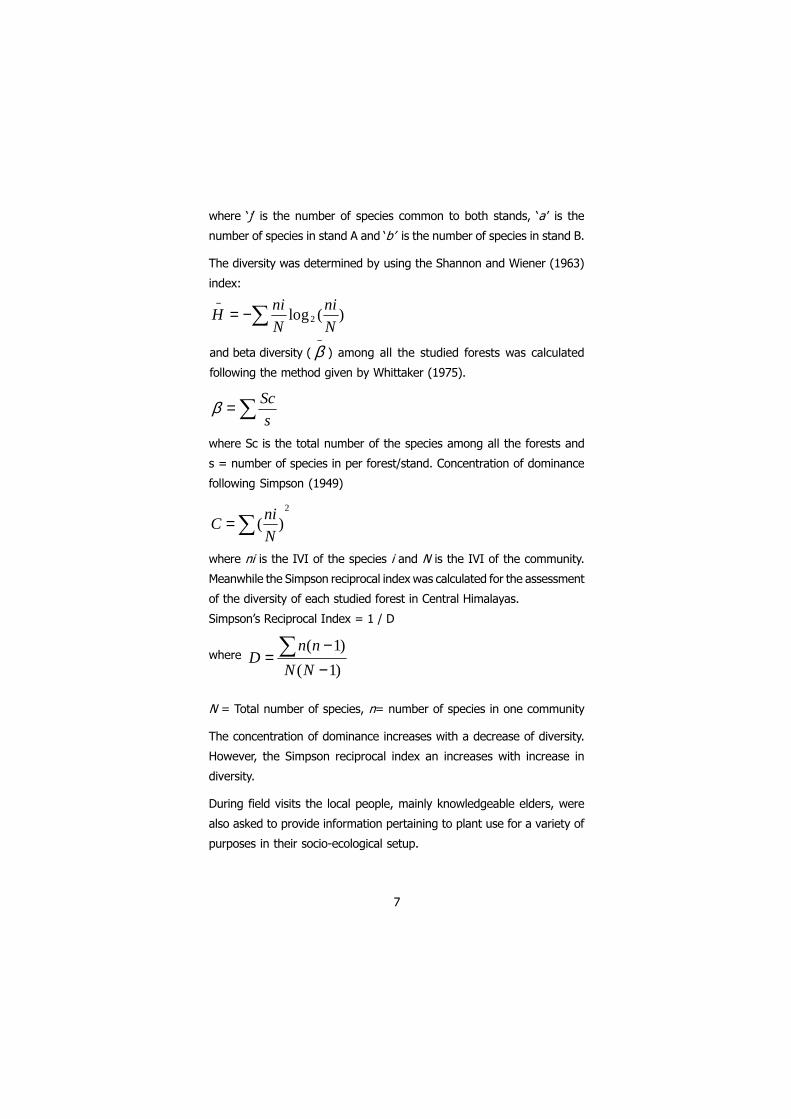
where ‘j’ is the number of species common to both stands, ‘a ’ is the
number of species in stand A and ‘b’ is the number of species in stand B.
The diversity was determined by using the Shannon and Wiener (1963)
index:
)(log2
N
ni
N
niH ∑−=−
and beta diversity ( ) among all the studied forests was calculated
following the method given by Whittaker (1975).
−β
∑=
s
Scβ
where Sc is the total number of the species among all the forests and
s = number of species in per forest/stand. Concentration of dominance
following Simpson (1949)
2
)(∑=N
niC
where ni is the IVI of the species i and N is the IVI of the community.
Meanwhile the Simpson reciprocal index was calculated for the assessment
of the diversity of each studied forest in Central Himalayas.
Simpson’s Reciprocal Index = 1 / D
where
)1(
)1(
−−
= ∑NN
nnD
N = Total number of species, n= number of species in one community
The concentration of dominance increases with a decrease of diversity.
However, the Simpson reciprocal index an increases with increase in
diversity.
During field visits the local people, mainly knowledgeable elders, were
also asked to provide information pertaining to plant use for a variety of
purposes in their socio-ecological setup.
8
Results and Discussion
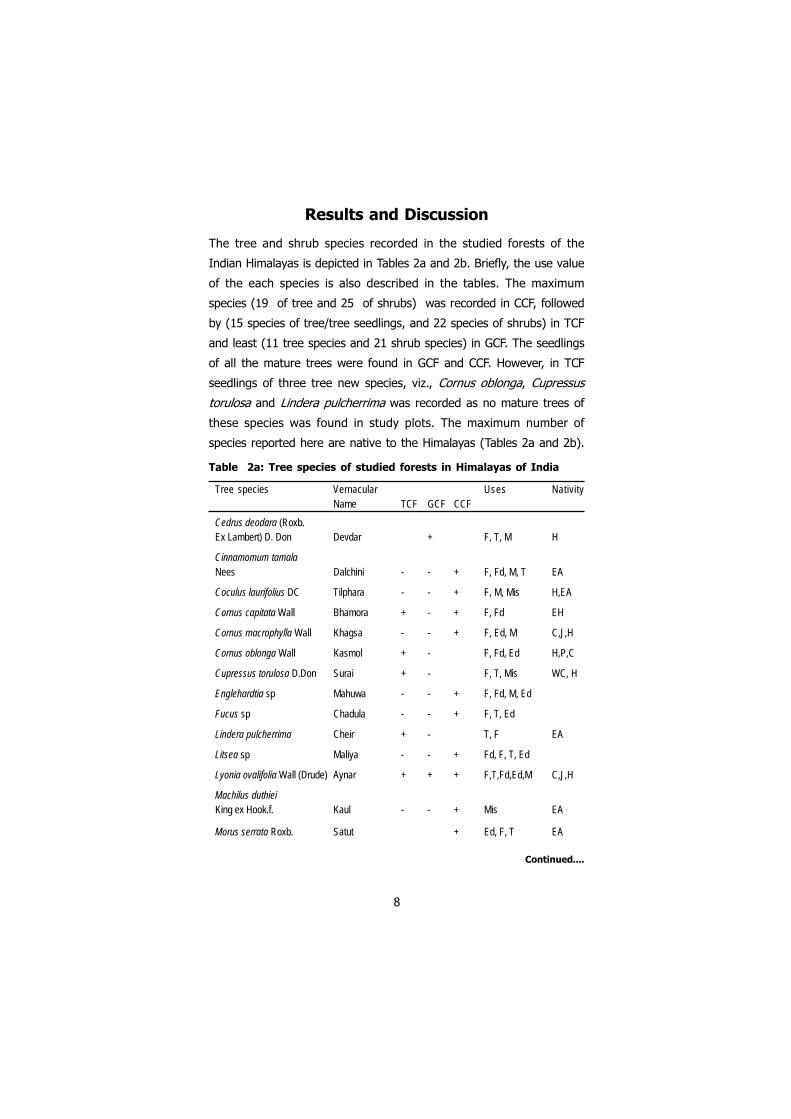
The tree and shrub species recorded in the studied forests of the
Indian Himalayas is depicted in Tables 2a and 2b. Briefly, the use value
of the each species is also described in the tables. The maximum
species (19 of tree and 25 of shrubs) was recorded in CCF, followed
by (15 species of tree/tree seedlings, and 22 species of shrubs) in TCF
and least (11 tree species and 21 shrub species) in GCF. The seedlings
of all the mature trees were found in GCF and CCF. However, in TCF
seedlings of three tree new species, viz., Cornus oblonga, Cupressus
torulosa and Lindera pulcherrima was recorded as no mature trees of
these species was found in study plots. The maximum number of
species reported here are native to the Himalayas (Tables 2a and 2b).
Table 2a: Tree species of studied forests in Himalayas of India
Tree species Vernacular Uses NativityName TCF GCF CCF
Cedrus deodara (Roxb.Ex Lambert) D. Don Devdar + F, T, M H
Cinnamomum tamalaNees Dalchini - - + F, Fd, M, T EA
Coculus laurifolius DC Tilphara - - + F, M, Mis H,EA
Cornus capitata Wall Bhamora + - + F, Fd EH
Cornus macrophylla Wall Khagsa - - + F, Ed, M C,J,H
Cornus oblonga Wall Kasmol + - F, Fd, Ed H,P,C
Cupressus torulosa D.Don Surai + - F, T, Mis WC, H
Englehardtia sp Mahuwa - - + F, Fd, M, Ed
Fucus sp Chadula - - + F, T, Ed
Lindera pulcherrima Cheir + - T, F EA
Litsea sp Maliya - - + Fd, F, T, Ed
Lyonia ovalifolia Wall (Drude) Aynar + + + F,T,Fd,Ed,M C,J,H
Machilus duthieiKing ex Hook.f. Kaul - - + Mis EA
Morus serrata Roxb. Satut + Ed, F, T EA
Continued....
9
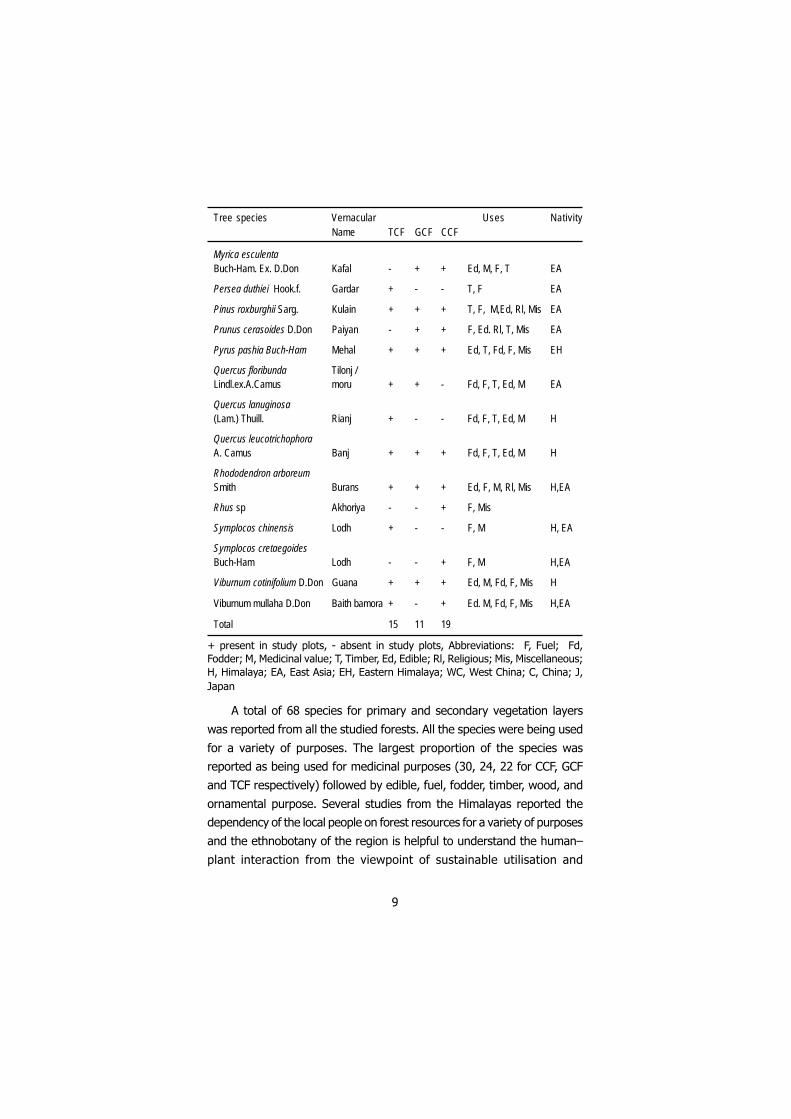
Tree species Vernacular Uses NativityName TCF GCF CCF
Myrica esculentaBuch-Ham. Ex. D.Don Kafal - + + Ed, M, F, T EA
Persea duthiei Hook.f. Gardar + - - T, F EA
Pinus roxburghii Sarg. Kulain + + + T, F, M,Ed, Rl, Mis EA
Prunus cerasoides D.Don Paiyan - + + F, Ed. Rl, T, Mis EA
Pyrus pashia Buch-Ham Mehal + + + Ed, T, Fd, F, Mis EH
Quercus floribunda Tilonj /Lindl.ex.A.Camus moru + + - Fd, F, T, Ed, M EA
Quercus lanuginosa(Lam.) Thuill. Rianj + - - Fd, F, T, Ed, M H
Quercus leucotrichophoraA. Camus Banj + + + Fd, F, T, Ed, M H
Rhododendron arboreumSmith Burans + + + Ed, F, M, Rl, Mis H,EA
Rhus sp Akhoriya - - + F, Mis
Symplocos chinensis Lodh + - - F, M H, EA
Symplocos cretaegoidesBuch-Ham Lodh - - + F, M H,EA
Viburnum cotinifolium D.Don Guana + + + Ed, M, Fd, F, Mis H
Viburnum mullaha D.Don Baith bamora + - + Ed. M, Fd, F, Mis H,EA
Total 15 11 19
+ present in study plots, - absent in study plots, Abbreviations: F, Fuel; Fd,
Fodder; M, Medicinal value; T, Timber, Ed, Edible; Rl, Religious; Mis, Miscellaneous;
H, Himalaya; EA, East Asia; EH, Eastern Himalaya; WC, West China; C, China; J,
Japan
A total of 68 species for primary and secondary vegetation layers
was reported from all the studied forests. All the species were being used
for a variety of purposes. The largest proportion of the species was
reported as being used for medicinal purposes (30, 24, 22 for CCF, GCF
and TCF respectively) followed by edible, fuel, fodder, timber, wood, and
ornamental purpose. Several studies from the Himalayas reported the
dependency of the local people on forest resources for a variety of purposes
and the ethnobotany of the region is helpful to understand the human–
plant interaction from the viewpoint of sustainable utilisation and
10
conservation of the resources ((Maikhuri et al. 1998; Silori and Badola,
2000; Kala 2003).
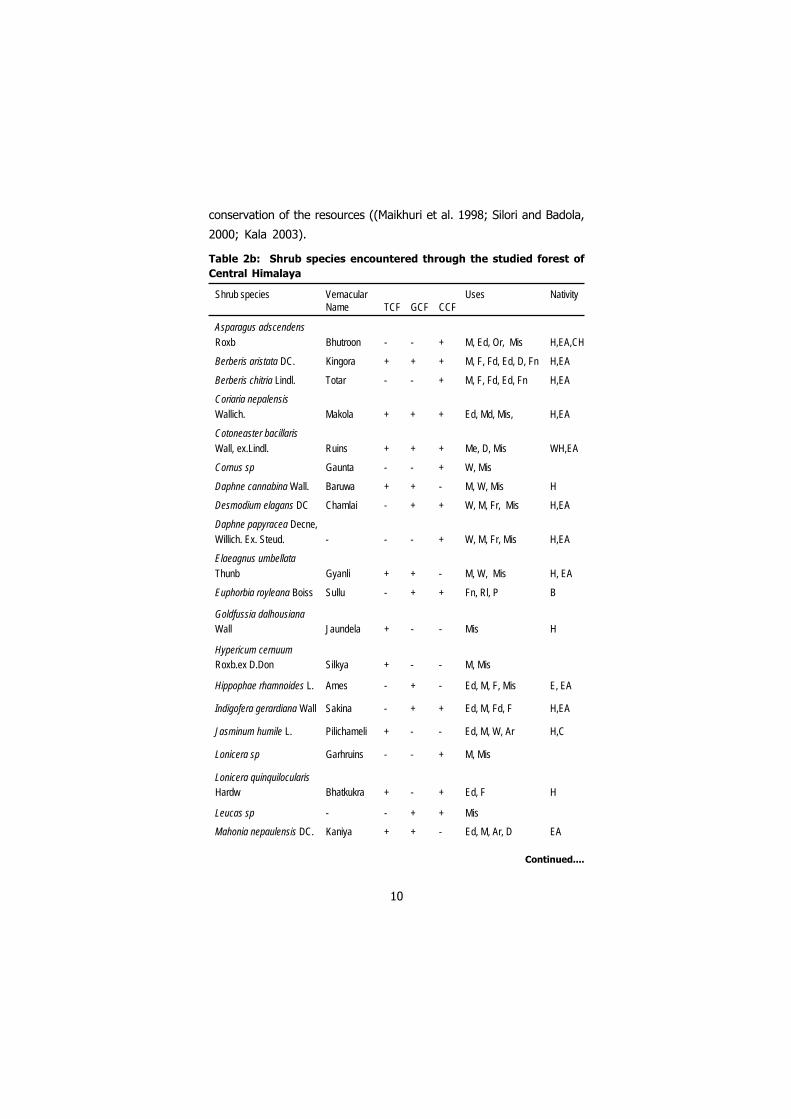
Table 2b: Shrub species encountered through the studied forest of
Central Himalaya
Shrub species Vernacular Uses NativityName TCF GCF CCF
Asparagus adscendensRoxb Bhutroon - - + M, Ed, Or, Mis H,EA,CH
Berberis aristata DC. Kingora + + + M, F, Fd, Ed, D, Fn H,EA
Berberis chitria Lindl. Totar - - + M, F, Fd, Ed, Fn H,EA
Coriaria nepalensisWallich. Makola + + + Ed, Md, Mis, H,EA
Cotoneaster bacillarisWall, ex.Lindl. Ruins + + + Me, D, Mis WH,EA
Cornus sp Gaunta - - + W, Mis
Daphne cannabina Wall. Baruwa + + - M, W, Mis H
Desmodium elagans DC Chamlai - + + W, M, Fr, Mis H,EA
Daphne papyracea Decne,Willich. Ex. Steud. - - - + W, M, Fr, Mis H,EA
Elaeagnus umbellataThunb Gyanli + + - M, W, Mis H, EA
Euphorbia royleana Boiss Sullu - + + Fn, Rl, P B
Goldfussia dalhousianaWall Jaundela + - - Mis H
Hypericum cernuumRoxb.ex D.Don Silkya + - - M, Mis
Hippophae rhamnoides L. Ames - + - Ed, M, F, Mis E, EA
Indigofera gerardiana Wall Sakina - + + Ed, M, Fd, F H,EA
Jasminum humile L. Pilichameli + - - Ed, M, W, Ar H,C
Lonicera sp Garhruins - - + M, Mis
Lonicera quinquilocularisHardw Bhatkukra + - + Ed, F H
Leucas sp - - + + Mis
Mahonia nepaulensis DC. Kaniya + + - Ed, M, Ar, D EA
Continued....
11
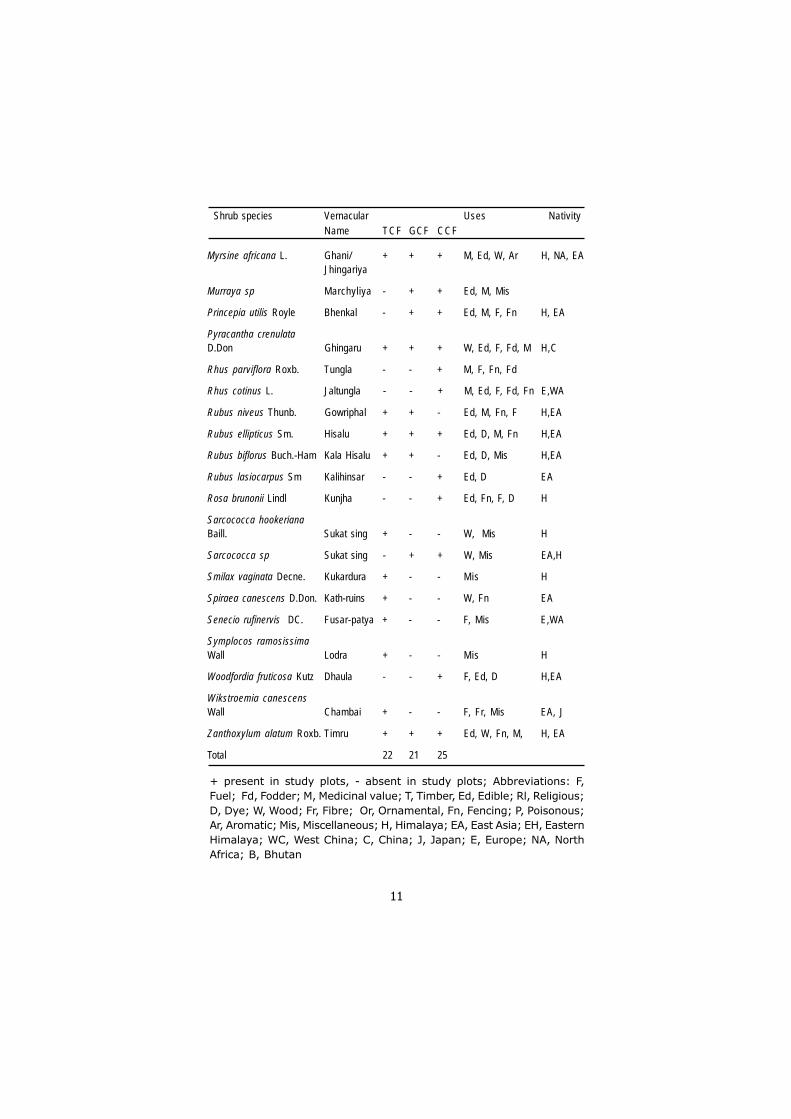
Shrub species Vernacular Uses NativityName TCF GCF CCF
Myrsine africana L. Ghani/ + + + M, Ed, W, Ar H, NA, EAJhingariya
Murraya sp Marchyliya - + + Ed, M, Mis
Princepia utilis Royle Bhenkal - + + Ed, M, F, Fn H, EA
Pyracantha crenulataD.Don Ghingaru + + + W, Ed, F, Fd, M H,C
Rhus parviflora Roxb. Tungla - - + M, F, Fn, Fd
Rhus cotinus L. Jaltungla - - + M, Ed, F, Fd, Fn E,WA
Rubus niveus Thunb. Gowriphal + + - Ed, M, Fn, F H,EA
Rubus ellipticus Sm. Hisalu + + + Ed, D, M, Fn H,EA
Rubus biflorus Buch.-Ham Kala Hisalu + + - Ed, D, Mis H,EA
Rubus lasiocarpus Sm Kalihinsar - - + Ed, D EA
Rosa brunonii Lindl Kunjha - - + Ed, Fn, F, D H
Sarcococca hookerianaBaill. Sukat sing + - - W, Mis H
Sarcococca sp Sukat sing - + + W, Mis EA,H
Smilax vaginata Decne. Kukardura + - - Mis H
Spiraea canescens D.Don. Kath-ruins + - - W, Fn EA
Senecio rufinervis DC. Fusar-patya + - - F, Mis E,WA
Symplocos ramosissimaWall Lodra + - - Mis H
Woodfordia fruticosa Kutz Dhaula - - + F, Ed, D H,EA
Wikstroemia canescensWall Chambai + - - F, Fr, Mis EA, J
Zanthoxylum alatum Roxb. Timru + + + Ed, W, Fn, M, H, EA
Total 22 21 25
+ present in study plots, - absent in study plots; Abbreviations: F,
Fuel; Fd, Fodder; M, Medicinal value; T, Timber, Ed, Edible; Rl, Religious;
D, Dye; W, Wood; Fr, Fibre; Or, Ornamental, Fn, Fencing; P, Poisonous;
Ar, Aromatic; Mis, Miscellaneous; H, Himalaya; EA, East Asia; EH, Eastern
Himalaya; WC, West China; C, China; J, Japan; E, Europe; NA, North
Africa; B, Bhutan

12
The similarity index (community coefficient) of tree and shrub
species is presented in Table 3. The similarity index illustrates significant
differences in species composition between forests (Komo et al. 2002).
The highest similarity index value (0.61) was recorded between TCF
and GCF followed by GCF and CCF. Low (0.24) similarity noticed between
TCF and CCF. The analysis of the similarity indices (Table 3) showed
that the species composition differed between GCF and CCF of the
region with comparatively few common species. However, the TCF
and GCF seemed to be more similar than the other combination and,
relatively more common species were recorded in these forests.
Table 3: Similarity index (community coefficient) of species in studiedforests
Forests TCF GCF CCF
TCF 1 0.61 0.24
GCF 1 0.45
CCF 1
Tree/ tree sapling
Data on density, basal cover (BC)/ m2 and importance value index
(IVI) for tree, tree seedlings and shrubs are shown in Tables 4a, 4b and
4c respectively. The top story vegetation in TCF forest was dominated by
Quercus leucotrichohora (550 individual per ha) followed by Q. floribunda,
Rhododendron arboreum, Viburnum cotinifolium (237, 227 and 150
individual per ha respectively). Least individual (20/ha) of Q. lanuginosa
and P. pashia was recorded from this forest stand (Table 4a). The total
basal cover (m2/ha) at tree layer for TCF was recorded (28.32 m2/ha) for
Q. leucotrichophora followed by R. arboretum (10.478 m2/ha), Q.
floribunda (7.311 m2/ha), L. ovalifolia (5.82 m2/ha), Q. lanuginosa (4.945
m2/ha) and least basal cover was recorded for V. mullah (0.1439 m2/ha).
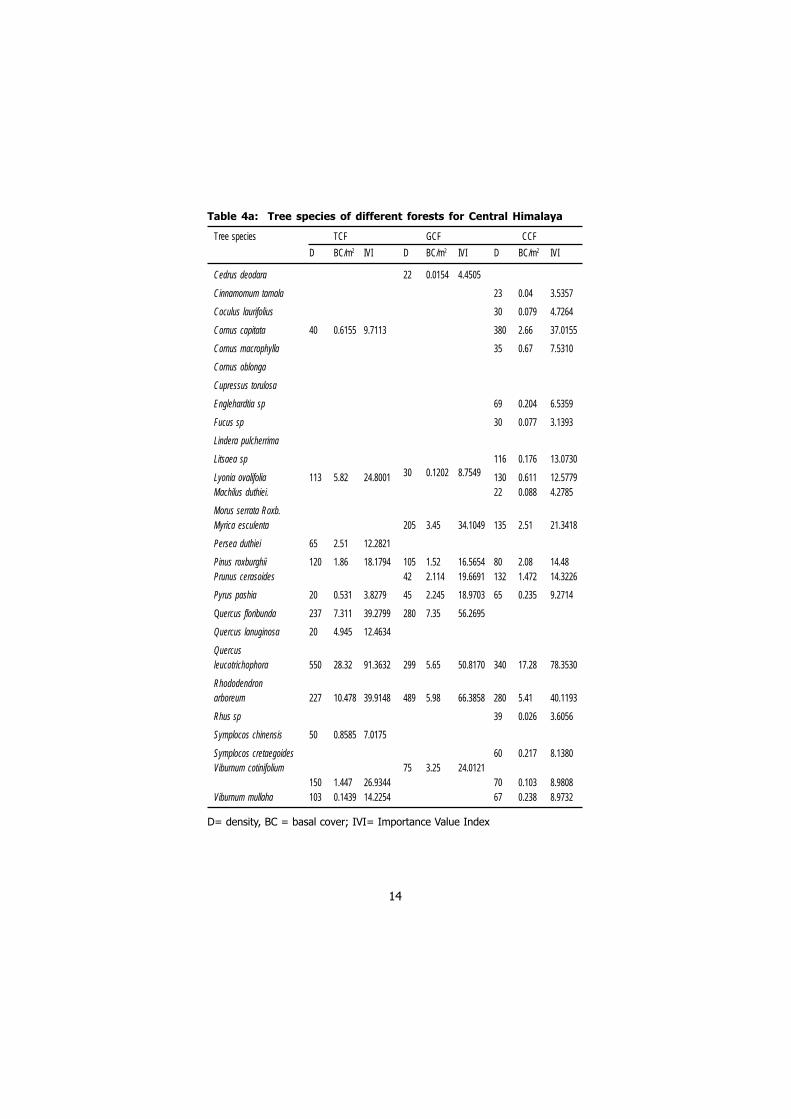
CCF was found dominated by C. capitata (380 individual per ha) followed
by Quercus leucotricophora (340 individual per ha), Rhododendron
13
arboreum (280 individual per ha), Myrica esculenta (135 individual per
ha). Minimum number of individuals in this forest was recorded for M.
duthiei (22 individual per ha). The basal cover (m2/ha) at tree layer
for CCF was recorded highest for Q. leucotrichophora (17.28), followed
by Rhododendron arboretum (5.41), C capitata (2.66) and least basal
cover was recorded for Rhus species (0.026). Regarding density, GCF
was dominated by Rhododendron arboreum (489 individual per ha)
followed by Q. leucotrichophora (299) Q. floribunda (280), Myrica
esculanta (205) and P. roxburghii (105). Minimum number of individuals
(22) in this forest was for C. deodara (Table 4a). Basal cover (m2/ha)
at tree layer was recorded highest for Q. floribunda (7.35) followed by
R. arboretum (5.98), Q. leucotrichophora (5.65) and least for C.
deodara (0.0151). In mixed oak forests the density value for different
species of Quercus ranged between 30 and 850 individual per ha with
basal cover of 3.5 to 54.8 m2/ha (Ralhan et al. 1985). The density
value for Myrica esculenta was reported between 18 and 348 and for
Rhododendron arboretum between 128 and 333 individual per ha in
different forest types of the Central Himalayas (Ralhan et al. 1985;
Saxena and Singh 1984; Maikhuri et al. 2000; Rawal et al. 2003). The
density value for other species such as C. oblonga, L. ovalifolia, P.
pashia, V. cotinifolium, C. deodara, C. torulosa has been reported in a
range between 3 and 393 individual per ha in different forest stands
of Central Himalayas (Saxena and Singh 1984; Ralhan et al. 1985;
Rawat and Singh 1988).
14
Table 4a: Tree species of different forests for Central Himalaya
Tree species TCF GCF CCF
D BC/m2 IVI D BC/m2 IVI D BC/m2 IVI
Cedrus deodara 22 0.0154 4.4505
Cinnamomum tamala 23 0.04 3.5357
Coculus laurifolius 30 0.079 4.7264
Cornus capitata 40 0.6155 9.7113 380 2.66 37.0155
Cornus macrophylla 35 0.67 7.5310
Cornus oblonga
Cupressus torulosa
Englehardtia sp 69 0.204 6.5359
Fucus sp 30 0.077 3.1393
Lindera pulcherrima
Litsaea sp 116 0.176 13.0730
Lyonia ovalifolia 113 5.82 24.8001 30 0.1202 8.7549 130 0.611 12.5779Machilus duthiei. 22 0.088 4.2785
Morus serrata Roxb. Myrica esculenta 205 3.45 34.1049 135 2.51 21.3418
Persea duthiei 65 2.51 12.2821
Pinus roxburghii 120 1.86 18.1794 105 1.52 16.5654 80 2.08 14.48Prunus cerasoides 42 2.114 19.6691 132 1.472 14.3226
Pyrus pashia 20 0.531 3.8279 45 2.245 18.9703 65 0.235 9.2714
Quercus floribunda 237 7.311 39.2799 280 7.35 56.2695
Quercus lanuginosa 20 4.945 12.4634
Quercusleucotrichophora 550 28.32 91.3632 299 5.65 50.8170 340 17.28 78.3530
Rhododendronarboreum 227 10.478 39.9148 489 5.98 66.3858 280 5.41 40.1193
Rhus sp 39 0.026 3.6056
Symplocos chinensis 50 0.8585 7.0175
Symplocos cretaegoides 60 0.217 8.1380Viburnum cotinifolium 75 3.25 24.0121
150 1.447 26.9344 70 0.103 8.9808Viburnum mullaha 103 0.1439 14.2254 67 0.238 8.9732
D= density, BC = basal cover; IVI= Importance Value Index

15
Table 4b: Tree seedling of different forests for Central Himalaya
Tree seedling TCF GCF CCF D BC/m2 IVI D BC/m2 IVI D BC/m2 IVI
Cedrus deodara 205 0.0135 23.1585
Cinnamomum tamala 50 0.038 10.7331
Coculus laurifolius 57 0.0064 6.2373
Cornus capitata 360 0.0667 25.7448 75 0.0115 8.6760
Cornus macrophylla 100 0.0296 13.3998
Cornus oblonga 225 0.048 19.2012
Cupressus torulosa 5 0.0019 1.7536
Englehardtia sp 65 0.0088 8.1784
Fucus sp 44 0.0924 14.4583
Lindera pulcherrima 324 0.038 21.5739
Litsaea sp 124 0.0084 11.1781
Lyonia ovalifolia 287 0.071 26.1636 215 0.0321 26.0025 146 0.0532 16.4381
Machilus duthiei 66 0.0085 6.6548
Morus serrata.
Myrica esculenta 208 0.0548 30.1234 246 0.285 46.2789
Persea duthiei 311 0.0652 25.5727
Pinus roxburghii 151 0.09 19.9405 250 0.0101 24.2590 67 0.0348 11.2642
Prunus cerasoides 387 0.0478 34.0271 151 0.0268 12.8246
Pyrus pashia 184 0.0155 14.5362 115 0.0032 11.78 66 0.0087 8.2250
Quercus floribunda 525 0.1246 41.8876 232 0.089 40.3546
Quercus lanuginosa 80 0.0085 6.6988
Quercus
leucotrichophora 704 0.0713 35.1993 247 0.074 41.6771 814 0.235 66.9836
Rhododendronarboreum 247 0.0887 27.3876 287 0.054 38.3851 250 0.075 22.2178
Rhus sp 44 0.020 7.4548
Symplocos chinensis 80 0.0353 11.7997
Symplocos cretaegoides 38 0.0027 5.6763
Viburnum cotinifolium 167 0.031 14.0436 204 0.039 30.2421 96 0.012 10.7929
Viburnum mullaha 48 0.01 8.4961 154 0.0148 12.3273
16
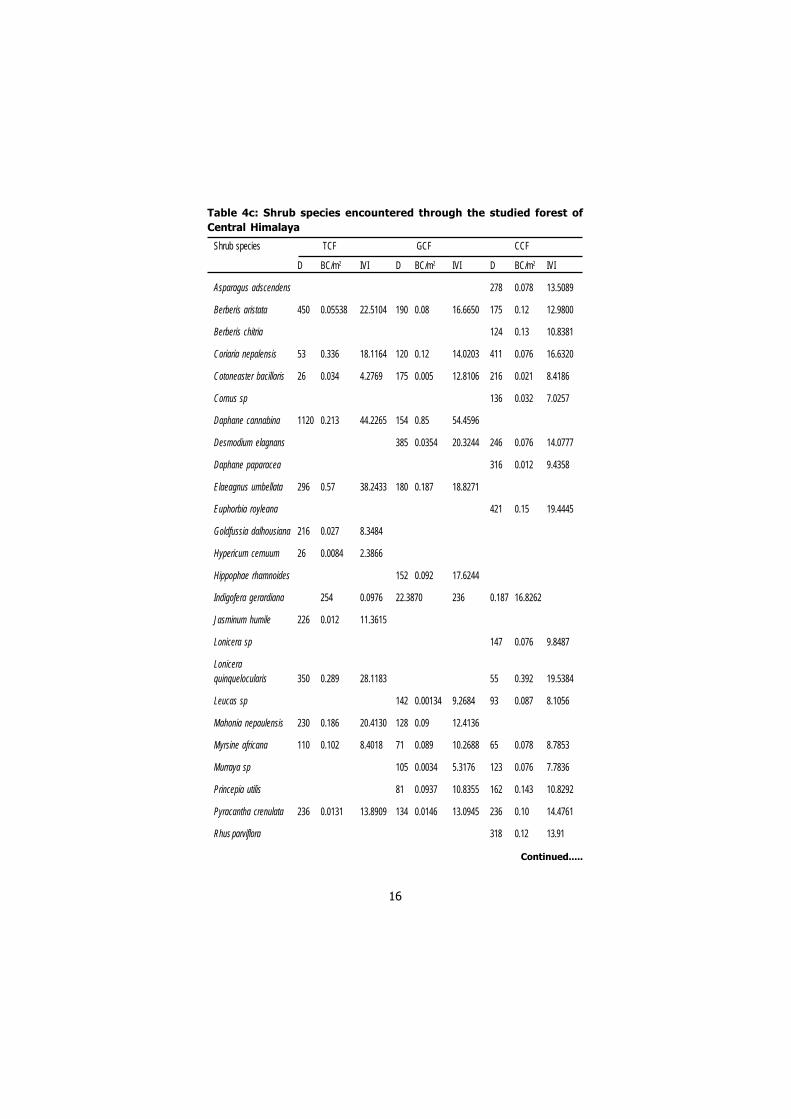
Table 4c: Shrub species encountered through the studied forest of
Central Himalaya
Shrub species TCF GCF CCF
D BC/m2 IVI D BC/m2 IVI D BC/m2 IVI
Asparagus adscendens 278 0.078 13.5089
Berberis aristata 450 0.05538 22.5104 190 0.08 16.6650 175 0.12 12.9800
Berberis chitria 124 0.13 10.8381
Coriaria nepalensis 53 0.336 18.1164 120 0.12 14.0203 411 0.076 16.6320
Cotoneaster bacillaris 26 0.034 4.2769 175 0.005 12.8106 216 0.021 8.4186
Cornus sp 136 0.032 7.0257
Daphane cannabina 1120 0.213 44.2265 154 0.85 54.4596
Desmodium elagnans 385 0.0354 20.3244 246 0.076 14.0777
Daphane paparacea 316 0.012 9.4358
Elaeagnus umbellata 296 0.57 38.2433 180 0.187 18.8271
Euphorbia royleana 421 0.15 19.4445
Goldfussia dalhousiana 216 0.027 8.3484
Hypericum cernuum 26 0.0084 2.3866
Hippophae rhamnoides 152 0.092 17.6244
Indigofera gerardiana 254 0.0976 22.3870 236 0.187 16.8262
Jasminum humile 226 0.012 11.3615
Lonicera sp 147 0.076 9.8487
Loniceraquinquelocularis 350 0.289 28.1183 55 0.392 19.5384
Leucas sp 142 0.00134 9.2684 93 0.087 8.1056
Mahonia nepaulensis 230 0.186 20.4130 128 0.09 12.4136
Myrsine africana 110 0.102 8.4018 71 0.089 10.2688 65 0.078 8.7853
Murraya sp 105 0.0034 5.3176 123 0.076 7.7836
Princepia utilis 81 0.0937 10.8355 162 0.143 10.8292
Pyracantha crenulata 236 0.0131 13.8909 134 0.0146 13.0945 236 0.10 14.4761
Rhus parviflora 318 0.12 13.91
Continued.....
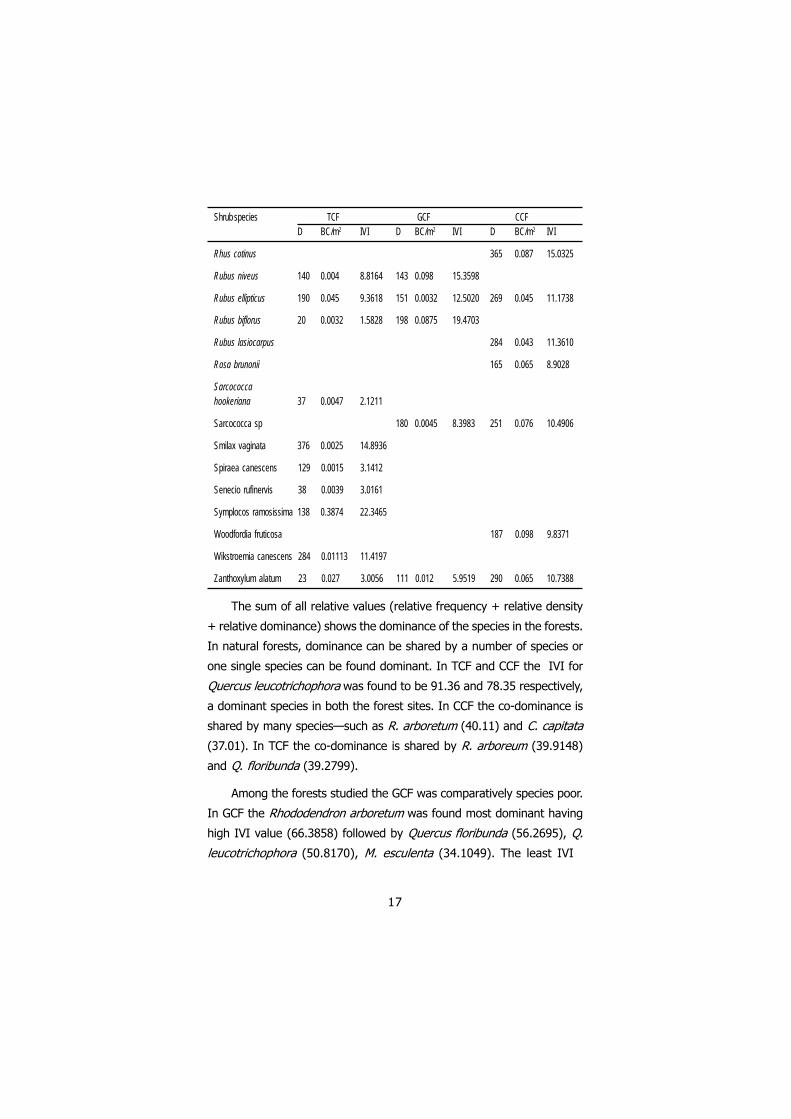
17
Shrub species TCF GCF CCF D BC/m2 IVI D BC/m2 IVI D BC/m2 IVI
Rhus cotinus 365 0.087 15.0325
Rubus niveus 140 0.004 8.8164 143 0.098 15.3598
Rubus ellipticus 190 0.045 9.3618 151 0.0032 12.5020 269 0.045 11.1738
Rubus biflorus 20 0.0032 1.5828 198 0.0875 19.4703
Rubus lasiocarpus 284 0.043 11.3610
Rosa brunonii 165 0.065 8.9028
Sarcococcahookeriana 37 0.0047 2.1211
Sarcococca sp 180 0.0045 8.3983 251 0.076 10.4906
Smilax vaginata 376 0.0025 14.8936
Spiraea canescens 129 0.0015 3.1412
Senecio rufinervis 38 0.0039 3.0161
Symplocos ramosissima 138 0.3874 22.3465
Woodfordia fruticosa 187 0.098 9.8371
Wikstroemia canescens 284 0.01113 11.4197
Zanthoxylum alatum 23 0.027 3.0056 111 0.012 5.9519 290 0.065 10.7388
The sum of all relative values (relative frequency + relative density
+ relative dominance) shows the dominance of the species in the forests.
In natural forests, dominance can be shared by a number of species or
one single species can be found dominant. In TCF and CCF the IVI for
Quercus leucotrichophora was found to be 91.36 and 78.35 respectively,
a dominant species in both the forest sites. In CCF the co-dominance is
shared by many species—such as R. arboretum (40.11) and C. capitata
(37.01). In TCF the co-dominance is shared by R. arboreum (39.9148)
and Q. floribunda (39.2799).
Among the forests studied the GCF was comparatively species poor.
In GCF the Rhododendron arboretum was found most dominant having
high IVI value (66.3858) followed by Quercus floribunda (56.2695), Q.
leucotrichophora (50.8170), M. esculenta (34.1049). The least IVI

value was recorded for C. deodara (4.4505). It seems that the pressure
for lopping Quercus species is high as this multipurpose species is
always in demand for fodder and good quality fuel in the region
(Bhandari et al. 1997). In all three forest studied of the Central
Himalayas, the tree density was maximum in CCF (2103) followed by
TCF (1695) and least density of standing tree species (1592) was
recorded from the GCF (Figure 2). The basal cover (m2 ha1) for trees
stratum for all the studied forests ranged from 31 to 65. The maximum
was recorded for TCF (64.8399 m2 ha1) followed by CCF (34.176 m2
ha1) and the least was for GCF (31.6934 m2/ha1). Total basal area and
density of tree layer was reported in the range of 27–191.5 m2/ha and
350 to 2070 plants per ha, respectively, for various broad-leaved,
traditionally conserved (sacred grove) and protected (Nanda Devi
Biosphere Reserve) forests of the Central Himalayas (Bhandari and Tiwari
1997; Maikhuri et al. 2000; Saxena and Singh 1982; Sinha and Maikhuri
1998). Within the present study the values for individual per ha are
slightly higher than those previously reported because here tree saplings
and tree species were grouped together.
0
1000
2000
3000
4000
5000
6000
7000
TCFTree
GCFTree
CCFTree
TCFTree
seedling
GCFTree
seedling
CCFTree
seedling
TCFShrub
GCFShrub
CCFShrub
Den
sity
/ha
0
10
20
30
40
50
60
70
80
Bas
al c
over
(M2/
ha)
Density Basal cover
Figure 2: Density and basal cover of different vegetation strata inthe study region
18
High basal cover and low density in TCF in comparison to CCF
suggests that few species have attained maturity in this forest. Higher
values of density and lower values of basal cover suggest that the CCF
is younger and newly conserved. High tree density suggests that the
diversity and luxuriance of this community forest may be maintained in
a healthy state if the extent of biotic pressure is maintained at an
optimum limit. Low density and basal cover (m2/ha) of GCF indicates
that the pressure on such forests in the Himalayas is comparatively
higher than that of TCF and CCF. Studies have reported that strict
protection of natural ecosystems and overexploitation lead to changes
in vegetation dynamics (structure, species composition and diversity)
of the area, (Vega-Garcia and Chuvieco 2006; Nautiyal and Kaechele
2007) besides influencing the productivity and quality of forest
resources (Bhandari 2003).
Based on our empirical study the results show that the TCF of the
Central Himalayas was once dominated completely by Q. leucotricophora,
which is a late successional and climax species. Rules based on religious/
traditional beliefs kept such forests unmolested. Therefore, few
successional species attained the status of the climax species in the forest.
In GCF, the analysis indicated (moderate density, low diversity and less
basal cover) that pressure on this kind of forest in the Central Himalayas
is high in comparison with other forests (CCF and TCF). The high pressure
to fulfill the demands of the people, coupled with other factors—such as
not considering people’s efforts in management of such forests—are the
reasons for poor management of such forests (Maikhuri et al. 2000). In
developing countries the governments’ accession of a large tract in diverse
and rich landscape to achieve the biodiversity conservation goal
(Colchester 1997) accelerates conflicts between people and
conservation policies and leads to further exploitation of the resources,
rather than the sustainable utilisation (Nautiyal and Kaechele, 2007).
19
Tree seedlings
The number (density) of seedlings of any species can be considered as
the regeneration potential of that species in the forest. High tree
seedling density (individual/ha) was recorded maximum for TCF, followed
by CCF and least for GCF. From the density values (Table 4b), the
results showed that the regeneration of Q. leucotrichophora is low
(247 individual per ha) in GCF in comparison to CCF (814 individual/ha)
and TCF (704 individual per ha). The density of Quercus spp was high
(1309 individual per ha) in TCF, but also the presence of many other
species at seedling strata was found in TCF. The presence of Pinus
roxburghii is an indication of high pressure on Quercus spp., in such
kinds of unscathed ecosystems and the new arrival of three species
was noticed in this grove (Table 4b). Anthropogenic pressure was
found to be responsible for co-dominance of Pinus roxburghii in Quercus
(oak) dominated forest, which is emphasised as a keystone species in
the moist temperate region of the Himalayas (Bhandari 2003). This is
because the regeneration potential of Pinus roxburghii is higher than
that of Quercus species (Bhandari et al. 1997). In the GCF, high
regeneration potential was recorded for Prunus cerasoides, followed
by Myrica esculenta, Rhododendron arboreum, Lyonia ovalifolia (Table
4b). But, comparatively, the regeneration potential of Pinus roxburghii
was very high in GCF (250 individual per ha). The Quercus (oak) a
multipurpose species and having better fodder and fuel quality, was
coming under threat in the central Himalayan forests due to high human
pressure (Saxena et al. 1978; Tiwari and Singh 1982; Bankoti et al.
1986). However, few pockets, when disturbed by various anthropogenic
factors (i.e., lopping, cutting burning etc.) changed the microclimatic
conditions and this provides appropriate conditions for the chir-pine (P.
roxburghii) - an early successional, low nutrient demander, light
demanding and shade intolerant species- to invade, thereby posing a
serious threat to the ecological balance of this region (Saxena et al.
1978; Tiwari and Singh 1982; Singh et al. 1984; Bankoti et al. 1986).
Density (individual per ha) at seedling strata was found maximum for
20

TCF (3698 individual per ha) followed by CCF (2609 individual per ha)
and least regeneration (2350 individual per ha) of tree species was
recorded in the GCF (Figure 2). The regeneration potential of tree
species in forests depends on the population structure, influenced by
the production and germination of seeds, establishment of seedling
and saplings in the forests (Rao 1988). In terms of regeneration
potential, the TCF and CCF showed good regeneration potential. In
general, both the anthropogenic factors (Khan and Tripathi 1989) and
natural phenomenon (Welden et al. 1991) affect the regeneration of
species in a forest’s ecosystem. Complete absence or low density of
seedlings of tree species in a forest indicates poor regeneration, while
good occurrence of seedlings is an indicator of successful regeneration
of the species at primary vegetation layer (Khumbongmayum et al.,
2006; Saxena and Singh 1984).
Shrubs
Among the studied forests of the Central Himalayas, CCF showed good
species richness of the second vegetation layer (shrub), followed by
TCF and GCF. In CCF, density at shrub layer was highest for E. royleana
(having 421 individual/ha) followed by C. nepalensis (411 individual/ha)
and R. cotinus (365 individual/ha). However, the IVI was maximum for
L. quinquelocularis (19.5384) subsequently for E. royleana (19.4445)
and C. nepalensis (16.6320). The density of D. cannabina was highest
in TCF (1120 individual/ha) and this species was also dominant in TCF
(IVI 44.2265). Berberis aristata was second in density (450 individual/
ha) in TCF, followed by S. vaginata (376 individual/ha), L. quinquelocularis
(350) and E. umbellata (296). The co-dominance at shrub layer in TCF
was shared by E. umbellata (IVI 38.2433), L. quinquelocularis (IVI
28.1183), B. aristata (IVI 22.5104) and S. ramosissima (IVI 22.3465).
In GCF the density was highest for D. elagnans (385 individual/ha)
followed by I. gerardiana (254 individual/ha), R. biflorus (198 individual/
ha) and least individual (71) of M. africana was recorded at shrub layer
in GCF. The D. cannabina was dominant (IVI 54.4596) in this forest
stand at shrub layer.
21
The density (ha) and basal cover (m2 /ha ) at shrub layer was
recorded maximum for CCF (5569 individual/ ha and basal cover 2.433
m2 /ha), followed by TCF (4714 individual/ ha and basal cover 2.3362
m2 /ha) and least (3054 individual/ ha and basal cover 1.9642 m2 /ha)
was reported for GCF (Figure 2). The shrub density of TCF and GCF
was comparable to other broad leaved forests of the Central Himalayas
(Bhandari and Tiwari 1997; Bhandari et al. 1997). Among the forests
studied, comparatively high density of shrubs was found in CCF. The
high basal area and large canopy cover of the primary vegetation layer
in TCF do not allow much regeneration and growth of secondary
vegetation beneath the tree cover as in CCF. In CCF, high species
richness in shrub layer may be due to the relatively less developed
canopy in these young forests where sufficient sunlight reaching the
ground results in high regeneration of shrub species. However, it is
assumed that high anthropogenic pressure is responsible for the lowest
density and diversity of secondary vegetation layers in GCF (Figure 2).
The distribution pattern indicated that forest species are distributed
contagiously (clumped) in TCF (1.08) and GCF (1.20) followed by random
distribution in CCF (2.69). The distribution pattern of trees did not
correspond with the distribution pattern of shrubs. Similar findings have
been reported for the Central Himalayan forests by different workers
(Bhandari and Tiwari 1997; Saxena and Singh 1982). Clumped
(contagious) distribution in natural vegetation was reported by Kershaw
(1973), Singh and Yadava (1974), and Singh and Singh (1991). Odum
(1971) described that in natural conditions, contagious (clumped)
distribution was the most common type of distribution that is caused by
small but significant variations in the environmental conditions. The
preponderance of random distribution in tree and seedling layers, as
compared to shrub layers, reflects the dimension of biotic interferences
in the forest.
22

23
Diversity of the studied forests
in the Central Himalayas
Diversity parameters are summarized in Table 5. Diversity is a combination
of two factors, the number of species present, referred to as species
richness and the distribution of individuals among the species, referred
to as evenness or equitability. Single species populations are defined as
having a diversity of zero, regardless of the index used. Species diversity
therefore, refers to the variations that exist among the different forms.
Among the studied forests the Shannon–Wiener index was recorded
highest for CCF followed by TCF and least for GCF. Previous studies report
that the moderate amount of disturbance in forest ecosystems promotes
species diversity (Singh et al. 1997; Thadani and Ashton 1995). However,
overexploitation and strict protection also change vegetation dynamics,
but in natural conditions it always gives negative implications (Nautiyal
and Kaechele 2007) as homogenisation generally has a negative impact
on the landscape (Vega-Garcia and Chuvieco 2006).
Table 5: Species diversity (
) for different vegetation layer and
Beta Diversity (βββββ) for all the studied forests of Central Himalaya
Parameters TCF CCF GCF
Shannon-Wiener Index ( )
Tree layer 2.46 2.72 2.21
Tree seedling layer 2.839 3.24 2.32
Shrub layer 2.651 3..01 2.02
Beta Diversity (β)
Tree layer 1.82 2.21 1.79
Tree seedling layer 1.20 1.38 1.03
Shrub layer 1.25 1.33 1.05
Concentration of dominance (cd)
Tree layer 0.1518 0.1155 0.1474
Tree seedling layer 0.1003 0.090 0.1067
Shrub layer 0.0770 0.0441 0.0615
Simpson reciprocal index For whole forest 2.92 3.06 2.78
−H

24
The value of beta diversity was recorded highest for CCF with
2.21 tree, 1.38 seedling and 1.33 shrub layer. These values for CCF
were found to be comparable with the other broad leaved forests of
the region (Bhandari et al. 1997; Ralhan et al. 1982) however, lower
for TCF and GCF. The concentration of dominance (cd) showed low
values for tree, tree seedling and shrub layers for CCF, followed by GCF
and TCF. This value decreases with increasing diversity. A higher con-
centration of dominance shows the lower species diversity in the for-
est. It simply means that CCF is species rich at the top vegetation
layer and second layer (shrub). The concentration of dominance and
diversity are indirectly proportional to each other (Singh and Singh
1991). The Simpson reciprocal index was used to evaluate the diver-
sity of all three studied forest of the Central Himalayas and found that
CCF forest is highly diverse and rich (3.06) in comparison to TCF (2.92)
and GCF (2.78). The comparative study done here was to evaluate
the hypothesis that how every conservation approach differ from each
other in regard to diversity and structure of the forests. It was found
that the conservation in CCF to be more positive and the analysis
done here would be helpful in assessing the potential value of the
effective and fruitful conservation program/regimes in the mountains
of the Indian Himalayan region.

Conclusion
In general, the quality of all the forests studied is comparable with
other good forests of the region. The current study supported the
community conservation approach that positive human influences have
positive external effects on the structure of the forest conserved
through community efforts. The CCF was species-rich having high
density and diversity of species. However, the TCF was also species-
rich but not as significant as the CCF. The high basal cover of TCF
indicates that this forest is preserved to last many generations. Data
based on empirical studies shows that GCF is comparatively poor when
comparing the indicators taken in this study for evaluation of forest
quality. The field study concludes that the theory and practical
applications for CCF gives positive results and support
The empirical study could explain, generally, the present status of
the forests, but not the developmental phases under the different
conservation regimes. The scientific question arises regarding the nature
of the developmental phases of the forests under different conservation
regimes? What is the path dependence of the current situation of these
forests? The present situation is result of long-term management or natural
phenomenon in varied topographic or environmental conditions? To
answer these questions there is a need to understand the developmental
pattern of the forests using a spatio-temporal framework. In this context,
remote sensing analysis with visual observations, would be a helpful tool
to provide accurate information on the spatial extent of vegetation cover
in multi-temporal dimensions.
Acknowledgements
The author extends sincere thanks to the Director, G.B. Pant Institute of
Himalayan Environment and Development, Kosi-Katarmal, Almora and
the Director, Institute for Social and Economic Change, Bangalore for the
facilities and encouragement. A special thanks to the reviewers for
comments and suggestions on earlier draft.
25

26
References
Bandyopadhyay, S, H.B. Soumya, P.J. Shah, 2005. Community Stewardship and
Management. Beyond NEP 2004: Institutions, Incentives and Communities.
Centre for Civil Society, New Delhi, India. URL: http://www.ccsindia.org/
ccsindia/pdf/forests_briefing_paper.pdf
Bankoti, T.N.S., U. Melkania, A.K. Saxena, 1986. Vegetation analysis along an
altitudinal gradient in Kumaun Himalaya. Indian Journal of Ecology., 13:211-
221.
Berkes F. 2004. Rethinking community-based conservation. Conserv Biol 18:621-
630.
Bhandari, B.S. 2003. Blue pine (Pinus wallichiana) forest stands of Garhwal
Himalaya: Composition, population structure and diversity. J Trop For Sci 15:
26-36.
Bhandari, B.S., J.P. Mehta, B.P. Nautiyal, S.C. Tiwari, 1997. Structure of Chir Pine
(Pinus roxburghii Sarg.) Community Along an Altitudinal Gradient in Garhwal
Himalaya. Int J Ecol Environ Sci 23 : .67-74.
Bhandari, B.S., S.C. Tiwari, 1997. Dominance and diversity along an altitudinal
gradient in a montane forest of Garhwal Himalaya. Proceedings of Indian
National Science Academy, B 64:437-446.
Brabyn, L. 2005 Solutions for characterising natural landscapes in New Zealand
using geographical information systems. J Environ Mana 76: 23-34.
Colchester, M. 1997. Salvaging nature: Indigenous people and protected areas.
In: Chimire KB, Pimbert MP (eds.) Social change and conservation. Earthscan,
London, 97–130.
Cottam, G., J. T. Curtis, 1956. The Use of Distance Measures in Phytosociological
Sampling. Ecology 37: 451-460.
Guha, R. 1998. Detrich Brandis and Indian Forestry,” Village Voices, Forest Choices,
Mark Poffenberger and Betsy McGean.
IUCN. 2002. Parks. Vol 12, no. 2, Local Communities and Protected Areas. Protected
Area Programme of the World Conservation Union.
Ives, J.D., B. Messerli, 1989. The Himalayan Dilemma: Reconciling Development
and Conservation. Routledge, London.

Jaccard, P. 1912. The distribution of the flora of the alpine zone. New Phytol. 11:
48-50.
Kala, C.P. 2003. Commercial exploitation and conservation status of high value
medicinal plants across the boarderline of India and Nepal in Pithoragarh.
The Ind Fore 129: 80-84.
Kamo, K, T. Vacharangkura, S. Tiyanon, C. Viriyabuncha, s. Nimpila, B. Doangsrisen,
2002. Plant Species Diversity in Tropical Planted Forests and Implication for
Restoration of Forest Ecosystems in Sakaerat, Northeastern Thailand. Jap
Agric Res Quart 36: 111-118.
Kershaw, K.A., 1973. Quantitative and Dynamic Plant Ecology. (London: Edward
Arnold Ltd.) 308pp.
Khan, M.L., R. S. Tripathi, 1989. Effects of stump diameter, stump height and
sprout density of the sprout growth of four tree species in burnt and unburnt
forest plots. Acta Oecol 10: 303-316.
Khumbongmayum, A.D., M. Khan, R. S. Tripathi, 2006. Biodiversity conservation
in sacred groves of Manipur, northeast India: population structure and re-
generation status of woody species. Biodivers Conserv 15: 2439-2456.
Kothari, A., N. Pathak, R.V. Anuradha, B. Taneja, (eds). 1998. Communities and
Conservation: Natural resource management in South and Central Asia, Sage
Publications, New Delhi.
Liu, J. 2001. Integrating ecology with human demography, behaviour, and
socioeconomics: Needs and approaches. Ecol Modell 140: 1-8.
Lu, D., P. Mausel, E. Brondizio, E. Moran, 2004. Relationship between forest stand
parameters and Landsat TM spectral responses in the Brazilian Amazon Basin.
For Ecol Mana 198:149-167.
Maikhuri, R.K., S. Nautiyal, K.S. Rao, K.G. Saxena, 1998. Role of Medicinal Plants
in Traditional Health Care System : a case study from Nanda Devi Biosphere
Reserve. Curr Scie 75: 152-157.
Maikhuri, R.K., S. Nautiyal, K.S. Rao, K. Chandrasekhar, R. Gavali, K.G. Saxena,
2000. Analysis and resolution of protected area – people conflicts in Nanda
Devi Biosphere Reserve, India. Environ Conser 27: 43-53.
Nautiyal, S., H. Kaechele, 2007. Adverse impact of pasture abandonment in
Himalayas of India: Testing efficiency of a natural resource management
plan (NRMP). Environmental Impact Assessment Review, 27, 109-125.
27
Nayak, S.N.V., H.R. Swamy, B.C. Nagaraj, U. Rao, U. M. Chandrashekara,
2000. Farmers’ attitude towards sustainable management of Soppina Betta
forests in Sringeri area of the Western Ghats, South India. For Ecol and
Mana 132:223-241.
Negi, C.S. 2005. Socio-cultural and ethnobotanical value of a sacred forest, Thal
Ke Dhar, central Himalaya. Ind J Trad Knowled 4: 190-198.
Negi, C.S., S. Nautiyal, 2005. Phyto-Sociological studies of a Traditional Reserve
Forest – Thal Ke Dhar Pithoragarh, Central Himalayas (India). Ind Fores 131:
519-534.
Odum, E.P. 1971. Fundamentals of Ecology. IIIrd Edition W.B. Saunders Co.,
Philadelphia, U.S.A. 574pp.
Ralhan, P.K., R.K. Khanna, S. P. Singh, J.S. Singh, 1985. Phenological characteristics
of the tree layer of Kumaon Himalayan forests. Vegetatio 60: 91-101.
Ralhan, P.K., A. K. Saxena, J.S. Singh, 1982. Analysis of forest vegetation at and
around Nainital in Kumaun Himalaya. Proc. Indian National Science Academy
B 48:121-137.
Ramakrishnan, P.S., K.G. Saxena, U.M. Chandrashekara, (eds). 1998. Conserving
the Sacred for Biodiversity Management.Oxford & IBH, New Delhi/Calcutta,
pp.480.
Ramanujam, M.P., D. Kadamban, 2001. Plant biodiversity of two tropical dry ever-
green forests in the Pondicherry region of South India and the role of belief
systems in their conservation. Biodivers Conserv 10:1203-1217.
Rao, P.B. 1988. Effects of environmental factors on germination and seedling
growth in Quercus floribunda and Cupressus torulosa, tree species of Cen-
tral Himalaya. Ann Bot 61: 531-540.
Rawal, R.S., B. Pandey, U. Dhar, 2003. Himalayan forest database – Thinking
beyond dominants. Curr Sci 84: 990-994.
Rawat, Y.S., J.S. Singh, 1988. Structure and function of Oak forests in Central
Himalaya. I. Dry matter dynamics. Ann Bot 62: 397-411.
Saikia, A. 2006. The hand of God: Delineating sacred groves and their conservation
status in India’s far east. Survival of the Commons: Mounting Challenges
and New Realities,” the Eleventh Conference of the International Association
for the Study of Common Property, Bali, Indonesia.
28
Saxena, A.K., U. Pandey, J.S. Singh, 1978. On the ecology of oak forest in
Nainital Hills, Kumoun Himalaya. In: Singh JS, Gopal B (eds) Glimpses of
Ecology:Prof. R. Misra Commemoration Volume. Jaipur International Scien-
tific Publication, pp. 167-180.
Saxena, A.K., J.S. Singh, 1982. A phytosociological analysis of woody sepcies in
forest communities of a part of Kumaun Himalaya. Vegeratio 50: 3-32.
Saxena, A.K., J.S. Singh, 1984. Tree population structure of certain Himalayan
forest association and implications concerning their future composition.
Vegetatio 58: 61-69.
Saxena, K.G., K.S. Rao, K.K. Sen, R.K. Maikhuri, R.L. Semwal, 2001.Integrated
natural resource management: approaches and lessons from the Himalaya.
Conservation Ecology, 5. URL: http:// www.consecol.org/vol15/iss2/art14].
Semwal, R.L., S. Nautival, K.S. Rao, R.K. Maikhuri, B.S. Bhandari, 1999. Structure
of forests under community conservation : a preliminary study of Jardhar
village initiative in Garhwal Himalaya. Eniv Bull 7: 16-27.
Shannon, C.E., W. E. Wiener, 1963. The Mathematical Theory of Communication.,
University of Illinois Press, Urbana, USA. 117pp..
Silori, C.S., R. Badola, 2000. Medicinal plant cultivation and sustainable
development: A case study in the buffer zone of the Nanda Devi biosphere
reserve, Western Himalaya, India. Mount Res Develop 20: 272-279.
Simpson, E.H. 1949. Measurement of diversity. Nature, 163-188.
Singh, J.S., O.P. Chaturvedi, Y.S. Rawat, 1984. Replacement of oak forest with
pine in the Himalaya affects the nitrogen cycle. Nature 311: 54-56.
Singh, J.S., Y.S. Rawat, S.C. Garkoti, 1997. Failure of brown oak (Q. semicarpifolia)
to regenerate in Central Himalaya: a case of environmental semisurprise.
Curr Sci 73: 371-374.
Singh, J.S., P.S. Yadava, 1974. Seasonal variation in composition, plant biomass
and net primary productivity of a Tropical grassland at Kurukshetra, India.
Ecol Mon 44: 351 -375.
Singh, L., J.S. Singh, 1991. Species structure, dry matter dynamics and carbon
flux of a dry tropical forest in India. Ann Bot 68: 263-273.
29

Sinha, B., R.K. Maikhuri, 1998. Conservation through ‘Socio-cultural - religious
Practice’ in Garhwal Himalaya: A Case Study of Hariyali Sacred Site. In:
Ramakrishnan PS, Saxena KG, Chandrashekara UM (eds) Conserving the
Sacred for Biodiversity Management. Oxford and IBH Publishing Co., Ltd.,
New Delhi., pp. 289-299.
Thadani, R., P.M.S. Ashton, 1995. Regeneration of banj-oak (Q. leucotrichophora
A. Camus) in the Central Himalaya. For Ecol Mana 78: 217-224.
Tiwari, J.C., S.P. Singh, 1982. Vegetation analysis of a forest lying in transition
zone between lower and upper Himalayan moist temperate forest. In: Paliwal
GS (ed), The Vegetational Wealth of Himalayas. Puja Publishers New Delhi,
pp. 104-119.
Vega-Garcia, C., E. Chuvieco, 2006. Applying local measures of spatial heterogeneity
to Landsat-TM images for predicting wildfire occurrence in Mediterranean
landscape. Lands Ecol 21: 595–605.
Wakeel, A., K.S. Rao, R.K. Maikhuri, K.G. Saxena, 2005. Forest management and
land use/cover changes in a typical micro watershed in the mid elevation
zone of central Himalaya, India. Fore Ecol Mana 213: 229-242.
Welden, C.W., S.W. Hewett, S.P. Hubbell, R.B. Foster, 1991. Sapling survival, growth
and recruitment – relationship to canopy height in a neotropical forest. Ecol
72: 35-50
Whittaker , R.H. 1975. Communities and Ecosystems. 2nd ed. Mac Millan Publishing
Co., New York. 385pp.
30