Highwood Downtown Assessment Report (DRAFT) 102213
48
Downtown Assessment Report HIGHWOOD DOWNTOWN TOD PLAN Last Revised: October 22, 2013 DRAFT - FOR REVIEW PURPOSES ONLY SUBMITTED BY: Teska Associates, Inc. | Fish Transportation Group | Business Districts, Inc. | wohltgroup
-
Upload
todd-vanadilok -
Category
Documents
-
view
214 -
download
0
description
Â
Transcript of Highwood Downtown Assessment Report (DRAFT) 102213

Downtown Assessment ReportHIGHWOOD DOWNTOWN TOD PLAN
Last Revised: October 22, 2013
DRAFT - FOR REVIEW PURPOSES ONLY
SUBMITTED BY:
Teska Associates, Inc. | Fish Transportation Group | Business Districts, Inc. | wohltgroup

Last Revised: October 22, 2013 | DRAFT - FOR REVIEW PURPOSES ONLY
| Highwood Downtown TOD Plan | Downtown Assessment Reportb
TABLE OFCONTENTS
1| Executive Summary
2| Land Use, Zoning & Infrastructure Assessment
3| Market Assessment
4| Streetscape Assessment
5| Branding & Image Assessment
6| Transportation Assessment
Section
1
5
11
21
33
39
Page

DRAFT - FOR REVIEW PURPOSES ONLY | Last Revised: October 22, 2013
Downtown Assessment Report | Highwood Downtown TOD Plan | 1
EXECUTIVESUMMARY
SECTION 1
By adopting a new Comprehensive Plan in January
2013, the City of Highwood established a vision and
general framework for how its downtown area should
evolve. The intent of the Highwood Downtown Transit
Oriented Development (TOD) Plan is to take this vision
and craft creative, innovative, and practical solutions
for individual development opportunity sites, overall
downtown image brand enhancements, streetscape,
and transportation access improvements.
In addition to the Comprehensive Plan, the City has
also completed other studies relating to Downtown
Highwood, including a parking study and market study
for the City Hall site. This Downtown Assessment Re-
port summarizes the general characteristics of Down-
town Highwood and the findings from these plans and
studies, particularly identifying opportunities that will be
explored in greater depth to support development and
improvements that further strengthen the vitality of the
downtown area.
The summaries on the next two pages describe the
key findings from this Downtown Assessment Report,
particularly highlighting the issues and opportunities
that will be explored in more depth in the next phase of
the planning process for Downtown Highwood.

Last Revised: October 22, 2013 | DRAFT - FOR REVIEW PURPOSES ONLY
| Highwood Downtown TOD Plan | Downtown Assessment Report2
1 | Executive Summary
Identify development opportunities and site improvements that improve the downtown land use mix and create a downtown experience that encourages multi-task visits.
Explore infill development where possible.
Figure out options to maintain City Hall’s location in the downtown area, whether at present or new site.
Identify potential programming at community facilities like Everts Park, the community center, and library to enhance the draw of downtown.
Explore zoning that supports certain uses as of right in the downtown area rather than the need for variances or special uses.
Pursue a more streamlined development review process to clarify developer expectations and requirements, as well as responsibilities of municipal boards, committees, and commissions.
Draft site plan concepts for key opportunity sites that take into account elements such as site design, community needs, market support, financial feasibility, and transportation aspects like parking and access by pedestrians and bicyclists.
Identify any potential environmental issues with any of the opportunity sites and determine impacts on development potential.
LAND USE, ZONING & INFRASTRUCTURE ASSESSMENT
SECTION 2
ISSUES & OPPORTUNITIES TO EXPLORE
SECTION 3
Explore development that caters to the growth market comprised of “Gen Y” (aka Millennials), who are an especially good match with the mixed use and multi-family development types most appropriate to transit oriented development (TOD).
Identify specific office development -- particularly in the medical office, medical tech, culinary education, and specialty foods sectors -- that will add the estimated 2,000 employees/students that would help invigorate the daytime market to support downtown restaurants and businesses.
Identify a downtown planning approach that integrates regional cooperation, particularly with Highland Park, Lake Forest, and Fort
Sheridan, to take advantage of their pedestrian and convenience markets that overlap with Downtown Highwood.
Explore residential development that is appropriate for the market and supported by the community.
Continue to build upon Highwood’s history of offering a cluster of unique, high quality restaurants, which positions it well in the emerging retail market that emphasizes “internet proof” dining and entertainment options that cannot be sold on the internet.
Support existing businesses by exploring downtown improvements that help them increase their sales and support the addition of new restaurants and retailers to downtown.
MARKET ASSESSMENT
ISSUES & OPPORTUNITIES TO EXPLORE
Consider streetscape improvements that support downtown when in “festival mode.”
Consider expanding the streetscape to other downtown locations, such as Green Bay Road, north and south portions of downtown, alleyways, and building rears.
Explore ways to better connect public spaces like Everts Park to the core downtown area.
Consider designating “flexible” events spaces and expanding festival offerings towards winter time events.
Explore gateway and wayfinding signage to direct bicyclists between regional trails and downtown.
Pursue collaboration with Metra and UP Railroad to identify ways to accommodate safe pedestrian connectivity between the train platforms and the core downtown area.
Explore a streetscape hierarchy that reflects the various districts throughout the downtown.
Minimize the disconnect between parking areas and businesses by better delineation of parking.
Utilize streetscape design to visually unify downtown’s east and west halves.
Address pedestrian crossings at railroad.
Identify ways to improve the downtown perimeter entrances through gateway treatments.
STREETSCAPE ASSESSMENT
ISSUES & OPPORTUNITIES TO EXPLORE
SS
SIIS
SECTION 4

DRAFT - FOR REVIEW PURPOSES ONLY | Last Revised: October 22, 2013
Downtown Assessment Report | Highwood Downtown TOD Plan | 3
Executive Summary | 1
Consider strategies to strengthen and expand Downtown Highwood’s image as a high quality community appealing to young people, families, and those seeking access to Lake Michigan and high quality recreational facilities and open spaces.
Identify historic images and elements that provide visual references to reinforce and authenticate Downtown’s overall branding and marketing goals.
Build upon local marketing savvy by working with successful business owners to help communicate Highwood initiatives and achievements, as well as provide a “boots on the ground” recruiting resource for networking and attracting complementary uses that enhance the community’s image.
Explore streetscape improvements that reinforce Highwood’s image as a festive entertainment destination.
Leverage Downtown’s existing brand and image as a dining and entertainment destination by focusing recruitment of businesses specializing in specialty/gourmet foods, cooking, gardening, and other unique businesses relating to the culinary arts.
Continue to encourage new structures that utilize high quality construction, particularly certain masonry techniques that convey the legacy of the Italian stonemasons who once made Highwood their home.
Explore ways to more effectively utilize the multiple identities presented by the City of Highwood, the Highwood Chamber of Commerce, and the Highwood Historical Society.
Carefully leverage Downtown’s identity as a dining and entertainment destination to pursue broader development goals.
Consider creating and featuring a new name to identify Downtown, while maintaining use of the “Highwood” name as a sub-identifiers, particularly given the dual image that the City’s name imparts on Downtown and the residential neighborhoods.
Develop a coordinated signage and wayfinding system, including signature gateway signage.
Initiate a long term strategy to incrementally improve the streetscaping along the Sheridan Road corridor.
Explore sign enhancements that help enhance Downtown’s overall appearance and image.
BRANDING & IMAGE ASSESSMENT
ISSUES & OPPORTUNITIES TO EXPLORE
Explore improved east-west pedestrian circulation, particularly at railroad crossings.
Identify ways to reduce vehicular conflicts with pedestrians and bicyclists at the various curb cuts along Sheridan Road/Waukegan Road and Green Bay Road.
Utilize wayfinding signage and dedicated pedestrian paths/crossings to improve safety, particularly in and around surface parking areas.
Identify specific connection opportunities that link the Robert McClory Bike Path to the downtown area and Metra station.
Integrate bike connectivity in the wayfinding signage system linking to downtown destinations and the Metra station.
Define better linkages between the Metra station and the core downtown area.
Identify ways to attract more commuters to Metra and increase parking utilization.
Designate bike routes and bike parking facilities to enhance the bikeability of the downtown area.
Explore enhanced Pace bus stop facilities.
Collaborate with Pace to address improved bus service for downtown employees.
Identify roadway improvements if needed to accommodate potential downtown development concepts.
Identify ways to improve coordination and management of parking resources, including the use of time management, designation of employee parking locations, and increased shared parking.
Explore the potential to supplement the downtown wayfinding signage system with handouts/maps at restaurants, web-based tools, and smart phone apps.
Consider coordination of valet operations and dedicated valet parking locations.
Identify potential areas to increase parking, such as along the railroad right-of-way or through cooperation between businesses regarding space behind buildings.
Consider implementing a shuttle service operating on Friday and Saturday nights and during special events and festivals.
Review the parking in-lieu program.
TRANSPORTATION ASSESSMENT
ISSUES & OPPORTUNITIES TO EXPLORE
BB
SIIS
TT
SIISS
SECTION 5
SECTION 6

Last Revised: October 22, 2013 | DRAFT - FOR REVIEW PURPOSES ONLY
| Highwood Downtown TOD Plan | Downtown Assessment Report4
1 | Executive Summary
FIGURE 1.1
DOWNTOWN HIGHWOOD TOD STUDY AREA
The study area for this project is the ½-mile radius from the Highwood Metra Station. Given the relatively small footprint of the City, coverage of this ½-mile radius extends beyond Highwood and also encompasses part of neighboring Highland Park and Phillip H. Sheridan Reserve Center.
City Boundary
Study Area Boundary1/2-MILE RADIUS AROUND METRA STATION
!?GREEN BAY RD
C ST
PATTEN RD
D ST
WES
TERN
AVE
SHERIDAN RD
H ST
HIGH
ST PRAIRIE AVE
WALKER AVE
SAIN
T JOH
NS A
VE
BLOOM ST
1ST ST
9TH ST
3RD ST
WAUKEGAN AVE
HIGHWOOD AVE
WAR
BLER
PL
HILL ST
MORAINE RD
GREE
NWOO
D AV
E
S CE
NTRA
L AVE
B ST
BANK LN
11TH ST
LOCK
ARD
LN
G ST
BURCHELL AVE
TEMPLE AVE
LYSTER RD
ORCHARD LN
WASHINGTON AVE
2ND STM
URPHY RDN
CENT
RAL A
VE
SARD PL
PLEA
SANT
AVE
CLAY AVE
EVER
TS P
L
BURTIS AVE
10TH ST
MCKIBBIN ST
MORGAN PL
SKOKIE AVE
HALF DAY RD
JEFF
REYS
PL
4TH STASHLAND AVE
NORTH AVE
JOHN
STON
DR
EUCLID AVE
EISENHOWER RD
LAKE
VIE
W A
VE
WEBSTER AVE
ELM AVE
NIADA TER
VETE
RANS
DR
LOGAN ST
HECK ST
WESTOVER RD
SUMMIT AVE
EVOL
UTIO
N AV
E
LLEWELLYN AVE
TRILLIUM LN
BROOK RD
GROV
E AVE
SHERIDAN AVE
FUNS
TON
AVE
CHATFIELD DR
CHICAGO AVE
MICHIGAN AVE
OAKRIDGE AVE
RIENZI LN
OAK AVE
OMAHA ST
PALM
ER A
VE
MEARS PL
GRANT ST
LAUR
ETTA
PL
S MURPHY RD
PORT
CLI
NTON
RD
NORMANDY ST
MCNAIR ST
WRENDALE AVE
DAVIS ST
FORT
SHE
RIDA
N AV
E
WAINWRIGHT ST
EUCLID CT
UNNAMED
OAK
TERR
ACE A
VE
MON
TGOM
ERY A
VE
JOCELYN PL
EXMOOR AVE
EXM
OOR
CT
MCK
IBB
ST
ROSLYN CIR
WARBLER CT
BLACKHAWK DR
UNNAMED
2ND ST
LLEWELLYN AVE
4TH ST
PATTEN RD
EUCLID AVE
BURCHELL AVE
B ST
NORTH AVE
WESTERN AVE
GREE
NWOO
D AV
E
MICHIGAN AVE
UNNAMED
Source: GIS Map Data from City of Highwood and Lake County
MetraStation
HotelMoraine
CityHall
Oak TerraceElementary School
LibraryPostOffice
MunicipalCenter
Public SafetyFacility
EvertsPark
DRAFT - FOR REVIEW PURPOSES ONLY | Last Revised: October 22, 2013
Downtown Assessment Report | Highwood Downtown TOD Plan | 5
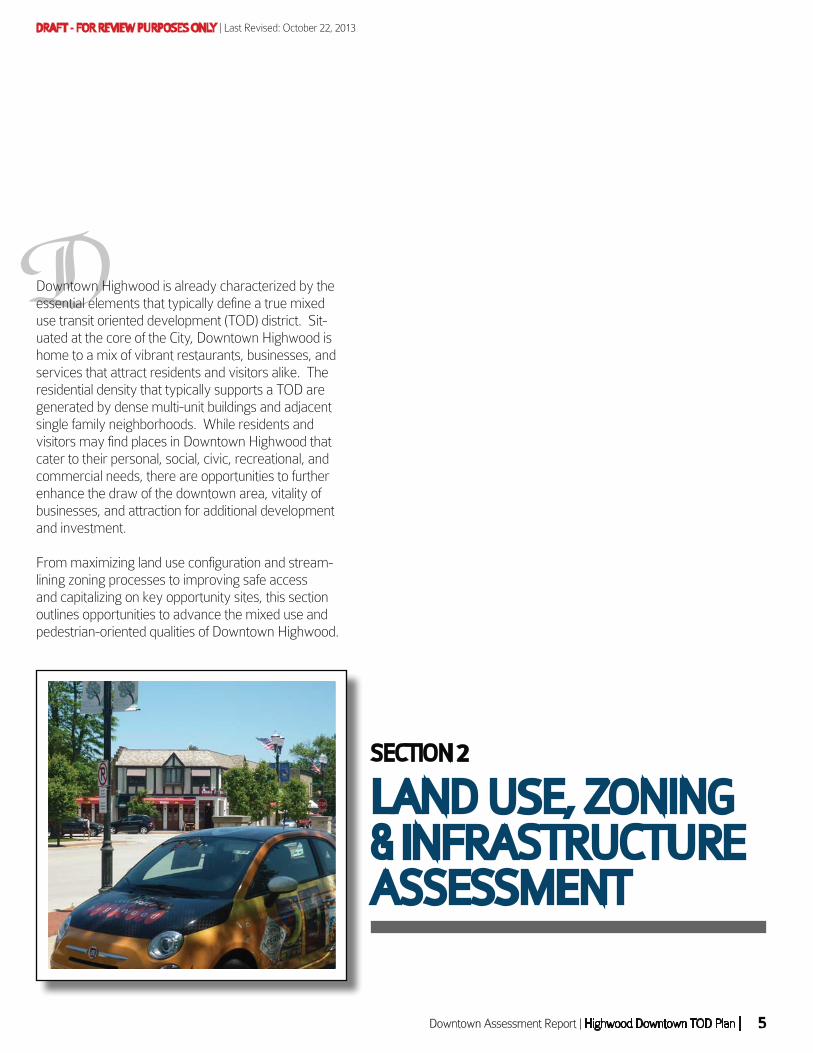
LAND USE, ZONING& INFRASTRUCTUREASSESSMENT
SECTION 2
Downtown Highwood is already characterized by the
essential elements that typically define a true mixed
use transit oriented development (TOD) district. Sit-
uated at the core of the City, Downtown Highwood is
home to a mix of vibrant restaurants, businesses, and
services that attract residents and visitors alike. The
residential density that typically supports a TOD are
generated by dense multi-unit buildings and adjacent
single family neighborhoods. While residents and
visitors may find places in Downtown Highwood that
cater to their personal, social, civic, recreational, and
commercial needs, there are opportunities to further
enhance the draw of the downtown area, vitality of
businesses, and attraction for additional development
and investment.
From maximizing land use configuration and stream-
lining zoning processes to improving safe access
and capitalizing on key opportunity sites, this section
outlines opportunities to advance the mixed use and
pedestrian-oriented qualities of Downtown Highwood.

Last Revised: October 22, 2013 | DRAFT - FOR REVIEW PURPOSES ONLY
| Highwood Downtown TOD Plan | Downtown Assessment Report6
2 | Land Use, Zoning & Infrastructure Assessment
LAND USE
The existing land use pattern in Downtown Highwood is generally supportive of the TOD concept, specifically providing a mix of residential, retail, services, restaurant, office, civic, and institutional uses in a pedestrian-oriented environment with access to Metra. While the restaurants are the lifeblood of Downtown Highwood, other commercial uses include a range of businesses, such as consignment stores, small retail shops, major businesses like Walgreens, auto oriented ser-vices, and a major cleaners facility. The restaurants and businesses are partially supported by a daytime population comprised of office and City Hall employees and patrons of institutional uses like the library and post office. Military reservists from the neighboring Phillip H. Sheridan Joint Reserve Center also provide a unique population within walking distance of the downtown. The future land use plan outlined in the Highwood Comprehensive Plan continues to maintain the mixed use and pedestrian-oriented qualities of the downtown area.
OPPORTUNITIES
While Downtown Highwood has the es-sential pieces to create a true mixed use TOD district at the core of the City, there are opportunities to improve the land use mix to further enhance the vitality of busi-nesses and attraction of the downtown as a place to live, work, visit, or establish a new business or development. For instance, retail uses, such as restaurants and retail stores, that are greatly depen-dent on high visibility should be placed along major roads like Sheridan Road and Green Bay Road. On the other hand, ser-vice uses like auto shops and professional offices may be placed on side streets off the major roads, recognizing that they are viewed more as destination businesses that do not necessarily need high visibility as patrons actively seek them out. Infill residential development should be con-sidered to further enhance the density near the Metra station, as well as encour-age new quality housing units that meet different price points and lifestyles. Main-taining City Hall’s location in Downtown Highwood is critical to creating a strong civic presence and contributing to the em-ployee daytime population. In addition, enhanced programming at the commu-nity center and the planned expansion of the library will further increase the draw of downtown.
City Hall and the Highwood Police Department provide a
civic presence in the downtown area. Commercial businesses are
diverse in Downtown High-wood, including restaurants
and consignment shops, which are the defining element of the downtown. Office uses like
the Viti complex are part of the downtown area, with residen-
tial neighborhoods surrounding the periphery of the core area.
1
32
54
1
2
3
4
5

DRAFT - FOR REVIEW PURPOSES ONLY | Last Revised: October 22, 2013
Downtown Assessment Report | Highwood Downtown TOD Plan | 7
Land Use, Zoning & Infrastructure Assessment | 2
ZONING
A majority of Downtown Highwood is zoned B-1 (Retail Business), primarily along the main thoroughfares of Sheridan Road and Green Bay Road, as shown in the City’s Zon-ing Map in Figure 2.1. Other prominent zoning districts in Downtown Highwood include R-2 (Single Family), R-3A (Multiple Family), and B-2 (Service and Retail Business). A select few parcels -- including the Walgreens, U.S. Bank, Fort Sheridan Place apart-ments, and Hotel Moraine site – are zoned PUD (Planned Unit Development), which provides greater flexibility to development “that would not be possible under the strict application of the other provisions of [the Highwood Zoning Ordinance].” City officials and members of the development community both recognize the potential to re-assess the development review process to clarify expectations and requirements of developers and review responsibilities of municipal boards, committees, and commissions.
OPPORTUNITIES
The PUD designation is often viewed as ideal for a mixed use district like Downtown Highwood, particularly due to the flexibility it extends to de-velopments with unique qualities that underlying zoning may place certain restrictions. However, the current zoning designations may already be supportive of the mixed use character desired for Downtown Highwood. For example, multiple-family dwell-ings are permitted uses within the B-1 district, which is advantageous for advancing mixed use in Downtown Highwood. Providing certain uses as of right rather than special uses or variances holds the potential for the City to establish a more predictable and streamlined development review process that benefits developers and the municipality. There is also op-portunity to review the development review process to clarify expectations and requirements of developers, as well as review responsibilities of municipal boards, committees, and commissions.
FIGURE 2.1
DOWNTOWN ZONING DISTRICTS
Source: City of Highwood
Last Revised: October 22, 2013 | DRAFT - FOR REVIEW PURPOSES ONLY
| Highwood Downtown TOD Plan | Downtown Assessment Report8
2 | Land Use, Zoning & Infrastructure Assessment
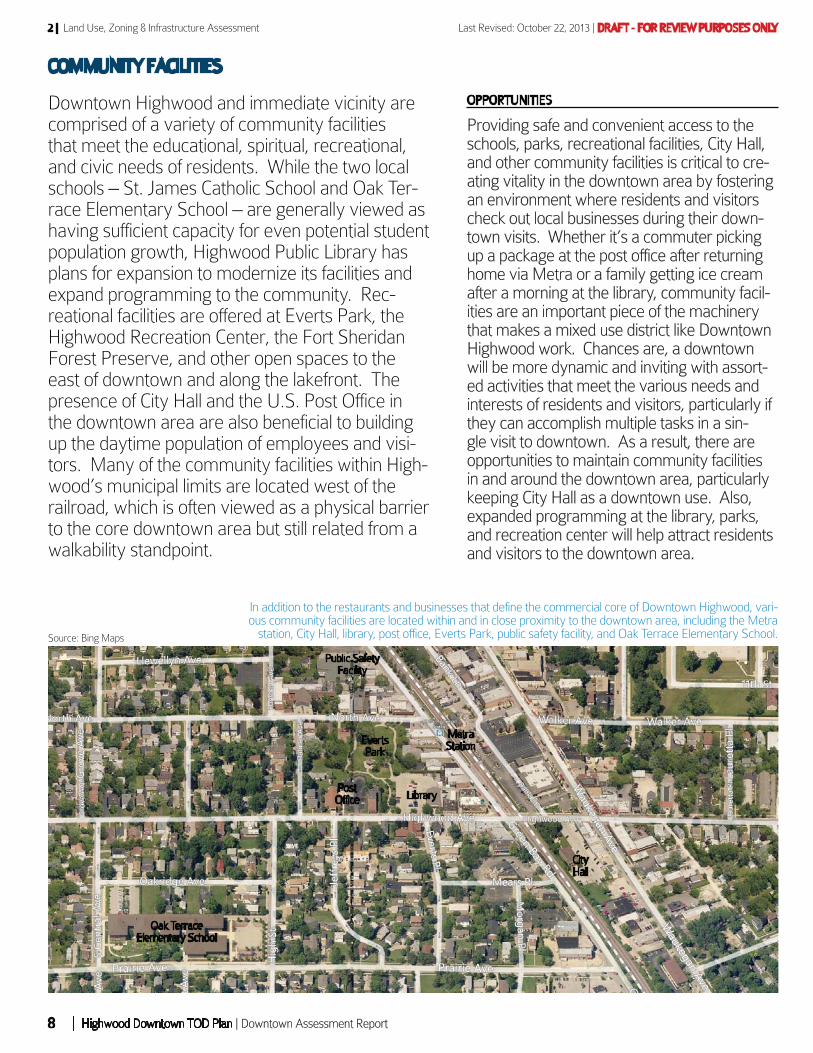
COMMUNITY FACILITIES
Downtown Highwood and immediate vicinity are comprised of a variety of community facilities that meet the educational, spiritual, recreational, and civic needs of residents. While the two local schools – St. James Catholic School and Oak Ter-race Elementary School – are generally viewed as having sufficient capacity for even potential student population growth, Highwood Public Library has plans for expansion to modernize its facilities and expand programming to the community. Rec-reational facilities are offered at Everts Park, the Highwood Recreation Center, the Fort Sheridan Forest Preserve, and other open spaces to the east of downtown and along the lakefront. The presence of City Hall and the U.S. Post Office in the downtown area are also beneficial to building up the daytime population of employees and visi-tors. Many of the community facilities within High-wood’s municipal limits are located west of the railroad, which is often viewed as a physical barrier to the core downtown area but still related from a walkability standpoint.
OPPORTUNITIES
Providing safe and convenient access to the schools, parks, recreational facilities, City Hall, and other community facilities is critical to cre-ating vitality in the downtown area by fostering an environment where residents and visitors check out local businesses during their down-town visits. Whether it’s a commuter picking up a package at the post office after returning home via Metra or a family getting ice cream after a morning at the library, community facil-ities are an important piece of the machinery that makes a mixed use district like Downtown Highwood work. Chances are, a downtown will be more dynamic and inviting with assort-ed activities that meet the various needs and interests of residents and visitors, particularly if they can accomplish multiple tasks in a sin-gle visit to downtown. As a result, there are opportunities to maintain community facilities in and around the downtown area, particularly keeping City Hall as a downtown use. Also, expanded programming at the library, parks, and recreation center will help attract residents and visitors to the downtown area.
In addition to the restaurants and businesses that define the commercial core of Downtown Highwood, vari-ous community facilities are located within and in close proximity to the downtown area, including the Metra
station, City Hall, library, post office, Everts Park, public safety facility, and Oak Terrace Elementary School.Source: Bing Maps
MetraStation
CityHall
Oak TerraceElementary School
LibraryPost
Office
Public SafetyFacility
EvertsPark

DRAFT - FOR REVIEW PURPOSES ONLY | Last Revised: October 22, 2013
Downtown Assessment Report | Highwood Downtown TOD Plan | 9
Land Use, Zoning & Infrastructure Assessment | 2
ENVIRONMENTAL ISSUES
While the core downtown area is located more than a half mile west of Lake Michi-gan, Downtown Highwood has no environ-mental issues relating to the natural envi-ronment, such as wetlands and floodplain. However, there may be environmental issues caused by physical land development, particularly relating to the cleaners site and auto service businesses. In the past, Fort Sheridan filled its deep ravines with landfill waste, which were not initially managed in an environmentally sound manner. Howev-er, the situation was remedied by capping the landfill and securing federal funds for further cleanup efforts.
OPPORTUNITY SITES
The Highwood Comprehensive Plan iden-tified a set of key opportunity sites in and around the downtown area, which pro-vides potential sites for redevelopment or improvements to enhance the vitality of Downtown Highwood. These key opportu-nity sites are illustrated in yellow on the map in Figure 2.2. Additional opportunity sites have been identified on the map (shown in orange), including the Hotel Moraine site, the former Carousel Linens site, the recently closed Bertucci’s restaurant, and other sites.
OPPORTUNITIES
As the City considers development options for down-town opportunity sites, it will be critical to conduct appropriate environmental studies to ensure land is suit-able for development and impose no negative impacts on adjacent properties.
OPPORTUNITIES
While the Comprehensive Plan outlines potential con-cepts for redevelopment or improvement of the key opportunity sites, the primary purpose of the Highwood Downtown TOD Plan is to develop more specific plans for the opportunity sites, taking into account elements such as site design, community needs, market support, financial feasibility, and transportation aspects like park-ing and access by pedestrians and bicyclists.
The laundry and dry cleaners facility located west of the Sher-idan Road/Clay Avenue intersection is a prominent business in Downtown Highwood, but may pose environmental impacts.
The former Shrimp Walk restaurant site is a prime opportunity site in Downtown Highwood, located
one block east of the Sheridan Road corridor.

Last Revised: October 22, 2013 | DRAFT - FOR REVIEW PURPOSES ONLY
| Highwood Downtown TOD Plan | Downtown Assessment Report10
2 | Land Use, Zoning & Infrastructure Assessment
FIGURE 2.2
OPPORTUNITY SITES
!?
C STGREEN BAY RD
D ST
H ST
SHERIDAN RD
PRAIRIE AVE
PATTEN RD
9TH ST
3RD ST
NORTH AVE
HIGHWOOD AVE
1ST ST
WALKER AVE
HIGH
ST
BANK LN
11TH ST
LOCK
ARD
LN
WAUKEGAN AVE
BLOOM ST
G ST
TEMPLE AVE
MURPHY RD
N CE
NTRA
L AVE
BURCHELL AVE
WASHINGTON AVE
CLAY AVE
EVER
TS P
L
10TH ST
MCKIBBIN ST
2ND ST
JEFF
REYS
PL
4TH ST
EISENHOWER RD
LAKE
VIE
W A
VE
WEBSTER AVE
S CE
NTRA
L AVE
LOGAN ST
EVOL
UTIO
N AV
E
ASHLAND AVE
GROV
E AVE
SHERIDAN AVE
MORGAN PL
FUNS
TON
AVE
OAKRIDGE AVE
B ST
PALM
ER A
VE
OMAHA ST
MEARS PL
LAUR
ETTA
PL
LLEWELLYN AVE
MCNAIR ST
EUCLID AVE
NORMANDY ST
SAIN
T JOH
NS A
VE
MARSHALL RDS M
URPHY RD
OAK
TERR
ACE A
VE
6TH ST
7TH ST
5TH ST
8TH ST
LYSTER RD
CHATFIELD DR
JOCELYN PL
B ST2ND ST
4TH ST
Opportunity SitesIDENTIFIED IN THE COMPREHENSIVE PLAN
Opportunity SitesIDENTIFIED AS PART OF THIS STUDY
Source: GIS Map Data from City of Highwood and Lake County
MetraStation
HotelMoraine
CityHall
Oak TerraceElementary School
EvertsPark
LibraryPost
Office
St. JamesCatholic School
MunicipalCenter
Public SafetyFacility

DRAFT - FOR REVIEW PURPOSES ONLY | Last Revised: October 22, 2013
Downtown Assessment Report | Highwood Downtown TOD Plan | 11
MARKETASSESSMENT
SECTION 3
With the City’s recently conducted Redevelopment
Potential of Highwood City Hall Site and Comprehen-
sive Plan, which both included community market
information, this transit oriented development (TOD)
study for Downtown Highwood focuses on the addi-
tional information necessary to understand the markets
accessible to the broader downtown and specifically
the role of transit in growing markets. The goal of
this market assessment is to understand how short
term and long term planning decisions that strengthen
the market and make existing and future businesses
serving Downtown Highwood more successful. This
approach recognizes that the community of Highwood
has a unique resource in its legendary restaurant and
entertainment cluster.
This market assessment provides baseline data to the
City, existing business owners, property owners, poten-
tial investors, and residents about the market support
for specific types of retail, office, residential, and mixed
use projects. This overview highlights the importance
of balancing activity in all sectors and paying special at-
tention to adding office uses to build daytime population
that supports the vibrancy of Downtown Highwood.

Last Revised: October 22, 2013 | DRAFT - FOR REVIEW PURPOSES ONLY
| Highwood Downtown TOD Plan | Downtown Assessment Report12
3 | Market Assessment
MARKET OVERVIEW
The commercial land uses and residential types associated with typical downtown TODs
appeal to the four markets described below. The table in Figure 3.1 reports demographic and
spending characteristics of these markets. These markets cover a multi-jurisdictional sub-re-
gion where residents cross community boundaries while traveling to work, shop, dine, and
enjoy the many amenities available in this area. Effective economic development in High-
wood’s TOD area seeks to combine this active residential population with a daytime popula-
tion of employees that creates an economically sustainable local marketplace.
COMMUNITYAFFILIATED MARKET
Downtowns such as High-wood’s define the character of a community. With pride, residents bring guests to dine in independent restau-rants and seek special items at unique stores. High-wood’s Downtown serves as a setting for community festivals that draw residents. This relationship creates an affiliation that makes commu-nity residents an important market for the downtown businesses and the public transportation that is located in the study area.
PEDESTRIAN MARKET
Residents living within a ½- to 1½-mile walk of a commer-cial development like Down-town Highwood are partic-ularly frequent users. The frequent trips and presence of these nearby residents add vitality, even when business-es are not open. Conse-quently, this pedestrian, walk-in market is more important to the success of commercial clusters than its spending power suggests. About 55% of Metra riders living within the study area are walking to the station a significantly high percentage than Metra’s system wide average, 21%. As Figure 3.2 illustrates, the ½-mile walking radius of the Highwood Metra station falls within three communities: Highwood, Highland Park, and Lake Forest. Conse-quently, this market’s devel-opment requires regional cooperation.
CONVENIENCE MARKET
If one can easily drive or bicycle to a location where needed items are available, that location can be the routine choice to meet every day needs if it offers desirable quality and variety. Conve-nience shoppers are the core market for neighborhood serving stores. Employees within this area are potential lunchtime customers for restaurants. This 5-minute drive time market also iden-tifies the homes of bicyclists who can travel to a commer-cial cluster or transit station in 10 minutes or less. This mar-ket dynamic adds recreation-al users to the auto oriented market. For Highwood, this is a multi-jurisdictional market where the majority of the area is in Highland Park and Lake Forest. Consequently, planning decisions made in Highwood have little impact on the growth of this market and therefore, regional coop-eration is important to build-ing the size of this market.
DESTINATION MARKET
The businesses with unique offerings attract shoppers from a larger geographic market create a destination draw and their customers from this larger trade area add sales to adjacent con-venience businesses. The unique stores and restaurants attracting this market also give the commercial cluster a character that distinguishes it from other shopping alterna-tives. One should note that, although the sales volume from this market is a smaller percent of total sales volume for each store, these margin-al sales add significantly to the profits of all businesses. Without destination custom-ers, few businesses can meet their operational goals. High-wood’s specialty restaurants have a well-established re-gional reputation and history, and the regional draw of such establishments as Froggy’s French Restaurant, Del Rio Italian Restaurant, Miramar, and other dining establish-ments extend the reach of all Highwood businesses. Wayfinding through signage and simplified directions are critical to easy access for a 15-minute drive time and, given the power of High-wood’s dining and enter-tainment, potentially to the 30-minute drive time market. This regional visibility also influences residential interest in living in proximity to this unique district.
With Downtown Highwood’s pedestrian and conve-nience markets overlapping into the adjacent com-munities of Highland Park and Lake Forest, planning decisions made in Highwood will rely upon regional cooperation to nurture these markets.

DRAFT - FOR REVIEW PURPOSES ONLY | Last Revised: October 22, 2013
Downtown Assessment Report | Highwood Downtown TOD Plan | 13
Market Assessment | 3
SheridanReserveCenter
FIGURE 3.1
HIGHWOOD MARKET AREAS
Highwood
Total Population
Total Households
Median Age
Owned Free and Clear
Owned with a Mortgage
Rented Housing Units
Hispanic Ethnicity
Not of Hispanic Ethnicity
Average Household Income
Median Household Income
Consumer Expenditures
Employees
Employee Spending
5,368
1,759
33.0
15.2%
26.7%
57.9%
52.5%
47.4%
$108,306
$65,930
$90,155,786
1,440
-
Source: Experian, 2013; What Workers Spend; BDI
1/2-MileRadius
5,287
1,750
36.0
18.8%
31.9%
49.1%
43.4%
56.5%
$120,262
$71,165
$93,299,500
1,750
-
5-MinuteDrive Time
14,736
5,338
39.0
20.3%
39.8%
39.7%
28.6%
71.3%
$133,220
$81,265
$302,899,472
7,825
$57,325,950
15-MinuteDrive Time
92,286
33,499
45.0
26.7%
56.2%
16.9%
7.5%
92.4%
$196,472
$124,507
$2,181,086,391
93,990
-
30-MinuteDrive Time
875,593
317,239
40.0
22.1%
53.9%
23.9%
15.3%
84.6%
$126,023
$82,520
$18,551,185,003
555,800
-
SheridanReserveCenter
5-MINUTE DRIVE TIME CONVENIENCE MARKET1/2-MILE RADIUS PEDESTRIAN MARKET
30-MINUTE DRIVE TIME EXTENDED DESTINATION MARKET15-MINUTE DRIVE TIME DESTINATION MARKET
HIGHWOOD
HIGHWOOD
HIGHWOODHIGHWOOD

Last Revised: October 22, 2013 | DRAFT - FOR REVIEW PURPOSES ONLY
| Highwood Downtown TOD Plan | Downtown Assessment Report14
3 | Market Assessment
The table in Figure 3.2 compares pop-
ulation and employment in the ½-mile
pedestrian accessible markets sur-
rounding the Highwood Metra station
and other Metra stations in the Lake
Forest, Highwood, and Highland Park
sub-region.
Note that Highwood’s Metra station is
accessible to the largest population but
lags Lake Forest and Highland Park in
the daytime employee population. The
other significant difference between
Highwood and the other nearby stations
is the younger population. The table
in Figure 3.3 reveals that this younger
population is caused by a significantly
higher “Gen Y” population. “Gen Y,” also
called Millennials, is the population born
in the 1980s and 1990s that is now 20 to
34 years old. That population recently
passed the “Baby Boomers” as the larg-
est segment in the United States. That
size, combined with its age, make “Gen
Y” the growth market for the future.
Recent research by the Urban Land
Institute comparing housing choice by
age reports that this younger population
is an especially good match with the
mixed use and multi-family develop-
ment types most appropriate to TOD.
Highwood
“Gen Y,” also called Millennials and born in the 1980s and 1990s, recently passed the “Baby Boomers” as the largest segment in the United States. That size, com-bined with its age, make “Gen Y” the growth market for the future. Research comparing housing choice by age reports that this younger population is an especially good match with the mixed use and multi-family development types most appropriate to TOD.
FIGURE 3.2
POPULATION & EMPLOYMENT IN DOWNTOWN HIGHWOOD ½-MILE PEDESTRIAN MARKET
Gen Y … shows the strongest preference among the generations for communities with a mix of uses, with shops, offices, and housing together (62%), as well as a mixture of different types of housing, such as detached homes, apartments, and row or townhouses (59%).
FIGURE 3.3
AGE VARIATION WITHIN ½-MILE OF METRA STATIONS
Under
Age 2
0
Metra Station
Highwood
Fort Sheridan
Highland Park
Ravinia
Lake Forest
West Lake Forest
28.4%
30.8%
23.5%
29.3%
26.5%
29.6%A
ge
20 to 3
4
20.2%
10.3%
12.3%
8.3%
10.7%
7.6%
Source: Experian, 2013; BDI
Americans’ Views on theirCommunities, Housing, and Transportation, Urban Land UseMarch 2013
-
Total Population
Total Households
Population per Square Mile
Median Age
Rented Housing Units
Average Household Income
Employees
Daily Metra Boardings (2006)
5,289
1,747
5,955
35.7
49.10%
$118,217
1,748
279
Source: Experian, 2013; RTAMS
FortSheridan
1,436
598
2,825
41.9
22.60%
$155,531
526
279
HighlandPark
3,542
1,715
3,668
47.1
39.60%
$136,140
4,145
1,118
Ravinia
2,881
1,100
3,301
44.8
11.60%
$187,988
532
332
LakeForest
1,641
703
1,799
46.9
22.90%
$183,642
1,930
725
West LakeForest
1,023
367
1,030
47.8
5.50%
$279,776
434
578
DRAFT - FOR REVIEW PURPOSES ONLY | Last Revised: October 22, 2013
Downtown Assessment Report | Highwood Downtown TOD Plan | 15
Market Assessment | 3
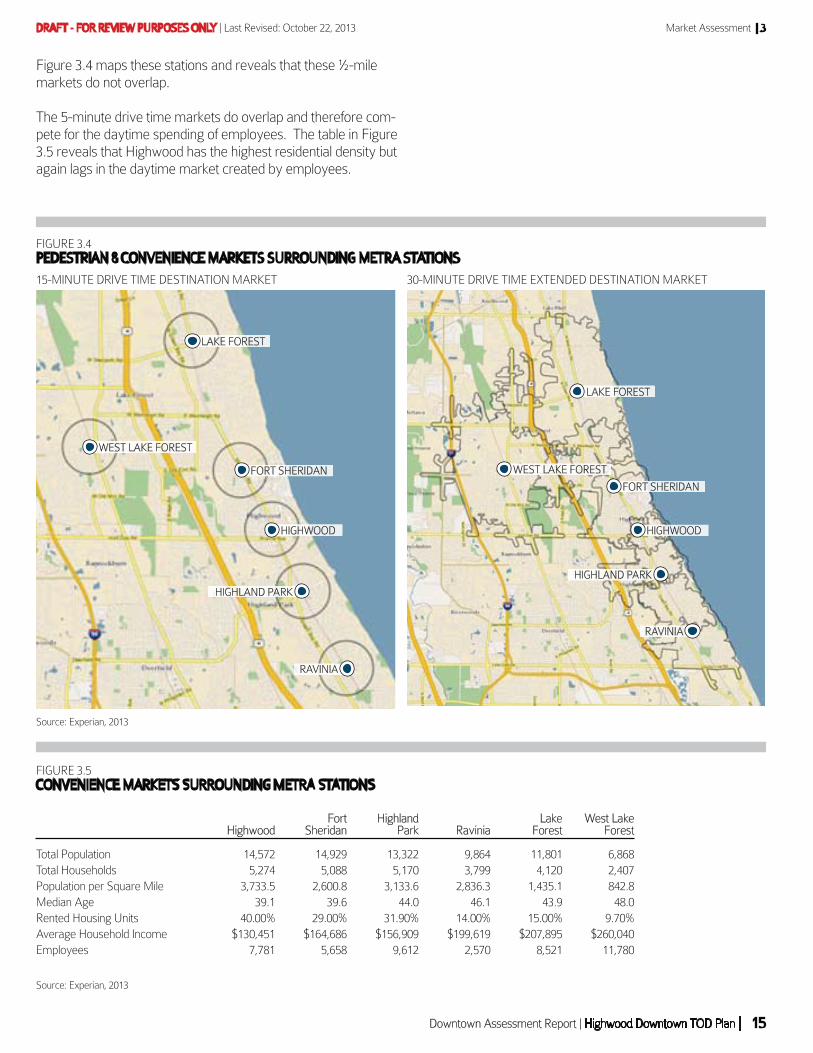
Figure 3.4 maps these stations and reveals that these ½-mile
markets do not overlap.
The 5-minute drive time markets do overlap and therefore com-
pete for the daytime spending of employees. The table in Figure
3.5 reveals that Highwood has the highest residential density but
again lags in the daytime market created by employees.
FIGURE 3.5
CONVENIENCE MARKETS SURROUNDING METRA STATIONS
FIGURE 3.4
PEDESTRIAN & CONVENIENCE MARKETS SURROUNDING METRA STATIONS
Highwood
Total Population
Total Households
Population per Square Mile
Median Age
Rented Housing Units
Average Household Income
Employees
14,572
5,274
3,733.5
39.1
40.00%
$130,451
7,781
Source: Experian, 2013
FortSheridan
14,929
5,088
2,600.8
39.6
29.00%
$164,686
5,658
HighlandPark
13,322
5,170
3,133.6
44.0
31.90%
$156,909
9,612
Ravinia
9,864
3,799
2,836.3
46.1
14.00%
$199,619
2,570
LakeForest
11,801
4,120
1,435.1
43.9
15.00%
$207,895
8,521
West LakeForest
6,868
2,407
842.8
48.0
9.70%
$260,040
11,780
30-MINUTE DRIVE TIME EXTENDED DESTINATION MARKET15-MINUTE DRIVE TIME DESTINATION MARKET
Source: Experian, 2013
LAKE FOREST
FORT SHERIDAN
HIGHWOOD
WEST LAKE FOREST
HIGHLAND PARK
RAVINIA
LAKE FOREST
FORT SHERIDAN
HIGHWOOD
HIGHLAND PARK
RAVINIA
WEST LAKE FOREST

Last Revised: October 22, 2013 | DRAFT - FOR REVIEW PURPOSES ONLY
| Highwood Downtown TOD Plan | Downtown Assessment Report16
3 | Market Assessment
In considering the opportunity for TOD,
it is useful to look beyond the sub-region
to consider the market developed by
communities that focused on TOD to
create vibrant environments in their
downtowns. Unlike communities such
as Arlington Heights and Evanston,
which pursued TOD with extensive re-
development, Elmhurst and La Grange
primarily energized their vintage spaces
to create vibrant dining and entertain-
ment districts. Again, at the ½-mile dis-
tance, Highwood compares favorably in
residential population, as summarized in
Figure 3.6. However, Downtown High-
wood has significantly fewer employ-
ees. At the critical 5-minute drive time
distance, Downtown Highwood slightly
lags in residential population (the lake
makes this a difficult problem for most
shore communities), while it significantly
lags in daytime population.
This market assessment provides base-
line data to the City, existing business
owners, property owners, potential in-
vestors, and residents about the market
support for specific types of retail, office,
residential, and mixed use projects. This
overview highlights the importance
of balancing activity in all sectors and
paying special attention to adding office
uses to build daytime population that
supports the vibrancy of Downtown
Highwood.
At the ½-mile distance, Highwood compares favorably in residential population to communities like Elmhurst and La Grange, which primarily energized their vintage downtown spaces to create vibrant dining and enter-tainment districts. However, Downtown Highwood has significantly fewer employees.
FIGURE 3.6
PEDESTRIAN & CONVENIENCE MARKETS IN COMPARISON TOD DEVELOPMENTS
Highwood
Total Population
Total Households
Population per Square Mile
Median Age
Rented Housing Units
Average Household Income
Employees
5,289
1,747
5,954.9
35.7
49.1%
$118,217
1,748
Source: Experian, 2013
Elmhurst
4,669
1,660
6,111.6
31.6
34.5%
$139,478
3,897
La Grange
5,630
2,546
6,602.3
41.9
37.3%
$104,003
4,314
PEDESTRIAN MARKETS
Highwood
Total Population
Total Households
Population per Square Mile
Median Age
Rented Housing Units
Average Household Income
Employees
14,572
5,274
3,733.5
39.1
40.0%
$130,451
7,781
Elmhurst
15,300
5,703
4,952.5
40.8
23.7%
$132,845
9,148
La Grange
27,455
10,346
5,814.1
41.3
22.1%
$115,383
9,823
CONVENIENCE MARKETS
Downtown Highwood compares favorably to com-munities like Elmhurst and La Grange, which each
has a vibrant restaurant and entertainment district.
DRAFT - FOR REVIEW PURPOSES ONLY | Last Revised: October 22, 2013
Downtown Assessment Report | Highwood Downtown TOD Plan | 17
Market Assessment | 3
OFFICE & COMMERCIALSERVICES OPPORTUNITIES
Unlike retailers and restaurateurs who
must find space specifically connected
to a consumer market, office tenants
look regionally and are able to relocate
for price or amenities. The region-
al office market remains weak, with
total vacancies in the North Suburban
Market reported at 20.4% at the end
of the 2nd quarter 2013.2 Although the
general market for office is quite weak,
downtowns in communities such as
Highwood often overcome that weak-
ness, as nearby residents choose office
locations that minimize their commute.
Generally, small to mid-sized corpora-
tions requiring developments of 10,000
to 30,000 square feet can make this
type of relocation. Initially, buildings
are constructed with the prime tenant
occupying 70% of the space.
These unique office opportunities cannot
be documented because they often
involve property acquisition or landlord
tenant relationships that occur because
the tenant chooses to make an invest-
ment in the community where they
have personal connections. Downtown
Highwood’s recent Viti Insurance build-
ing development is an example of this
type of office development.
Planning studies like this one and notices
in City publications can stimulate these
“micro-market” opportunities. In other
communities, specialized advertising
agencies, insurance servicing business-
es, and manufacturing representatives
have moved into downtown bringing 30
to 150 employees per business.
Given the regional market conditions,
adding new space depends on special-
ized uses that fit growing fields: (1) med-
ical office growing to provide services
to residents newly insured by the U.S.
Affordable Care Act; and (2) entrepre-
neurial businesses that capitalize on
the medical tech associated with Lake
County’s Abbott and Baxter cluster.That
space can be upper stories in mixed
use buildings with first floor stores and
restaurants. The medical tech space can
be data centers as well as associated
office space. Again, the market for the
medical office and medical tech fields is
difficult to document and will only devel-
op based on specific appeals to real es-
tate decision makers associated with the
key Lake County medical businesses.
This assessment highlights the need
to capitalize on community affiliation
and sub-regional specialization to seek
“micro-market” office tenants as a com-
ponent that could improve the financing
of potential developments. The unique
position of Downtown Highwood as a
restaurant cluster serving the sub-re-
gion may offer the opportunity to add
culinary education as a daytime use.
Other related uses to investigate are a
multi-user, leasable commercial kitchen
and businesses supporting marketing
specialty foods such as packaging and
marketing consultants.
The goal is to, over time, add as many
as 2,000 employees/students that would
invigorate the daytime market. Accom-
modating that daytime population would
involve approximately 300,000 square
feet. In the short-term, it is expected
that much of that space would be in
upper stories and conversion of existing
properties to take advantage of lower
costs associated with vintage buildings.
As the market is proven, the higher cost
new construction would follow.
2 Chicago Office Market Trends 2q13, U.S. Equities Realty
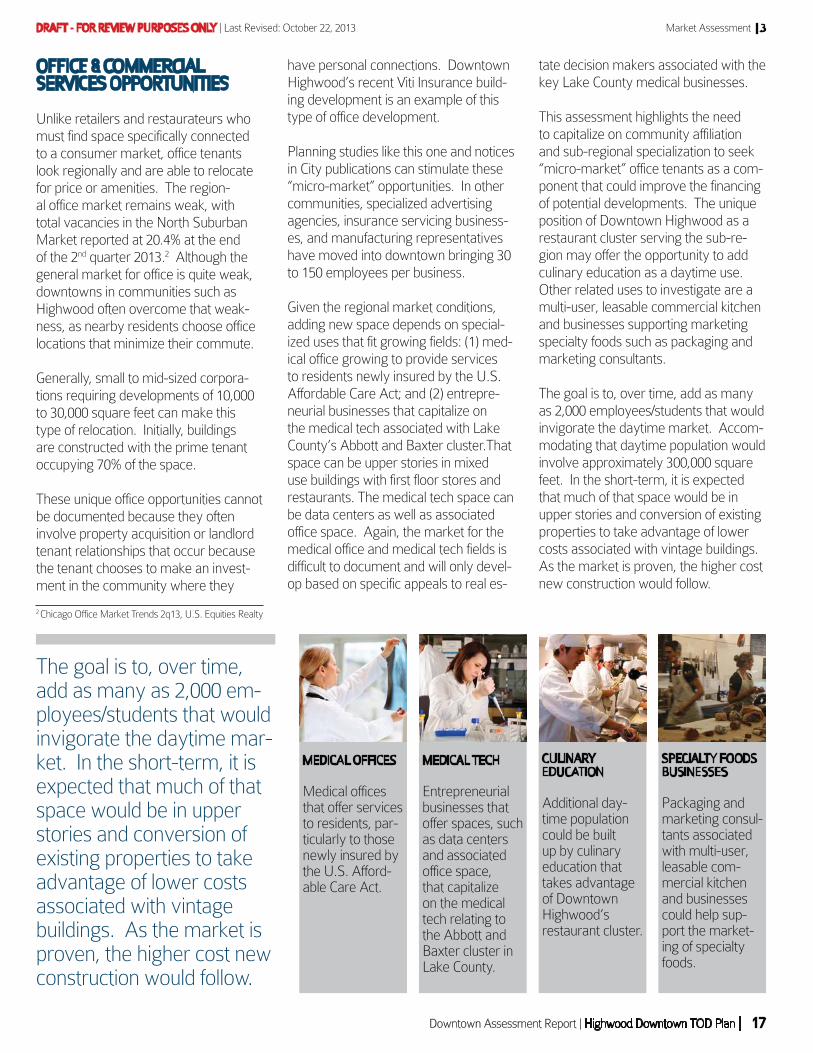
SPECIALTY FOODSBUSINESSES
Packaging and marketing consul-tants associated with multi-user, leasable com-mercial kitchen and businesses could help sup-port the market-ing of specialty foods.
CULINARYEDUCATION
Additional day-time population could be built up by culinary education that takes advantage of Downtown Highwood’s restaurant cluster.
MEDICAL TECH
Entrepreneurial businesses that offer spaces, such as data centers and associated office space, that capitalize on the medical tech relating to the Abbott and Baxter cluster in Lake County.
The goal is to, over time, add as many as 2,000 em-ployees/students that would invigorate the daytime mar-ket. In the short-term, it is expected that much of that space would be in upper stories and conversion of existing properties to take advantage of lower costs associated with vintage buildings. As the market is proven, the higher cost new construction would follow.
MEDICAL OFFICES
Medical offices that offer services to residents, par-ticularly to those newly insured by the U.S. Afford-able Care Act.

Last Revised: October 22, 2013 | DRAFT - FOR REVIEW PURPOSES ONLY
| Highwood Downtown TOD Plan | Downtown Assessment Report18
3 | Market Assessment
RETAIL DEVELOPMENTOPPORTUNITIES
This is a time of transition for retailers as
new store sizes and selling through the
internet as well as a store becomes the
foundation for success. These changes
are impacting both Main Streets and
the neighborhood shopping centers that
form the commercial land uses near
TOD districts like the Highwood Metra
station area. Stores now face growing
internet sales and a changing compet-
itive environment as mass merchan-
disers like Target and warehouse clubs
like Costco and Sam’s Club compete for
the grocery and general merchandise
business.
Complicating Highwood’s position in
the regional shopping landscape is
its close proximity to Highland Park’s
Renaissance Place, where Sak’s exit
was followed by the loss of national
chain stores, leaving modern store
space to compete less than a mile from
Highwood’s vintage store offering.
Still, Highwood’s history of offering a
cluster of unique, high quality restau-
rants positions it well in the emerging
retail market where shopping clusters
increasingly seek to “internet proof”
their attraction by emphasizing dining
and entertainment that cannot be sold
on the internet.
New development responds to this
change in the retail environment by:
Focusing on recruiting stores
that thoroughly use both “bricks
and clicks” channels by accepting
internet pick-up and return in stores.
Demolishing buildings with obsolete
shopping and dining configurations
to accommodate new formats.
Creating true neighborhood centers
by integrating office, recreation,
and classroom uses into the ground
floor commercial space.
Replacing parking minimums with
utilization studies that often verify
over-parked conditions and thereby
free space for flexible event space
and landscaping.
Consolidating parking so tenants
share all spaces in a manner that
respects the time-of-day utilization
associated with customer utilization.
The Highwood TOD market spans a
very competitive regional shopping area
where the full range of national high
volume tenants has locations. Figure
3.7 compares the retail restaurant and
grocery sales in the communities of
Highwood, Highland Park, and Lake
Forest to their respective spending pow-
er for restaurants and grocery stores.
ResidentRestaurant
Spending
Highwood’s history of offering a cluster of unique, high quality restaurants positions it well in the emerging retail market where shopping clusters increasingly seek to “in-ternet proof” their attraction by emphasizing dining and entertainment.
FIGURE 3.7
SUB-REGIONAL CAPTURE RATES
Highwood
Highland Park
Lake Forest
Total
$5,310,119
$43,089,995
$26,996,012
$75,366,126
Source: Illinois Department of Revenue Sales Tax Report; Experian, 2013; BDI
RestaurantSales
$19,984,882
$56,729,463
$31,729,109
$108,443,454
CaptureRate3
376.4%
131.7%
117.7%
143.9%
GrocerySpending
$8,550,192
$65,730,501
$41,134,594
$115,415,287
GrocerySales
$5,172,898
$82,588,443
$58,551,735
$146,313,076
CaptureRate
60.5%
125.6%
142.3%
126.8%
Category Sales divided by spending calculates the capture rate. This calculation is also referred to as “Market Share.” Percentages in excess of 100% show that the sales are obtained by a larger geography than the community.
3
Downtown Highwood’s vibrant restaurant market, including The Toad Stool, Buffo’s, and Miramar, contributes to the City’s signifcantly higher restaurant capture rate (376.4%)
compared to neighboring Highland Park (131.7%) and Lake Forest (117.7%).

DRAFT - FOR REVIEW PURPOSES ONLY | Last Revised: October 22, 2013
Downtown Assessment Report | Highwood Downtown TOD Plan | 19
Market Assessment | 3
Capture rates above resident spend-
ing illustrate the attraction power of
existing businesses. Customers from
other communities are spending in
this sub-region and thereby driving
sales above the spending power of the
sub-region communities. Note that
Lake Forest’s restaurant spending is sig-
nificantly impacted by sales from the top
performing Oasis in the Illinois Tri-State
Toll Way system. Therefore, the restau-
rant sales in Lake Forests overstate the
sales of traditional offerings.
Downtown Highwood’s performance
within the sub-region is revealed by the
table in Figure 3.8 that examines restau-
rant market share capture rates for its
logical markets.
This very strong capture rate for the
5-minute drive time illustrates High-
wood’s dominance of the local restau-
rant scene. The ability to grow that
cluster is confirmed by the size of the
15-minute drive time market. Any
restaurant targeting sales of $1.2 million
needs only to capture 1% of that mar-
ket. With Highwood’s strong reputation
for quality restaurants, new entrants
with a top quality offering benefit from
joining the cluster because their target
market sees them on visits to other top
quality restaurants.
The key to reinforcing Highwood’s
unique regional identity is increasing
the sales of existing businesses to make
them more profitable and thereby to
encourage additional restaurants and
unique retailers to join the cluster.
Examining the current footprint of
commercial properties south of North
Avenue and north of Prairie Avenue and
along Sheridan Road and Green Bay
Road reveals that there is significant
opportunity to expand without incurring
the high cost of building new space.
Existing properties offer approximately
200,000 square feet of ground floor
space. The targeted unique businesses
that would add to Highwood’s market
advantage average approximately
2,000 square feet each, therefore, that
space could accommodate about 100
store and restaurant businesses. The
Commercial Inventory of Downtown
Highwood provided in the Redevelop-
ment Potential of Highwood City Hall
Site study documents 44 restaurants
and stores with the balance of the space
accommodating 40 offices and services.
That calculation suggests that, although
there are opportunities for site redevel-
opment, the future success of Down-
town Highwood does not require expan-
sion beyond this core area. If 150,000
square feet were sales tax generating
to allow for the hair care and other
personal services that enhance the mix,
and sales in these businesses just met
the national average of $300 per square
foot, sales would be $45 million. 2012
Eating and Drinking and Drugs and
Miscellaneous retail sales in Highwood
were $32 Million. These estimates
suggest that improving the sales of ex-
isting businesses, filling vacancies, and
moving services to upper story space
could increase sales by $13 million and
add as much as $300,000 in municipal
and home rule sales tax revenue.
The very strong capture rate for the 5-minute drive time illustrates Highwood’s dominance of the local restaurant scene. The key to reinforcing Highwood’s unique re-gional identity is increasing the sales of existing business-es to make them more profitable and encourage addi-tional restaurants and unique retailers to join the cluster.
FIGURE 3.8
MARKET SHARE CAPTURE RATES
Estimated sales assuming 150,000 sq ft of Downtown Highwood’s existing retail space were sales tax generating busi-nesses that met the national average of $300 per sq ft in sales
$45 million
Estimated retail sales of 2012 Eating and Drinking and Drugs and Miscellaneous retail sales in Highwood
$32 million
Estimated increase in sales of existing businesses in Downtown Highwood and new businesses that fill vacancies
$13 million
Estimated additional municipal and home rule sales tax revenue
$300,000
RestaurantsSpending
Highwood
1/2-Mile Radius
5 Minute Drive Time
15 Minute Drive Time
30 Minute Drive Time
$5,277,547
$5,444,912
$17,113,697
$120,038,307
$1,036,924,857
Source: Experian, 2013
HighwoodSales
$19,984,882
$19,984,882
$19,984,882
$19,984,882
$19,984,882
MarketShare
378.7%
367.0%
116.8%
16.6%
1.9%
Last Revised: October 22, 2013 | DRAFT - FOR REVIEW PURPOSES ONLY
| Highwood Downtown TOD Plan | Downtown Assessment Report20
3 | Market Assessment
RESIDENTIAL OPPORTUNITIES
The recently completed City Hall site
study provides a wealth of documenta-
tion for Downtown Highwood’s residen-
tial market. That study summarized its
findings thusly:
Multifamily residential units would
be appropriate as part of a mixed-
use development with ground floor
commercial space. New, quality
residential units will bring more ac-
tivity to Downtown Highwood and
help support the retail and restau-
rants. The condominium market,
however, is still years from a full
recovery. Quality rental apartments
targeting younger working house-
holds, divorced parents, and other
small households would be more
appropriate for the City Hall site.
These additional recommendations still
apply:
Multifamily residential units would
be appropriate for (Downtown
Highwood) site(s) as part of a
mixed-use development with
ground floor commercial space.
New, quality residential units will
bring more activity to Downtown
Highwood and help support the
retail and restaurants.
The condominium market, howev-
er, is still years from a full recovery.
Despite low mortgage rates, neither
downsizing empty nesters nor
younger households are choos-
ing to buy condominiums in large
numbers. The City Hall site should
not be considered for condominium
development until more prominent
sites that could command higher
prices are successfully developed,
such as the second tower of the
Ravines or the proposed condo-
minium adjacent to the Highland
Park Theater.
Quality apartments targeting
younger households would be more
appropriate for the City Hall site in
the near term. A local residential
broker described Highwood as “the
Wrigleyville of the North Shore,”
indicating its attractiveness to
younger households who enjoy the
area’s entertainment and dining
venues. Proximity to the Metra
station provides access to North
Shore employment centers, such
as Highland Park Hospital and
Lake Forest College, as well as to
Evanston and Downtown Chicago.
Divorced parents seeking proximity
to their children might be another
source of demand for these units.
Given the significant need for day-
time population and the communi-
ty’s stated desire to avoid additional
rental residential, a priority for office
development over residential devel-
opment is appropriate.
MARKET ASSESSMENTSUMMARY
Highwood is a unique market with a
history that supports a focus on dining
and entertainment that could appeal
to markets associated with younger
populations, “internet proof” restaurant
concepts, and tech data center/offices.
The challenge is building the ideal mar-
ket to successfully maintain Highwood’s
very desirable market position. High-
wood’s small footprint in this sub-re-
gional market makes it challenging to
add the needed daytime population on
the limited redevelopment sites. Future
elements of this study will look at meet-
ing that challenge by careful evaluation
of the mix of uses on development sites.
A focus on improving the sales volume
of existing businesses does not preclude
adding destination stores and restau-
rants in new development at sites on
the perimeter of Downtown Highwood’s
vintage core. Rather, the emphasis is
on understanding what value new ten-
ants, whether office or sales tax gener-
ating, add to the market before commit-
ting community financial resources.
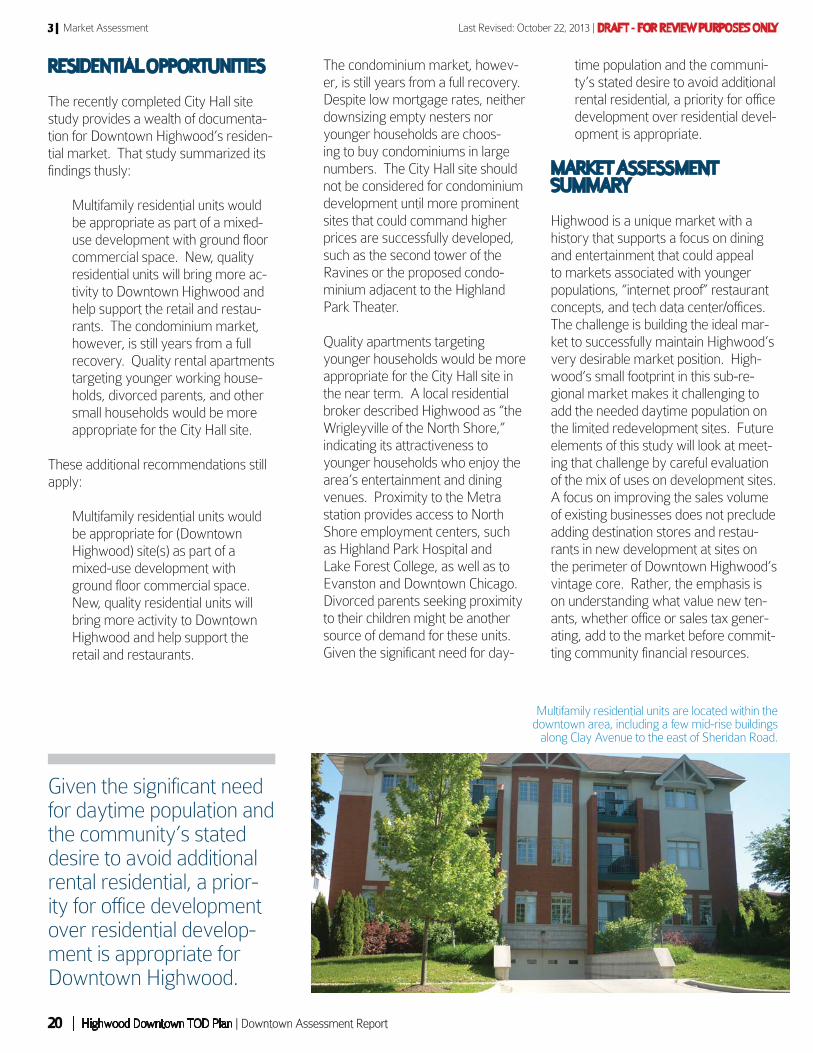
Given the significant need for daytime population and the community’s stated desire to avoid additional rental residential, a prior-ity for office development over residential develop-ment is appropriate for Downtown Highwood.
Multifamily residential units are located within the downtown area, including a few mid-rise buildings
along Clay Avenue to the east of Sheridan Road.

DRAFT - FOR REVIEW PURPOSES ONLY | Last Revised: October 22, 2013
Downtown Assessment Report | Highwood Downtown TOD Plan | 21
STREETSCAPEASSESSMENT
SECTION 4
The physical environment of Downtown Highwood
projects the community’s image. The streetscape
must support this image, including functional needs and
the ability to convey community character and image.
The streetscape supports active downtown uses such
as shops, restaurants, transit centers, open spaces, and
homes with interconnected walks, available parking,
well defined roadways, and crossings. Highwood’s
downtown is unique due to its well-attended commu-
nity events and festivals. As a result, the streetscape is
challenged to support the dramatic increase of pedes-
trians, motorists, and transit riders who are drawn to
Highwood from surrounding communities.
Highwood’s streetscape is well-established in some
locations. However opportunities exist to enhance and
expand that image to other spaces, increasing Down-
town’s effectiveness as a major North Shore destina-
tion for shopping, dining, and seasonal festivals.
This plan will find solutions that address the City’s
streetscape as a major festival destination, including:
1. Near term treatments, such as seasonal plantings,
public art, decorative lighting, and signage;
2. Expanded on street and off street parking;
3. Treatments that define the Downtown via high to
low intensity treatments which unify but differenti-
ate various downtown subareas; and
4. Streetscape amenities that are flexible to accom-
modate daily use, but also expandable to support
community events.

Last Revised: October 22, 2013 | DRAFT - FOR REVIEW PURPOSES ONLY
| Highwood Downtown TOD Plan | Downtown Assessment Report22
4 | Streetscape Assessment
STREETSCAPE PRESENTS A POSITIVE COMMUNITY IMAGE
Streetscape treatments along Sheridan Road include on street parking, curb bump outs, orna-mental lighting, street trees, raised curb planters, and decorative paving. These elements define the public way and sidewalk café areas.
STRENGTH
OPPORTUNITIES
Although the Comprehensive Plan addresses long range streetscape opportunities, Highwood should consider long range and near term opportunities that support down-town when in “festival mode”. This may include additional decorative lighting, public art installations, and seasonal landscaping. For example, art installations may explore the potential for the City to partner with world renowned sculptors Omri Amrany and Julie Rotblatt-Amrany -- who operate their studio in High-wood and are known for statues of iconic sports figures in Chicago and other cities -- to provide a series of sculptures along the downtown streetscape.
Highwood should consider expand-ing the streetscape to other down-town locations, such as Green Bay Road, north and south portions of downtown, alleyways, and building rears. Although the Comprehensive Plan recommends burying utilities along Green Bay Road, the City may consider working with property owners to relocate overhead utilities to building rears to minimize cost and provide streetscape enhance-ments.
A unique opportunity that the City has begun to explore is the potential to partner with world
renowned and Highwood-based sculptors Omri Amrany and Julie Rotblatt-Amrany to create a
series of sculptures along the downtown street-scape, particularly at intersections . Their
work includes statues for Chicago sports figures like Michael Jordan at the United Center, George Halas at Soldier Field, and Harry
Caray at Wrigley Field, to name a few.
Curb bump outs define on street park-ing and provide outdoor seating areas.
Landscape bollards, tables, and chairs may be further augmented with plantings and
decorative lighting during the outdoor din-ing and festival seasons. City standard
streetscape treatments may be expanded to Green Bay Road, the south end of which
is an active restaurant and sidewalk café environment. Decorative acorn style
light poles with banners and flags may be further enhanced with additional decorative
lighting, such as Tivoli Lights, to reflect a festival environment.
5
76
5
6
7
1
2
3 4
1
2
4
3
DRAFT - FOR REVIEW PURPOSES ONLY | Last Revised: October 22, 2013
Downtown Assessment Report | Highwood Downtown TOD Plan | 23
Streetscape Assessment | 4
PUBLIC OPEN SPACE ENHANCES THE CITY
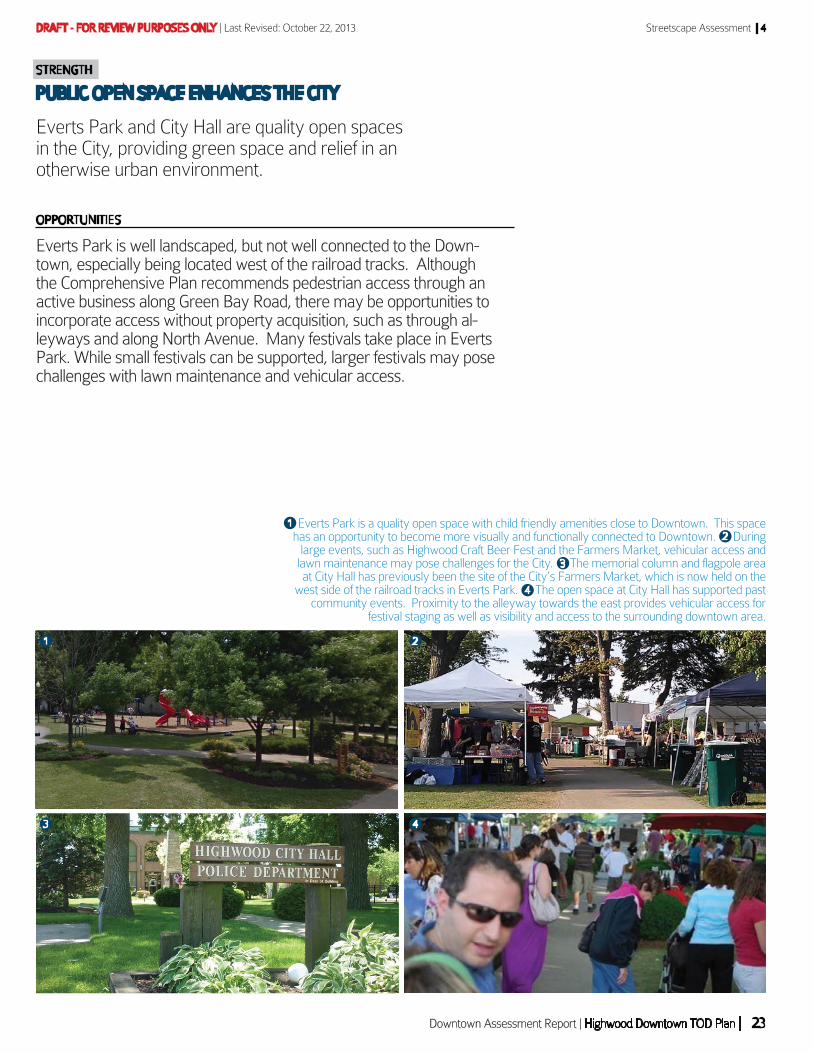
Everts Park and City Hall are quality open spaces in the City, providing green space and relief in an otherwise urban environment.
STRENGTH
OPPORTUNITIES
Everts Park is well landscaped, but not well connected to the Down-town, especially being located west of the railroad tracks. Although the Comprehensive Plan recommends pedestrian access through an active business along Green Bay Road, there may be opportunities to incorporate access without property acquisition, such as through al-leyways and along North Avenue. Many festivals take place in Everts Park. While small festivals can be supported, larger festivals may pose challenges with lawn maintenance and vehicular access.
3
Everts Park is a quality open space with child friendly amenities close to Downtown. This space has an opportunity to become more visually and functionally connected to Downtown. During
large events, such as Highwood Craft Beer Fest and the Farmers Market, vehicular access and lawn maintenance may pose challenges for the City. The memorial column and flagpole area at City Hall has previously been the site of the City’s Farmers Market, which is now held on the
west side of the railroad tracks in Everts Park. The open space at City Hall has supported past community events. Proximity to the alleyway towards the east provides vehicular access for
festival staging as well as visibility and access to the surrounding downtown area.
4
1 2
1
2
3
4
Last Revised: October 22, 2013 | DRAFT - FOR REVIEW PURPOSES ONLY
| Highwood Downtown TOD Plan | Downtown Assessment Report24
4 | Streetscape Assessment
STREETSCAPE SUPPORTS COMMUNITY EVENTS
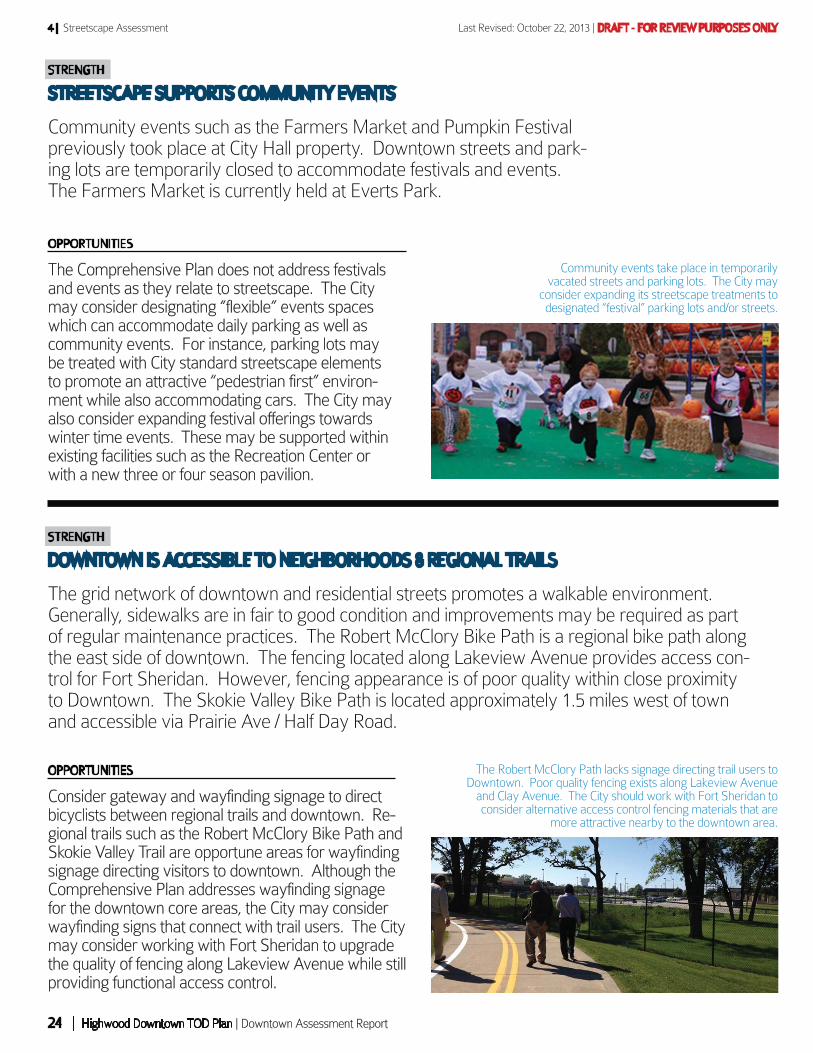
Community events such as the Farmers Market and Pumpkin Festival previously took place at City Hall property. Downtown streets and park-ing lots are temporarily closed to accommodate festivals and events. The Farmers Market is currently held at Everts Park.
STRENGTH
DOWNTOWN IS ACCESSIBLE TO NEIGHBORHOODS & REGIONAL TRAILS
The grid network of downtown and residential streets promotes a walkable environment. Generally, sidewalks are in fair to good condition and improvements may be required as part of regular maintenance practices. The Robert McClory Bike Path is a regional bike path along the east side of downtown. The fencing located along Lakeview Avenue provides access con-trol for Fort Sheridan. However, fencing appearance is of poor quality within close proximity to Downtown. The Skokie Valley Bike Path is located approximately 1.5 miles west of town and accessible via Prairie Ave / Half Day Road.
STRENGTH
OPPORTUNITIES
The Comprehensive Plan does not address festivals and events as they relate to streetscape. The City may consider designating “flexible” events spaces which can accommodate daily parking as well as community events. For instance, parking lots may be treated with City standard streetscape elements to promote an attractive “pedestrian first” environ-ment while also accommodating cars. The City may also consider expanding festival offerings towards winter time events. These may be supported within existing facilities such as the Recreation Center or with a new three or four season pavilion.
OPPORTUNITIES
Consider gateway and wayfinding signage to direct bicyclists between regional trails and downtown. Re-gional trails such as the Robert McClory Bike Path and Skokie Valley Trail are opportune areas for wayfinding signage directing visitors to downtown. Although the Comprehensive Plan addresses wayfinding signage for the downtown core areas, the City may consider wayfinding signs that connect with trail users. The City may consider working with Fort Sheridan to upgrade the quality of fencing along Lakeview Avenue while still providing functional access control.
Community events take place in temporarily vacated streets and parking lots. The City may
consider expanding its streetscape treatments to designated “festival” parking lots and/or streets.
The Robert McClory Path lacks signage directing trail users to Downtown. Poor quality fencing exists along Lakeview Avenue
and Clay Avenue. The City should work with Fort Sheridan to consider alternative access control fencing materials that are
more attractive nearby to the downtown area.

DRAFT - FOR REVIEW PURPOSES ONLY | Last Revised: October 22, 2013
Downtown Assessment Report | Highwood Downtown TOD Plan | 25
Streetscape Assessment | 4
TRANSIT INFRASTRUCTURE IS IN PLACE
Metra is located in the heart of downtown and includes high quality building archi-tecture and platforms. Platforms are flanked on the east and west sides by orna-mental access control fencing. While the fencing promotes safety at the railroad crossings and controls pedestrian movements between platforms and downtown uses, it also inhibits pedestrian access to other surrounding downtown areas.
Pace service is provided on Green Bay Road and Sheridan Road. A Pace shel-ter exists on Green Bay Road nearby to the Metra Station. However this shelter lacks crosswalks and sidewalks to connect to uses along Green Bay Road.
STRENGTH
OPPORTUNITIES
The Comprehensive Plan does not address access control fencing. The City may consider working with Metra and the UP Railroad to identify ways to accommodate safe pedestrian connectivity between the train platforms and the core downtown area. The Comprehensive Plan addresses a proposed crosswalk at North Avenue. Additional sidewalks and streets-cape at the west side of the Pace shelter may be considered to further promote transit use in Downtown Highwood.
Metra station architecture is high quality, however the areas surrounding the station area are visually and
physically disconnected from the Downtown. The Pace bus shelter presents an opportunity for improved
pedestrian crossings at North Avenue. Pedestrian access between the Metra station and surroundings is
limited by ornamental access control fencing locat-ed along the east and west sides of the platforms.
Although access control is a critical safety concern in Downtown, an opportunity exists to improve pedestrian
connectivity to and from the train station via strategic openings in the fence, such as at North Avenue and
select locations near eastern parking lot areas.
2 3
1
1
2
3
Last Revised: October 22, 2013 | DRAFT - FOR REVIEW PURPOSES ONLY
| Highwood Downtown TOD Plan | Downtown Assessment Report26
4 | Streetscape Assessment
STREETSCAPE IS LACKING IN KEYDOWNTOWN AREAS
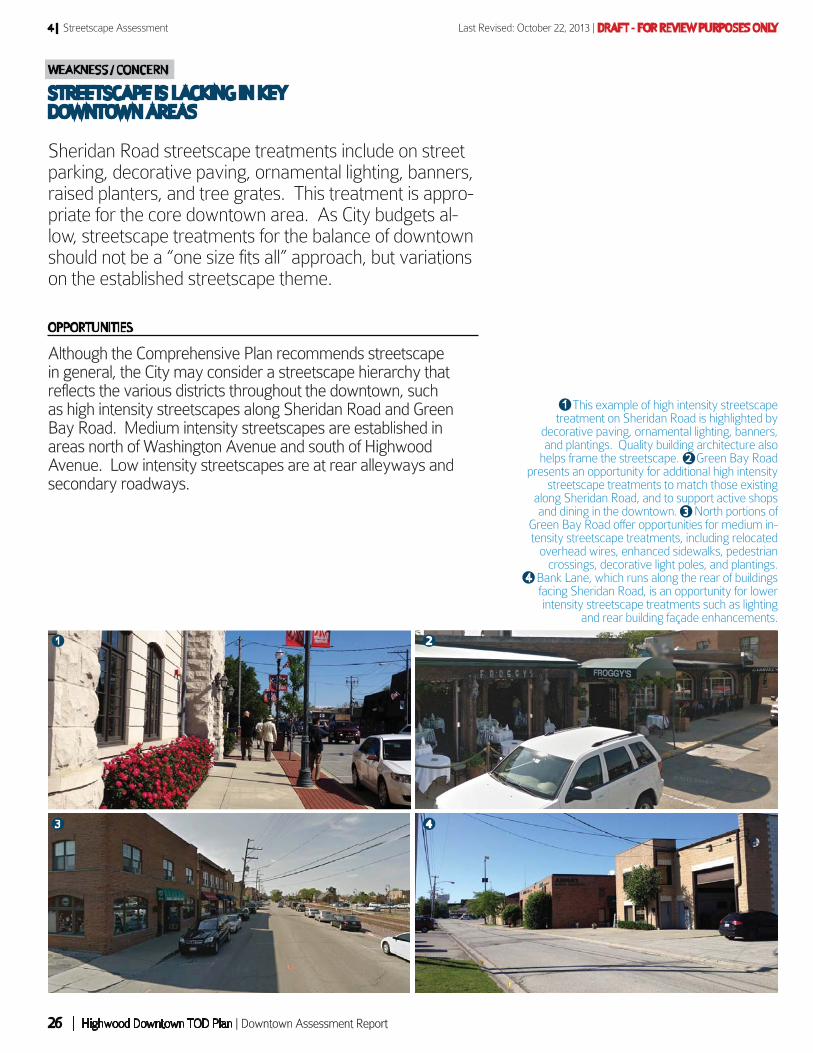
Sheridan Road streetscape treatments include on street parking, decorative paving, ornamental lighting, banners, raised planters, and tree grates. This treatment is appro-priate for the core downtown area. As City budgets al-low, streetscape treatments for the balance of downtown should not be a “one size fits all” approach, but variations on the established streetscape theme.
WEAKNESS / CONCERN
OPPORTUNITIES
Although the Comprehensive Plan recommends streetscape in general, the City may consider a streetscape hierarchy that reflects the various districts throughout the downtown, such as high intensity streetscapes along Sheridan Road and Green Bay Road. Medium intensity streetscapes are established in areas north of Washington Avenue and south of Highwood Avenue. Low intensity streetscapes are at rear alleyways and secondary roadways.
This example of high intensity streetscape treatment on Sheridan Road is highlighted by
decorative paving, ornamental lighting, banners, and plantings. Quality building architecture also
helps frame the streetscape. Green Bay Road presents an opportunity for additional high intensity
streetscape treatments to match those existing along Sheridan Road, and to support active shops and dining in the downtown. North portions of
Green Bay Road offer opportunities for medium in-tensity streetscape treatments, including relocated
overhead wires, enhanced sidewalks, pedestrian crossings, decorative light poles, and plantings.
Bank Lane, which runs along the rear of buildings facing Sheridan Road, is an opportunity for lower intensity streetscape treatments such as lighting
and rear building façade enhancements.
3 4
1 2
1
2
3
4
DRAFT - FOR REVIEW PURPOSES ONLY | Last Revised: October 22, 2013
Downtown Assessment Report | Highwood Downtown TOD Plan | 27
Streetscape Assessment | 4
PARKING IS NOT WELL DEFINED
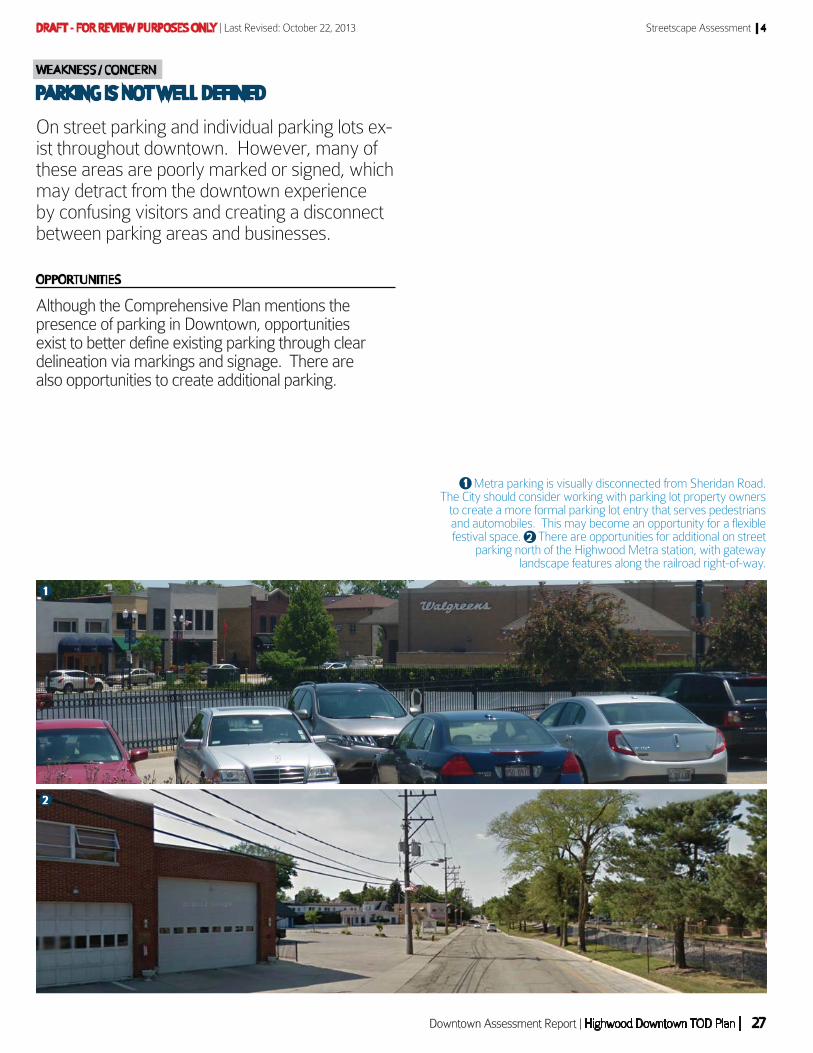
On street parking and individual parking lots ex-ist throughout downtown. However, many of these areas are poorly marked or signed, which may detract from the downtown experience by confusing visitors and creating a disconnect between parking areas and businesses.
WEAKNESS / CONCERN
OPPORTUNITIES
Although the Comprehensive Plan mentions the presence of parking in Downtown, opportunities exist to better define existing parking through clear delineation via markings and signage. There are also opportunities to create additional parking.
Metra parking is visually disconnected from Sheridan Road.The City should consider working with parking lot property owners
to create a more formal parking lot entry that serves pedestrians and automobiles. This may become an opportunity for a flexible festival space. There are opportunities for additional on street
parking north of the Highwood Metra station, with gatewaylandscape features along the railroad right-of-way.
2
1
1
2

Last Revised: October 22, 2013 | DRAFT - FOR REVIEW PURPOSES ONLY
| Highwood Downtown TOD Plan | Downtown Assessment Report28
4 | Streetscape Assessment
EAST AND WEST DOWNTOWN AREASARE DIVIDED BY THE RAILROAD
Highwood is a downtown divided by the Union Pa-cific railroad tracks. This is a challenge, especially for those “one sided” retail businesses along Green Bay Road. At grade crossings exist at Highwood Avenue and Washington Avenue, which limit connectivity between east and west. Furthermore, the businesses along Green Bay Road generally look upon the rear sides of businesses east of the tracks.
WEAKNESS / CONCERN
OPPORTUNITIES
Although the Comprehensive Plan addresses the one sided nature of businesses in downtown, streetscape solutions were not provided to alleviate this. Highwood’s streetscape can serve to visually unify east and west halves of down-town. Tall vertical elements, visible from opposite sides of the tracks, such as signage, lighting, and public art, will help to visually connect downtown as one unified district.
Existing views looking south from Green Bay Road towards the railroad and building rears to the east. This view should
be improved to promote a visual connection between Green Bay Road and the east portion of downtown.

DRAFT - FOR REVIEW PURPOSES ONLY | Last Revised: October 22, 2013
Downtown Assessment Report | Highwood Downtown TOD Plan | 29
Streetscape Assessment | 4
STREETSCAPE LACKS VISUAL &FUNCTIONAL CONNECTIVITY
Active centers in the downtown include the Metra station, Everts Park, and restaurants. While sidewalk connectivity is well defined along Sheridan Road and Green Bay Road, pedestrian connections are lacking in the east-west direction, in part due to the railroad tracks and limited at-grade crossings.
WEAKNESS / CONCERN
OPPORTUNITIES
The Comprehensive Plan identifies a railroad pedestrian crossing at North Avenue. Another at-grade railroad cross-ing is located at the south end of the Metra platforms in between North Avenue and Highwood Avenue. Two addi-tional crossings exist at Highwood Avenue and Washington Avenue. These pedestrian crossings are supported to re-main in place, particularly given the crossing safety features that are in place per the Illinois Commerce Commission. Improved railroad crossings such as upgraded rail crossings, pedestrian crossing beacons, and lighted pedestrian cross-ing pavements are recommended, where applicable and supported by the City and UP Railroad.
The City is encouraged to add enhanced pedestrian crossings at
North Avenue and Green Bay Road to support Pace and Metra uses.
Improved visibility and access between Everts Park and Green
Bay Road would help promote the park as a destination in downtown,
including this view corridor between the park and Metra station.
2
1
1
2

Last Revised: October 22, 2013 | DRAFT - FOR REVIEW PURPOSES ONLY
| Highwood Downtown TOD Plan | Downtown Assessment Report30
4 | Streetscape Assessment
PERIMETER ENTRANCES TO DOWNTOWN &WAYFINDING SIGNAGE ARE NOT WELL DEFINED
The north and south entries to downtown are general-ly marked by a change in land use and building form, transitioning from residential to commercial.
WEAKNESS / CONCERN
OPPORTUNITIES
While the Comprehensive Plan identifies a need for gateway treatments at downtown entrances, the City may consider coordinating with IDOT and the City of Highland Park on a joint signage program along Route 41 as it is a major gateway from the west. As well, the City may consider a hierarchy of gateway treatments that respond to building form. For instance, gateway treatments at Green Bay Road and Prairie Ave should be auto oriented. While gateway treatments within the core Downtown should be pedestrian oriented.
Although a modest sign faces eastbound drivers along Prairie Avenue, appropriately scaled signage is lacking for northbound
visitors along Green Bay Road, as this image depicts.
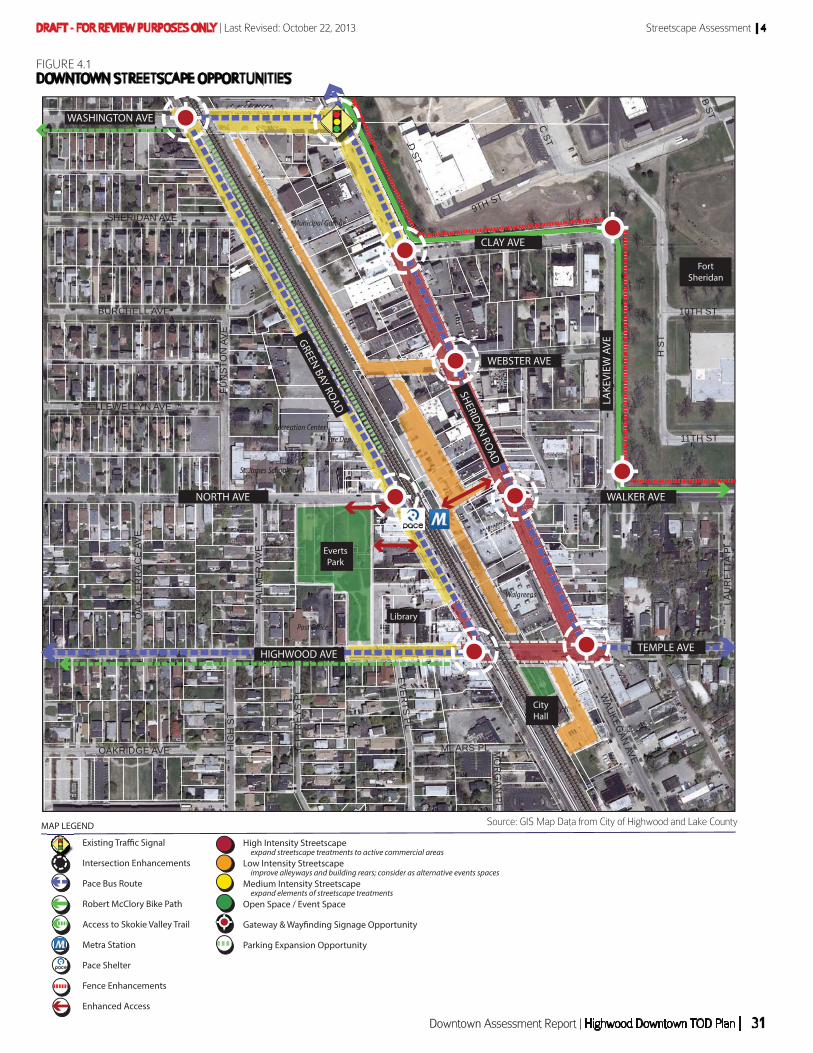
DRAFT - FOR REVIEW PURPOSES ONLY | Last Revised: October 22, 2013
Downtown Assessment Report | Highwood Downtown TOD Plan | 31
Streetscape Assessment | 4
H S
T
GREEN BAY RD
9TH ST
HIGHWOOD AVE
BANK LN
SHERIDAN RD
NORTH AVE
D ST
CLAY AVE
WAUKEG
AN AVE
HIG
H S
T
C ST
WALKER AVE
LAK
E V
IEW
AV
E
WEBSTER AVE
WASHINGTON AVE
BURCHELL AVE
EVERTS
PL
SHERIDAN AVEFU
NS
TON
AV
E
OAKRIDGE AVE
TEMPLE AVE
PALM
ER
AV
E
MEARS PLJEFF
RE
YS
PL
LAU
RET
TA P
L
LLEWELLYN AVE
10TH ST
11TH ST
OA
K T
ER
RA
CE
AV
E
B ST
MO
RG
AN
PL
0 200 400100Feet
Downtown HighwoodCORE DOWNTOWN AREAHighwood Downtown TOD Plan // September 11, 2013
SSHERIDAN RD
RRSHERRIDAN R
D
BANK LBANBANK LBANK LBANK LNNNNN
KL
ANKNANN
BANBANBB
HIGHWOOD AVEOOOD AAVEOOD AVEHIGHW
EEEN BAY R
EEN BAY R
EEN BAY RDDD
NBAY
EE
DRDAY
RBAY
NB
EENE
HIGHWOOD AVE
NORTH AVE
TEMPLE AVE
WALKER AVE
WEBSTER AVE
CLAY AVE
WASHINGTON AVE
EvertsPark
CityHall
Library
SHERIDAN ROAD
GREEN BAY ROAD LAKE
VIEW
AVE
FortSheridan
High Intensity Streetscape
Low Intensity Streetscape
Medium Intensity Streetscape
Open Space / Event Space
Gateway & Wayfinding Signage Opportunity
Parking Expansion Opportunity
MAP LEGEND
Existing Traffic Signal
Intersection Enhancements
Pace Bus Route
Robert McClory Bike Path
Access to Skokie Valley Trail
Metra Station
Pace Shelter
Fence Enhancements
Enhanced Access
expand streetscape treatments to active commercial areas
improve alleyways and building rears; consider as alternative events spaces
expand elements of streetscape treatments
FIGURE 4.1
DOWNTOWN STREETSCAPE OPPORTUNITIES
Source: GIS Map Data from City of Highwood and Lake County

Last Revised: October 22, 2013 | DRAFT - FOR REVIEW PURPOSES ONLY
| Highwood Downtown TOD Plan | Downtown Assessment Report32
4 | Streetscape Assessment
This page intentionally left blank for double-sided printing.
DRAFT - FOR REVIEW PURPOSES ONLY | Last Revised: October 22, 2013
Downtown Assessment Report | Highwood Downtown TOD Plan | 33
BRANDING & IMAGEASSESSMENT
SECTION 5
Today, Highwood appears to have two distinctive iden-
tities. The first revolves around its Downtown, which
is highly regarded as one of the North Shore’s premier
dining and entertainment destinations. Downtown
Highwood creates tremendous goodwill for the City
as visitors experience its many attractive features and
activities.
The second identity revolves around its residential
neighborhoods. Many stakeholders interviewed for
this project suggested that the collective image of High-
wood’s residential neighborhoods does not match the
high regard held for Downtown (due principally to po-
tential code violations and the poor condition of some
properties). However, the neighborhoods’ scale and
character have an undeniable charm that will become
more readily apparent as code issues are addressed
and improvement made over time.
The good news is that Highwood has many oppor-
tunities to leverage key assets -- particularly those of
Downtown -- to enhance the image and identity of the
entire community.
The following pages include observations about both
the strengths and weaknesses of Highwood’s existing
image, and the opportunities that correspond to each.
Of these, three in particular stand out as potential short,
intermediate, and long term opportunities to strengthen
perceptions of Highwood.

Last Revised: October 22, 2013 | DRAFT - FOR REVIEW PURPOSES ONLY
| Highwood Downtown TOD Plan | Downtown Assessment Report34
5 | Branding & Image Assessment
The short term opportunity is to feature
the existing “Celebrate Highwood” logo
as the City’s primary identifier. Current-
ly the City, Highwood Historical Society,
and Highwood Chamber of Commerce
all have separate identities. Having
these and possibly other organizations
use the “Celebrate Highwood” logo as
either a principle or “endorsing” iden-
tifier will help the City present a more
unified identity to outside audiences.
The intermediate opportunity is to ex-
plore the potential of creating a special
name for Downtown (perhaps referenc-
ing its historical legacy). In this scenario,
the “Celebrate Highwood” logo would
be used in conjunction with the special
name as an “endorsing identifier.” The
goal would be to highlight and feature
what is clearly one of the City’s major
strengths -- Downtown -- while its
residential neighborhoods continue to
undergo improvements that elevate
their image over time.
The long term opportunity is to enhance
awareness of Lake Michigan’s close
proximity and strengthen perceptions
that Highwood is a community in which
residents can enjoy a “lakefront life-
style.” The goal is to help Highwood
differentiate itself more clearly from
nearby inland communities, and to
attract the attention and interest of
investors. The absence of a municipal
beach should not inhibit the City from le-
veraging this unique asset. Just as one
does not have to own a boat to enjoy
boating, a community doesn’t have to
have a beach in order for its residents to
enjoy a coastal lifestyle.
In terms of image and identity, High-
wood is at a much higher level than
many Midwestern peer communi-
ties. While limited public resources
are always a challenge in regards
to implementing identity enhancing
development strategies, Highwood is
fortunate to have a marketing savvy
business community that understands
the importance of brand and image.
As Highwood positions itself for future
success, public / private partnerships will
likely plan a critical role in advancing the
City’s brand and marketplace appeal.
The “Celebrate Highwood” logo is prominent in the downtown area, including the promotional Fiat car, which is adjacent to City Hall and steps from shops and restaurants along Sheridan Road.
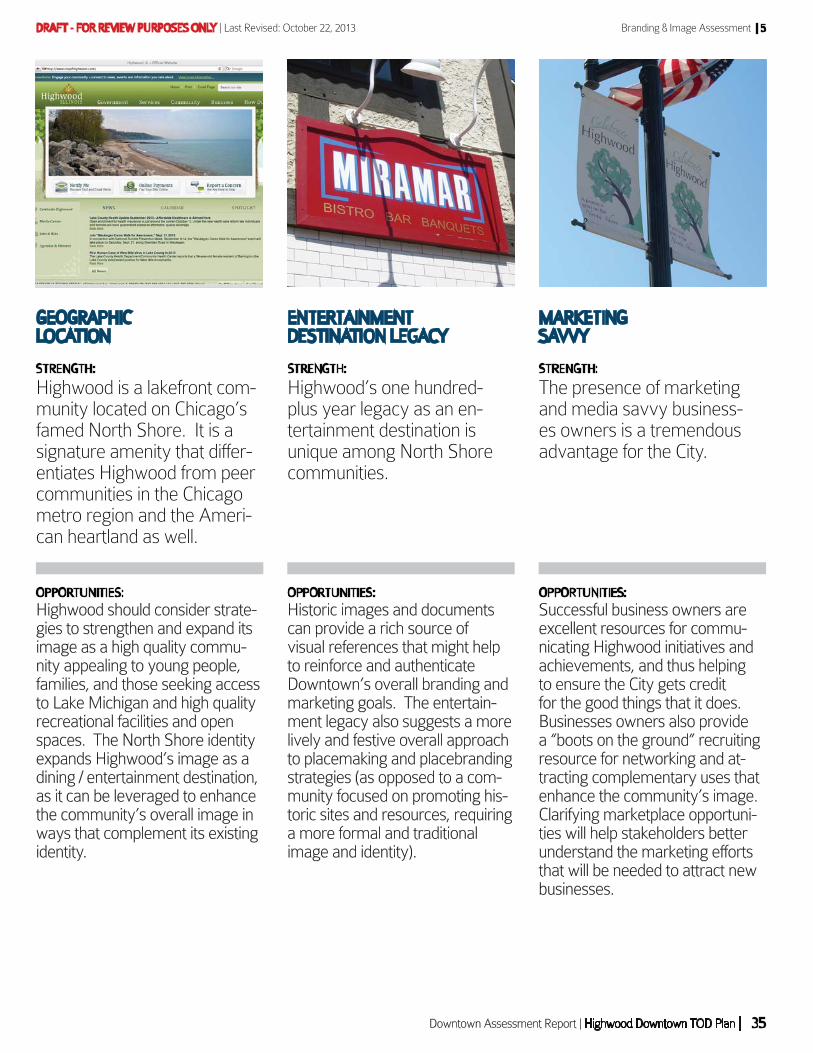
DRAFT - FOR REVIEW PURPOSES ONLY | Last Revised: October 22, 2013
Downtown Assessment Report | Highwood Downtown TOD Plan | 35
Branding & Image Assessment | 5
STRENGTH:
Highwood is a lakefront com-munity located on Chicago’s famed North Shore. It is a signature amenity that differ-entiates Highwood from peer communities in the Chicago metro region and the Ameri-can heartland as well.
OPPORTUNITIES:
Highwood should consider strate-gies to strengthen and expand its image as a high quality commu-nity appealing to young people, families, and those seeking access to Lake Michigan and high quality recreational facilities and open spaces. The North Shore identity expands Highwood’s image as a dining / entertainment destination, as it can be leveraged to enhance the community’s overall image in ways that complement its existing identity.
GEOGRAPHICLOCATION
STRENGTH:
Highwood’s one hundred- plus year legacy as an en-tertainment destination is unique among North Shore communities.
OPPORTUNITIES:
Historic images and documents can provide a rich source of visual references that might help to reinforce and authenticate Downtown’s overall branding and marketing goals. The entertain-ment legacy also suggests a more lively and festive overall approach to placemaking and placebranding strategies (as opposed to a com-munity focused on promoting his-toric sites and resources, requiring a more formal and traditional image and identity).
ENTERTAINMENTDESTINATION LEGACY
STRENGTH:
The presence of marketing and media savvy business-es owners is a tremendous advantage for the City.
OPPORTUNITIES:
Successful business owners are excellent resources for commu-nicating Highwood initiatives and achievements, and thus helping to ensure the City gets credit for the good things that it does. Businesses owners also provide a “boots on the ground” recruiting resource for networking and at-tracting complementary uses that enhance the community’s image. Clarifying marketplace opportuni-ties will help stakeholders better understand the marketing efforts that will be needed to attract new businesses.
MARKETINGSAVVY
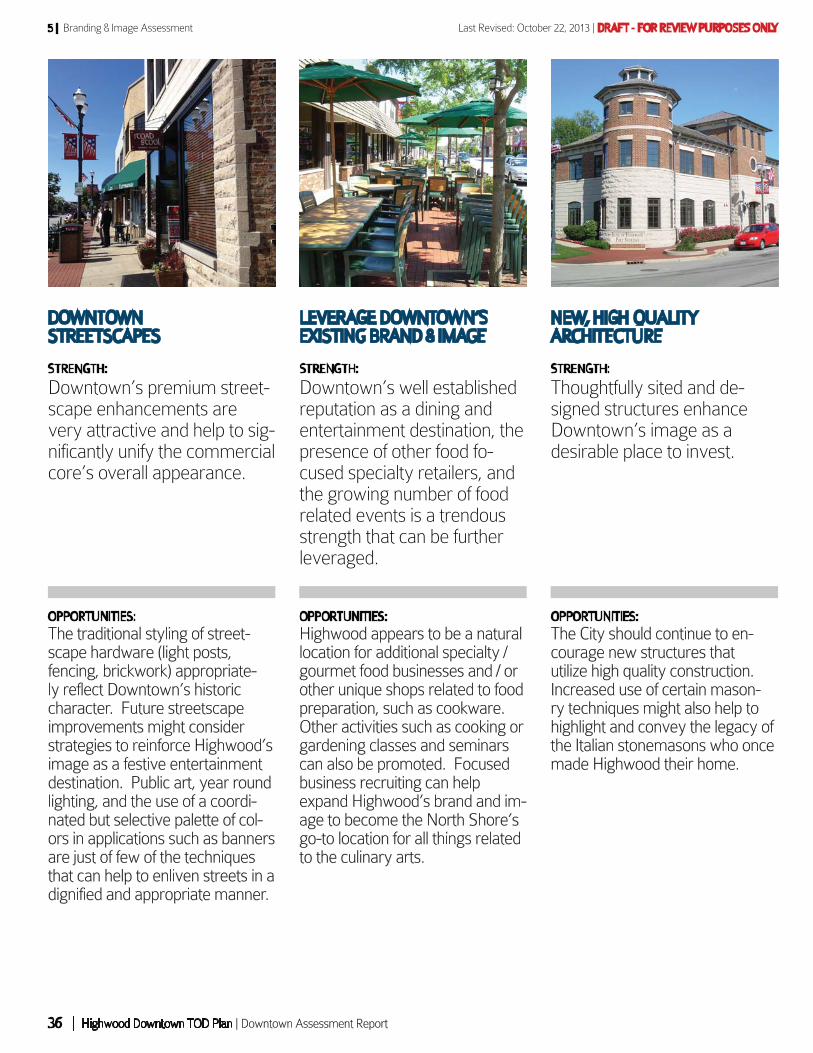
Last Revised: October 22, 2013 | DRAFT - FOR REVIEW PURPOSES ONLY
| Highwood Downtown TOD Plan | Downtown Assessment Report36
5 | Branding & Image Assessment
STRENGTH:
Downtown’s premium street-scape enhancements are very attractive and help to sig-nificantly unify the commercial core’s overall appearance.
DOWNTOWNSTREETSCAPES
OPPORTUNITIES:
The traditional styling of street-scape hardware (light posts, fencing, brickwork) appropriate-ly reflect Downtown’s historic character. Future streetscape improvements might consider strategies to reinforce Highwood’s image as a festive entertainment destination. Public art, year round lighting, and the use of a coordi-nated but selective palette of col-ors in applications such as banners are just of few of the techniques that can help to enliven streets in a dignified and appropriate manner.
STRENGTH:
Downtown’s well established reputation as a dining and entertainment destination, the presence of other food fo-cused specialty retailers, and the growing number of food related events is a trendous strength that can be further leveraged.
LEVERAGE DOWNTOWN’SEXISTING BRAND & IMAGE
OPPORTUNITIES:
Highwood appears to be a natural location for additional specialty / gourmet food businesses and / or other unique shops related to food preparation, such as cookware. Other activities such as cooking or gardening classes and seminars can also be promoted. Focused business recruiting can help expand Highwood’s brand and im-age to become the North Shore’s go-to location for all things related to the culinary arts.
STRENGTH:
Thoughtfully sited and de-signed structures enhance Downtown’s image as a desirable place to invest.
NEW, HIGH QUALITYARCHITECTURE
OPPORTUNITIES:
The City should continue to en-courage new structures that utilize high quality construction. Increased use of certain mason-ry techniques might also help to highlight and convey the legacy of the Italian stonemasons who once made Highwood their home.
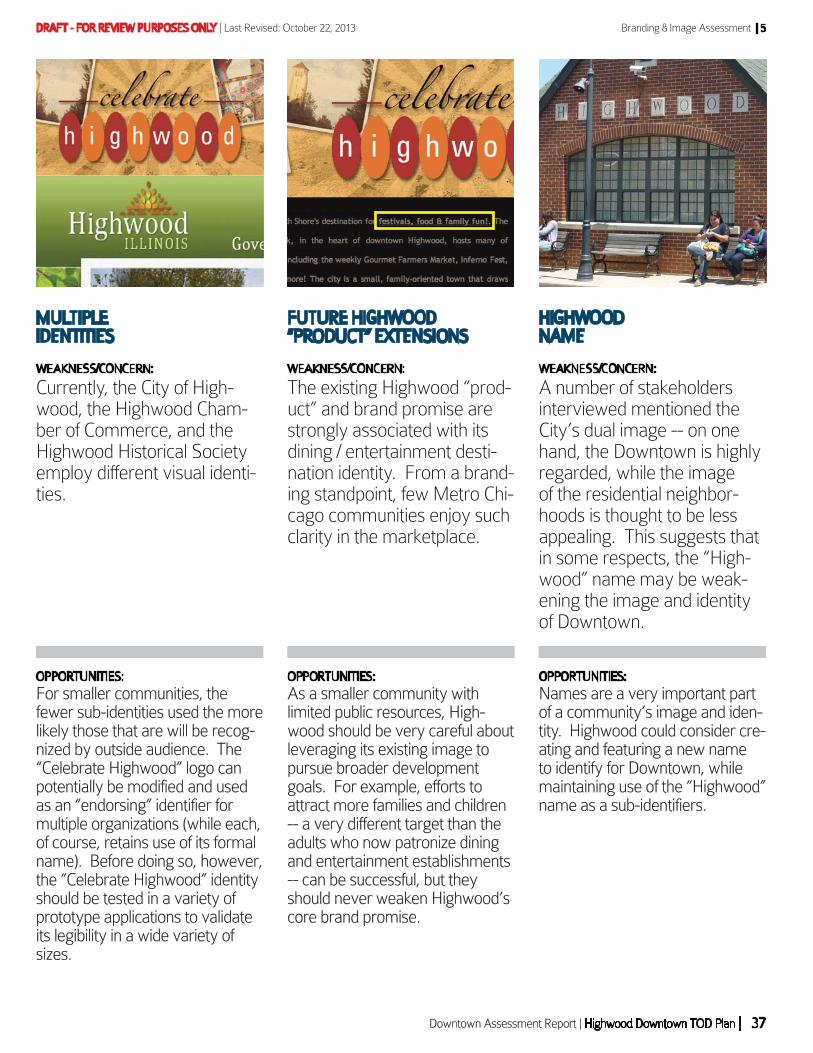
DRAFT - FOR REVIEW PURPOSES ONLY | Last Revised: October 22, 2013
Downtown Assessment Report | Highwood Downtown TOD Plan | 37
Branding & Image Assessment | 5
WEAKNESS/CONCERN:
Currently, the City of High-wood, the Highwood Cham-ber of Commerce, and the Highwood Historical Society employ different visual identi-ties.
MULTIPLEIDENTITIES
OPPORTUNITIES:
For smaller communities, the fewer sub-identities used the more likely those that are will be recog-nized by outside audience. The “Celebrate Highwood” logo can potentially be modified and used as an “endorsing” identifier for multiple organizations (while each, of course, retains use of its formal name). Before doing so, however, the “Celebrate Highwood” identity should be tested in a variety of prototype applications to validate its legibility in a wide variety of sizes.
WEAKNESS/CONCERN:
The existing Highwood “prod-uct” and brand promise are strongly associated with its dining / entertainment desti-nation identity. From a brand-ing standpoint, few Metro Chi-cago communities enjoy such clarity in the marketplace.
FUTURE HIGHWOOD“PRODUCT” EXTENSIONS
OPPORTUNITIES:
As a smaller community with limited public resources, High-wood should be very careful about leveraging its existing image to pursue broader development goals. For example, efforts to attract more families and children -- a very different target than the adults who now patronize dining and entertainment establishments -- can be successful, but they should never weaken Highwood’s core brand promise.
WEAKNESS/CONCERN:
A number of stakeholders interviewed mentioned the City’s dual image -- on one hand, the Downtown is highly regarded, while the image of the residential neighbor-hoods is thought to be less appealing. This suggests that in some respects, the “High-wood” name may be weak-ening the image and identity of Downtown.
HIGHWOODNAME
OPPORTUNITIES:
Names are a very important part of a community’s image and iden-tity. Highwood could consider cre-ating and featuring a new name to identify for Downtown, while maintaining use of the “Highwood” name as a sub-identifiers.
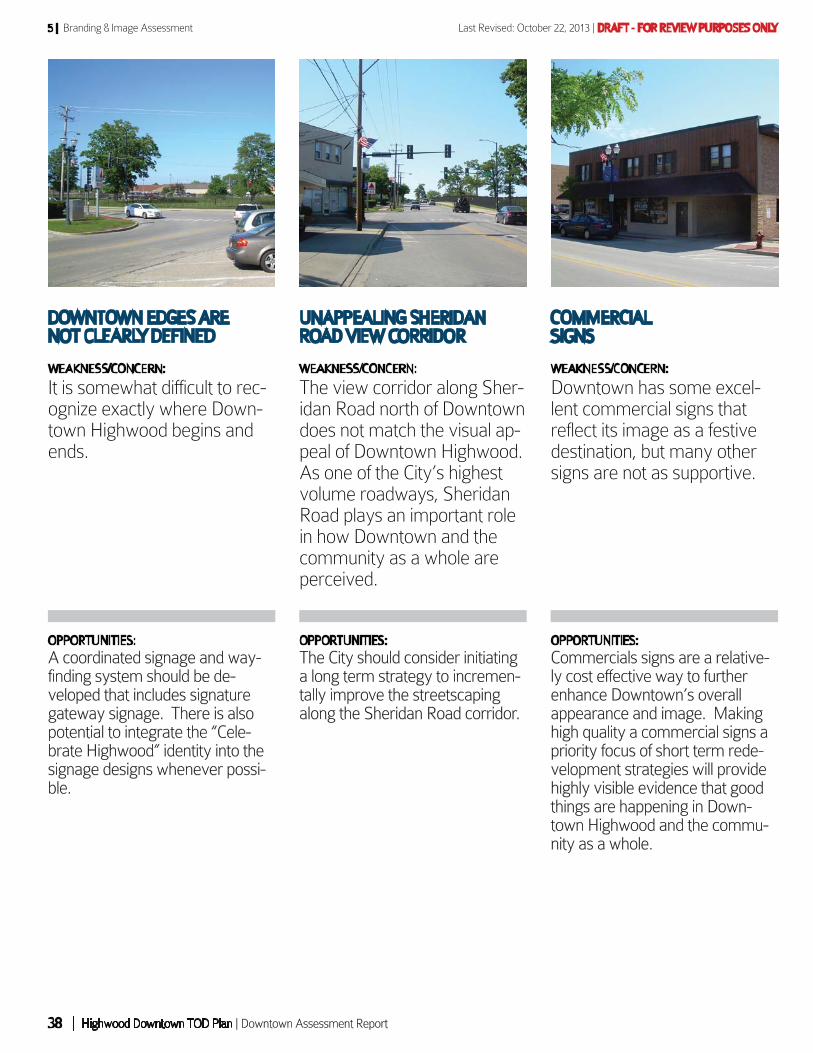
Last Revised: October 22, 2013 | DRAFT - FOR REVIEW PURPOSES ONLY
| Highwood Downtown TOD Plan | Downtown Assessment Report38
5 | Branding & Image Assessment
WEAKNESS/CONCERN:
It is somewhat difficult to rec-ognize exactly where Down-town Highwood begins and ends.
DOWNTOWN EDGES ARENOT CLEARLY DEFINED
OPPORTUNITIES:
A coordinated signage and way-finding system should be de-veloped that includes signature gateway signage. There is also potential to integrate the “Cele-brate Highwood” identity into the signage designs whenever possi-ble.
WEAKNESS/CONCERN:
The view corridor along Sher-idan Road north of Downtown does not match the visual ap-peal of Downtown Highwood. As one of the City’s highest volume roadways, Sheridan Road plays an important role in how Downtown and the community as a whole are perceived.
UNAPPEALING SHERIDAN ROAD VIEW CORRIDOR
OPPORTUNITIES:
The City should consider initiating a long term strategy to incremen-tally improve the streetscaping along the Sheridan Road corridor.
WEAKNESS/CONCERN:
Downtown has some excel-lent commercial signs that reflect its image as a festive destination, but many other signs are not as supportive.
COMMERCIALSIGNS
OPPORTUNITIES:
Commercials signs are a relative-ly cost effective way to further enhance Downtown’s overall appearance and image. Making high quality a commercial signs a priority focus of short term rede-velopment strategies will provide highly visible evidence that good things are happening in Down-town Highwood and the commu-nity as a whole.
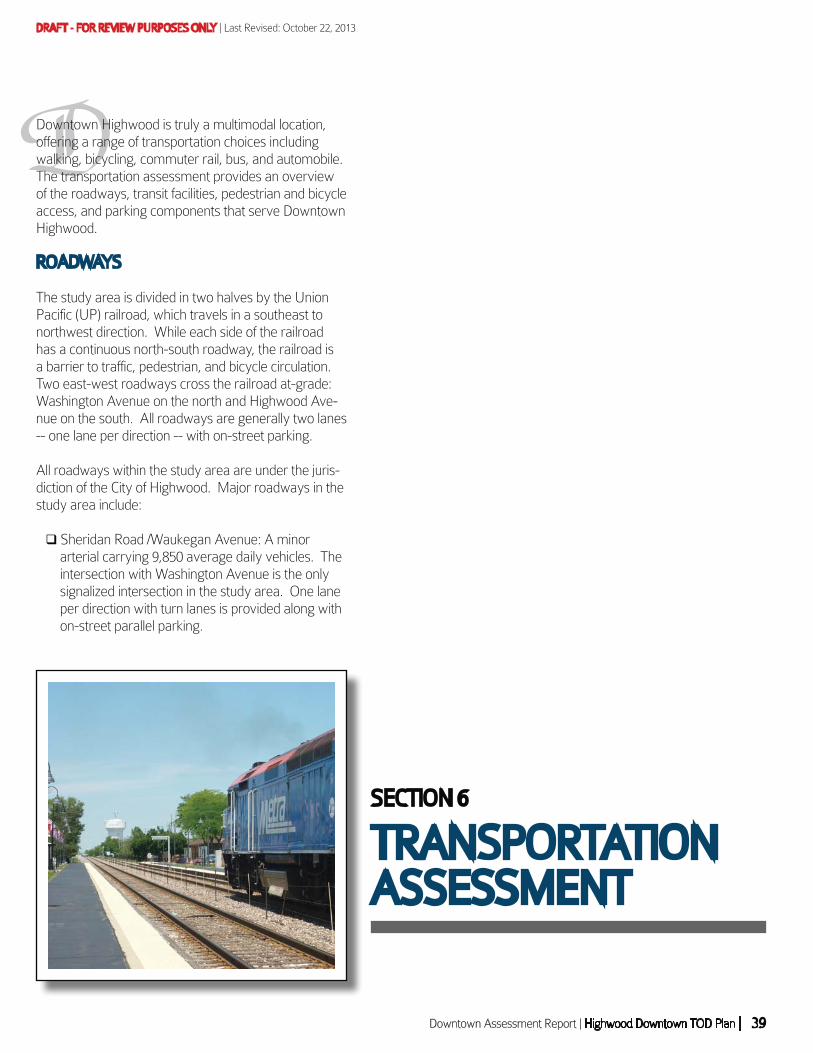
DRAFT - FOR REVIEW PURPOSES ONLY | Last Revised: October 22, 2013
Downtown Assessment Report | Highwood Downtown TOD Plan | 39
TRANSPORTATIONASSESSMENT
SECTION 6
Downtown Highwood is truly a multimodal location,
offering a range of transportation choices including
walking, bicycling, commuter rail, bus, and automobile.
The transportation assessment provides an overview
of the roadways, transit facilities, pedestrian and bicycle
access, and parking components that serve Downtown
Highwood.
ROADWAYS
The study area is divided in two halves by the Union
Pacific (UP) railroad, which travels in a southeast to
northwest direction. While each side of the railroad
has a continuous north-south roadway, the railroad is
a barrier to traffic, pedestrian, and bicycle circulation.
Two east-west roadways cross the railroad at-grade:
Washington Avenue on the north and Highwood Ave-
nue on the south. All roadways are generally two lanes
-- one lane per direction -- with on-street parking.
All roadways within the study area are under the juris-
diction of the City of Highwood. Major roadways in the
study area include:
Sheridan Road /Waukegan Avenue: A minor
arterial carrying 9,850 average daily vehicles. The
intersection with Washington Avenue is the only
signalized intersection in the study area. One lane
per direction with turn lanes is provided along with
on-street parallel parking.
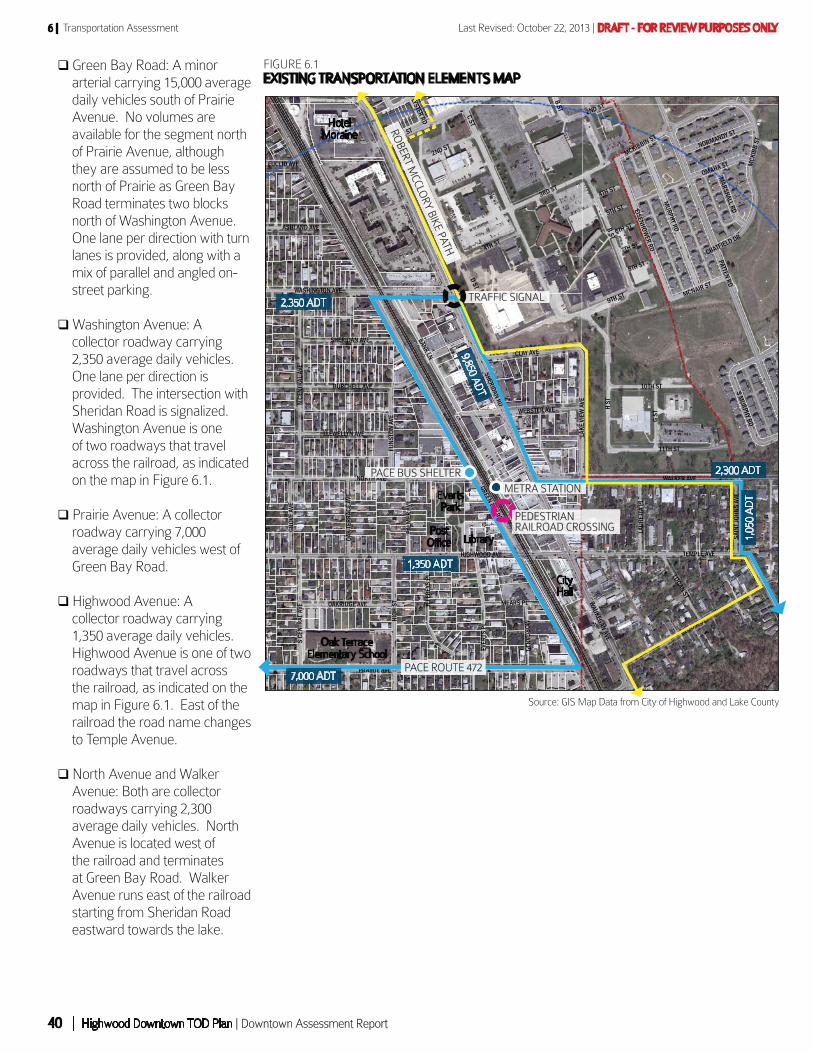
Last Revised: October 22, 2013 | DRAFT - FOR REVIEW PURPOSES ONLY
| Highwood Downtown TOD Plan | Downtown Assessment Report40
6 | Transportation Assessment
Green Bay Road: A minor
arterial carrying 15,000 average
daily vehicles south of Prairie
Avenue. No volumes are
available for the segment north
of Prairie Avenue, although
they are assumed to be less
north of Prairie as Green Bay
Road terminates two blocks
north of Washington Avenue.
One lane per direction with turn
lanes is provided, along with a
mix of parallel and angled on-
street parking.
Washington Avenue: A
collector roadway carrying
2,350 average daily vehicles.
One lane per direction is
provided. The intersection with
Sheridan Road is signalized.
Washington Avenue is one
of two roadways that travel
across the railroad, as indicated
on the map in Figure 6.1.
Prairie Avenue: A collector
roadway carrying 7,000
average daily vehicles west of
Green Bay Road.
Highwood Avenue: A
collector roadway carrying
1,350 average daily vehicles.
Highwood Avenue is one of two
roadways that travel across
the railroad, as indicated on the
map in Figure 6.1. East of the
railroad the road name changes
to Temple Avenue.
North Avenue and Walker
Avenue: Both are collector
roadways carrying 2,300
average daily vehicles. North
Avenue is located west of
the railroad and terminates
at Green Bay Road. Walker
Avenue runs east of the railroad
starting from Sheridan Road
eastward towards the lake.
FIGURE 6.1
EXISTING TRANSPORTATION ELEMENTS MAP
C STGREEN BAY RD
D ST
H ST
PATTEN RD
SHERIDAN RD
PRAIRIE AVE
9TH ST
3RD ST
WALKER AVE
HIGHWOOD AVE
NORTH AVE
BLOOM ST
1ST ST
HIGH
ST
BANK LN
WAUKEGAN AVE
11TH ST
G ST
TEMPLE AVE
MURPHY RD
N CE
NTRA
L AVE
CLAY AVE
EVER
TS P
L
10TH ST
MCKIBBIN ST
BURCHELL AVE
WASHINGTON AVE
JEFF
REYS
PL
4TH ST
2ND ST
EISENHOWER RD
S CE
NTRA
L AVE
LAKE
VIE
W A
VE
WEBSTER AVE
SAIN
T JOH
NS A
VE
LOGAN ST
MORGAN PL
GROV
E AVE
SHERIDAN AVE
FUNS
TON
AVE
CHATFIELD DR
OAKRIDGE AVE
OMAHA ST
PALM
ER A
VE
MEARS PL
LAUR
ETTA
PL
LLEWELLYN AVE
S MURPHY RD
B ST
NORMANDY ST
MCNAIR ST
ASHLAND AVE
MARSHALL RD
OAK
TERR
ACE A
VE
6TH ST
7TH ST
5TH ST
8TH ST
MCK
IBB
ST
EUCLID AVE
LYSTER RD
2ND ST
4TH ST
B ST
Source: GIS Map Data from City of Highwood and Lake County
PEDESTRIANRAILROAD CROSSING
HotelMoraine
CityHall
EvertsPark
LibraryPost
Office
Oak TerraceElementary School
RRRTTTHHH AAAAVVAAA EEEPACE BUS SHELTER
PACE ROUTE 472
11SSTTRO
BER
T M
CCLO
RY
BIK
E PA
TH
METRA STATION
7,000 ADT
1,350 ADT
2,300 ADT
2,350 ADT
1,0
50 A
DT
9,850 AD
T
TRAFFIC SIGNAL

DRAFT - FOR REVIEW PURPOSES ONLY | Last Revised: October 22, 2013
Downtown Assessment Report | Highwood Downtown TOD Plan | 41
Transportation Assessment | 6
METRA
Highwood is served by the Metra Union
Pacific-North Line (UP-N). This line
originates in Downtown Chicago at
the Ogilvie Transportation Center and
terminates at Kenosha, a distance of just
over 50 miles. The Highwood station
is the last station in the “E” fare zone.
Metra owns the station and the land on
which the station is located. Highwood
operates and maintains the station.
TRAIN FREQUENCY
There are a total of 70 passenger trains
that run on the UP-N line per weekday,
of which 44 stop at the Highwood sta-
tion. This level of service is comparable
to the Fort Sheridan station, but less
than the service to the Highland Park
station, as summarized in Figure 6.2.
RIDERSHIP
Per Metra’s 2006 Systemwide Board-
ing/Alighting Counts, there were 279
boardings at the Highwood station. His-
torically, ridership at the Highwood sta-
tion has remained fairly stable. Rider-
ship at Highwood has been comparable
over time to the Fort Sheridan station,
but much less than the Highland Park
station, as summarized in Figure 6.3.
While the majority of riders travel in the
peak direction commuting downtown
(about 70%), there is a significant per-
centage that is traveling in the reverse
direction (about 30%), as indicated
in Figure 6.4. Additionally, between
12:30pm and 2:30pm, there were 78
riders who got off of trains at Highwood.
This could be restaurant workers arriv-
ing for the afternoon/evening shifts.
FIGURE 6.2
DAILY METRA UP-N TRAINS AT HIGHWOOD STATION
Time Period Inbound Outbound
Highwood
Inbound Outbound
Fort Sheridan
Inbound Outbound
Highland Park
AM Peak(Start of Service to 9:15 AM)
Midday(9:15 AM to 3:29 pm)
PM Peak(3:30 PM to 6:45 PM)
Night(6:45 PM to End of Service)
Total
8
5
4
6
23
2
5
6
8
21
9
6
3
6
24
2
5
7
8
21
12
5
5
6
28
5
6
10
9
30
FIGURE 6.3
WEEKDAY BOARDINGS/ALIGHTINGS AT HIGHWOOD STATION
FareZone
Highwood
Fort Sheridan
Highland Park
E
F
E
1991
258
276
1,133
1993
290
279
1,171
1995
246
296
1,118
1997
290
338
1,240
1999
270
276
1,124
2002
311
285
1,107
2006
279
279
1,118
WeekdayBoardings
FIGURE 6.4
RIDERSHIP BY DIRECTION ATHIGHWOOD STATION (2006)
Inbound
Boardings (Ons)
Alighting (Offs)
Total
201 (72%)
77 (28%)
278 (100%)
Ridership Outbound
78 (30%)
186 (70%)
264 (100%)
Source: Metra
Source: MetraSource: Metra
Located at the heart of the downtown area, the Highwood Metra station has generally maintained stable ridership, comparing favorably
to the Fort Sheridan station but less than the Highland Park station.

Last Revised: October 22, 2013 | DRAFT - FOR REVIEW PURPOSES ONLY
| Highwood Downtown TOD Plan | Downtown Assessment Report42
6 | Transportation Assessment
MODE OF ACCESS
Mode of access to the station is pre-
dominantly by walking, followed by
driving alone/parking and being dropped
off, as shown in Figure 6.5. Highwood
has a much higher walk access to the
station and much lower number of rid-
ers who drive alone and park compared
to both the UP-N line and the Metra
system as a whole. The majority of rid-
ers at the Highwood station come from
either Highwood or Highland Park, with
44% and 42%, respectively. Highwood
residents also board stations at the Fort
Sheridan station (8%) and the Highland
Park station (2%).
COMMUTER PARKING
As the graphic in Figure 6.6 indicates,
commuter parking is provided in one
lot with 114 regular and 5 accessible
spaces. These spaces can be used on
a daily fee basis or with a permit. The
cost of parking is $2.25/day, $85.00/
quarter, or $325.00/year. Overall, park-
ing is 26% utilized, per 2012 data. The
City of Highwood owns and maintains
the parking lots.
FIGURE 6.5
MODES OF ACCESS TO STATION
Walk
Drive Alone
Dropped Off
Carpool
Bus
Bike
Taxi
Rapid Transit
Other
55%
25%
14%
0%
2%
0%
0%
0%
0%
Mode ofAccess
Source: 2006 Metra Origin-Destination Survey
Highwood
15%
69%
13%
3%
0%
0%
0%
0%
0%
FortSheridan
20%
55%
15%
6%
2%
1%
0%
0%
0%
HighlandPark
44%
34%
12%
4%
3%
2%
1%
1%
1%
UP-NLine
21%
54%
14%
4%
4%
1%
1%
1%
1%
MetraSystem
FIGURE 6.6
COMMUTER PARKING AT HIGHWOOD STATION
While public parking at the Highwood Metra station costs $2.25 per day (increased re-cently from $2.00, as the picture indicates), commuter parking spaces are utilized at 26%. Source: Metra

DRAFT - FOR REVIEW PURPOSES ONLY | Last Revised: October 22, 2013
Downtown Assessment Report | Highwood Downtown TOD Plan | 43
Transportation Assessment | 6
PACE
Fixed route bus service is provided
by Pace Route 472, offering service
between the Fort Sheridan Metra
station and the Highland Park Metra
station via St. Johns Road, Waukegan
Avenue, Summit Avenue, and Half
Day/Prairie Avenue. This route also
connects to Highland Park High School
and Highland Park Hospital. Route 472
connects to the Highwood Metra station
Monday through Saturday. Weekday
service is provided with an approximate
45 minute frequency during the peak
periods and 60 minute frequency during
the midday.
Total route ridership ranges from about
180 to 200 riders per day. Locations
in Highwood with the most boarding/
alighting activity are listed in the table in
Figure 6.7.
Route 472 does provide connections
between Downtown Highland Park,
Highwood, and Fort Sheridan, and con-
nections to the Metra stations in those
communities. However, the limited
schedule does not really serve either
the restaurant employees or restaurant
patrons, which would require additional
evening/night service.
To help promote transit use and support
local businesses, there are opportuni-
ties to collaborate with Pace to explore
enhanced Pace bus stop facilities and
address improved bus service for down-
town employees.
FIGURE 6.7
PACE BUS SERVICE VIA ROUTE 472
Todos los autobuses están equipados con racks para bicicletas.
El servicio de Pace es accessiblepara sillas de ruedas.
\
Time Period Ons Offs
Northbound
Ons Offs
Southbound
Ons Offs
Total
Walker Ave / Waukegan Rd
Sheridan Rd / Webster Ave
Sheridan Rd / Clay Ave
Sheridan Rd / Washington Ave
Washington Ave / Bank Ln
Green Bay Rd / Highwood Metra
Green Bay Rd / Highwood Ave
Green Bay Rd / Prairie Ave
Green Bay Rd / Washington Ave
21
4
1
10
5
10
2
0
8
14
3
4
7
2
3
4
1
0
Source: Pace
20
4
1
10
5
10
2
0
8
1
0
0
0
0
1
1
0
0
1
0
0
0
0
0
0
0
0
13
3
4
7
2
2
3
1
1
Pace Route 472 travels along Green Bay Road before picking up commut-
ers at the Highwood Metra station.
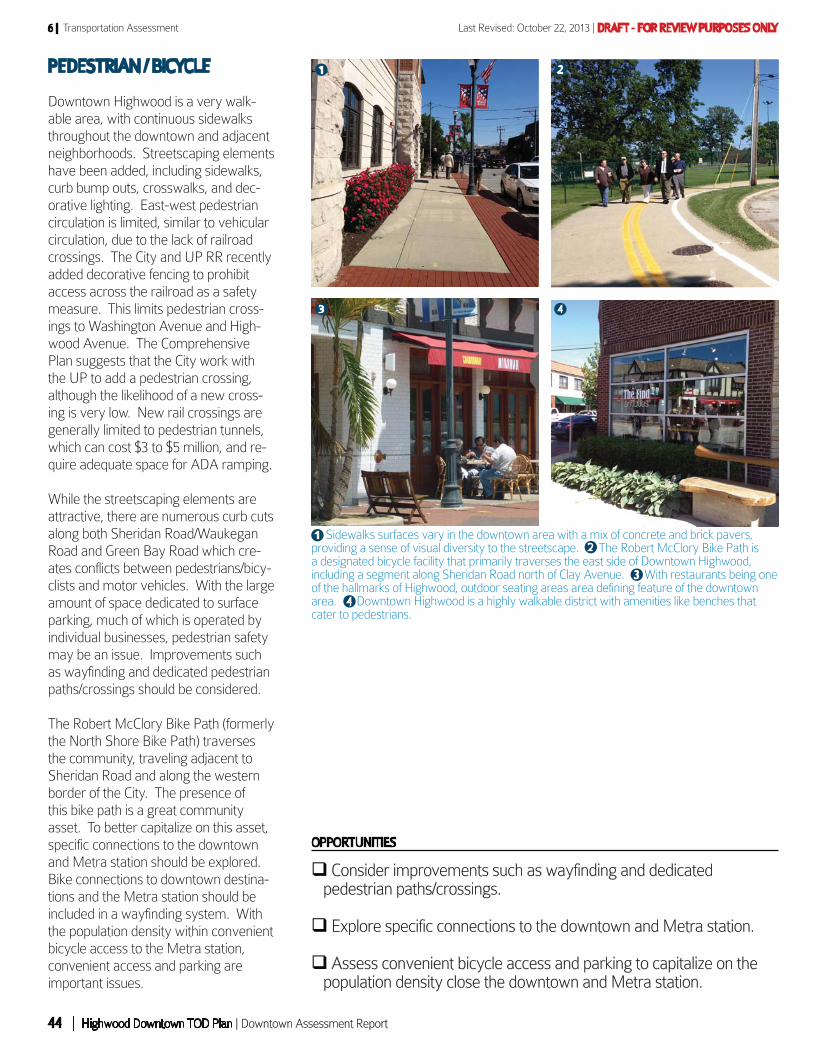
Last Revised: October 22, 2013 | DRAFT - FOR REVIEW PURPOSES ONLY
| Highwood Downtown TOD Plan | Downtown Assessment Report44
6 | Transportation Assessment
PEDESTRIAN / BICYCLE
Downtown Highwood is a very walk-
able area, with continuous sidewalks
throughout the downtown and adjacent
neighborhoods. Streetscaping elements
have been added, including sidewalks,
curb bump outs, crosswalks, and dec-
orative lighting. East-west pedestrian
circulation is limited, similar to vehicular
circulation, due to the lack of railroad
crossings. The City and UP RR recently
added decorative fencing to prohibit
access across the railroad as a safety
measure. This limits pedestrian cross-
ings to Washington Avenue and High-
wood Avenue. The Comprehensive
Plan suggests that the City work with
the UP to add a pedestrian crossing,
although the likelihood of a new cross-
ing is very low. New rail crossings are
generally limited to pedestrian tunnels,
which can cost $3 to $5 million, and re-
quire adequate space for ADA ramping.
While the streetscaping elements are
attractive, there are numerous curb cuts
along both Sheridan Road/Waukegan
Road and Green Bay Road which cre-
ates conflicts between pedestrians/bicy-
clists and motor vehicles. With the large
amount of space dedicated to surface
parking, much of which is operated by
individual businesses, pedestrian safety
may be an issue. Improvements such
as wayfinding and dedicated pedestrian
paths/crossings should be considered.
The Robert McClory Bike Path (formerly
the North Shore Bike Path) traverses
the community, traveling adjacent to
Sheridan Road and along the western
border of the City. The presence of
this bike path is a great community
asset. To better capitalize on this asset,
specific connections to the downtown
and Metra station should be explored.
Bike connections to downtown destina-
tions and the Metra station should be
included in a wayfinding system. With
the population density within convenient
bicycle access to the Metra station,
convenient access and parking are
important issues.
Consider improvements such as wayfinding and dedicated pedestrian paths/crossings.
Explore specific connections to the downtown and Metra station.
Assess convenient bicycle access and parking to capitalize on the population density close the downtown and Metra station.
OPPORTUNITIES
Sidewalks surfaces vary in the downtown area with a mix of concrete and brick pavers, providing a sense of visual diversity to the streetscape. The Robert McClory Bike Path is a designated bicycle facility that primarily traverses the east side of Downtown Highwood, including a segment along Sheridan Road north of Clay Avenue. With restaurants being one of the hallmarks of Highwood, outdoor seating areas area defining feature of the downtown area. Downtown Highwood is a highly walkable district with amenities like benches that cater to pedestrians.
1
1 2
3 4
2
3
4
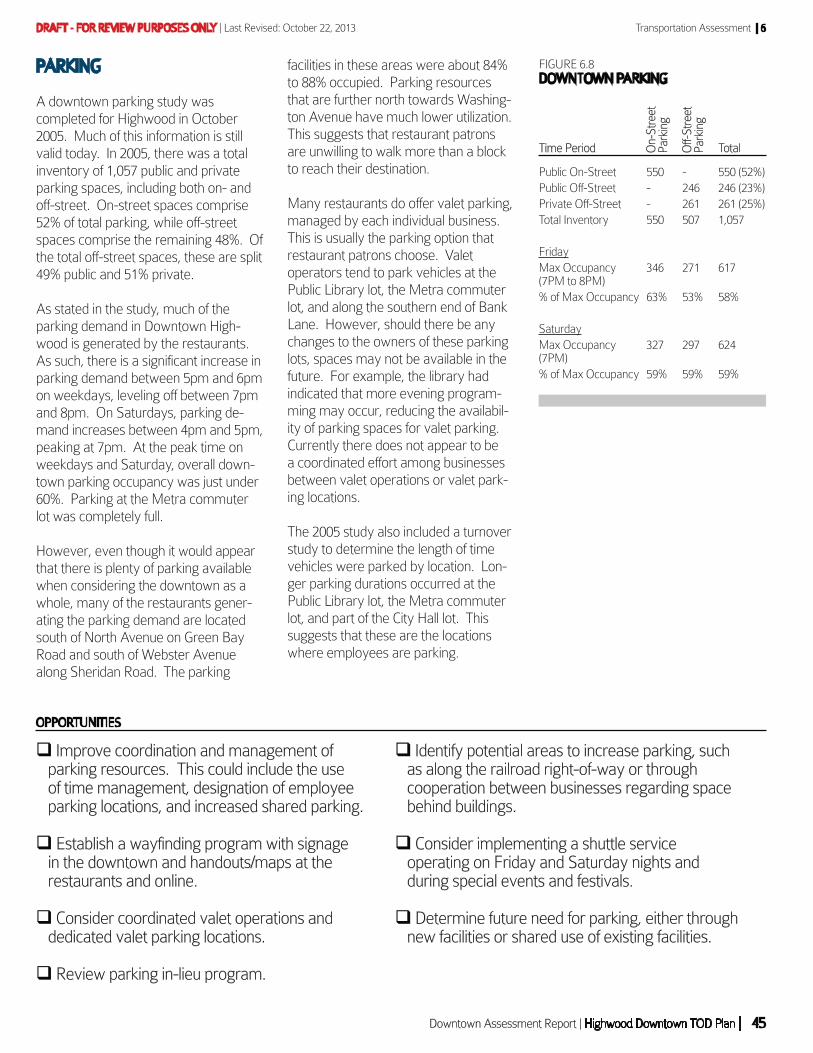
DRAFT - FOR REVIEW PURPOSES ONLY | Last Revised: October 22, 2013
Downtown Assessment Report | Highwood Downtown TOD Plan | 45
Transportation Assessment | 6
PARKING
A downtown parking study was
completed for Highwood in October
2005. Much of this information is still
valid today. In 2005, there was a total
inventory of 1,057 public and private
parking spaces, including both on- and
off-street. On-street spaces comprise
52% of total parking, while off-street
spaces comprise the remaining 48%. Of
the total off-street spaces, these are split
49% public and 51% private.
As stated in the study, much of the
parking demand in Downtown High-
wood is generated by the restaurants.
As such, there is a significant increase in
parking demand between 5pm and 6pm
on weekdays, leveling off between 7pm
and 8pm. On Saturdays, parking de-
mand increases between 4pm and 5pm,
peaking at 7pm. At the peak time on
weekdays and Saturday, overall down-
town parking occupancy was just under
60%. Parking at the Metra commuter
lot was completely full.
However, even though it would appear
that there is plenty of parking available
when considering the downtown as a
whole, many of the restaurants gener-
ating the parking demand are located
south of North Avenue on Green Bay
Road and south of Webster Avenue
along Sheridan Road. The parking
facilities in these areas were about 84%
to 88% occupied. Parking resources
that are further north towards Washing-
ton Avenue have much lower utilization.
This suggests that restaurant patrons
are unwilling to walk more than a block
to reach their destination.
Many restaurants do offer valet parking,
managed by each individual business.
This is usually the parking option that
restaurant patrons choose. Valet
operators tend to park vehicles at the
Public Library lot, the Metra commuter
lot, and along the southern end of Bank
Lane. However, should there be any
changes to the owners of these parking
lots, spaces may not be available in the
future. For example, the library had
indicated that more evening program-
ming may occur, reducing the availabil-
ity of parking spaces for valet parking.
Currently there does not appear to be
a coordinated effort among businesses
between valet operations or valet park-
ing locations.
The 2005 study also included a turnover
study to determine the length of time
vehicles were parked by location. Lon-
ger parking durations occurred at the
Public Library lot, the Metra commuter
lot, and part of the City Hall lot. This
suggests that these are the locations
where employees are parking.
Improve coordination and management of parking resources. This could include the use of time management, designation of employee parking locations, and increased shared parking.
Establish a wayfinding program with signage in the downtown and handouts/maps at the restaurants and online.
Consider coordinated valet operations and dedicated valet parking locations.
Review parking in-lieu program.
OPPORTUNITIES
Identify potential areas to increase parking, such as along the railroad right-of-way or through cooperation between businesses regarding space behind buildings.
Consider implementing a shuttle service operating on Friday and Saturday nights and during special events and festivals.
Determine future need for parking, either through new facilities or shared use of existing facilities.
On-S
treet
Park
ing
FIGURE 6.8
DOWNTOWN PARKING
Time Period
Public On-Street
Public Off-Street
Private Off-Street
Total Inventory
Friday
Max Occupancy(7PM to 8PM)
% of Max Occupancy
Saturday
Max Occupancy(7PM)
% of Max Occupancy
550
-
-
550
346
63%
327
59%
Off-S
treet
Park
ing
-
246
261
507
271
53%
297
59%
550 (52%)
246 (23%)
261 (25%)
1,057
617
58%
624
59%
Total

Last Revised: October 22, 2013 | DRAFT - FOR REVIEW PURPOSES ONLY
| Highwood Downtown TOD Plan | Downtown Assessment Report46
6 | Transportation Assessment
This page intentionally left blank for double-sided printing.