HIGHWAY SAFETY REPORT - Florida Transportation Commission Home
44
H H H IGHWAY IGHWAY IGHWAY S S S AFETY AFETY AFETY R R R EPORT EPORT EPORT CALENDAR YEAR 2010 CALENDAR YEAR 2010 CALENDAR YEAR 2010 A Report by the Florida Transportation Commission
Transcript of HIGHWAY SAFETY REPORT - Florida Transportation Commission Home
HIGHWAY SAFETY REPORT FOR HIGHWAY SAFETY REPORT FOR HIGHWAY SAFETY REPORT FOR
CALENDAR YEAR 2010CALENDAR YEAR 2010CALENDAR YEAR 2010
September 14, 2011September 14, 2011September 14, 2011
HHHIGHWAYIGHWAYIGHWAY SSSAFETYAFETYAFETY RRREPORTEPORTEPORT CALENDAR YEAR 2010CALENDAR YEAR 2010CALENDAR YEAR 2010
A Report by the
Florida Transportation Commission


Highway Safety Report - Calendar Year 2010
1
TABLE OF CONTENTS
Introduction .......................................................................................................................... 2
Florida Department of Transportation Safety Office ............................................................. 3
Strategic Highway Safety Plan (SHSP) ................................................................................. 4
Highway Safety Improvement Program (HSIP) .................................................................... 6
Highway Safety Performance Plan (HSPP)........................................................................... 8
Aggressive Driving ........................................................................................................ 10
Intersection-Related Crashes ......................................................................................... 11
Lane Departures............................................................................................................. 12
Public Service Announcements ........................................................................................... 13
The 4 E’s .............................................................................................................................. 15
Engineering..................................................................................................................... 15
Enforcement ................................................................................................................... 15
Education ........................................................................................................................ 15
Emergency Services ....................................................................................................... 15
Summary of Florida Highway Safety Performance ............................................................. 16
Secondary Performance Measure ......................................................................................... 18
Florida Fatality Rate ....................................................................................................... 18
Performance Indicators ......................................................................................................... 20
Car and Truck Occupants Fatality Rate ......................................................................... 20
Motorcyclists Fatality Rate ............................................................................................ 22
Pedestrians Fatality Rate ................................................................................................ 25
Bicyclists Fatality Rate ................................................................................................... 28
Safety Belt Usage and Fatality Rate ............................................................................... 31
Young Drivers Fatal Crash Rate ..................................................................................... 34
Alcohol-Related Fatal Crash Rate .................................................................................. 37
References ............................................................................................................................. 40
Highway Safety Report - Calendar Year 2010
2
INTRODUCTION
The Florida Department of Transportation (Department) has identified “safety” as the single
most important recurring, underlying theme throughout its programs. The Department includes
safety as an integral part of its Mission and Values. Safety permeates throughout the design,
construction, maintenance, and operations programs of the Department. In addition to funds
committed to safety as part of those programs, a Safety Office has been established within the
Department that administers safety programs that also provide funding for:
Hazard Elimination
Rail-Highway Grade Crossings
Traffic Safety Grants
Pedestrian/Bicycle Safety
Community Traffic Safety Teams
However, given the state’s unfavorable national ranking in fatalities and fatality rates, a greater
emphasis on measuring the effectiveness of the Department’s safety program is warranted.
The Performance Measures Working Group convened in 2005 with one objective being to
develop and adopt a new safety performance measure. After several meetings, the Working
Group concluded that a separate report was needed to convey a more comprehensive
overview of the Department’s highway safety program. The safety performance measure as
presented in the annual Performance and Production Review of the Department was revised
and a series of highway safety indicators were identified to aid in assessing the condition of
highway safety in Florida. The Florida Transportation Commission (Commission) advocates
elevating the visibility of these statistics, which will serve as a catalyst for action by the
Department and its highway safety partners in reducing, where possible, the incidence of
highway fatalities and fatal crashes.
The purpose of this report is to provide an update on the Secondary Performance Measure and
several safety indicators to assist the Department in assessing the outcomes derived from
investments in the safety programs it administers. The Commission recognizes that there are
many factors that are beyond the Department’s control that contribute to highway fatalities.
These include, but are not limited to: Driver skill levels and impairment;
Use of safety equipment;
Vehicle condition; and,
Road and weather conditions.
Highway Safety Report - Calendar Year 2010
3
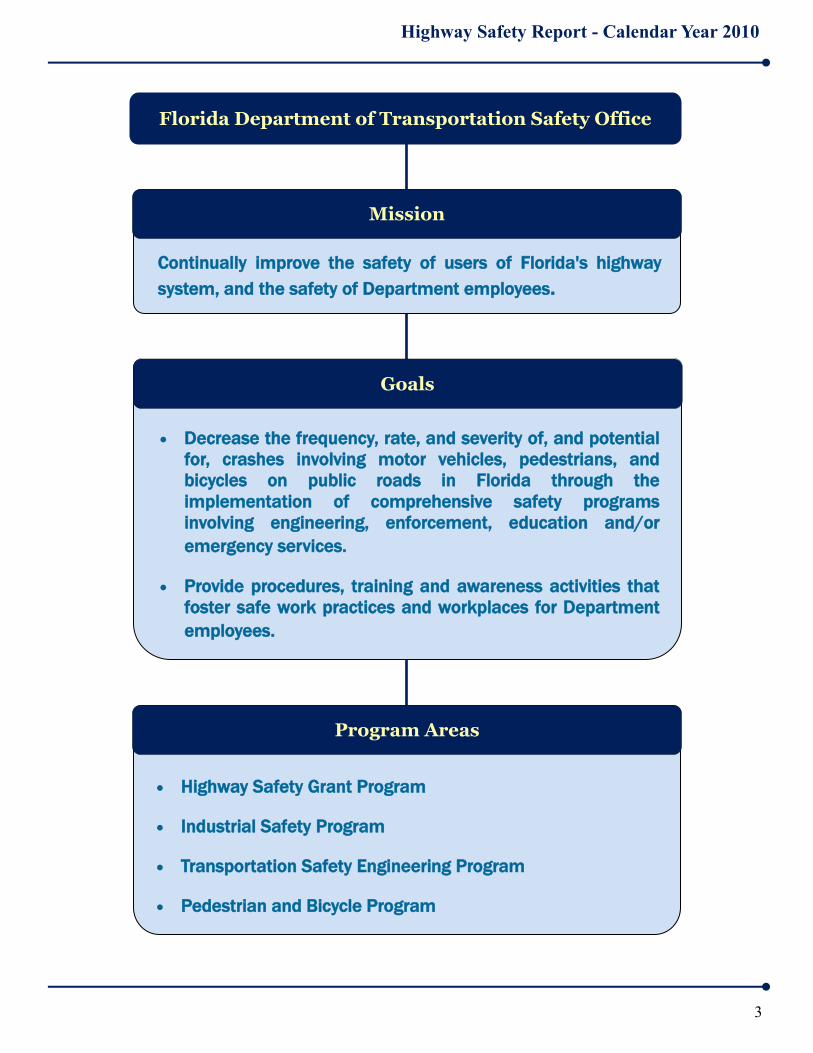
Continually improve the safety of users of Florida's highway
system, and the safety of Department employees.
Mission
Decrease the frequency, rate, and severity of, and potential
for, crashes involving motor vehicles, pedestrians, and
bicycles on public roads in Florida through the
implementation of comprehensive safety programs
involving engineering, enforcement, education and/or
emergency services.
Provide procedures, training and awareness activities that
foster safe work practices and workplaces for Department
employees.
Goals
Highway Safety Grant Program
Industrial Safety Program
Transportation Safety Engineering Program
Pedestrian and Bicycle Program
Program Areas
Florida Department of Transportation Safety Office

Highway Safety Report - Calendar Year 2010
4
FLORIDA DEPARTMENT OF TRANSPORTATION (DEPARTMENT)
STRATEGIC HIGHWAY SAFETY PLAN (SHSP) 2006
The purpose of the SHSP is to strategically focus funding and other resources on those
problem areas where the opportunity for improvement is greatest, as measured by reductions in
fatalities and serious injuries. Improving the safety of Florida’s surface transportation system
for residents and visitors is the unifying goal of Florida’s safety community and the
overarching goal of the SHSP. The SHSP identifies strategic safety priorities in both public and
private agencies and organizations at national, state, regional and local levels.
The federal transportation act of 2005, “Safe, Accountable, Flexible, and Efficient
Transportation Equity Act: A Legacy for Users” (SAFETEA-LU), places more emphasis on
funding for highway safety than prior acts. Each state transportation department is required to
develop and implement a SHSP after consultation with major safety stakeholders (metropolitan
planning organizations, traffic enforcement officials, motor vehicle administration officials,
motor carrier safety officials, and other state and local safety stakeholders). The resulting state
SHSP must:
Address all of the 4E’s (Engineering, Enforcement, Education and Emergency Services) as key factors in
evaluating highway projects;
Identify and analyze safety problems and opportunities;
Include a crash data system that can perform problem identification and countermeasure analysis;
Establish strategic and performance-based goals that focus resources on areas of greatest need;
Advance state traffic records data collection, analysis and integration with other safety data sources; and,
Establish an evaluation process to assess results.
A Memorandum of Understanding (MOU) was completed and transmitted as a part of the
SHSP that was approved in September 2006. The MOU was executed by the following
organizations:
Florida Department of Transportation
FDOT Motor Carrier Compliance
Federal Highway Administration
Federal Motor Carrier Safety Administration
Florida Department of Highway Safety and Motor Vehicles
Florida Highway Patrol
Florida Department of Education
Florida Department of Health
Florida Sheriffs Association
Florida Police Chiefs Association
Metropolitan Planning Organization Advisory Council
Florida Operation Lifesaver

Highway Safety Report - Calendar Year 2010
5
The Department has been meeting with the SHSP leadership group (the organizations of the
SHSP) on a quarterly basis to report on and assess the progress that is being made in reducing
highway fatalities. In 2010, this group continued to discuss whether the SHSP continued to
focus on the appropriate traffic safety problems and whether to amend the SHSP. The
leadership group was equally divided between continuing with the existing SHSP for the next
five years and adding a few emphasis areas to the current emphasis areas. Suggestions for
inclusion were distracted driving, older drivers, younger drivers and work zone crashes.
In August 2010, a SHSP Summit was held in conjunction with the 2060 Florida Transportation
Plan Summit in Orlando. Presentations were made on the potential areas for amendment of the
SHSP. After the presentations and discussion, attendees voted their preferences for adding
emphasis areas. This information, together with the results of an online survey, was considered
by the SHSP Executive Committee that met in October 2011. As a result, the Executive
Committee voted to amend the current SHSP to: (1) add a new emphasis area for “distracted
driving;” (2) add a new emphasis area for “at risk drivers” (aging road users and teen drivers);
and, (3) elevate “impaired driving” and “traffic data and decision support” from continuing
priority areas to emphasis areas.
The seven areas in the initial SHSP are divided into “emphasis” and “continuing priority”
areas. This report will update the progress in reducing fatalities and serious injuries in the
emphasis areas of:
Aggressive Driving
Intersection Crashes
Vulnerable Road Users
Lane Departure Crashes
In addition, the report will provide and update on progress in the “continuing priority” areas of:
Occupant Protection
Impaired Driving
Traffic Data and Decision Support
Florida’s Strategic Highway Safety Plan (SHSP) focuses on seven areas that are targeted
towards reducing the rate of fatalities and serious injuries. The goal of the SHSP is “to
improve the safety of Florida’s surface transportation system by achieving a five percent
annual reduction in the rate of fatalities and serious injuries beginning in 2007.” The
Department achieved a 4.3 percent reduction in the fatality rate and a 5.1 percent reduction
in the rate of serious injuries in 2010.
Highway Safety Report - Calendar Year 2010
6
FLORIDA DEPARTMENT OF TRANSPORTATION
HIGHWAY SAFETY IMPROVEMENT PROGRAM (HSIP)
The Department’s State Safety Office is required by the Federal Highway Administration to
submit an annual Highway Safety Improvement Program (HSIP) report by August 31 each
year. The purpose of the report is to demonstrate that Florida effectively allocated its funding
to carry out its HSIP, and that the projects implemented achieved results. More specifically, the
Department needs to show that Florida met its effectiveness and achievements marks by
producing a significant decline, in real terms, in the number of fatalities and serious injuries on
Florida’s highways. The following highlights key sections of the FY 2010 report.
Program Administration
Florida’s HSIP program administration is decentralized to Department’s district offices with
oversight from the Central Office on budget compliance and regulatory adherence. Each
district determines its safety needs primarily by using the guidance set by the Florida Strategic
Highway Safety Plan 2006 (SHSP) and analyzing crash data. Innovative practices have
included using web-based tools to validate safety projects for state roads, and collaborating
with Community Traffic Safety Teams (CTST)* to submit proposed safety projects for local
roads.
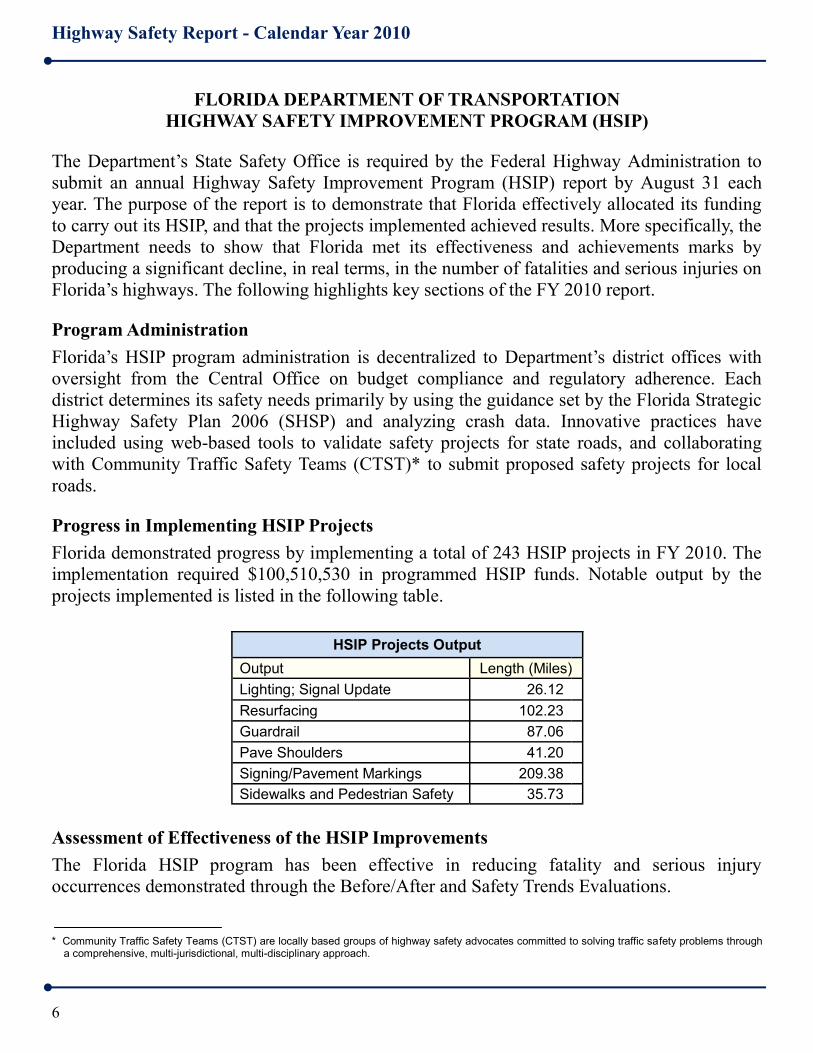
Progress in Implementing HSIP Projects
Florida demonstrated progress by implementing a total of 243 HSIP projects in FY 2010. The
implementation required $100,510,530 in programmed HSIP funds. Notable output by the
projects implemented is listed in the following table.
Assessment of Effectiveness of the HSIP Improvements
The Florida HSIP program has been effective in reducing fatality and serious injury
occurrences demonstrated through the Before/After and Safety Trends Evaluations.
HSIP Projects Output
Output Length (Miles)
Lighting; Signal Update 26.12
Resurfacing 102.23
Guardrail 87.06
Pave Shoulders 41.20
Signing/Pavement Markings 209.38
Sidewalks and Pedestrian Safety 35.73
* Community Traffic Safety Teams (CTST) are locally based groups of highway safety advocates committed to solving traffic safety problems through a comprehensive, multi-jurisdictional, multi-disciplinary approach.
Highway Safety Report - Calendar Year 2010
7
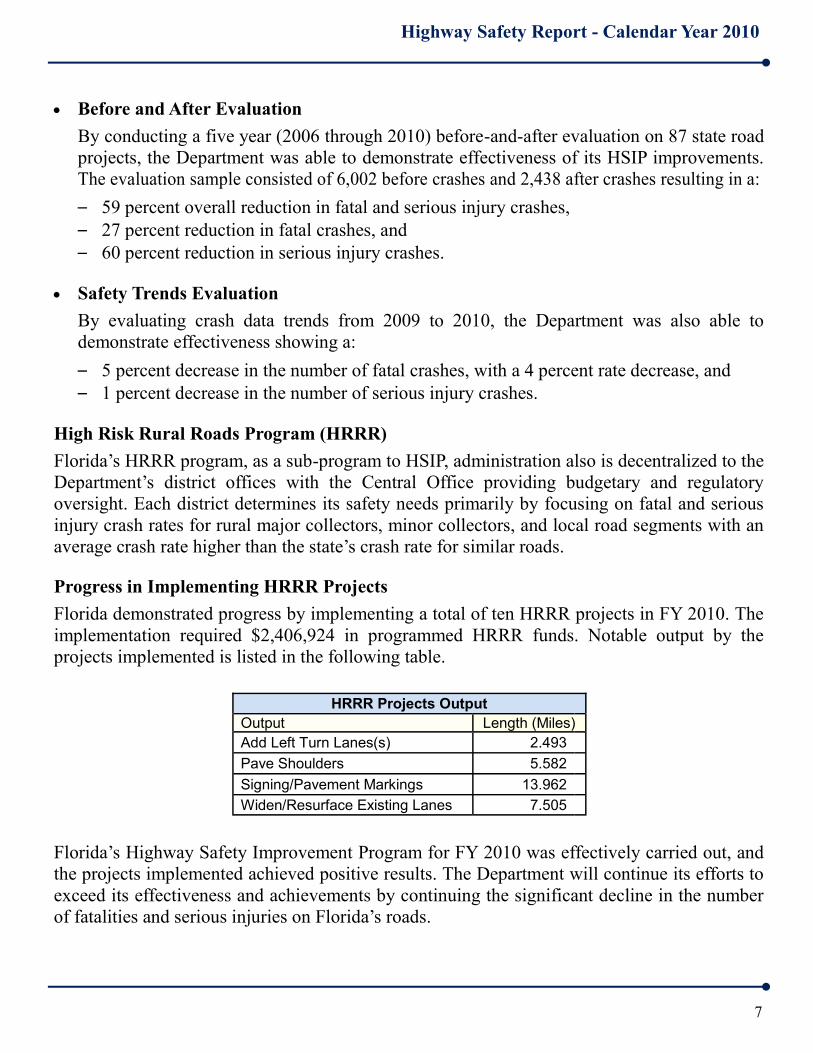
Before and After Evaluation
By conducting a five year (2006 through 2010) before-and-after evaluation on 87 state road
projects, the Department was able to demonstrate effectiveness of its HSIP improvements.
The evaluation sample consisted of 6,002 before crashes and 2,438 after crashes resulting in a:
– 59 percent overall reduction in fatal and serious injury crashes,
– 27 percent reduction in fatal crashes, and
– 60 percent reduction in serious injury crashes.
Safety Trends Evaluation
By evaluating crash data trends from 2009 to 2010, the Department was also able to
demonstrate effectiveness showing a:
– 5 percent decrease in the number of fatal crashes, with a 4 percent rate decrease, and
– 1 percent decrease in the number of serious injury crashes.
High Risk Rural Roads Program (HRRR)
Florida’s HRRR program, as a sub-program to HSIP, administration also is decentralized to the
Department’s district offices with the Central Office providing budgetary and regulatory
oversight. Each district determines its safety needs primarily by focusing on fatal and serious
injury crash rates for rural major collectors, minor collectors, and local road segments with an
average crash rate higher than the state’s crash rate for similar roads.
Progress in Implementing HRRR Projects
Florida demonstrated progress by implementing a total of ten HRRR projects in FY 2010. The
implementation required $2,406,924 in programmed HRRR funds. Notable output by the
projects implemented is listed in the following table.
Florida’s Highway Safety Improvement Program for FY 2010 was effectively carried out, and
the projects implemented achieved positive results. The Department will continue its efforts to
exceed its effectiveness and achievements by continuing the significant decline in the number
of fatalities and serious injuries on Florida’s roads.
HRRR Projects Output
Output Length (Miles)
Add Left Turn Lanes(s) 2.493
Pave Shoulders 5.582
Signing/Pavement Markings 13.962
Widen/Resurface Existing Lanes 7.505

Highway Safety Report - Calendar Year 2010
8
FLORIDA DEPARTMENT OF TRANSPORTATION
HIGHWAY SAFETY PERFORMANCE PLAN (HSPP) FY 2011
The Department’s Traffic Safety Section is responsible for administering federal funds
received from the National Highway Traffic Safety Administration (NHTSA) by awarding
grants to state, county, and local agencies, and qualified not for profit corporations. To receive
grant funds, an entity must submit a concept for a behavioral based traffic safety program that
addresses a specific problem, based upon the data, and provide measurable outcomes to
evaluate the success of the program. These proposed funding opportunities are submitted
annually to NHTSA in the Department’s Highway Safety Performance Plan (HSPP). The
HSPP supports and complements the SHSP by emphasizing the importance of the SHSP focus
areas through its funding and outreach initiatives.
Each of the seven focus areas of the SHSP are major components of the HSPP. Subgrants
implement the goals and strategies of the SHSP by funding a wide variety of projects:
Law enforcement overtime to eliminate speeding and other dangerous behaviors that
constitute aggressive driving;
Awareness and enforcement initiatives to eliminate distracted driving and decrease lane
departure crashes;
Awareness, educational, training, and enforcement efforts to increase awareness of
motorists, bicyclists, pedestrians and motorcyclists, of the importance of helmet use
especially in younger children, and of new traffic laws;
Awareness and enforcement initiatives to reduce red light running incidents and increase
awareness when making right turns on red to reduce incidents at intersections;
An aggressive child passenger seat program and training opportunities, including the only
program of its kind in the nation that provides child passenger safety services to special
needs children;
Overtime to law enforcement to assist in Driving Under the Influence (DUI) enforcement
activities, teen driving programs, supporting the Florida Coalition on Impaired Driving,
DUI training for law enforcement and prosecutors, and support for DUI Court Programs;
and,
Providing software and hardware for electronic crash reporting, expansion of Florida’s
EMSTAR* program (for NEMSIS** compliance), and locating crashes on all roads.
* EMSTAR: Emergency Medical Services Training, Administration, and Resources ** NEMSIS: National Emergency Medical Services Information System

Highway Safety Report - Calendar Year 2010
9
The Department’s Traffic Safety Section received more than 250 requests for grant funding
under Sections 402, 405, 406, 410 and 2010. Appropriate staff members ranked the funding
requests based on the Highway Safety Matrix and whether it was a continuing program or a
new request, if it satisfied a specific traffic safety need, if it supported the goals for the
program area, and on past funding history of the agency. As a result, grant funds were provided
for the following program areas (see the FY 2011 HSPP for the actual grant projects and
recipients).
Program Area 402 405 (K2) 410 (K8) 410 (J8) 408 163 2010 Total % of Total
Planning & Administration $280,920 $280,920 0.81%
Occupant Protection 2,441,351 2,441,351 7.05%
Community Traffic Safety 926,306 926,306 2.68%
Alcohol 2,440,037 $3,037,723 $8,433,422 13,911,182 40.18%
Pedestrian/Bicycle Safety 947,825 947,825 2.74%
Traffic Records 564,726 $1,515,562 2,080,288 6.01%
Motorcycle Safety 1,167,261 $395,382 1,562,643 4.51%
Police Traffic Services 3,901,417 3,901,417 11.27%
Speed Control 391,787 391,787 1.13%
Roadway Safety 523,090 523,090 1.51%
Paid Media 845,000 $1,590,351 1,410,862 2,551,200 $1,253,958 7,651,371 22.10%
Total $14,429,720 $1,590,351 $4,448,585 $10,984,622 $1,515,562 $1,253,958 $395,382 $34,618,180 100.00%
Financial Summary
FY 2011 Highway Safety Performance Plan
Planning & Administration0.8%
Occupant Protection7.1%
Community Traffic Safety2.7%
Alcohol40.2%
Pedestrian/Bicycle Safety2.7%
Traffic Records6.0%
Motorcycle Safety4.5%
Police Traffic Services11.3%
Speed Control1.1%
Roadway Safety1.5%
Paid Media22.1%
Planning & Administration
Occupant Protection
Community Traffic Safety
Alcohol
Pedestrian/Bicycle Safety
Traffic Records
Motorcycle Safety
Police Traffic Services
Speed Control
Roadway Safety
Paid Media

Highway Safety Report - Calendar Year 2010
10
Aggressive driving behaviors include any two events of: speeding, failure to yield the right-of-way, improper
lane change, following too closely, improper passing or disregarding other traffic control devices per Section
316.1923, Florida Statutes. The Department funds Aggressive Driving programs utilizing National Highway
Traffic Safety Administration (NHTSA) Highway Safety Program Funds. Strategies include: (1) enhance and
promote effective law enforcement programs; (2) increase training and education; and, (3) identify and
mitigate roadway features that may trigger aggressive driving. Aggressive Driving Citations increased from
approximately 8,300 in 2006 to 23,200 in 2010.
Prior to 2008, the Department reported aggressive driving as any one event of those noted above. The
Department has since changed its reporting to be consistent with the statute and reporting by the Department of
Highway Safety and Motor Vehicles and has classified aggressive driving as any two events of those noted
above. Even though aggressive driving, as restated, accounts for only two percent of fatalities, the Department
has indicated that, due to the prevalence of the individual behaviors constituting aggressive driving, it will
continue to focus its funding efforts on changing the behaviors that cause aggressive driving events.
Florida Aggressive Driving Fatalities
Compared to Florida Total Fatalities
1,219514760
1,239
3,365 2,5632,9833,221 2,444
36.2%
2.1%1.8%
38.5%
2.0%
0
1,000
2,000
3,000
4,000
2006 2007 2008 2009 2010
Fata
liti
es
0%
10%
20%
30%
40%
50%
Aggressive Driving Fatalities Total Fatalities % of Aggressive Driving to Total
AGGRESSIVE DRIVING
2.0%
Performance Indicator:
2006 2007 2008 2009 2010
Aggressive Driving Fatalities 1,219 1,239 60 47 51
Total Fatalities 3,365 3,221 2,983 2,563 2,444
% of Aggressive Driving
Fatalities to Total Fatalities36.2% 38.5% 2.0% 1.8% 2.1%
Percent of aggressive driving fatalities to total fatalities
2006 2007 2008 2009 2010
Aggressive Driving Fatalities 1,219 1,239 60 47 51
Rate Change from Prior Year 0.4% 2.2% -36.5% -0.2% 0.3%
% Change from Prior Year 1.3% 6.2% -94.8% -8.8% 13.8%
Performance Indicator:Change in Florida aggressive driving fatality rate compared to
previous year's rate
Highway Safety Report - Calendar Year 2010
11
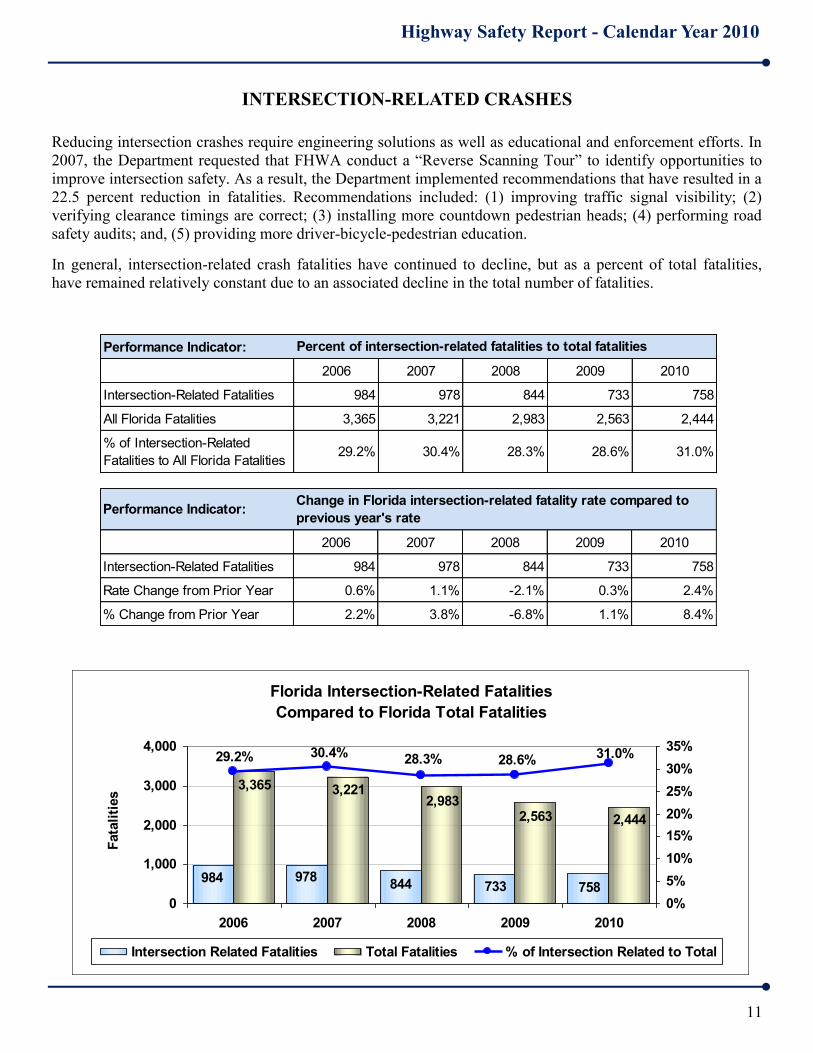
Reducing intersection crashes require engineering solutions as well as educational and enforcement efforts. In
2007, the Department requested that FHWA conduct a “Reverse Scanning Tour” to identify opportunities to
improve intersection safety. As a result, the Department implemented recommendations that have resulted in a
22.5 percent reduction in fatalities. Recommendations included: (1) improving traffic signal visibility; (2)
verifying clearance timings are correct; (3) installing more countdown pedestrian heads; (4) performing road
safety audits; and, (5) providing more driver-bicycle-pedestrian education.
In general, intersection-related crash fatalities have continued to decline, but as a percent of total fatalities,
have remained relatively constant due to an associated decline in the total number of fatalities.
INTERSECTION-RELATED CRASHES
Florida Intersection-Related Fatalities
Compared to Florida Total Fatalities
978844 733 758
984
2,444
3,2212,983
2,563
3,365
28.3%30.4%28.6%
31.0%29.2%
0
1,000
2,000
3,000
4,000
2006 2007 2008 2009 2010
Fata
liti
es
0%
5%
10%
15%
20%
25%
30%
35%
Intersection Related Fatalities Total Fatalities % of Intersection Related to Total
Performance Indicator:
2006 2007 2008 2009 2010
Intersection-Related Fatalities 984 978 844 733 758
All Florida Fatalities 3,365 3,221 2,983 2,563 2,444
% of Intersection-Related
Fatalities to All Florida Fatalities29.2% 30.4% 28.3% 28.6% 31.0%
Percent of intersection-related fatalities to total fatalities
2006 2007 2008 2009 2010
Intersection-Related Fatalities 984 978 844 733 758
Rate Change from Prior Year 0.6% 1.1% -2.1% 0.3% 2.4%
% Change from Prior Year 2.2% 3.8% -6.8% 1.1% 8.4%
Change in Florida intersection-related fatality rate compared to
previous year's ratePerformance Indicator:

Highway Safety Report - Calendar Year 2010
12
LANE DEPARTURES
Lane departure crashes include running off the road, crossing the center median into an oncoming lane of
traffic, and sideswipe crashes. Running off the road may also involve a rollover or hitting a fixed object. To
reduce the incidence of fatalities, efforts are being made to: (1) keep vehicles from leaving the road or crossing
the median; (2) reduce the likelihood of vehicles overturning or crashing into roadside objects; and, (3)
minimize the severity of an overturn. Examples of these are: (1) installing rumble strips; (2) installing median
guard rail and canal protection barriers; (3) providing collision avoidance training for teens; and, (4) enforcing
Florida’s Move Over Law.
In prior years, lane departures also included any of the above events at, or influenced by, intersections. Since
intersection crashes are a separate measure, events associated with intersections are not included in the data
beginning in 2008. Lane departures now account for approximately 21 percent of highway fatalities, and the
Department will continue to invest in infrastructure improvements to lessen the occurrence of these fatalities.
Florida Lane Departure Fatalities
Compared to Florida Total Fatalities
3,125
501597838
2,961
3,365
2,563
2,983
3,221 2,444
92.9%
20.5%23.3%
91.9%28.1%
0
1,000
2,000
3,000
4,000
2006 2007 2008 2009 2010
Fata
liti
es
0%
30%
60%
90%
120%
Lane Departure Fatalities Total Fatalities % of Lane Departures to Total
Performance Indicator:
2006 2007 2008 2009 2010
Lane Departure Fatalities 3,125 2,961 838 597 501
Total Fatalities 3,365 3,221 2,983 2,563 2,444
% of Lane Departure Fatalities
to Total Fatalities92.9% 91.9% 28.1% 23.3% 20.5%
Percent of lane departure fatalities to total fatalities
2006 2007 2008 2009 2010
Lane Departure Fatalities 3,125 2,961 838 597 501
Rate Change from Prior Year 0.0% -0.9% -63.8% -4.8% -2.8%
% Change from Prior Year 0.0% -1.0% -69.4% -17.1% -12.0%
Change in Florida lane departure fatality rate compared to
previous year's ratePerformance Indicator:
Highway Safety Report - Calendar Year 2010
13
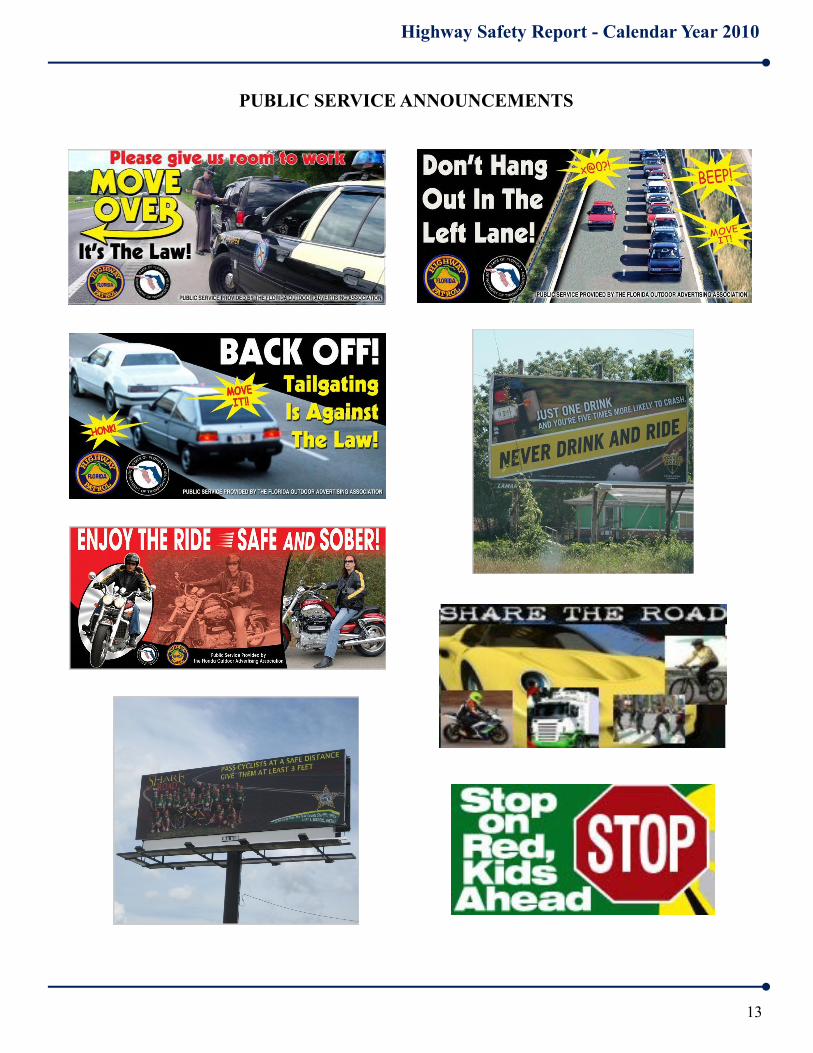
PUBLIC SERVICE ANNOUNCEMENTS

Highway Safety Report - Calendar Year 2010
14
Enforcement
Education Engineering
Emergency Services

Highway Safety Report - Calendar Year 2010
15
Engineering: This aspect of safety involves design and maintenance of the roadway,
intersections, shoulders and clear recovery areas. Improving signalization, signage, guardrail,
slope, geometry, audibility and visibility of lane delineation are some of the engineering tools
employed. The Department also removes obstructions and installs canal protection devices to
reduce the severity of injury if a lane departure occurs.
Enforcement: Enforcement of Florida’s traffic laws on all public roads (state, county, and
city) is the responsibility of the following law enforcement agencies:
Florida Highway Patrol (FHP);
FDOT Office of Motor Carrier Compliance (moved to FHP in 2011 legislative session);
Florida Fish and Wildlife Conservation Commission;
County Sheriffs, within their county boundaries;
City Police, within their city limits;
University Police; and,
Department of Environmental Protection.
Education: Traffic safety education of the public ranges from programs for young children to
those tailored for elders, and includes such topics as vehicle operator skills and vehicle safety,
use of safety restraints, operator impairment (drugs or alcohol), emergency preparedness,
pedestrian and bicycle safety, information on new laws or technologies, etc. Many agencies
educate or train in highway safety-related areas.
Emergency Services: This category includes first responders and support agencies that
prepare for, respond to, and assist in recovery efforts from natural disasters and other
emergencies. Some agencies respond to individual crashes with medical and other services.
Other agencies operate traffic and incident management systems using intelligent
transportation systems (ITS) technology during traffic incidents, emergencies, and planned
events to inform and re-route traffic, prevent secondary incidents and coordinate rapid
emergency response.
THE FOUR E’s

Highway Safety Report - Calendar Year 2010
16
SUMMARY OF FLORIDA HIGHWAY SAFETY PERFORMANCE FOR 2010
Motor vehicle travel is the primary means of transportation in the United States, providing an
unprecedented degree of mobility. However, this exceptional degree of mobility comes at a
significant cost in terms of fatalities and injuries. According to the National Highway
Traffic Safety Administration (NHTSA), motor vehicle crashes are the leading cause of death
for persons of every age from 3 through 33. Traffic fatalities account for more than 90 percent
of transportation related fatalities.
Florida traffic crash statistics are gathered on a calendar year basis and are reported to NHTSA
the following calendar year. Data from NHTSA is generally available in the Fall, while data
from the state (Department of Highway Safety and Motor Vehicles) is generally available in
June following the statistical year. Recently, the “long-form traffic crash report form”
submitted by all law enforcement agencies was expanded to include additional data. These
expanded reports were phased-in from November 2010 through January 2011. As a result,
2010 state safety data was not available until September 2011, and limited NHTSA data was
not available until December 2011. The 2010 national data contained in this report may
slightly change subsequent to the publication of the NHTSA Traffic Safety Facts 2010 annual
report.
Calendar Year 2010 Safety Performance
Total Highway Fatalities: The Florida fatality rate decreased to 1.25 deaths per 100 million
vehicle miles traveled (VMT) in 2010. This is the lowest since the rate has been calculated, but
is 13.9 percent higher than the national rate of 1.10. Traffic fatalities decreased from 2,563 in
2009 to 2,444 in 2010, a decrease of 119 fatalities or 4.6 percent.
Car and Truck Occupants: The fatality rate fell from 0.80 per 100 million VMT in 2009 to
0.76 in 2010 and is only 0.3 percent above the national average of 0.76.
Motorcyclists: The fatality rate increased to 65.3 per 100,000 registered motorcycles.
Although there were 19 fewer deaths in 2010, the number of registered motorcycles decreased
resulting in a higher fatality rate. The national fatality rate for 2010 was not available at press
time.
Pedestrians: The fatality rate increased by 2.6 percent to 2.65 per 100,000 population, and the
Florida rate decreased to 91.5 percent above the national average of 1.39.
Bicyclists: The fatality rate declined to 0.40 per 100,000 population (from 0.54 in 2009) and
declined to 101.9 percent (from 162.5 percent) above the national average of 0.20.
Highway Safety Report - Calendar Year 2010
17
SUMMARY OF FLORIDA HIGHWAY SAFETY PERFORMANCE FOR 2010
Safety Belt Usage: The use of occupant safety restraints increased to 87.4 percent and the
fatality rate of those unrestrained decreased from 0.47 per 100 million VMT in 2009 to 0.40 in
2010. Florida has surpassed the national use rate for the past two years.
Young Drivers: The fatal crash rate for drivers under age 25 declined to 3.01 per 10,000
licensed drivers. This exceeded the 1.75 fatal crash rate for older drivers (25 and older) by 72.1
percent.
Alcohol-Related: In 2010, alcohol-related fatal crashes constituted 33.0 percent of all fatal
crashes compared to 38.8 percent in 2009. Alcohol-related fatal crashes decreased by 175 in
2010, while all fatal crashes decreased by 111.
Aggressive Driving: Aggressive driving fatalities increased from 47 in 2009 to 51 in 2010,
while all fatalities decreased from 2,563 to 2,444. Aggressive driving fatalities represent 2.1
percent of all fatalities in 2010.
Intersection-Related Crashes: In 2010, intersection-related fatalities increased by 25,
accounting for 31.0 percent of total fatalities. This compares to 28.6 percent reported in 2009.
Lane Departures: In 2010, lane departure fatalities decreased by 96, accounting for 20.5
percent of total fatalities. This compares to 23.3 percent reported in 2009.
Highway Safety Report - Calendar Year 2010
18
PERFORMANCE MEASURES
FLORIDA FATALITY RATE COMPARED TO THE NATIONAL RATE
This secondary performance measure is statewide in scope and covers the key areas of safety
performance on all public roads in Florida. Although not under the full control of the
Department, this measure brings attention to the necessity for comprehensive statewide
solutions. This secondary performance measure is also reported in the Commission’s
Performance and Production Review of the Florida Department of Transportation, FY 2011.
Secondary Measure: The rate of fatalities per 100 million vehicle miles traveled (VMT) on
all public roads in Florida compared to the national average.
Objective: Reduce the Florida fatality rate to a level within 5 percent of the national rate by
2011.
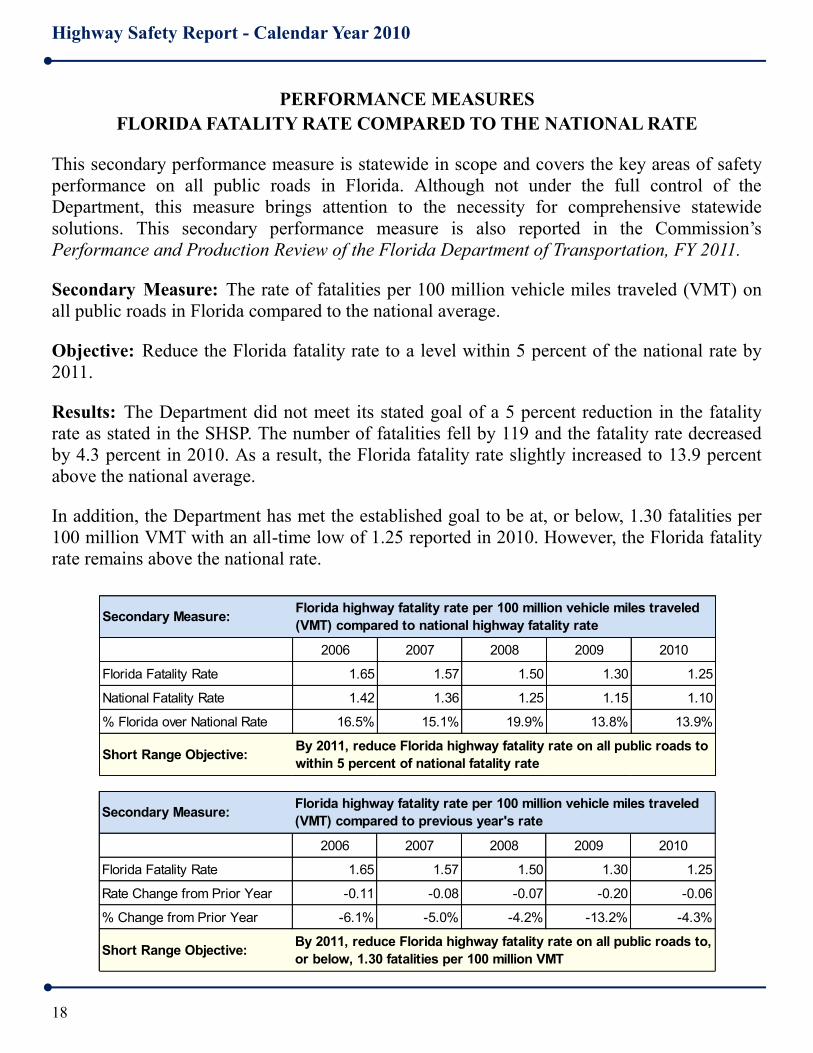
Results: The Department did not meet its stated goal of a 5 percent reduction in the fatality
rate as stated in the SHSP. The number of fatalities fell by 119 and the fatality rate decreased
by 4.3 percent in 2010. As a result, the Florida fatality rate slightly increased to 13.9 percent
above the national average.
In addition, the Department has met the established goal to be at, or below, 1.30 fatalities per
100 million VMT with an all-time low of 1.25 reported in 2010. However, the Florida fatality
rate remains above the national rate.
2006 2007 2008 2009 2010
Florida Fatality Rate 1.65 1.57 1.50 1.30 1.25
Rate Change from Prior Year -0.11 -0.08 -0.07 -0.20 -0.06
% Change from Prior Year -6.1% -5.0% -4.2% -13.2% -4.3%
Short Range Objective:By 2011, reduce Florida highway fatality rate on all public roads to,
or below, 1.30 fatalities per 100 million VMT
Secondary Measure:Florida highway fatality rate per 100 million vehicle miles traveled
(VMT) compared to previous year's rate
2006 2007 2008 2009 2010
Florida Fatality Rate 1.65 1.57 1.50 1.30 1.25
National Fatality Rate 1.42 1.36 1.25 1.15 1.10
% Florida over National Rate 16.5% 15.1% 19.9% 13.8% 13.9%
Short Range Objective:
Florida highway fatality rate per 100 million vehicle miles traveled
(VMT) compared to national highway fatality rateSecondary Measure:
By 2011, reduce Florida highway fatality rate on all public roads to
within 5 percent of national fatality rate

Highway Safety Report - Calendar Year 2010
19
PERFORMANCE MEASURES
An important measure for gauging progress is the change in fatality rate from year to year. The
Department’s commitments for safety program funding should continue to positively impact
the fatality rate over time. Increased use of safety belts, better roadway lighting, guardrails,
education and increased enforcement have resulted in the reduction in fatalities. The recession,
job losses, and the high price of gasoline are also significant factors in reducing fatalities.
Vehicle miles traveled have also decreased for the last three years.
Total Highway Fatalties Per 100 Million VMT
Florida Rate Compared to National Rate (Objective: within 5% of National Rate by 2011)
1.361.25
1.57 1.501.30 1.25
1.65
1.101.15
1.42
19.9%
15.1%13.8% 13.9%
16.5%
0.00
0.50
1.00
1.50
2.00
2.50
2006 2007 2008 2009 2010
0%
5%
10%
15%
20%
25%
Florida Fatality Rate National Fatality Rate % Over National Average
Florida Highway Fatality Rate
Change From Prior Year(Objective: < 1.30 Fatality Rate by 2011)
1.65 1.57 1.501.30 1.25
-4.2%-5.0%
-13.2%
-4.3%
-6.1%
0.00
0.50
1.00
1.50
2.00
2.50
2006 2007 2008 2009 2010
-15%
-10%
-5%
0%
Florida Fatality Rate % Change from Prior Year
Fata
liti
es p
er
100 M
illio
n V
MT
F
ata
lity
Rate
per
10
0 M
illio
n V
MT

Highway Safety Report - Calendar Year 2010
20
HIGHWAY SAFETY PERFORMANCE INDICATORS
The following indicators were developed and approved by the Florida Transportation
Commission’s Performance Measures Working Group as a tool to assess the Department’s
ability, through its safety program funding and management, to affect the various demographic
components that comprise the overall fatality rate.
CAR AND TRUCK OCCUPANT FATALITY RATE -
FLORIDA RATE COMPARED TO NATIONAL RATE
Car and Truck occupant fatalities decreased by 93 in 2010 and have decreased annually since
2005. The Florida rate exceeded the national average by only 0.3 percent in 2010.
The car and truck occupant fatality rate for Florida in 2010 was 0.76 per 100 million vehicle
miles traveled. In order to meet the Commission’s 2011 fatality rate goal of 0.70, a 7.9 percent
reduction in the fatality rate will be required in 2011.
2006 2007 2008 2009 2010
Florida Fatality Rate 1.05 0.98 0.92 0.80 0.76
Rate Change from Prior Year -0.12 -0.07 -0.06 -0.12 -0.04
% Change from Prior Year -10.5% -6.5% -6.2% -12.8% -5.6%
Short Range Objective:By 2011, reduce Florida car and truck occupant fatality rate on all
public roads to, or below, 0.7 per 100 million VMT
Florida car and truck occupant fatality rate per 100 million vehicle
miles traveled (VMT) compared to previous year's ratePerformance Indicator:
2006 2007 2008 2009 2010
Florida Fatality Rate 1.05 0.98 0.92 0.80 0.76
National Fatality Rate 1.07 1.01 0.90 0.81 0.76
% Florida over National Rate -1.3% -2.4% 2.8% -0.8% 0.3%
Short Range Objective:
Florida car and truck occupant fatality rate per 100 million vehicle
miles traveled (VMT) compared to national car and truck occupant
fatality rate
Performance Indicator:
By 2011, reduce Florida car and truck occupant fatality rate on all
public roads to 10 percent below national car and truck fatality
rate

Highway Safety Report - Calendar Year 2010
21
CAR AND TRUCK OCCUPANT FATALITY RATE
The Car and Truck Occupant Fatality Rate, and the change in rate over the previous year,
have been fluctuating over the past several years. However, both the Florida and national
fatality rate have declined in each of the last five years.
Car and Truck Occupant Fatalities Per 100 Million VMT
National and State Highway System
(Objective: 10% below National Rate by 2011)
1.05 1.07 1.01
0.760.800.920.98
0.810.900.76
-1.3%0.3%
-0.8%-2.4%
2.8%
0.00
0.50
1.00
1.50
2.00
2.50
2006 2007 2008 2009 2010
-4%
-2%
0%
2%
4%
6%
Florida Fatality Rate National Fatality Rate % Over National Average
Florida Car and Truck Occupant Fatality Rate
Change From Prior Year(Objective: < 0.70 Fatality Rate by 2011)
1.050.98 0.92 0.80
0.76
-6.2%-6.5%
-12.8%
-5.6%
-10.5%
0.00
0.50
1.00
1.50
2.00
2.50
2006 2007 2008 2009 2010
-16%
-12%
-8%
-4%
0%
Florida Fatality Rate % Change from Prior Year
Fata
liti
es p
er
100 M
illio
n V
MT
F
ata
lity
Rate
per
10
0 M
illio
n V
MT

Highway Safety Report - Calendar Year 2010
22
MOTORCYCLISTS FATALITY RATE
Overview: In 2010, motorcyclist fatalities decreased by 19 from 2009 levels. However, the 2010 Florida
fatality rate per 100 thousand registered motorcycles of 65.3 increased by 5.5 percent over
2009 due to a 9.7 percent decrease in the number of registered motorcycles in 2010. The
fatality rate meets the Commission’s goal of under 70.0 fatalities by 2011. Educational and
enforcement efforts are being credited with the reduction in fatalities. Best Practices: Although the State of Florida does not have a universal helmet law, riders under the age of 21
must wear a helmet. Those riders 21 or older and who are covered by an insurance policy
providing at least $10,000 in medical benefits are exempt from wearing a helmet.
Effective July 1, 2008, completion of the Basic Rider Course through the Florida Rider
Training Program must be completed before the motorcycle endorsement can be added to a
riders license (Section 322.12 (5), Florida Statutes).
In 2008, the FDOT, DHSMV, Department of Health (DOH), ABATE (American Bikers Aimed
Towards Education), Insurers, Law Enforcement and others created the Motorcycle Safety
Coalition and created a Strategic Plan and a Business Plan to address motorcycle safety.
Educational programs are designed for both motorcyclists and motorists. These programs
include Share the Road, Look Twice - Save a Life, and None for the Road campaigns.
Other programs for motorcyclists include None for the Road and Ride Straight - State to State,
which targets driving under the influence and included partnering with other Southern States.
According to the NCHRP (National Cooperative Highway Research Program) report, Counter
Measures That Work, strategies to promote helmet use, rider licensing or training, conspicuity
programs and other driver awareness programs are low in effectiveness. The most effective
strategy to reduce fatalities is state motorcycle helmet use laws. Another potentially effective
strategy is to reduce alcohol-impaired motorcycling through enhanced detection, enforcement
and sanctions. In general, sobriety checkpoints and saturation patrols have also proven to be
effective for reducing impaired driving and crashes. While Florida does not hold motorcyclist
specific sobriety checkpoints, law enforcement agencies make special efforts to ensure
motorcyclists are not excluded from sobriety checkpoints.

Highway Safety Report - Calendar Year 2010
23
MOTORCYCLISTS FATALITY RATE
Historically, the Florida motorcyclist fatality rate has exceeded the national average. A
significant factor contributing to this high rate of fatalities was the repeal of the motorcycle
helmet law in 2001. The national fatality rate for 2010 was not available at press time.
However, Florida has met the 2011 goal of under 70.0 fatalities per 100 thousand registered
motorcycles.
Florida Rate Compared to National Rate
2006 2007 2008 2009 2010
Florida Fatality Rate 97.96 91.81 82.10 61.92 65.30
Rate Change from Prior Year 0.45 -6.15 -9.71 -20.18 3.38
% Change from Prior Year 0.5% -6.3% -10.6% -24.6% 5.5%
Short Range Objective:
By 2011, reduce Florida motorcyclist fatality rate on all public
roads to, or below, 70.0 fatalities per 100,000 registered
motorcycles
Florida motorcyclist fatality rate per 100,000 registered
motorcycles compared to previous year's ratePerformance Indicator:
2006 2007 2008 2009 2010
Florida Fatality Rate 97.96 91.81 82.10 61.92 65.30
National Fatality Rate 72.34 72.94 68.93 57.88 NA
% Florida over National Rate 35.4% 25.9% 19.1% 7.0% NA
Short Range Objective:
Florida motorcyclist fatality rate per 100,000 registered
motorcycles compared to national motorcyclist fatality ratePerformance Indicator:
By 2011, reduce Florida motorcyclist fatality rate to within 10
percent of national motorcyclist fatality rate

Highway Safety Report - Calendar Year 2010
24
MOTORCYCLISTS FATALITY RATE
There were 19 fewer Florida motorcyclist fatalities in 2010. Florida began a major motorcycle
initiative in 2008 that promotes safety, raising other motorists awareness of motorcycles and
cracking down on risky and reckless motorcycle behaviors. Continued education and enhanced
enforcement efforts appear to be making a difference. The national fatality rate for 2010 was
not available at press time.
Motorcyclist Fatalities Per 100,000 Registered Motorcycles
National and State Highway System
(Objective: Within 10% of National Rate by 2011)
98.0
65.361.9
82.191.8
72.372.9
68.957.8
35.4%
7.1%
25.9%19.1%
0
25
50
75
100
125
2006 2007 2008 2009 2010
0%
10%
20%
30%
40%
50%
Florida Fatality Rate National Fatality Rate % Over National Average
Florida Motorcyclist Fatality Rate
Change From Prior Year(Objective: < 70.0 Fatality Rate by 2011)
98.0
91.8
82.161.9
65.3
-10.6%-6.3%
-24.6%
5.5%
0.5%
0.00
25.00
50.00
75.00
100.00
125.00
2006 2007 2008 2009 2010
-30%
-20%
-10%
0%
10%
Florida Fatality Rate % Change from Prior Year
F
ata
liti
es p
er
10
0,0
00
Reg
iste
red
Mo
torc
yc
les
Fata
lity
Rate
per
10
0,0
00
Reg
iste
red
Mo
torc
yc
les

Highway Safety Report - Calendar Year 2010
25
PEDESTRIANS FATALITY RATE
Overview: In 2010, pedestrian fatalities increased 3.5 percent from those reported in 2009 (499 compared
to 482, an increase of 17). Most pedestrian fatalities occur in urban areas, at non-intersection
locations, in normal weather conditions, and at night. Of the 499 pedestrians killed in traffic
crashes in 2010, 161 (32.3 percent) had been drinking. Best Practices: According to the NCHRP report, examples of proven engineering practices include: Providing sidewalks/walkways and curb ramps, installing or upgrading traffic and
pedestrian signals, constructing pedestrian refuge islands and raised medians, providing
vehicle restriction/diversion measures, and installing overpasses/underpasses. The use of
“Count Down” pedestrian signals are an effective intersection enhancement. Florida uses
these signals as well as installing “median refuges” or “islands” at larger intersections.
Providing crosswalk enhancements, implementing lighting/crosswalk illumination
measures and installing traffic calming for both roads and intersections. Educational, outreach and training programs are also proven strategies for improving
pedestrian and motorist awareness. For school-aged children, elementary school pedestrian training, safe routes to school
(SRTS) and child school bus training have proven effective in reducing fatalities. The Department established a statewide initiative to improve pedestrian and bicycle safety
and created the Bicycle and Pedestrian Partnership Council in 2010. The Council includes
representatives from state agencies, local governments and external stakeholders such as
walkers, bicyclists and trail users.
In 2009, NHTSA awarded a major grant to the Department’s District 7 as a demonstration
project to create comprehensive pedestrian safety programs, including an enforcement
component, during the next three years. The strategies include infrastructure
improvements that make it safer to walk, along with better education and enhanced
enforcement. This three year grant expires in September 2012; continued additional funding
will be sought.

Highway Safety Report - Calendar Year 2010
26
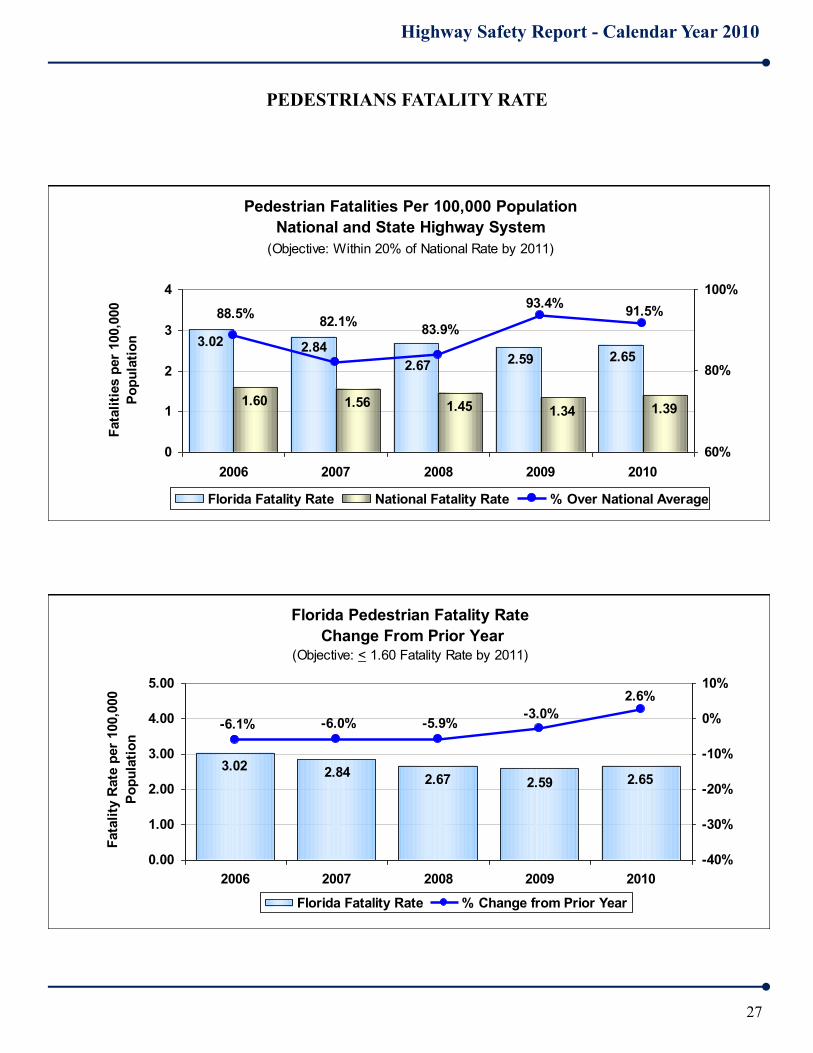
PEDESTRIANS FATALITY RATE
Florida Rate Compared to National Rate
There were 17 more pedestrian fatalities in Florida in 2010 and the fatality rate increased to
2.65 per 100,000 population. In 2010, the Florida fatality rate exceeded the national rate by
91.5 percent.
In January, 2009, the Commission challenged the Department to achieve a 10 percent annual
reduction in pedestrian fatalities. The challenge was to achieve a goal of no more than 1.6
pedestrian fatalities per 100,000 population by 2011. A forward looking analysis indicates that
a reduction in the pedestrian fatality rate of 39.6 percent in 2011 is required in order to meet
the challenge and attain the goal.
2006 2007 2008 2009 2010
Florida Fatality Rate 3.02 2.84 2.67 2.59 2.65
Rate Change from Prior Year -0.20 -0.18 -0.17 -0.08 0.07
% Change from Prior Year -6.1% -6.0% -5.9% -3.0% 2.6%
Short Range Objective:By 2011, reduce Florida pedestrian fatality rate on all public roads
to, or below, 1.6 fatalities per 100,000 population
Florida pedestrian fatality rate per 100,000 population compared to
previous year's ratePerformance Indicator:
2006 2007 2008 2009 2010
Florida Fatality Rate 3.02 2.84 2.67 2.59 2.65
National Fatality Rate 1.60 1.56 1.45 1.34 1.39
% Florida over National Rate 88.5% 82.1% 83.9% 93.4% 91.5%
Short Range Objective:
Florida pedestrian fatality rate per 100,000 population compared to
national pedestrian fatality ratePerformance Indicator:
By 2011, reduce Florida pedestrian fatality rate on all public roads
to within 20 percent of national pedestrian fatality rate
Highway Safety Report - Calendar Year 2010
27
PEDESTRIANS FATALITY RATE
Pedestrian Fatalities Per 100,000 Population
National and State Highway System
(Objective: Within 20% of National Rate by 2011)
1.60 1.45 1.34 1.39
3.022.652.59
2.67
2.84
1.56
88.5% 91.5%93.4%
82.1%83.9%
0
1
2
3
4
2006 2007 2008 2009 2010
Fata
liti
es p
er
100,0
00
Po
pu
lati
on
60%
80%
100%
Florida Fatality Rate National Fatality Rate % Over National Average
Florida Pedestrian Fatality Rate
Change From Prior Year(Objective: < 1.60 Fatality Rate by 2011)
3.022.652.592.67
2.84
-6.1%
2.6%
-3.0%-6.0% -5.9%
0.00
1.00
2.00
3.00
4.00
5.00
2006 2007 2008 2009 2010
Fata
lity
Rate
per
100,0
00
Po
pu
lati
on
-40%
-30%
-20%
-10%
0%
10%
Florida Fatality Rate % Change from Prior Year

Highway Safety Report - Calendar Year 2010
28
BICYCLISTS FATALITY RATE
Overview:
In 2010, bicyclist fatalities declined by 24.0 percent from those reported in 2009 (from 100 to
76). Fatal bicycle crashes exhibit the same patterns as pedestrian fatal crashes in that most
occur in conditions other than daylight. Road users have failed to appreciate the magnitude of
the problem and cyclists have failed to appreciate the benefits of reflective gear or lights.
Recent work suggests that educational interventions can increase road users’ awareness of the
need to be conspicuous and can demonstrate behaviors that increase nighttime safety.
Best Practices:
In addition to helmet laws for children and adults, education and enforcement appear to be the
next most effective means for reducing bicyclist fatalities. Engineering improvements would
include adding bicycle lanes when constructing or reconstructing highways. Section 316.2065
(3)(d), Florida Statutes, requires that a bicycle rider or passenger under 16 years of age must
wear an approved bicycle helmet.
As previously indicated, the Department established a statewide initiative to improve
pedestrian and bicycle safety and created the Bicycle and Pedestrian Partnership Council in
2010. The Council includes representatives from state agencies, local governments and
external stakeholders such as walkers, bicyclists and trail users. The Council will make
recommendations on design, planning, safety and other programs involving bicycle and
pedestrian issues.
With varying degrees of success, according to the NCHRP, examples of education and
enforcement activities include:
Share the Road awareness campaigns.
Educational programs focusing on Riding with Traffic, not against traffic.
Educational programs emphasizing the benefits of wearing a helmet and reflective clothing
and using reflectors and lights at night.
Increase traffic law compliance by both motorists and bicyclists. Train law enforcement
officers in appropriate enforcement strategies. In particular, decrease wrong-way riding,
sidewalk riding and traffic control violations by bicyclists; and decrease speeding, cutting
off bicyclists, passing too closely, or blocking or driving in a designated bicycle lane by
motorists.
All of the identified educational programs are currently being used in Florida.

Highway Safety Report - Calendar Year 2010
29
BICYCLISTS FATALITY RATE
Florida Rate Compared to National Rate
The Department’s impact on this indicator is limited to the planning and designing of
bikeways in new construction and candidate widening projects. Education for drivers and
bicyclists along with enforcement of traffic laws will also have an impact on reducing this
fatality rate. Although the Florida bicyclist fatality rate significantly declined (24.7 percent) in
2010, it has continued to remain well above the national fatality rate.
In January, 2009, the Commission challenged the Department to achieve a 10 percent annual
reduction in bicyclist fatalities. The challenge was to achieve a goal of no more than 0.4
bicyclist fatalities per 100,000 population by 2011. The Department achieved a bicyclist
fatality rate of 0.40 in 2010 thereby attaining this goal for the first time.
2006 2007 2008 2009 2010
Florida Fatality Rate 0.70 0.65 0.63 0.54 0.40
Rate Change from Prior Year 0.03 -0.05 -0.02 -0.09 -0.13
% Change from Prior Year 4.9% -7.0% -3.1% -14.4% -24.7%
Short Range Objective:
Florida bicyclist fatality rate per 100,000 population compared to
previous year's ratePerformance Indicator:
By 2011, reduce Florida bicycle fatality rate on all public roads to,
or below, 0.4 fatalities per 100,000 population
2006 2007 2008 2009 2010
Florida Fatality Rate 0.70 0.65 0.63 0.54 0.40
National Fatality Rate 0.26 0.23 0.24 0.20 0.20
% Florida over National Rate 169.5% 179.9% 165.3% 162.5% 101.9%
Short Range Objective:
Florida bicyclist fatality rate per 100,000 population compared to
national bicyclist fatality ratePerformance Indicator:
By 2011, reduce Florida bicycle fatality rate on all public roads to
within 50 percent of national bicycle fatality rate

Highway Safety Report - Calendar Year 2010
30
BICYCLISTS FATALITY RATE
Bicyclist Fatalities Per 100,000 Population
National and State Highway System(Objective: Within 50% of National Rate by 2011)
0.70
0.400.54
0.630.65
0.200.200.240.230.26
169.5%
101.9%
162.5%
179.9%165.3%
0
1
2
2006 2007 2008 2009 2010
Fata
liti
es p
er
100,0
00 P
op
ula
tio
n
60%
100%
140%
180%
220%
Florida Fatality Rate National Fatality Rate % Over National Average
Florida Bicyclist Fatality Rate
Change From Prior Year(Objective: < 0.40 Fatality Rate by 2011)
0.70
0.400.54
0.630.65
4.9%
-24.7%
-14.4%
-7.0%-3.1%
0.00
1.00
2.00
2006 2007 2008 2009 2010
Fata
lity
Rate
per
100,0
00 P
op
ula
tio
n
-40%
-25%
-10%
5%
20%
Florida Fatality Rate % Change from Prior Year

Highway Safety Report - Calendar Year 2010
31
SAFETY BELT USAGE AND FATALITY RATE
Overview:
In 2010, fatalities for unrestrained car and truck occupants decreased by 15.3 percent
compared to 2009 (from 917 to 777, a decrease of 140). Florida safety belt usage increased to
87.4 percent (from 85.2 percent in 2009) exceeding the national rate of 85.0 percent. The
safety belt usage in Florida for 2011 is 88.1 percent.
Safety belt usage varies widely from state to state, reflecting factors such as differences in
public attitudes, enforcement practices, legal provisions, and public information and education
programs.
Pickup truck drivers and their passengers continue to be among the lowest safety belt wearers.
Best Practices:
An overall program that includes a public awareness campaign, increased enforcement and a
primary safety belt law has proven to be the best strategy to both increase safety belt usage and
decrease the number of injuries and fatalities attributed to not wearing safety belts.
The Florida Legislature passed, and the Governor signed, a Primary Safety Belt Law that
took effect on June 30, 2009 (Section 316.614, Florida Statutes). A safety belt (or child
restraint device) is mandatory for all drivers and occupants under the age of 18. All
passengers in the front seat, regardless of age, must also wear a safety belt when the vehicle
is in motion.
“Click It or Ticket” awareness waves that are sustained and that do not occur only during
media campaign blitzes are effective.
In Florida, State and local agencies, along with AAA and AARP, conduct “CarFit” events
throughout the year to ensure drivers properly “fit” their vehicles, particularly older drivers.

Highway Safety Report - Calendar Year 2010
32
SAFETY BELT USAGE AND FATALITY RATE
In 2010, 53.6 percent of fatalities occurred where the driver or occupant was not using safety
belts. In addition to the Primary Safety Belt Law, focused education and enforcement are
activities that positively affect safety belt usage. Child passenger seat giveaways, with multi-
lingual education on usage, and special needs seat programs have been of benefit in
reducing fatalities. Florida is only one of two states that does not have a booster seat law and
was cited by the National Transportation Safety Board (NTSB) as having the most lenient
child passenger safety law in the nation.
Florida Safety Belt Usage and Fatality Rates
2006 2007 2008 2009 2010
Florida Unrestrained Car and
Truck Occupant Fatality Rate0.64 0.58 0.55 0.47 0.40
Florida Car and Truck Occupant
Fatality Rate1.03 0.98 0.90 0.79 0.74
% Unrestrained to All 61.9% 59.5% 60.4% 59.0% 53.6%
Performance Indicator:
Florida car and truck unrestrained occupant fatality rate per 100
million vehicle miles traveled (VMT) compared to Florida car and
truck all occupant fatality rate
2006 2007 2008 2009 2010
Florida Unrestrained Car and
Truck Occupant Fatality Rate0.64 0.58 0.55 0.47 0.40
Rate Change from Prior Year 0.00 -0.05 -0.04 -0.08 -0.07
% Change from Prior Year 0.1% -8.4% -6.5% -14.6% -15.0%
Florida car and truck unrestrained occupant fatality rate per 100
million VMT compared to previous year's ratePerformance Indicator:
Performance Indicator:
2006 2007 2008 2009 2010
% of Safety Belt Usage 80.7% 79.1% 81.7% 85.2% 87.4%
Florida Safety Belt Usage

Highway Safety Report - Calendar Year 2010
33
SAFETY BELT USAGE AND FATALITY RATE
Florida Car and Truck Unrestrained Fatality Rate
Compared to Florida Car and Truck All Occupant Fatality Rate
0.640.400.470.550.58
1.03
0.790.900.98
0.74
61.9%
53.6%
59.0%59.5% 60.4%
0
1
2
2006 2007 2008 2009 2010
Fata
liti
es p
er
100 M
illi
on
VM
T
50%
55%
60%
65%
Unrestrained Fatality Rate All Occupant Fatality Rate % of Unrestrained to All
Florida Safety Belt Usage
80.7% 87.4%85.2%81.7%79.1%
0%
50%
100%
2006 2007 2008 2009 2010
Perc
en
tag
e
Safety Belt Usage Rate
Florida Unrestrained Occupant Fatality Rate
Change From Prior Year
0.64
0.400.470.550.58
0.1%
-15.0%-14.6%
-8.4%-6.5%
0.00
1.00
2.00
2006 2007 2008 2009 2010
Fata
lity
Rate
per
100 M
illi
on
VM
T
-20.0%
-10.0%
0.0%
10.0%
Unrestrained Occupant Fatality Rate % Change from Prior Year

Highway Safety Report - Calendar Year 2010
34
YOUNG DRIVERS FATAL CRASH RATE
Overview:
Fatal crashes involving young drivers (under the age of 25) decreased by 13.1 percent in 2010
compared to 2009 (from 697 to 606, a decrease of 91). Young drivers are more likely to
engage in risky driving behaviors, such as speeding and tailgating, and lacking experience,
they are the least able to cope with hazardous situations. Focus group studies indicate that
teens do not see anything wrong with underage drinking, only buckle up with safety belts from
fear of enforcement, are distracted by too many occupants (particularly other teens), and “feel
the need to speed.” With the inclusion of “teen drivers” in the 2011 SHSP, the Department and
its safety partners will be placing renewed emphasis on the safety of 15 to 19 year old drivers.
Best Practices:
Limit the number of passengers under the age of 18 riding with teen drivers. The risk of a
crash involving a teen driver increases with each additional teen passenger in the vehicle.
Improve the process of testing young drivers to obtain a drivers license.
Enhance the Graduated Drivers License (GDL) program and enforce compliance.
Enhancements could include requiring more driving hours with a restricted license before
being eligible for a license; requiring more adult supervisory hours; limiting eligible
nighttime hours of driving; and limiting the number of teens allowed as passengers for a
longer period.
Enhance driver education opportunities.
Enhance enforcement of driver license restrictions and safety belt usage, and increase DUI
checkpoint opportunities.
Pursuant to Section 322.16, Florida Statutes, a person who holds a driver’s license and who is
under 17 years of age, when operating a motor vehicle after 11 p.m. and before 6 a.m., must be
accompanied by a driver who holds a valid driver’s license and is at least 21 years of age,
unless that person is driving directly to or from work. Also, drivers who are 17 years of age
have the same requirement during the hours after 1 a.m. and before 5 a.m., unless driving
directly to or from work. Section 322.1615, Florida Statutes, also provides that the holder of a
“learner’s” driver’s license must be accompanied at all times by a driver who holds a valid
driver’s license and is at least 21 years of age and may only operate a vehicle until 10 p.m.
after 3 months following the issuance of the learner’s driver’s license. Safety belt usage for all
drivers and occupants under the age of 18 is mandatory.

Highway Safety Report - Calendar Year 2010
35
YOUNG DRIVERS FATAL CRASH RATE
Florida Fatal Crash Rate
Drivers under the age of 25 are 72 percent more likely to be involved in a fatal crash than a
driver 25 years of age or older. The Department has limited ability to affect this indicator.
The young drivers fatal crash rate (fatal crashes per 10,000 licensed drivers) decreased 11.0
percent in 2010 while the older drivers fatal crash rate decreased by 4.9 percent.
In January 2009, the Commission adopted a resolution challenging the Department to reduce
the rate of fatal crashes by young drivers (under 25 years of age) to no more than 50 percent
above the rate of drivers 25 years and older by 2011. In 2010, the young drivers fatal crash rate
exceeded the fatal crash rate of drivers older than 25 by 72.1 percent, with improvement noted
over the last three years.
2006 2007 2008 2009 2010
Rate of Young Drivers Involved
in Fatal Crashes5.19 4.93 4.20 3.39 3.01
Rate Change From Prior Year -0.10 -0.25 -0.73 -0.82 -0.37
% Change From Prior Year -1.8% -4.9% -14.8% -19.4% -11.0%
Rate per 10,000 licensed drivers of young drivers (under age 25)
involved in fatal crashes compared to previous year's ratePerformance Indicator:
2006 2007 2008 2009 2010
Rate of Young Drivers Involved
in Fatal Crashes5.19 4.93 4.20 3.39 3.01
Rate of Drivers 25 and Older
Involved in Fatal Crashes2.42 2.28 2.22 1.84 1.75
% of Young Drivers Over
Drivers Aged 25 and Older114.2% 116.0% 89.7% 83.9% 72.1%
Short Range Objective:By 2011, reduce Florida young drivers fatal crash rate to no more
than 50 percent above older drivers fatal crash rate
Rate per 10,000 licensed drivers of young drivers (under age 25)
involved in fatal crashes compared to drivers aged 25 or olderPerformance Indicator:

Highway Safety Report - Calendar Year 2010
36
YOUNG DRIVERS FATAL CRASH RATE
Florida Young Drivers Fatal Crash Rate
Change From Prior Year
5.19
3.013.39
4.20
4.93
-1.8% -11.0%
-19.3%
-4.9%
-14.8%
0.00
1.00
2.00
3.00
4.00
5.00
6.00
7.00
2006 2007 2008 2009 2010
Fata
l C
rash
es p
er
10,0
00 L
icen
sed
Dri
vers
-40%
-30%
-20%
-10%
0%
Young Drivers Fatal Crash Rate % Change from Prior Year
Florida Fatal Crash Rate of Young Drivers (under age 25)
Compared to Older Drivers (over age 25)(Objective: Young Driver Rate no more than 50% above Older Driver Rate by 2011)
4.93
4.20
3.393.01
5.19
2.42 2.28 2.221.84 1.75
89.7%116.0%83.9%
72.1%
114.2%
0
1
2
3
4
5
6
7
2006 2007 2008 2009 2010
Fata
l C
rash
es p
er
10,0
00 L
icen
sed
Dri
vers
0%
40%
80%
120%
Rate of Young Drivers Rate of Older Drivers % Of Young Drivers to Older Drivers

Highway Safety Report - Calendar Year 2010
37
ALCOHOL-RELATED FATAL CRASH RATE
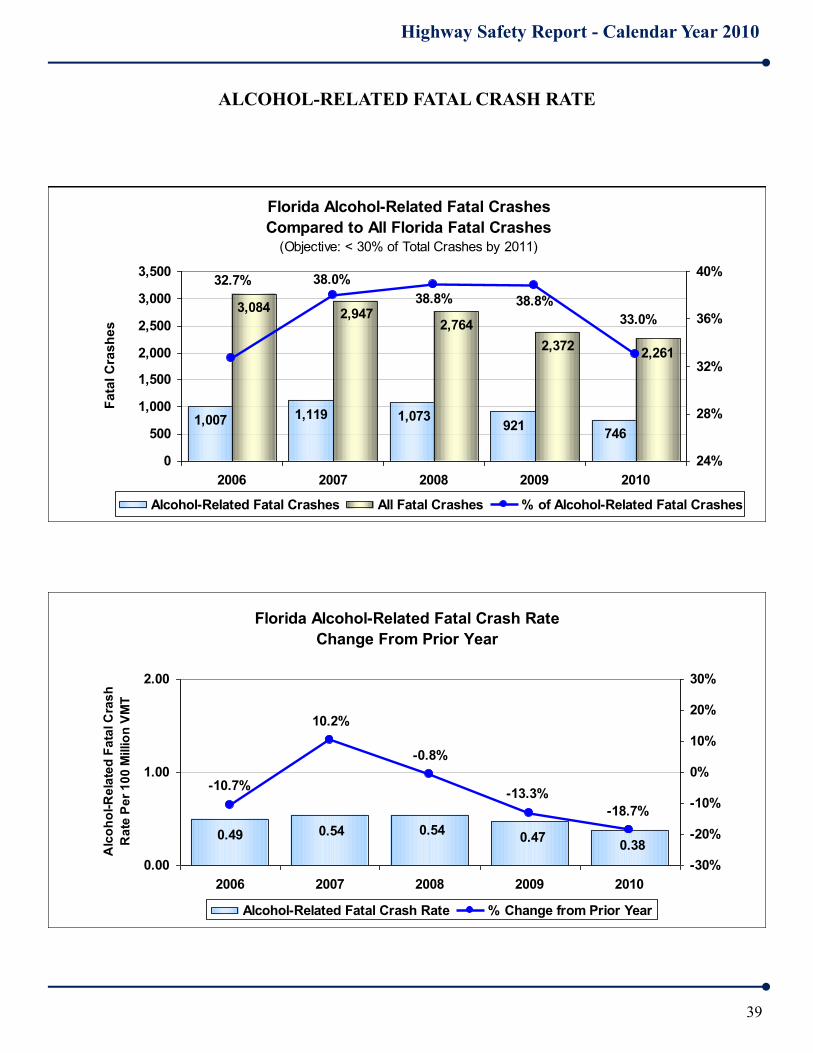
Overview:
In 2010, alcohol-related fatal crashes constituted 33.0 percent of all fatal crashes compared to
38.8 percent reported in 2009. Alcohol-related fatal crashes decreased by 175 in 2010, while
all fatal crashes decreased by 111. The alcohol-related fatal crash rate per 100 million vehicle
miles traveled (VMT) for 2010 was 0.38. Alcohol-related fatal crashes are not just restricted to
passenger vehicles but include impaired motorcyclists, bicyclists, and pedestrians.
Efforts over the past 20 years have had significant impacts on the reduction in alcohol-related
fatal crashes. Legislation lowering the allowable blood alcohol limit, DUI checkpoints and
saturation waves along with public service announcements and public education have
contributed to the reduction in alcohol-related fatal crashes.
Best Practices:
Effective January 1, 2009, all high Blood Alcohol Content (BAC) and repeat offenders are
required, by law, to have Ignition Interlock Devices (IID’s) installed on their vehicle in
Florida.
Checkpoints: frequent, highly publicized DUI checkpoints are one of the best ways to
reduce impaired driving crashes and fatalities. Saturation patrols, consisting of a large
number of law enforcement officers patrolling a specific area for a set time, have also
proven to be effective in reducing fatal crashes.
The Department facilitated the establishment of the Florida Impaired Driving Coalition
which includes law enforcement, the Judiciary, the State Attorney’s Office, Florida
Department of Law Enforcement, Mothers Against Drunk Driving, intervention programs,
and others to tackle the variety of complex issues surrounding impaired driving. The 34
member Coalition, through a series of meetings held since April 2010, developed an
Impaired Driving Strategic Plan. The strategic plan was published in September 2011 and
includes various goals, objectives, and strategies to reduce impaired driving fatalities while
maximizing available resources.
Education and public service announcements are somewhat effective.
Enforcement of strict DUI laws and driver license suspensions can be very effective.

Highway Safety Report - Calendar Year 2010
38
ALCOHOL-RELATED FATAL CRASH RATE
Florida Fatal Crash Rate
In January 2009, the Commission also challenged the Department to reduce alcohol-related
fatal crashes to less than 30 percent of all fatal crashes by 2011. Actual results for 2010 are
reported at 33 percent, a significant improvement over the previous 3 years.
Of drinking drivers, 21 year old drivers had the highest involvement rate in all crashes,
whereas, 27 year old drivers had the highest involvement rate in fatal crashes.
2006 2007 2008 2009 2010
Florida Alcohol-Related Fatal
Crash Rate0.49 0.54 0.54 0.47 0.38
Rate Change from Prior Year -0.06 0.05 0.00 -0.07 -0.09
% Change from Prior Year -10.7% 10.2% -0.8% -13.3% -18.7%
Florida alcohol-related fatal crash rate per 100 million vehicle miles
traveled (VMT) compared to previous year's ratePerformance Indicator:
Performance Indicator:
2006 2007 2008 2009 2010
Florida Alcohol-Related Fatal
Crashes1,007 1,119 1,073 921 746
All Florida Fatal Crashes 3,084 2,947 2,764 2,372 2,261
% Alcohol-Related Fatal
Crashes32.7% 38.0% 38.8% 38.8% 33.0%
Short Range Objective:By 2011, reduce Florida alcohol-related fatal crashes on all public
roads to less than 30 percent of all fatal crashes
Percent of alcohol-related fatal crashes to all fatal crashes
Highway Safety Report - Calendar Year 2010
39
Florida Alcohol-Related Fatal Crashes
Compared to All Florida Fatal Crashes(Objective: < 30% of Total Crashes by 2011)
1,007746
9211,0731,119
2,2612,372
2,7642,947
3,084
32.7%
33.0%
38.8%
38.0%
38.8%
0
500
1,000
1,500
2,000
2,500
3,000
3,500
2006 2007 2008 2009 2010
24%
28%
32%
36%
40%
Alcohol-Related Fatal Crashes All Fatal Crashes % of Alcohol-Related Fatal Crashes
ALCOHOL-RELATED FATAL CRASH RATE
Florida Alcohol-Related Fatal Crash Rate
Change From Prior Year
0.490.38
0.470.540.54
-10.7%
-18.7%
-13.3%
10.2%
-0.8%
0.00
1.00
2.00
2006 2007 2008 2009 2010
Alc
oh
ol-
Re
late
d F
ata
l C
ras
h
Ra
te P
er
10
0 M
illio
n V
MT
-30%
-20%
-10%
0%
10%
20%
30%
Alcohol-Related Fatal Crash Rate % Change from Prior Year
Fata
l C
rash
es

Highway Safety Report - Calendar Year 2010
40
National Statistics
NHTSA National Center for Statistics and Analysis
NHTSA Annual Assessment of Motor Vehicle Crashes
National Cooperative Highway Research Program (NCHRP), Counter Measures That
Work: A Highway Safety Countermeasure Guide for State Highway Safety Offices, 6th
Edition 2011
Florida Statistics
FDHSMV - Annual Performance Report
FDHSMV - Traffic Crash Statistics Report, 2010
FDOT Safety Office
FDOT - Highway Safety Performance Plan, FY 2011
FDOT - Highway Safety Improvement Program, 2010 Annual Report
Florida Strategic Highway Safety Plan, 2006
References


HIGHWAY SAFETY REPORT FOR HIGHWAY SAFETY REPORT FOR HIGHWAY SAFETY REPORT FOR
CALENDAR YEAR 2010CALENDAR YEAR 2010CALENDAR YEAR 2010
September 14, 2011September 14, 2011September 14, 2011
Florida Transportation Commission
605 Suwannee Street, MS 9
Tallahassee, Florida 32399-0450
Telephone: (850) 414-4105 | Facsimile: (850) 414-4234
www.ftc.state.fl.us