Highway Performance Monitoring System - Transportation · 11 - Other (e.g., brick, cobblestone,...
46
Highway Performance Monitoring System (HPMS): Concepts, Data Collection & Reporting Requirements Module III 1
Transcript of Highway Performance Monitoring System - Transportation · 11 - Other (e.g., brick, cobblestone,...

Highway Performance Monitoring System (HPMS): Concepts, Data Collection & Reporting Requirements
Module III
1

Lesson 1: Sections & Sample Panel ID File StructureLesson 2: Pavement Data Items & TPM PM2 Rule-
related ModificationsLesson 3: Special Networks Data Items
HPMS Data Reporting Requirements
2

Sections and Sample Panel Identification File Structures
Lesson One
3

Sections Dataset File Structure
Field Number Field Name
Section
1 Year_Record
2 State_Code
3 Route_ID
4 Begin_Point
5 End_Point
6 Data_Item
7 Section_Length
8 Value_Numeric
9 Value_Text
10 Value_Date
11 Comments (optional)
• Used to report the State’s roadway attribute data (at most, 70 data items)
• Contains 11 data fieldso 7 required fieldso 3 item-dependent fieldso 1 optional field
• Data Typeso Numerico Texto Date
4
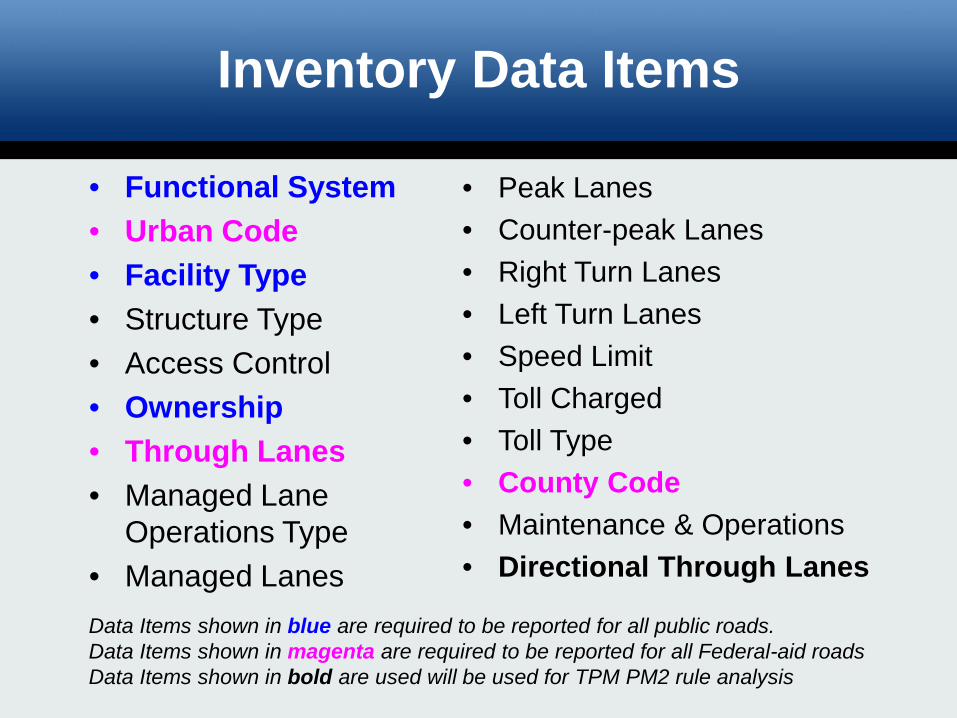
• Functional System• Urban Code• Facility Type• Structure Type • Access Control• Ownership• Through Lanes• Managed Lane
Operations Type• Managed Lanes
Inventory Data Items
• Peak Lanes• Counter-peak Lanes• Right Turn Lanes• Left Turn Lanes • Speed Limit• Toll Charged• Toll Type• County Code• Maintenance & Operations• Directional Through Lanes
Data Items shown in blue are required to be reported for all public roads. Data Items shown in magenta are required to be reported for all Federal-aid roadsData Items shown in bold are used will be used for TPM PM2 rule analysis

• Route Number• Route Signing• Route Qualifier• Alternative Route Name • Annual Average Daily
Travel (AADT)• Single-unit Truck & Bus
AADT• Percent Peak Single-
unit Trucks & Buses• Combination Truck
AADT
Route & Traffic Data Items
• Percent Peak Combination Trucks
• K-factor• Directional Factor• Future AADT• Signal Type• Percent Green Time• No. of Signalized, Stop
Sign, Type-Other Intersections
• Capacity
Data Items shown in magenta are required to be reported for all Federal-aid roads

• Lane Width• Median Type• Median Width• Shoulder Type• Right Shoulder Width• Left Shoulder Width• Peak Parking
Geometric Data Items
• Widening Obstacles• Widening Potential• Curve Classification• Terrain Type • Grade Classification• Percent Passing Sight
Distance
7

• International Roughness Index (IRI)
• Present Serviceability Rating (PSR)
• Surface Type• Rutting• Faulting• Cracking Percent
Pavement Data Items
• Year of Last Improvement
• Year of Last Construction
• Last Overlay Thickness• Thickness Rigid• Thickness Flexible• Base Type• Base Thickness• Climate Zone• Soil Type
8Data Items shown in bold are used will be used for TPM PM2 rule analysis

• National Highway System (NHS)• Strategic Highway Network (STRAHNET)• National Truck Network (NN)• Future NHS (Planned/Unbuilt NHS)
Special Networks Data Items
9

Example Sections Dataset
Year_Record|State_Code|Route_ID|Begin_Point|End_Point|Data_Item|Section_Length|Value_Numeric|Value_Text|Value_Date|Comments
2009|41|000100200S00|0|0.75|AADT|0.75|14800|Factored ‘06 AADT||
2009|41|000100200S00|0.75|5.32|AADT|4.57|14700||4/2009|Est. AADT
2009|41|000100200S00|0|0.10|IRI|0.10|118||3/2009|
2009|41|000100200S00|0.10|0.20|IRI|0.10|94||5/2008|
2009|41|000100200S00|0.20|0.30|IRI|0.10|66||4/2008|
2009|41|000100200S00|0|0.75|Through_Lanes|0.75|4|||
2009|41|000100200S00|0.75|5.32|Through_Lanes|4.57|4|||Widened in ‘08
10

Sample Panel Identification Dataset File Structure
• Used to report the location of the State’s sample sections
• Contains 7 data fields• Data Types
o Numerico Text
Field Number Field Name
Sample PanelSection
1 Year_Record
2 State_Code
3 Route_ID
4 Begin_Point
5 End_Point
6 Section_Length
7 Sample_ID
11

Year_Record|State_Code|Route_ID|Begin_Point|End_Point|Section_Length|Sample_ID
2009|41|000100200S00|0|0.75|0.75|111
2009|41|000100200S00|.75|5.32|4.57|112
2009|41|000100200S00|0|0.75|0.75|113
2009|41|000100200S00|0.75|5.32|4.57|114
2009|41|000100200S00|5.32|5.69|0.37|115
2009|41|000100200S00|0|0.75|0.75|116
2009|41|000100200S00|.75|5.32|4.57|117
Sample Panel ID Dataset
12

TOPS Development Process
13

• Sections Data
0 mi 1.28 mi 2.32 mi 3.71 mi0.67 mi 2.10 mi1.82 mi 3.22 mi
44 39 36
Sections and Sample Panel ID Datasets - Relationship
2009|41|000100200S00|0|0.67|Pct_Green_Time|0.67|44|||2009|41|000100200S00|1.28|1.82|Pct_Green_Time|0.54|39|||2009|41|000100200S00|2.10|2.32|Pct_Green_Time|0.22|39|||2009|41|000100200S00|2.32|3.22|Pct_Green_Time|0.90|36|||
• Sample Panel ID Data 2009|41|000100200S00|0|0.58|0.58|1112009|41|000100200S00|1.42|1.82|0.40|1122009|41|000100200S00|2.27|3.03|0.76|113
0 mi 0.58 mi 1.42 mi 1.82 mi 2.27 mi 3.03 mi
ID = 111 ID = 112 ID = 113
39
0 mi 0.58 mi 1.42 mi 1.82 mi 2.27 mi 3.03 mi
• Sample Sections ID = 111 ID = 112 ID = 113
14

• In most cases, Sections data can be reported for any given extent
• FHWA applies business rules to Sections data for sample data purposes
• Business rules are used to calculate roadway section-specific values for each applicable data item
Data Aggregation/Calculation
15

Data Aggregation Rules and Calculation Methods
• Combination
• Minimum Value
• Predominance
• Weighted Averaging
Item Number Data Item Method
1 F_System * No Calculation Required
2 Urban_Code * No Calculation Required
3 Facility_Type * No Calculation Required
4 Structure_Type No Calculation Required
5 Access_Control Predominance
6 Ownershp Predominance
7 Through_Lanes * No Calculation Required
8 HOV_Type Predominance
9 HOV_Lanes *** Predominance
10 Peak_Lanes Predominance
11 Counter_Peak_Lanes Predominance
12 Turn_Lanes_R Predominance
13 Turn_Lanes_L Predominance
14 Speed_Limit Predominance
15 Toll_Charged Predominance
16 Toll_Type Predominance
17 Route_Number Predominance
18 Route_Signing Predominance
19 Route_Qualifier Predominance
20 Alternative_Route_Name Predominance
21 AADT * No Calculation Required#
22 AADT_Single_Unit Weighted Averaging
23 Pct_ Peak_ Single Weighted Averaging
16

• Sections Data
0 mi 1.28 mi 2.32 mi 3.71 mi0.67 mi 2.10 mi1.82 mi 3.22 mi
Aggregating/Calculating Sample Section Values
2009|41|000100200S00|0|0.67|Pct_Green_Time|0.67|44|||2009|41|000100200S00|1.28|1.82|Pct_Green_Time|0.54|39|||2009|41|000100200S00|2.10|2.32|Pct_Green_Time|0.22|39|||2009|41|000100200S00|2.32|3.22|Pct_Green_Time|0.90|36|||
0 mi 0.58 mi 1.42 mi 1.82 mi 2.27 mi 3.03 mi
• Sample Sections ID = 111 ID = 112 ID = 113
44 39 36.2
17
44 39 39 36
• Sample Panel ID Data 2009|41|000100200S00|0|0.58|0.58|1112009|41|000100200S00|1.42|1.82|0.40|1122009|41|000100200S00|2.27|3.03|0.76|113
0 mi 0.58 mi 1.42 mi 1.82 mi 2.27 mi 3.03 mi
ID = 111 ID = 112 ID = 113

Questions???
18

Lesson Two
Pavement Data Items & TPM PM2 Rule-related Modifications
19

• Pavement Data & Distress Items • PM2 Rule Modifications• Data Collection/Reporting Guidance• Coding Scenarios• Directional Reporting Options
Lesson Topics
20

Pavement Data & Distress Items
IRI (International Roughness Index): • Road roughness measurement • Required for all surface types• Reported in inches/mile
PSR (Pavement Serviceability Rating):• Visual inspection-based pavement condition
rating• Can be reported in lieu of IRI• Reported/coded on scale of 0 (poor) to 5 (very
good, in units of tenths (e.g., 4.2)
https://www.researchgate.net/figure/258391356_fig1_International-roughness-index-IRI-determination-through-measurement-of-pavement 21

Pavement Data & Distress Items (cont’d)
Rutting : • Longitudinal surface depressions in asphalt
pavement • Required for asphalt pavements• Reported as the average depth of ruts on a
section to the nearest 0.01 inch
Faulting : • Vertical misalignment of joints in Jointed
Concrete Pavement• Req. for jointed-concrete pavements• Reported as average/mean absolute
faulting to the nearest 0.01 inch

Pavement Data & Distress Items (cont’d)
Cracking Percent : • Percentage of pavement surface
exhibiting cracking • Required for all surface types• Reported as percent of section area or
slabs to the nearest 1%
Source: http://www.publicdomainpictures.net/pictures/100000/nahled/background-1411379004Euy.jpg
Surface Type: • One of 11 FHWA surface type codes
determined from visual inspection or construction records
• Preservation treatments of < 0.5 in. compacted material shall be excluded surface type determination
23

1-24
Code IRI PSR Rutting FaultingCracking Percent
Thickness Rigid
Thickness Flexible
1 - Unpaved2 - Bituminous in/mi 0.1-5.0 0.01” Fatigue % area 0.5”
3 - JPCP (includes whitetopping) in/mi 0.1-5.0 0.01” % cracked slabs 0.5”0.5” include
for white-topping only
4 - JRCP (includes whitetopping) in/mi 0.1-5.0 0.01” % cracked slabs 0.5”0.5” include
for white-topping only
5 - CRCP in/mi 0.1-5.0Punchout/ long./patch % area
0.5”
6 - Composite (AC / AC) in/mi 0.1-5.0 0.01” Fatigue % area 0.5”7 - Composite (AC / JCP) in/mi 0.1-5.0 0.01” Fatigue % area 0.5” 0.5”8 - Composite (Bituminous / CRCP) in/mi 0.1-5.0 0.01” Fatigue % area 0.5” 0.5”
9 - Composite (Unbonded JC / PCC) in/mi 0.1-5.0 0.01” % cracked slabs 0.5”
11 - Other (e.g., brick, cobblestone, etc.) in/mi 0.1-5.0
0.5”10 - Composite (Bonded JC / PCC) in/mi 0.1-5.0 0.01” % cracked slabs
Reference: HPMS Field Manual - Table 4.5
Pavement Data Item Requirements by Surface Type

Year 2
State Central Office
Year 1
District Office #1
MPOs
District Office #N
District Office #2
Local Governments
HPMS Data Dist #1
HPMS Data Local Govts
HPMS Data MPOs
HPMS Data Dist #N
HPMS Data Dist #2
Data Collection, Aggregation, and Quality Review
Traffic Database
Pavement Database
Submittal to FHWA
Jan. 1, Year 2
April 15, Year 2
June 1, Year 2
June 15, Year 2
Certified Public Road Mileage
Interstate Pavement and Related Data
Non- Interstate Pavement, Non-
Pavement, Sample and Summary
Data
FHWA Review and Certification
Data Distribution and Reporting
Highway Statistics
Conditions and
Performance ReportRoad
Inventory
Spatial Component
Performance Assessment
National Highway Datasets
Travel Time Metric Data
Performance Assessment
1
3
2
1Beginning April 15, 20192Beginning June 15, 2021 (Non-IS NHS Pavement)3Beginning June 15, 2018
25
HPMS Workflow / Timeline

Pre-PM2 Post-PM2
Data Item
Roadway System
Extent Collection Cycle
Direction Extent Collection Cycle
Direction
IRIInterstate (IS) Full Extent Annual Inventory Full Extent Annual Inventory*
Non-IS NHS Full Extent Annual Inventory Full Extent Biennial Inventory
SurfaceType
Interstate (IS) Sample Biennial Inventory Full Extent Annual Inventory*
Non-IS NHS Sample Biennial Inventory Full Extent Biennial Inventory
Rutting Interstate (IS) Sample Biennial Inventory Full Extent Annual Inventory*
Non-IS NHS Sample Biennial Inventory Full Extent Biennial Inventory
FaultingInterstate (IS) Sample Biennial Inventory Full Extent Annual Inventory*
Non-IS NHS Sample Biennial Inventory Full Extent Biennial Inventory
Cracking Percent
Interstate (IS) Sample Biennial Inventory Full Extent Annual Inventory*
Non-IS NHS Sample Biennial Inventory Full Extent Biennial Inventory
26*States can opt to report distress data independently for divided Interstate highway sections
2017 Pavement & Bridge Condition Rule (PM2)-related Modifications

• Collect in the rightmost through lane or one consistent lane
• Collect and report in uniform section lengths of 0.1 mi. (528 ft.); sections shall not exceed 0.11 mi.
• PSR, Rutting, Faulting, Cracking shall be collected for milepoint limits (i.e., sections) that are consistent with those reported for IRI
Pavement Data Collection/Reporting Guidance
27

• The following codes must be used to specify why data could not be collected on an NHS section• A: Construction - Roadway under construction
• B: Closure - Roadway closed to traffic
• C: Disaster - Roadway is in area declared as a disaster zone
• D: Deterioration - Roadway too deteriorated to measure and already rated “poor”
• E: Other – E.g. section added to NHS post data collection
28
Pavement Data Collection/Reporting Guidance (cont’d)

• Report existing values until they can be replaced by newly measured values
• Use Value Text field (Field 9) to indicate why measured value has not been reported for NHS sections
• An estimated date can be provided when exact collection date is unavailable
29
Pavement Data Collection/Reporting Guidance (cont’d)

Data Item 47 (IRI): Coding
Pertinent Fields to be Coded:• Field 6 = Data Item (“IRI”)• Field 8 = Value Numeric (e.g. ’94’)
• Field 9 = Not required
• Field 10 = Value Date (e.g. “10/2016”)
Example Record:
2017|41|123A|0|0.10|IRI|0.10|94|-----|10/2016|-----
30
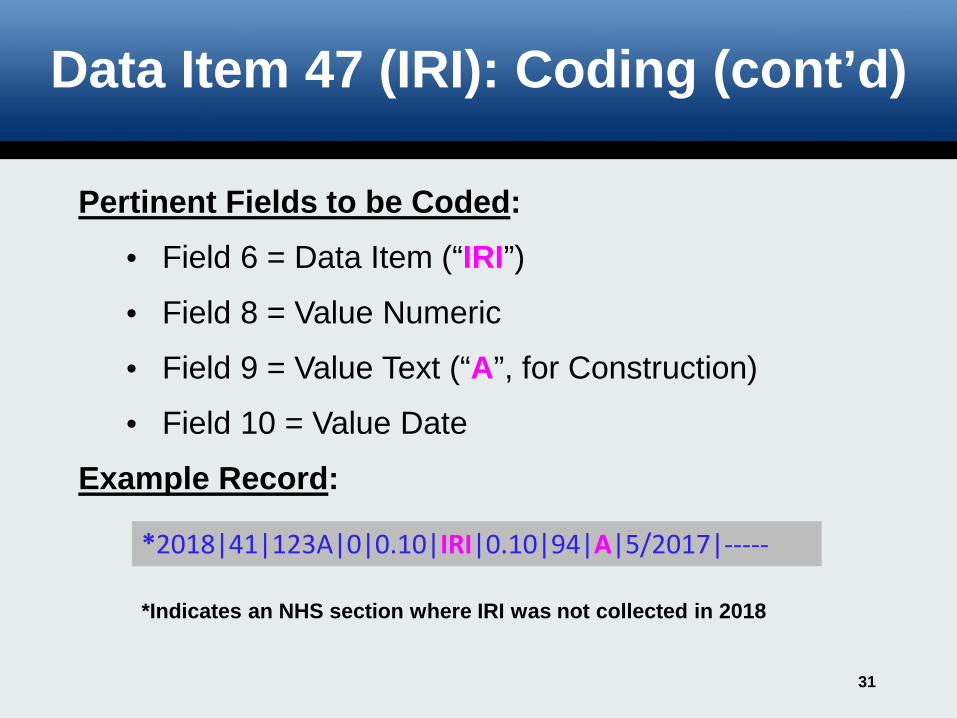
Data Item 47 (IRI): Coding (cont’d)
Pertinent Fields to be Coded:• Field 6 = Data Item (“IRI”)• Field 8 = Value Numeric
• Field 9 = Value Text (“A”, for Construction)
• Field 10 = Value Date
Example Record:
*2018|41|123A|0|0.10|IRI|0.10|94|A|5/2017|-----
*Indicates an NHS section where IRI was not collected in 2018
31

Data Item 48 (PSR): Coding
• For NHS sections where posted speed limit is less than 40 mph, measured PSR can be reported
• Use Value Text Field code of “A” to indicate that Speed Limit is below 40 if PSR is reported for NHS sections
32

Data Item 48 (PSR): Coding (for NHS)
Pertinent Fields to be Coded:• Field 6 = Data Item (“PSR”)
• Field 8 = Value Numeric (e.g. ’3.5’)
• Field 9 = Value Text (“A”, for speed <40 mph)
• Field 10 = Value Date (e.g. “10/2016”)
Example Record:
2017|41|123A|0|0.10|PSR|0.10|3.5|A|10/2016|-----
33

Directional Pavement Metrics Reporting Options
• If pavement data/distresses (i.e. IRI, PSR, Surface Type, Rutting, Faulting, Cracking Percent) is being reported independently for both directions of travel on divided Interstate roadways, then the following data items shall be reported in the same manner:o Urban Codeo Structure Typeo Route Numbero Directional Through Lanes

Interstate 90 (I-90) West• Functional System, Facility Type,
Ownership, NHS• IRI/PSR, Rutting, Faulting, Cracking
Pct.• Urban Code, Structure Type, Route
Number, Directional Through Lanes
Interstate 90 (I-90) East• Functional System, Facility Type,
Ownership, NHS• IRI/PSR, Rutting, Faulting, Cracking
Pct.• Urban Code, Structure Type, Route
Number, Directional Through Lanes35
Directional Reporting Option
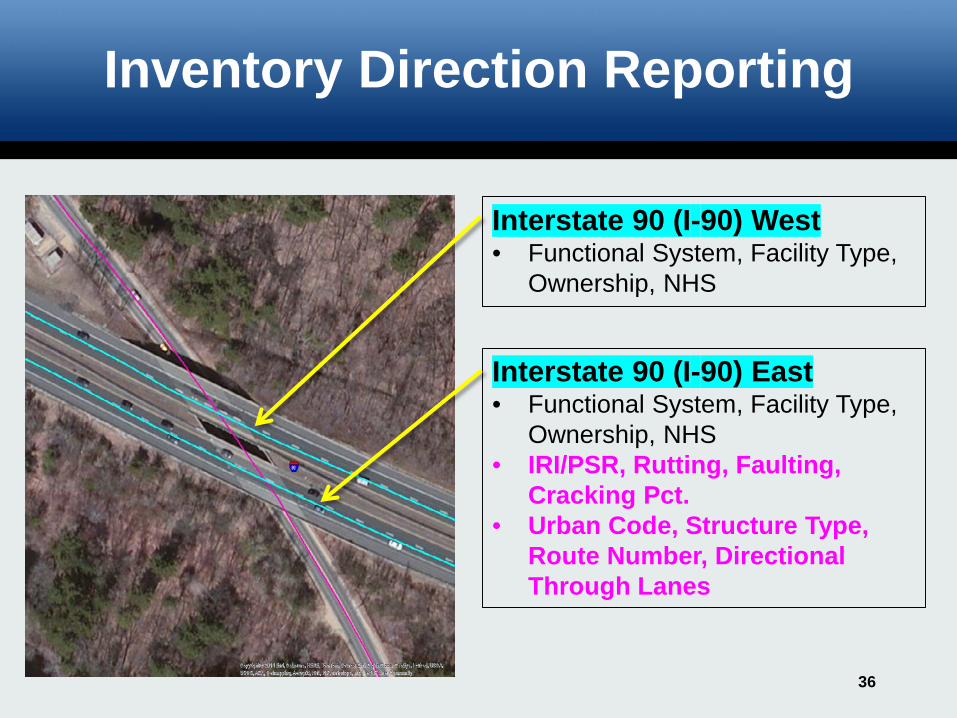
Interstate 90 (I-90) East• Functional System, Facility Type,
Ownership, NHS• IRI/PSR, Rutting, Faulting,
Cracking Pct.• Urban Code, Structure Type,
Route Number, Directional Through Lanes
Inventory Direction Reporting
Interstate 90 (I-90) West• Functional System, Facility Type,
Ownership, NHS
36

Questions???
1-37

Lesson Three
Special Networks Data Items Summary
38

Special Network Summary
Name Full Name Reporting DataNHS National Highway System Annual Roadway section
that is designated as a component of the NHS
STRAHNET Strategic Highway Network Annual Roadway section that is a designated as a component of the STRAHNET
TRUCK/NN National Truck Network Annual Roadway section that is designated as a component of the NN as defined by 23 CFR 658 39

Item 67: Future Facility (Future National Highway System)
• Definition: Roadway section that is a component of the pending National Highway System (NHS), including intermodal connectors
• Extent Requirement: All roadways that are designated future NHS routes
40

Guidance for Special Network Items
• States must continue to submit the data annually until directed otherwise
• FHWA may maintain this data at some point in the futureo States will be responsible for submitting
additions, deletions, etc. to FHWA for review/approval
• Datasets will be available to the States for reference and/or download purposes
41

HPMS Software Module for NHS
• Transactional approach to NHS maintenance – In Development• Involves State, FHWA Division Offices and FHWA Headquarters• Data Maintained by FHWA – Available for State Download • Other Special Networks may be added later 42

Questions???
1-43

1-44
For IRI purposes:• Report the average of right and left quarter-car IRI
Mean Roughness Index (MRI)• Include structures and railroad crossings in
measurement
45
Data Collection/Reporting Guidance (cont’d)

Item 64: NHS (National Highway System)
Pertinent Fields to be Coded:• Field 6 = Data Item (“NHS”)
• Field 8 = Value Numeric (e.g. ’1’)
• Field 9 = Not required
• Field 10 = Value Date (e.g. “10/2008”)
Example Record:
2017|41|123A|0|5.62|NHS|5.62|1|-----|10/2008|-----
46


![@1-&3#,' - MTC UTM€¦ · ]vv}À À v v µ ]o Po} o!"#$%&'(%)**+",-.!"#$"%%&$"#!"#$%&'()'*+,%-+%!"#$%&'()*(+,#-"./#"%(0.1/.,,2/.1 /&01234%,*%5.0"&'#0&2%6'7#'..-#'78](https://static.fdocuments.net/doc/165x107/5face9cfdb72147dee09e0bf/1-3-mtc-utm-vv-v-v-o-po-o-0121.jpg)
![AN8 / AN9 Series · 6X (4.6) [.180] SN (40) 0° Position MAGNETIC FIELD DIRECTION AT 0° POSITION SENSING LOCATION 2X 5.3±0.1 AN9 5.0 MAX AIR GAP 17.7 V+ GND 8.5 ± 0.1 OUTPUT 48.3](https://static.fdocuments.net/doc/165x107/612d28cf1ecc515869420411/an8-an9-series-6x-46-180-sn-40-0-position-magnetic-field-direction-at.jpg)