
Highway Geometric Design Using Excel Bradly McNair, …ilin.asee.org/Conference2008/SESSIONS/Highway...
12
Highway Geometric Design Using Excel Bradly McNair, IUPU-Fort Wayne Faculty Advisor: Suleiman Ashur, Ph.D., P.E., IUPU-Fort Wayne Student Paper Abstract This paper presents the work that was developed as a project in the first offering of the transportation engineering class at the new Civil Engineering program at Indiana University- Purdue University Fort Wayne (IPFW). The project statement required the use of Excel in developing a program for highway geometric design; from simple curves to compound curves; both vertical and horizontal. In addition, the goal of this project was linked to two ABET outcomes (c) and (k) as well as to program outcomes. Outcome (c) addresses the ability of students to design a system, component, or process to meet desired needs within realistic constraints and, outcome (k) focuses on the student’s ability to use the techniques, skills, and modern engineering tools necessary for engineering practice. The paper presents the process of developing the spreadsheet step-by-step, the command used, challenges, and skills and lessons learned by the author and other students in the class. As a result, a simple and efficient spreadsheet to design vertical curves and simple and compound horizontal curves, including default, values was developed. The results of the survey suggested a major improvement of students’ skills in Excel in general and in developing engineering design in particular. Major improvements were found in using functions and nested If statements. The least skills acquired were in using the Absolute and Sum commands and graphing in Excel. Most of the students either knew these commands before the class or they were familiar with them. Finally, this project enabled students to advance their knowledge of spreadsheets while increasing their knowledge of transportation engineering issues as presented. The project helped achieve the outcome objective of the class as stated in the syllabus: 1) design basic horizontal alignment of the highway; 2) design basic vertical alignment of the highway; 3) use Excel as a tool for geometric design of highways. Finally, there was a strong consensus among the students that participated in this project that the skill obtained by manipulating the equations that were part of the spreadsheets provided invaluable training for future professional needs. Key Words Student Paper, Engineering and Technology, Engineering
Transcript of Highway Geometric Design Using Excel Bradly McNair, …ilin.asee.org/Conference2008/SESSIONS/Highway...

Highway Geometric Design Using Excel Bradly McNair, IUPU-Fort Wayne
Faculty Advisor: Suleiman Ashur, Ph.D., P.E., IUPU-Fort Wayne
Student Paper Abstract This paper presents the work that was developed as a project in the first offering of the transportation engineering class at the new Civil Engineering program at Indiana University-Purdue University Fort Wayne (IPFW). The project statement required the use of Excel in developing a program for highway geometric design; from simple curves to compound curves; both vertical and horizontal. In addition, the goal of this project was linked to two ABET outcomes (c) and (k) as well as to program outcomes. Outcome (c) addresses the ability of students to design a system, component, or process to meet desired needs within realistic constraints and, outcome (k) focuses on the student’s ability to use the techniques, skills, and modern engineering tools necessary for engineering practice.
The paper presents the process of developing the spreadsheet step-by-step, the command used, challenges, and skills and lessons learned by the author and other students in the class. As a result, a simple and efficient spreadsheet to design vertical curves and simple and compound horizontal curves, including default, values was developed.
The results of the survey suggested a major improvement of students’ skills in Excel in general and in developing engineering design in particular. Major improvements were found in using functions and nested If statements. The least skills acquired were in using the Absolute and Sum commands and graphing in Excel. Most of the students either knew these commands before the class or they were familiar with them.
Finally, this project enabled students to advance their knowledge of spreadsheets while increasing their knowledge of transportation engineering issues as presented. The project helped achieve the outcome objective of the class as stated in the syllabus: 1) design basic horizontal alignment of the highway; 2) design basic vertical alignment of the highway; 3) use Excel as a tool for geometric design of highways. Finally, there was a strong consensus among the students that participated in this project that the skill obtained by manipulating the equations that were part of the spreadsheets provided invaluable training for future professional needs.
Key Words Student Paper, Engineering and Technology, Engineering

Highway Geometric Design Using Excel
Brad McNair
Civil Engineering Program, Department of Engineering
Indiana University-Purdue University Fort Wayne
1) Introduction
This paper presents a term project that was assigned in the first offering of the Transportation
Engineering class in the new Civil Engineering program at Indiana University-Purdue University
Fort Wayne (IPFW). The Civil Engineering program was approved in Summer 2006 and
students were accepted in Fall 2006.
The goal of this project as listed in the course syllabus is to design basic horizontal and vertical
alignment of the highway using Excel. The goal of this project was linked to two ABET
outcomes (c) and (k). Outcome (c) addresses the ability of students to design a system,
component, or process to meet desired needs within realistic constraints and outcome (k) focuses
on the students ability to use the techniques, skills, and modern engineering tools necessary for
engineering practice1.
A major step in the development of the new Civil Engineering program is receiving ABET‟s
accreditation. Accreditation is critical for the survival of the program both academically and
professionally. Part of the processes is to assess the course outcome at the end of the class. The
department requires all courses are assessed at the conclusion of each term to guarantee filling all
the requirements that ABET as seen necessary to ensure the quality of education.
The goals of this project, included designing a spreadsheet taking account both vertical and
horizontal curves. Both vertical and horizontal curves need to be calculated in order for the
alignment of a highway to match the layout of a new highway design. Spreadsheets are
becoming an important tool in organizing, computing, and analyzing data. Spreadsheets and the
diversity of their application continue to reappearance in scholarly journals as a means for an
intuitive interface2. Spreadsheets are intuitive in cell-based structure and provide a simple
interface that is easy to use and manipulate3. Spreadsheets help to analyze multiple solutions for
engineering problems efficiently and accurately, and produce graphs that convey the solution4.
For this project, Microsoft Excel (Microsoft 2007) was used as the tool for design. The reason of
using Excel software for the project is because it is readily available and affordable for most
companies. In order to achieve the goals of the project, the student is required to have a solid
understanding of both transportation engineering design needs and have command skill expertise
in Excel.
The project statement required the design to have an input and output table that is simple,
flexible, and easy to use. During the design of the project the manipulation of the equations of
the curves was vital in keeping the spreadsheet flexible. This task enhanced the knowledge-base
of the students about spreadsheets. Not only being able to manipulate the equations but also
knowing how to input formulas into Excel made this task challenging. With the flexibility of the
spreadsheet, most any curve design can be calculated with the proper input data.
The objective of this research is to present the use of the spreadsheet in highway geometric
design with focus on vertical curves and simple and compound horizontal curves. In addition, a
casual assessment of computer skills acquired from this project will be presented.
2) Spreadsheet Design
2.1) Vertical Curves
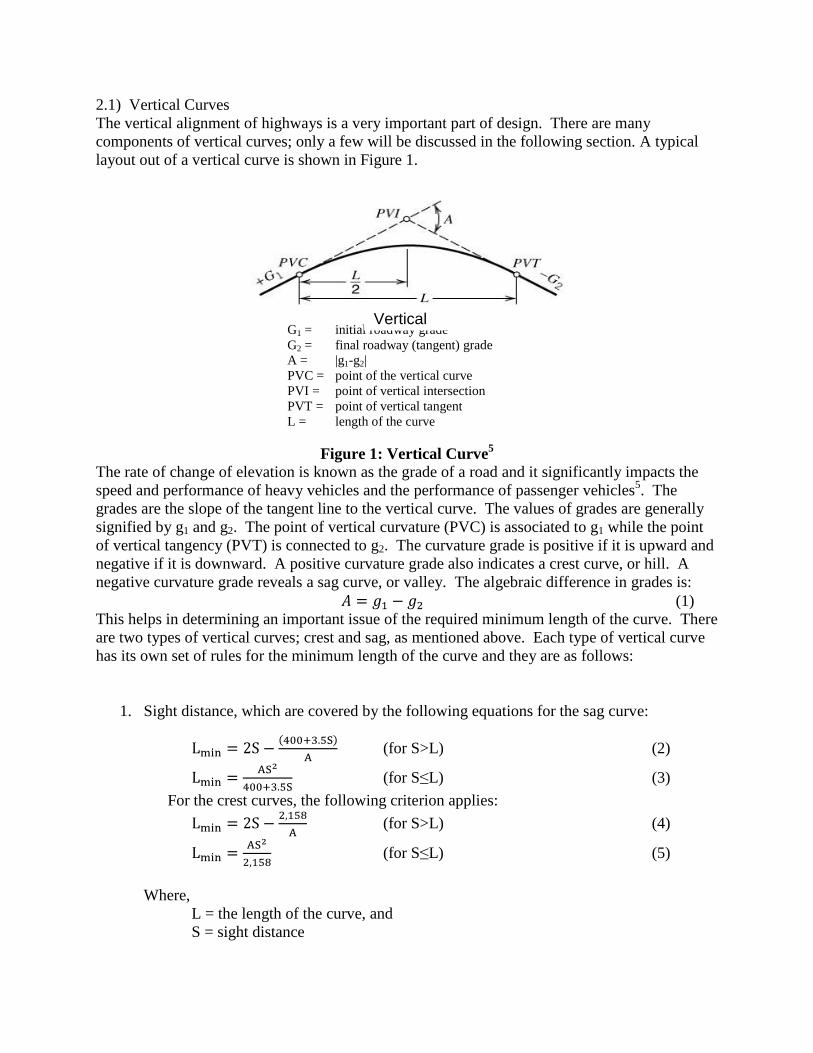
The vertical alignment of highways is a very important part of design. There are many
components of vertical curves; only a few will be discussed in the following section. A typical
layout out of a vertical curve is shown in Figure 1.
G1 = initial roadway grade
G2 = final roadway (tangent) grade
A = |g1-g2|
PVC = point of the vertical curve
PVI = point of vertical intersection
PVT = point of vertical tangent
L = length of the curve
Figure 1: Vertical Curve5
The rate of change of elevation is known as the grade of a road and it significantly impacts the
speed and performance of heavy vehicles and the performance of passenger vehicles5. The
grades are the slope of the tangent line to the vertical curve. The values of grades are generally
signified by g1 and g2. The point of vertical curvature (PVC) is associated to g1 while the point
of vertical tangency (PVT) is connected to g2. The curvature grade is positive if it is upward and
negative if it is downward. A positive curvature grade also indicates a crest curve, or hill. A
negative curvature grade reveals a sag curve, or valley. The algebraic difference in grades is:
(1)
This helps in determining an important issue of the required minimum length of the curve. There
are two types of vertical curves; crest and sag, as mentioned above. Each type of vertical curve
has its own set of rules for the minimum length of the curve and they are as follows:
1. Sight distance, which are covered by the following equations for the sag curve:
(for S>L) (2)
(for S≤L) (3)
For the crest curves, the following criterion applies:
(for S>L) (4)
(for S≤L) (5)
Where,
L = the length of the curve, and
S = sight distance
Vertical Curve

2. Rider comfort,
3. Drainage control, and
4. General appearance.
For crest curves the only criterion that applies is sight distance.
2.2) Horizontal curves
Horizontal curves are usually segments of circles, which have radii that will provide a smooth
flow of traffic along the curve5. There are three basic types of horizontal curves: simple,
compound, and reverse (transition) curves. Figure 2 presents typical simple and compound
horizontal curves.
The main design equations for the shaping a horizontal curve include but are not limited to
equations for the radius, tangents, chords, and relationships of angles and lengths. These
equations are as follows:
Where:
δ = is the angle from start of curve to first full station;
= is the length of the curve from start to first full station; and,
D = is the angle for a full station.
All other variables are defined in Figure 2.
(6)
(7)
(8)
(9)
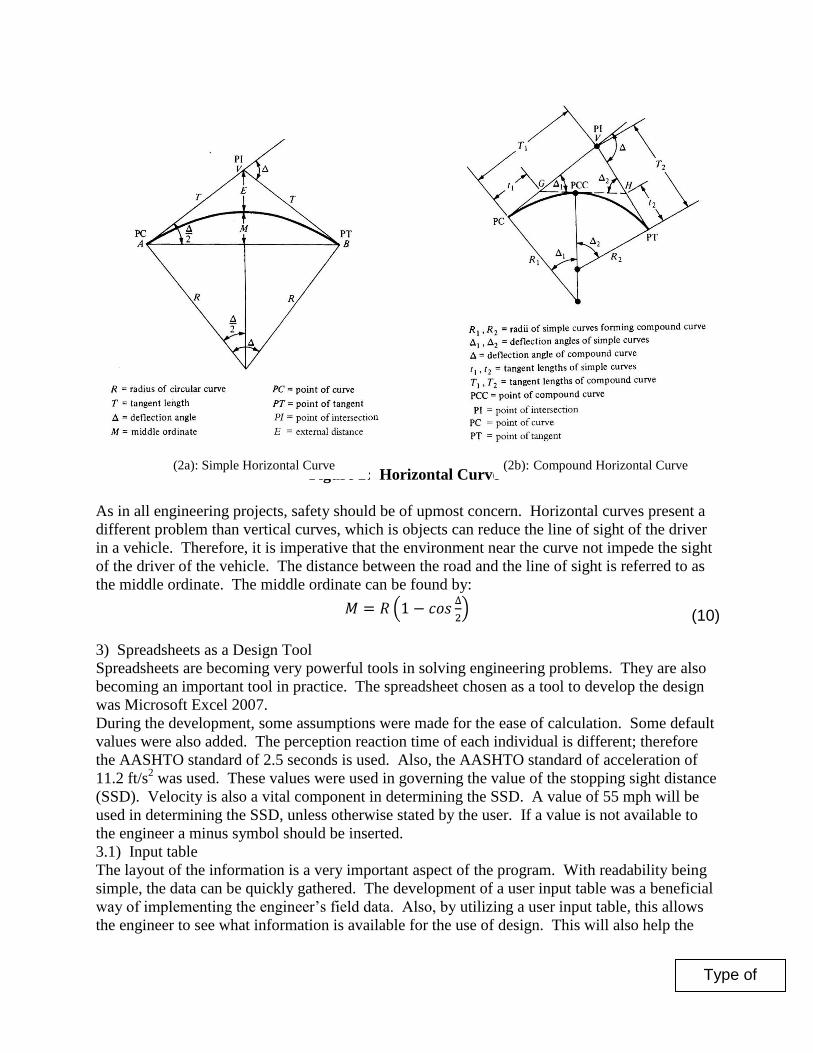
Figure 2: Horizontal Curve5
As in all engineering projects, safety should be of upmost concern. Horizontal curves present a
different problem than vertical curves, which is objects can reduce the line of sight of the driver
in a vehicle. Therefore, it is imperative that the environment near the curve not impede the sight
of the driver of the vehicle. The distance between the road and the line of sight is referred to as
the middle ordinate. The middle ordinate can be found by:
3) Spreadsheets as a Design Tool
Spreadsheets are becoming very powerful tools in solving engineering problems. They are also
becoming an important tool in practice. The spreadsheet chosen as a tool to develop the design
was Microsoft Excel 2007.
During the development, some assumptions were made for the ease of calculation. Some default
values were also added. The perception reaction time of each individual is different; therefore
the AASHTO standard of 2.5 seconds is used. Also, the AASHTO standard of acceleration of
11.2 ft/s2 was used. These values were used in governing the value of the stopping sight distance
(SSD). Velocity is also a vital component in determining the SSD. A value of 55 mph will be
used in determining the SSD, unless otherwise stated by the user. If a value is not available to
the engineer a minus symbol should be inserted.
3.1) Input table
The layout of the information is a very important aspect of the program. With readability being
simple, the data can be quickly gathered. The development of a user input table was a beneficial
way of implementing the engineer‟s field data. Also, by utilizing a user input table, this allows
the engineer to see what information is available for the use of design. This will also help the
(2b): Compound Horizontal Curve (2a): Simple Horizontal Curve
Type of Curve
(10)
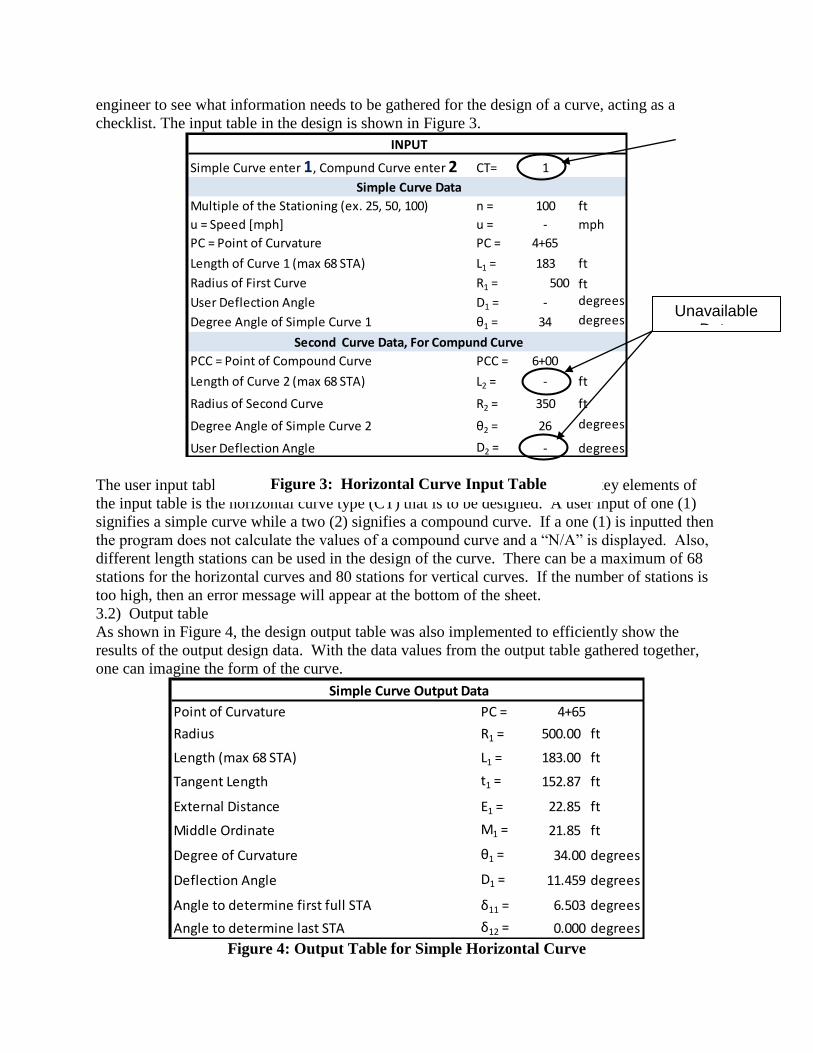
engineer to see what information needs to be gathered for the design of a curve, acting as a
checklist. The input table in the design is shown in Figure 3.
The user input table was crucial in developing a flexible program. One of the key elements of
the input table is the horizontal curve type (CT) that is to be designed. A user input of one (1)
signifies a simple curve while a two (2) signifies a compound curve. If a one (1) is inputted then
the program does not calculate the values of a compound curve and a “N/A” is displayed. Also,
different length stations can be used in the design of the curve. There can be a maximum of 68
stations for the horizontal curves and 80 stations for vertical curves. If the number of stations is
too high, then an error message will appear at the bottom of the sheet.
3.2) Output table
As shown in Figure 4, the design output table was also implemented to efficiently show the
results of the output design data. With the data values from the output table gathered together,
one can imagine the form of the curve.
Figure 4: Output Table for Simple Horizontal Curve
Simple Curve enter 1, Compund Curve enter 2 CT= 1
Multiple of the Stationing (ex. 25, 50, 100) n = 100 ft
u = Speed [mph] u = - mph
PC = Point of Curvature PC = 4+65
Length of Curve 1 (max 68 STA) L1 = 183 ft
Radius of First Curve R1 = 500 ft
User Deflection Angle D1 = - degrees
Degree Angle of Simple Curve 1 θ1 = 34 degrees
PCC = Point of Compound Curve PCC = 6+00
Length of Curve 2 (max 68 STA) L2 = - ft
Radius of Second Curve R2 = 350 ft
Degree Angle of Simple Curve 2 θ2 = 26 degrees
User Deflection Angle D2 = - degrees
INPUT
Simple Curve Data
Second Curve Data, For Compund Curve
Point of Curvature PC = 4+65
Radius R1 = 500.00 ft
Length (max 68 STA) L1 = 183.00 ft
Tangent Length t1 = 152.87 ft
External Distance E1 = 22.85 ft
Middle Ordinate M1 = 21.85 ft
Degree of Curvature θ1 = 34.00 degrees
Deflection Angle D1 = 11.459 degrees
Angle to determine first full STA δ11 = 6.503 degrees
Angle to determine last STA δ12 = 0.000 degrees
Simple Curve Output Data
Figure 3: Horizontal Curve Input Table
Unavailable Data
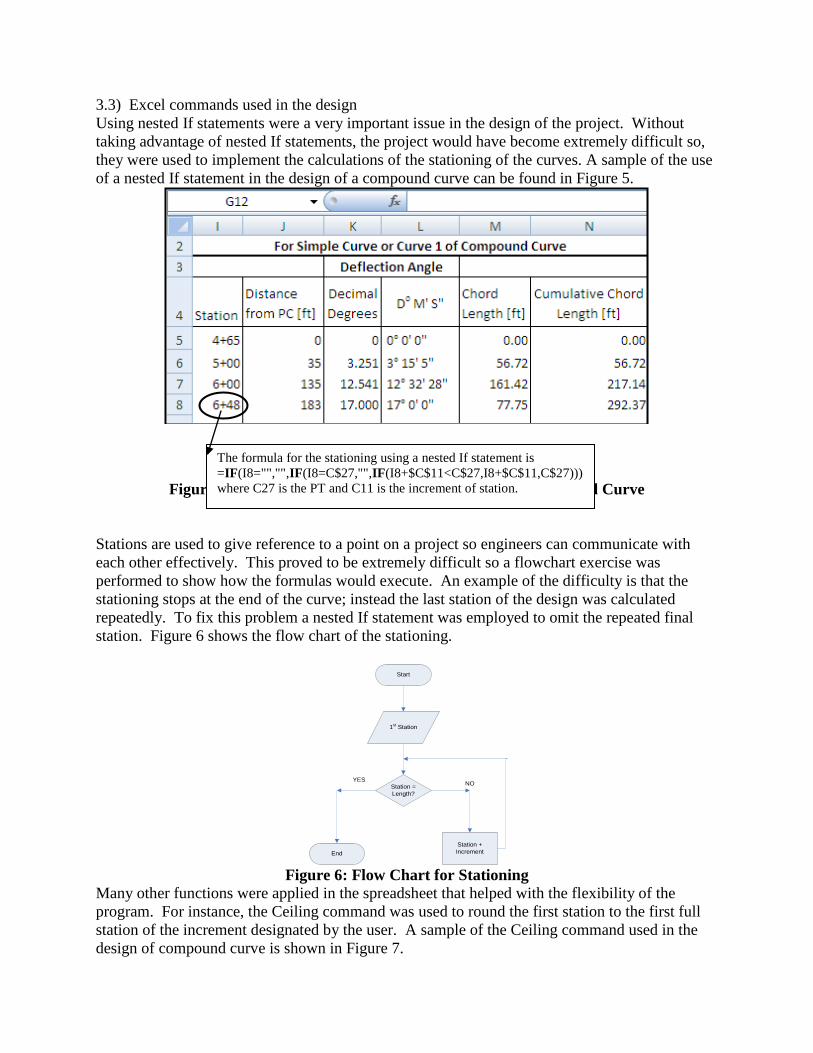
3.3) Excel commands used in the design
Using nested If statements were a very important issue in the design of the project. Without
taking advantage of nested If statements, the project would have become extremely difficult so,
they were used to implement the calculations of the stationing of the curves. A sample of the use
of a nested If statement in the design of a compound curve can be found in Figure 5.
Figure 5: Nested If Statement Used in the Design of Compound Curve
Stations are used to give reference to a point on a project so engineers can communicate with
each other effectively. This proved to be extremely difficult so a flowchart exercise was
performed to show how the formulas would execute. An example of the difficulty is that the
stationing stops at the end of the curve; instead the last station of the design was calculated
repeatedly. To fix this problem a nested If statement was employed to omit the repeated final
station. Figure 6 shows the flow chart of the stationing.
Figure 6: Flow Chart for Stationing
Many other functions were applied in the spreadsheet that helped with the flexibility of the
program. For instance, the Ceiling command was used to round the first station to the first full
station of the increment designated by the user. A sample of the Ceiling command used in the
design of compound curve is shown in Figure 7.
Start
1st Station
Station =
Length?
End
YESNO
Station +
Increment
The formula for the stationing using a nested If statement is
=IF(I8="","",IF(I8=C$27,"",IF(I8+$C$11<C$27,I8+$C$11,C$27)))
where C27 is the PT and C11 is the increment of station.
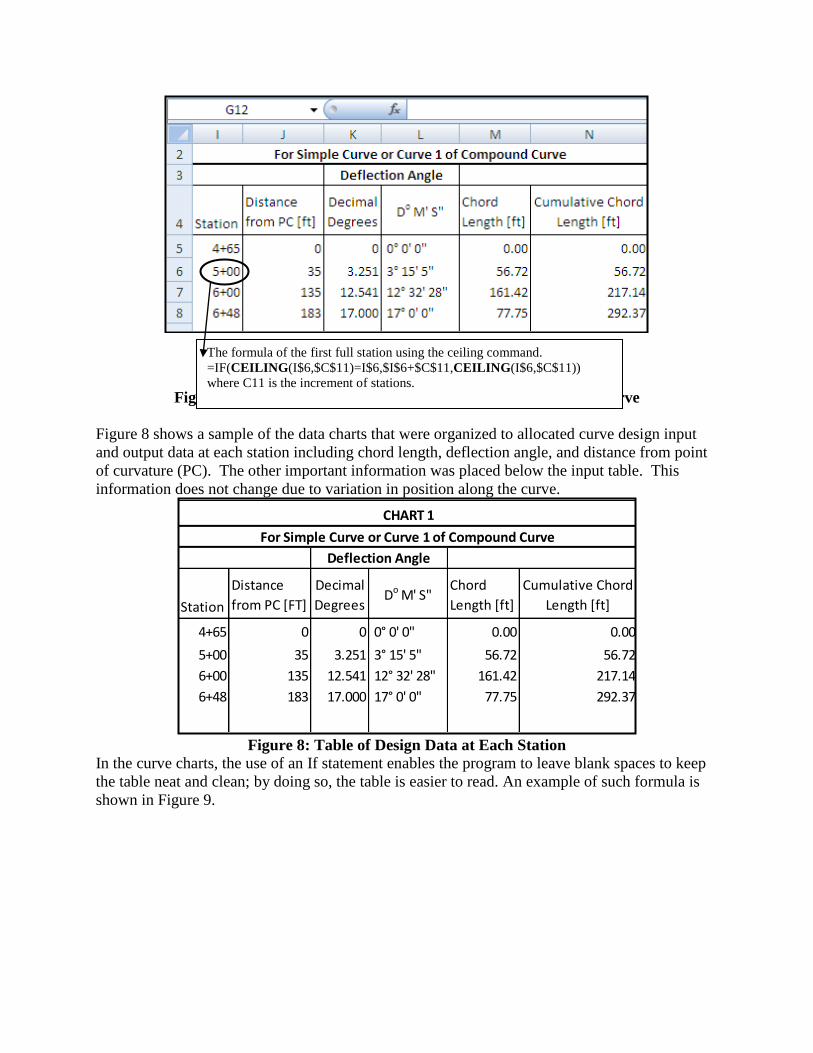
Figure 7: Ceiling Command Used in the Design of Compound Curve
Figure 8 shows a sample of the data charts that were organized to allocated curve design input
and output data at each station including chord length, deflection angle, and distance from point
of curvature (PC). The other important information was placed below the input table. This
information does not change due to variation in position along the curve.
Figure 8: Table of Design Data at Each Station
In the curve charts, the use of an If statement enables the program to leave blank spaces to keep
the table neat and clean; by doing so, the table is easier to read. An example of such formula is
shown in Figure 9.
Station
Distance
from PC [FT]
Decimal
DegreesDo M' S"
Chord
Length [ft]
Cumulative Chord
Length [ft]
4+65 0 0 0° 0' 0" 0.00 0.00
5+00 35 3.251 3° 15' 5" 56.72 56.72
6+00 135 12.541 12° 32' 28" 161.42 217.14
6+48 183 17.000 17° 0' 0" 77.75 292.37
Deflection Angle
CHART 1
For Simple Curve or Curve 1 of Compound Curve
The formula of the first full station using the ceiling command.
=IF(CEILING(I$6,$C$11)=I$6,$I$6+$C$11,CEILING(I$6,$C$11))
where C11 is the increment of stations.

Figure 9: Formula to Create Blank Cells
The length of a vertical curve can be calculated by multiplying the algebraic difference (A) to the
rate of curvature (K).
Since the algebraic difference of the grades can be negative, the absolute value function was
applied in determining the length as shown in Figure 10.
Figure 10: Absolute Value and Algebraic Difference
The difficulty of giving all the measurements of the desired curve is that there is no set
information that will always be available. Sometimes one might be given length, radius, and
degree of curvature while other times one might receive tangent length, PC, and PT. Trying to
make the program flexible enough to be able to accommodate such diversity was a challenge.
Manipulating the formulas for the curve, without creating circular references, was another
project in itself. The equations associated with vertical curves were straightforward because
there was an assumption that the curves did not have a change in grade. Any freeway with
multiple grades needs to be segmented and the sections need to be analyzed individually5.
A formula to leave spaces blank.
=IF(I9=" "," ",I9-I$5)
A use of the absolute value command
=IF(C15=0,ABS(C20*C27),C15)
A negative Algebraic Difference
=C12-C13
where C12 and C13 are the grades
of the curve.
(11)
4) Casual Assessment of Spreadsheet Skills
There were only 4 students in the class including the author. Therefore, a statistically reliable
data could not be achieved. However, in the order to learn the process of conducting a survey, it
was decided to conduct a casual assessment to evaluate the students‟ knowledge of Excel before
and after the project. A simple survey was designed and students were requested by the author to
volunteer to fill out the survey. All three students agreed to fill out the survey and the results of
the survey are based on 4 surveys including the author. There were twelve (12) questions in the
survey about the skills or commands used in the project. Students were asked to evaluate their
skills of these commands on a sale from 0 to 4; with 0 being poor and 4 being excellent. The
author entered the input results in a spreadsheet, found the average, and graphed the results.
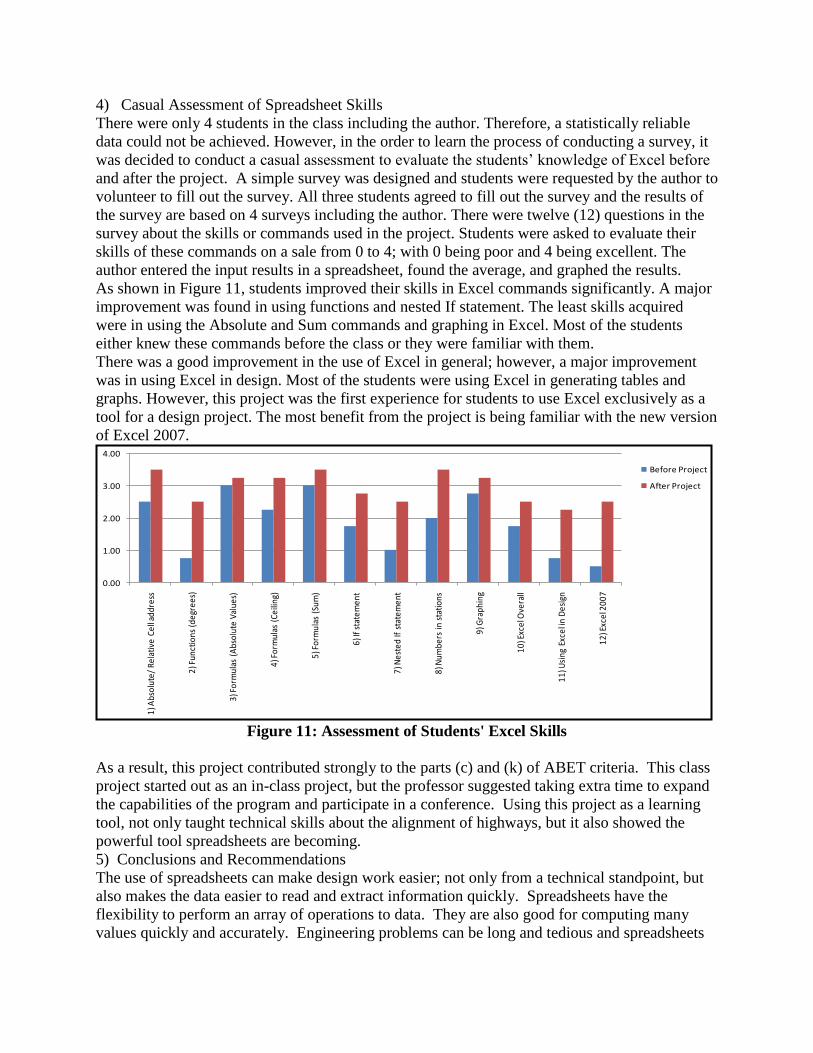
As shown in Figure 11, students improved their skills in Excel commands significantly. A major
improvement was found in using functions and nested If statement. The least skills acquired
were in using the Absolute and Sum commands and graphing in Excel. Most of the students
either knew these commands before the class or they were familiar with them.
There was a good improvement in the use of Excel in general; however, a major improvement
was in using Excel in design. Most of the students were using Excel in generating tables and
graphs. However, this project was the first experience for students to use Excel exclusively as a
tool for a design project. The most benefit from the project is being familiar with the new version
of Excel 2007.
Figure 11: Assessment of Students' Excel Skills
As a result, this project contributed strongly to the parts (c) and (k) of ABET criteria. This class
project started out as an in-class project, but the professor suggested taking extra time to expand
the capabilities of the program and participate in a conference. Using this project as a learning
tool, not only taught technical skills about the alignment of highways, but it also showed the
powerful tool spreadsheets are becoming.
5) Conclusions and Recommendations
The use of spreadsheets can make design work easier; not only from a technical standpoint, but
also makes the data easier to read and extract information quickly. Spreadsheets have the
flexibility to perform an array of operations to data. They are also good for computing many
values quickly and accurately. Engineering problems can be long and tedious and spreadsheets
0.00
1.00
2.00
3.00
4.00
1) A
bsol
ute/
Rel
ativ
e Ce
ll ad
dres
s
2) F
unct
ions
(deg
rees
)
3) F
orm
ulas
(A
bsol
ute
Valu
es)
4) F
orm
ulas
(Ce
iling
)
5) F
orm
ulas
(Su
m)
6) If
sta
tem
ent
7) N
este
d If
sta
tem
ent
8) N
umbe
rs in
sta
tions
9) G
raph
ing
10) E
xcel
Ove
rall
11) U
sing
Exc
el in
De
sign
12) E
xcel
200
7
Assessment of Students' Excel Skills
Before Project
After Project

can make the task easier. Using spreadsheets in design will provide an available package easy to
do engineering work and manipulate the spreadsheet design to accommodate special needs by
each firm. The only difficulty was in adapting to the new design of Excel 2007. It was a
challenge to become familiar with the commands and to navigate your way in the newly
designed software.
The goal of the project was achieved by generating a simple and efficient spreadsheet to design
vertical curves and simple and compound horizontal curves. Several new commands and
functions were learned in the process of developing the project. Most importantly, students are
now familiar with the new version of Excel 2007.
The results of the casual assessment indicate that there was a major improvement of the Excel
skills in general and in developing engineering design in particular. Developing and conducting
the casual assessment for the skills learned in the class was very exciting. Going through the
process made the author recognized not only the importance of the accreditations but also the
major effort needed for assessment. The process is not simple; however, it shows the quality of
education of the new program and it illustrates the new program is on the right path of getting
accreditation.
It is highly recommended that spreadsheets are introduced earlier in design. In addition, students
in general need to use the new version of Excel. Microsoft has developed an interactive “Excel
2003 to Excel 2007 command reference guide” to help new user navigate the new software. The
template is located at: http://office.microsoft.com/en-us/excel/default.aspx then go to “Quick
Start” and click on “Find commands in Excel 2007.”
Finally, this project enabled students to advance their knowledge of spreadsheets while learning
important transportation engineering topics. The project helped achieve the outcome objective
of the class as stated in the syllabus: 1) design basic horizontal alignment of the highway; 2)
design basic vertical alignment of the highway; 3) use Excel as a tool for geometric design of
highways. There was a strong consensus among the students that the skills learned in this project
were invaluable in preparing us for professional life. As a measure of success of this project in
preparing us for professional life, one of my colleagues, who works part time as a drafter at a
local company, presented his program to his superiors. For the use of the program in their
company, they paid him consulting wages for his time and the development of the program.
6) Acknowledgements
I would like to thank Dr. Suleiman Ashur, my advisor and the instructor of the class, for his help
with the program especially in organization of the data, his assistance with the development,
conducting a survey to properly measure the skills learned, and for reviewing and commenting
on this paper. I would also like to thank the Dean of the College of Engineering, Technology,
and Computer Science and the Chair of the Department of Engineering at Indiana University-
Purdue University Fort Wayne for sponsoring me in my proceedings. Finally, I would like to
thank the students in my class that took the survey and helped present different ideas on how to
approach the challenges throughout the project.
7) Bibliography

1. Criteria For Accrediting Engineering Programs, Effective for Evaluations During the 2008-2009 Accreditation
Cycle, ABET Board of Directors, November 3, 2007. ABET, Inc, Baltimore, MD.
2. Baker, J. and Sugden, S. (2003). “Spreadsheets in Education-The First 25 Years.” SIE Journal, 1(1), 18-43.
3. Hegazy, T., and Ersahin, T. (2001). „„Simplified spreadsheet solutions. I: Subcontractor information system.‟‟
Journal of Construction Engineering and Management, ASCE, 127(6), 461–468.
4. Ickert, R. and Alan Hutson, A. 2005,…”Hydraulic Modeling of Transmission Systems Using Spreadsheets.”
(180)83.
5. Garber, N. J., and Hoel, L. A. (2002). Traffic & Highway Engineering, Brooks/Cole, California.
6. Easa, S. M. (1999). “Optimum vertical curves for highway profiles.” J. Surv. Eng., 125(3), 147-157.


![Civil Vii Highway Geometric Design [10cv755] Notes](https://static.fdocuments.net/doc/165x107/577c7fd81a28abe054a64ecc/civil-vii-highway-geometric-design-10cv755-notes-5782e9077aa01.jpg)
