High‐throughput physiological phenotyping and … ADVANCE High-throughput physiological...
20
TECHNICAL ADVANCE High-throughput physiological phenotyping and screening system for the characterization of plant–environment interactions Ofer Halperin 1 , Alem Gebremedhin 2 , Rony Wallach 1 and Menachem Moshelion 2, * 1 Department of Soil and Water Sciences, The Robert H. Smith Faculty of Agriculture, Food and Environment, The Hebrew University of Jerusalem, Rehovot 76100, Israel, and 2 The Robert H. Smith Institute of Plant Sciences and Genetics in Agriculture, The Robert H. Smith Faculty of Agriculture, Food and Environment, The Hebrew University of Jerusalem, Rehovot 76100, Israel Received 14 November 2014; revised 3 November 2016; accepted 7 November 2016. *For correspondence (e-mail [email protected]). SUMMARY We present a simple and effective high-throughput experimental platform for simultaneous and continuous monitoring of water relations in the soil–plant–atmosphere continuum of numerous plants under dynamic envi- ronmental conditions. This system provides a simultaneously measured, detailed physiological response profile for each plant in the array, over time periods ranging from a few minutes to the entire growing season, under normal, stress and recovery conditions and at any phenological stage. Three probes for each pot in the array and a specially designed algorithm enable detailed water-relations characterization of whole-plant transpiration, biomass gain, stomatal conductance and root flux. They also enable quantitative calculation of the whole plant water-use efficiency and relative water content at high resolution under dynamic soil and atmospheric condi- tions. The system has no moving parts and can fit into many growing environments. A screening of 65 intro- gression lines of a wild tomato species (Solanum pennellii) crossed with cultivated tomato (S. lycopersicum), using our system and conventional gas-exchange tools, confirmed the accuracy of the system as well as its diag- nostic capabilities. The use of this high-throughput diagnostic screening method is discussed in light of the gaps in our understanding of the genetic regulation of whole-plant performance, particularly under abiotic stress. Keywords: phenotyping plant stress response, whole-plant water relation, transpiration, root flux, soil–plant–atmosphere continuum, genotype-by-environment interaction, functional phenotyping, technical advance. INTRODUCTION Modern sequencing technologies have dramatically reduced the time and expense of whole-genome sequenc- ing. Consequently, many crop genomes have become available, providing valuable information on crop-related characteristics (traits) such as fruit ripening, grain traits and flowering-time adaptation (Bolger et al., 2014). How- ever, and despite enormous effort, the identification of higher levels of tolerance to different types of abiotic stress lags behind (Graff et al., 2013), as abiotic-stress-tolerance traits are difficult to find. This is due to the complex nature of the phenotype, the number of genes involved and the presence of strong genotype-by-environment interactions (Richards et al., 2010). Therefore, fast and accurate phenotyping remains a bottleneck in the effort to enhance yields in water-limited and other stressful environments (Richards et al., 2010; Moshelion and Altman, 2015). There are two occasionally overlapping uses of pheno- typic information: to enhance our understanding of the functional significance of particular genes or gene clusters (termed diagnostic tool in this paper), and to develop selectable markers for breeding programmes, such as robust molecular markers and easily measured morpho- logical, developmental or physiological characteristics (Passioura, 2012). The development of phenotype-selection tools for use in dedicated high-throughput, controlled- environment facilities could potentially improve precision © 2016 The Authors The Plant Journal © 2016 John Wiley & Sons Ltd 1 The Plant Journal (2016) doi: 10.1111/tpj.13425
Transcript of High‐throughput physiological phenotyping and … ADVANCE High-throughput physiological...
TECHNICAL ADVANCE
High-throughput physiological phenotyping and screeningsystem for the characterization of plant–environmentinteractions
Ofer Halperin1, Alem Gebremedhin2, Rony Wallach1 and Menachem Moshelion2,*1Department of Soil and Water Sciences, The Robert H. Smith Faculty of Agriculture, Food and Environment, The Hebrew
University of Jerusalem, Rehovot 76100, Israel, and2The Robert H. Smith Institute of Plant Sciences and Genetics in Agriculture, The Robert H. Smith Faculty of Agriculture,
Food and Environment, The Hebrew University of Jerusalem, Rehovot 76100, Israel
Received 14 November 2014; revised 3 November 2016; accepted 7 November 2016.
*For correspondence (e-mail [email protected]).
SUMMARY
We present a simple and effective high-throughput experimental platform for simultaneous and continuous
monitoring of water relations in the soil–plant–atmosphere continuum of numerous plants under dynamic envi-
ronmental conditions. This system provides a simultaneously measured, detailed physiological response profile
for each plant in the array, over time periods ranging from a few minutes to the entire growing season, under
normal, stress and recovery conditions and at any phenological stage. Three probes for each pot in the array
and a specially designed algorithm enable detailed water-relations characterization of whole-plant transpiration,
biomass gain, stomatal conductance and root flux. They also enable quantitative calculation of the whole plant
water-use efficiency and relative water content at high resolution under dynamic soil and atmospheric condi-
tions. The system has no moving parts and can fit into many growing environments. A screening of 65 intro-
gression lines of a wild tomato species (Solanum pennellii) crossed with cultivated tomato (S. lycopersicum),
using our system and conventional gas-exchange tools, confirmed the accuracy of the system aswell as its diag-
nostic capabilities. The use of this high-throughput diagnostic screening method is discussed in light of the gaps
in our understanding of the genetic regulation of whole-plant performance, particularly under abiotic stress.
Keywords: phenotyping plant stress response, whole-plant water relation, transpiration, root flux,
soil–plant–atmosphere continuum, genotype-by-environment interaction, functional phenotyping, technical
advance.
INTRODUCTION
Modern sequencing technologies have dramatically
reduced the time and expense of whole-genome sequenc-
ing. Consequently, many crop genomes have become
available, providing valuable information on crop-related
characteristics (traits) such as fruit ripening, grain traits
and flowering-time adaptation (Bolger et al., 2014). How-
ever, and despite enormous effort, the identification of
higher levels of tolerance to different types of abiotic stress
lags behind (Graff et al., 2013), as abiotic-stress-tolerance
traits are difficult to find. This is due to the complex nature
of the phenotype, the number of genes involved and the
presence of strong genotype-by-environment interactions
(Richards et al., 2010). Therefore, fast and accurate
phenotyping remains a bottleneck in the effort to enhance
yields in water-limited and other stressful environments
(Richards et al., 2010; Moshelion and Altman, 2015).
There are two occasionally overlapping uses of pheno-
typic information: to enhance our understanding of the
functional significance of particular genes or gene clusters
(termed diagnostic tool in this paper), and to develop
selectable markers for breeding programmes, such as
robust molecular markers and easily measured morpho-
logical, developmental or physiological characteristics
(Passioura, 2012). The development of phenotype-selection
tools for use in dedicated high-throughput, controlled-
environment facilities could potentially improve precision
© 2016 The AuthorsThe Plant Journal © 2016 John Wiley & Sons Ltd
1
The Plant Journal (2016) doi: 10.1111/tpj.13425
while reducing the need for replication in the field. Such
tools have heralded the age of ‘phenomics’ (Furbank and
Tester, 2011).
Novel high-throughput selection systems have been
developed to enable the rapid screening of large plant pop-
ulations in controlled, pre-field environments. The aim of
these systems is to identify individual plants showing
improved behavior under particular conditions at an early
stage of their life cycle, prior to the mandatory, large-scale
field trials. To date, most of these methods have been
based on noninvasive imaging, spectroscopy, image analy-
sis, robotics and high-performance computing (Furbank
and Tester, 2011). During such screens, different images of
each plant are recorded and analyzed using sophisticated
image-analysis algorithms (Golzarian et al., 2011; Hart-
mann et al., 2011). Furbank and Tester (2011) described
phenomics as ‘high-throughput plant physiology’. In real-
ity, the major physiological parameters reported by these
systems are associated with plant size. This intrinsic prop-
erty provides a good indication of the plant’s growth rate
and development under optimal growing conditions. How-
ever, under water limiting conditions, the first symptoms
of stress to appear in angiosperms are turgor loss and inhi-
bition of cell growth, while the stomata remain open and
the rate of photosynthesis continues to be relatively high.
If the stress is prolonged, gradual stomatal closure and a
reduction in photosynthetic rate will follow (reviewed by
Hsiao and Acevedo, 1974; Taiz and Zeiger, 2010). Thus, at
the onset of stress conditions, many plants show improved
harvest indices (i.e., stomatal conductance and photosyn-
thetic rate) and low levels of growth inhibition. Indeed,
stomatal conductance has been shown to be a reliable
indicator of the plant’s response to stress (Munns et al.,
2010).
Future progress in crop breeding requires a new empha-
sis on plant physiological phenotyping for specific, well
defined traits (Ghanem et al., 2015). However, plants’
dynamic responses to the environment (hourly to season-
ally) are extremely hard to capture using manual physio-
logical apparatuses. Weighing lysimeters (gravimetric
systems) have been reported to be highly accurate in fol-
lowing changes in plant weight (Vera-Repullo et al., 2015)
and have been widely used for many years as a tool for
irrigation applications due to their accurate detection of
plant water-loss rates, soil water content (SWC), plant
water use, and simulation of drought stress (Earl, 2003;
Pereyra-Irujo et al., 2012). The current study presents a dif-
ferent approach, which makes use of the gravimetric sys-
tem combined with soil and atmospheric probes for a
high-resolution, high-throughput diagnostic-screening plat-
form, to: (i) select plants with desired physiological traits,
and (ii) study whole-plant water relations and biomass
gain. The selection is based on a plant’s unique stress-
response profile compared to all others in the array.
Despite the enormous effort invested in the develop-
ment of plants that are resistant to abiotic stress, only
minor progress has been made. This is in large part due to
the complexity of the different traits involved, the fluctuat-
ing nature of environmental conditions, and bottlenecks in
the selection process. The suggested relatively simple
screening system could remove some of these bottlenecks.
RESULTS
Comparison of whole-plant water relations in multiple
plants
Using the comparative multiple whole-plant diagnostic
system (Figure 1 and Experimental procedures), we first
defined a set of criteria and parameters for use in identify-
ing physiological differences between different whole-plant
water-regulation behaviors under different ambient condi-
tions. Major differences were identified between the physi-
ological characteristics of wild tomato (Solanum pennellii;
hereafter, Penelli) versus cultivated tomato (Solanum
lycopersicum cv. M82; hereafter M82) species.
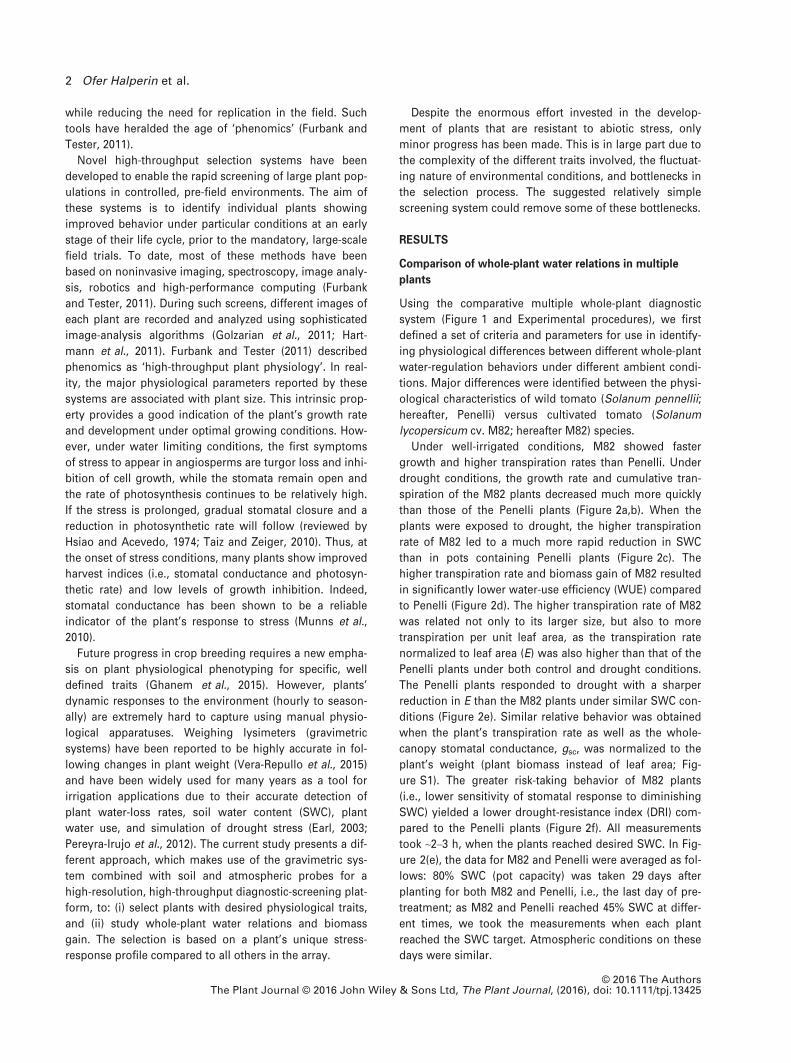
Under well-irrigated conditions, M82 showed faster
growth and higher transpiration rates than Penelli. Under
drought conditions, the growth rate and cumulative tran-
spiration of the M82 plants decreased much more quickly
than those of the Penelli plants (Figure 2a,b). When the
plants were exposed to drought, the higher transpiration
rate of M82 led to a much more rapid reduction in SWC
than in pots containing Penelli plants (Figure 2c). The
higher transpiration rate and biomass gain of M82 resulted
in significantly lower water-use efficiency (WUE) compared
to Penelli (Figure 2d). The higher transpiration rate of M82
was related not only to its larger size, but also to more
transpiration per unit leaf area, as the transpiration rate
normalized to leaf area (E) was also higher than that of the
Penelli plants under both control and drought conditions.
The Penelli plants responded to drought with a sharper
reduction in E than the M82 plants under similar SWC con-
ditions (Figure 2e). Similar relative behavior was obtained
when the plant’s transpiration rate as well as the whole-
canopy stomatal conductance, gsc, was normalized to the
plant’s weight (plant biomass instead of leaf area; Fig-
ure S1). The greater risk-taking behavior of M82 plants
(i.e., lower sensitivity of stomatal response to diminishing
SWC) yielded a lower drought-resistance index (DRI) com-
pared to the Penelli plants (Figure 2f). All measurements
took ~2–3 h, when the plants reached desired SWC. In Fig-
ure 2(e), the data for M82 and Penelli were averaged as fol-
lows: 80% SWC (pot capacity) was taken 29 days after
planting for both M82 and Penelli, i.e., the last day of pre-
treatment; as M82 and Penelli reached 45% SWC at differ-
ent times, we took the measurements when each plant
reached the SWC target. Atmospheric conditions on these
days were similar.
© 2016 The AuthorsThe Plant Journal © 2016 John Wiley & Sons Ltd, The Plant Journal, (2016), doi: 10.1111/tpj.13425
2 Ofer Halperin et al.
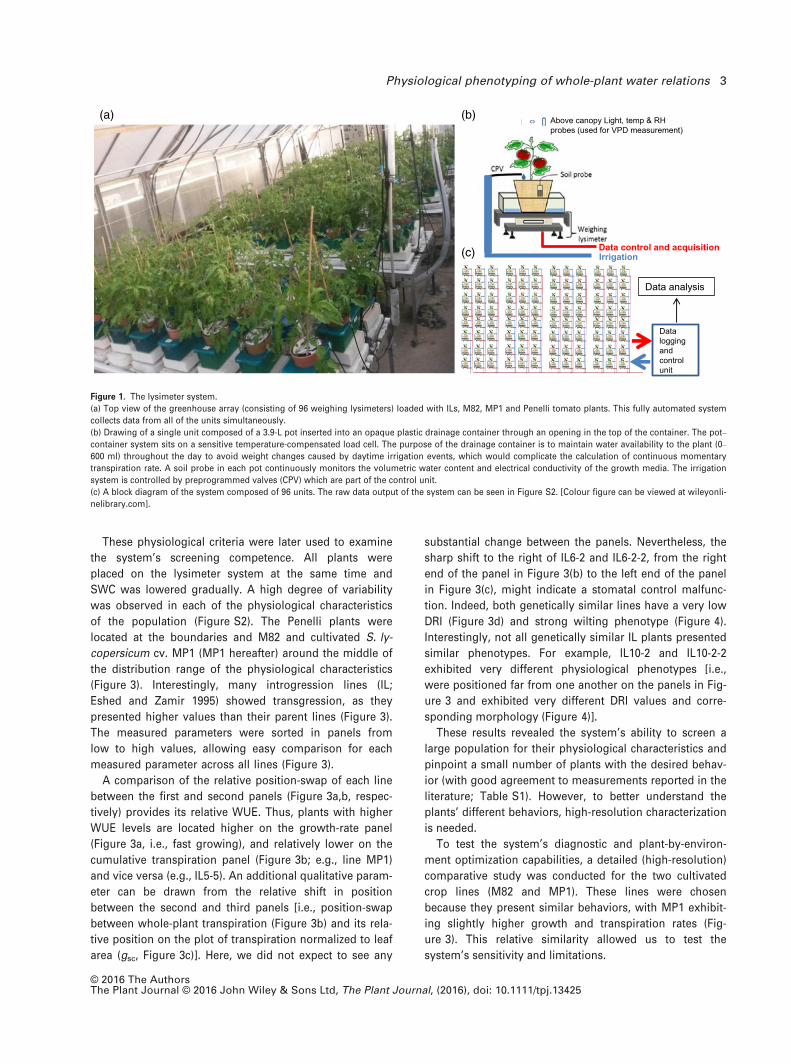
These physiological criteria were later used to examine
the system’s screening competence. All plants were
placed on the lysimeter system at the same time and
SWC was lowered gradually. A high degree of variability
was observed in each of the physiological characteristics
of the population (Figure S2). The Penelli plants were
located at the boundaries and M82 and cultivated S. ly-
copersicum cv. MP1 (MP1 hereafter) around the middle of
the distribution range of the physiological characteristics
(Figure 3). Interestingly, many introgression lines (IL;
Eshed and Zamir 1995) showed transgression, as they
presented higher values than their parent lines (Figure 3).
The measured parameters were sorted in panels from
low to high values, allowing easy comparison for each
measured parameter across all lines (Figure 3).
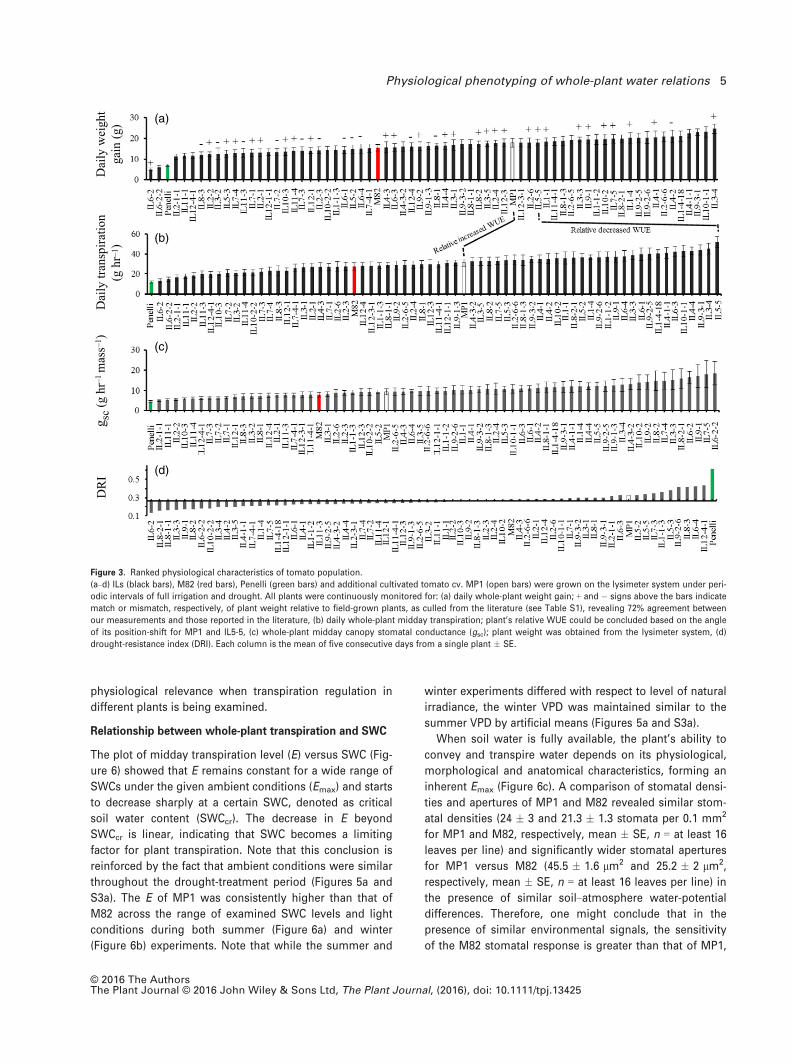
A comparison of the relative position-swap of each line
between the first and second panels (Figure 3a,b, respec-
tively) provides its relative WUE. Thus, plants with higher
WUE levels are located higher on the growth-rate panel
(Figure 3a, i.e., fast growing), and relatively lower on the
cumulative transpiration panel (Figure 3b; e.g., line MP1)
and vice versa (e.g., IL5-5). An additional qualitative param-
eter can be drawn from the relative shift in position
between the second and third panels [i.e., position-swap
between whole-plant transpiration (Figure 3b) and its rela-
tive position on the plot of transpiration normalized to leaf
area (gsc, Figure 3c)]. Here, we did not expect to see any
substantial change between the panels. Nevertheless, the
sharp shift to the right of IL6-2 and IL6-2-2, from the right
end of the panel in Figure 3(b) to the left end of the panel
in Figure 3(c), might indicate a stomatal control malfunc-
tion. Indeed, both genetically similar lines have a very low
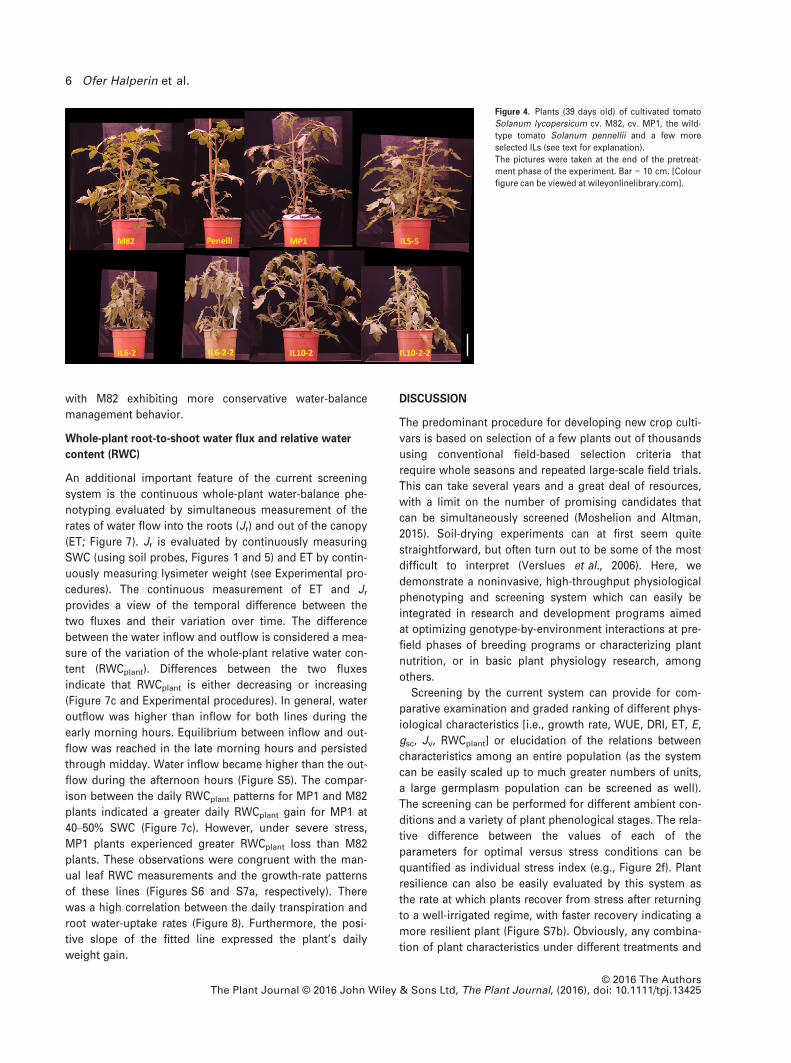
DRI (Figure 3d) and strong wilting phenotype (Figure 4).
Interestingly, not all genetically similar IL plants presented
similar phenotypes. For example, IL10-2 and IL10-2-2
exhibited very different physiological phenotypes [i.e.,
were positioned far from one another on the panels in Fig-
ure 3 and exhibited very different DRI values and corre-
sponding morphology (Figure 4)].
These results revealed the system’s ability to screen a
large population for their physiological characteristics and
pinpoint a small number of plants with the desired behav-
ior (with good agreement to measurements reported in the
literature; Table S1). However, to better understand the
plants’ different behaviors, high-resolution characterization
is needed.
To test the system’s diagnostic and plant-by-environ-
ment optimization capabilities, a detailed (high-resolution)
comparative study was conducted for the two cultivated
crop lines (M82 and MP1). These lines were chosen
because they present similar behaviors, with MP1 exhibit-
ing slightly higher growth and transpiration rates (Fig-
ure 3). This relative similarity allowed us to test the
system’s sensitivity and limitations.
Data logging and control unit
IrrigationData control and acquisition
Data analysis
Above canopy Light, temp & RH probes (used for VPD measurement)
(a) (b)
(c)
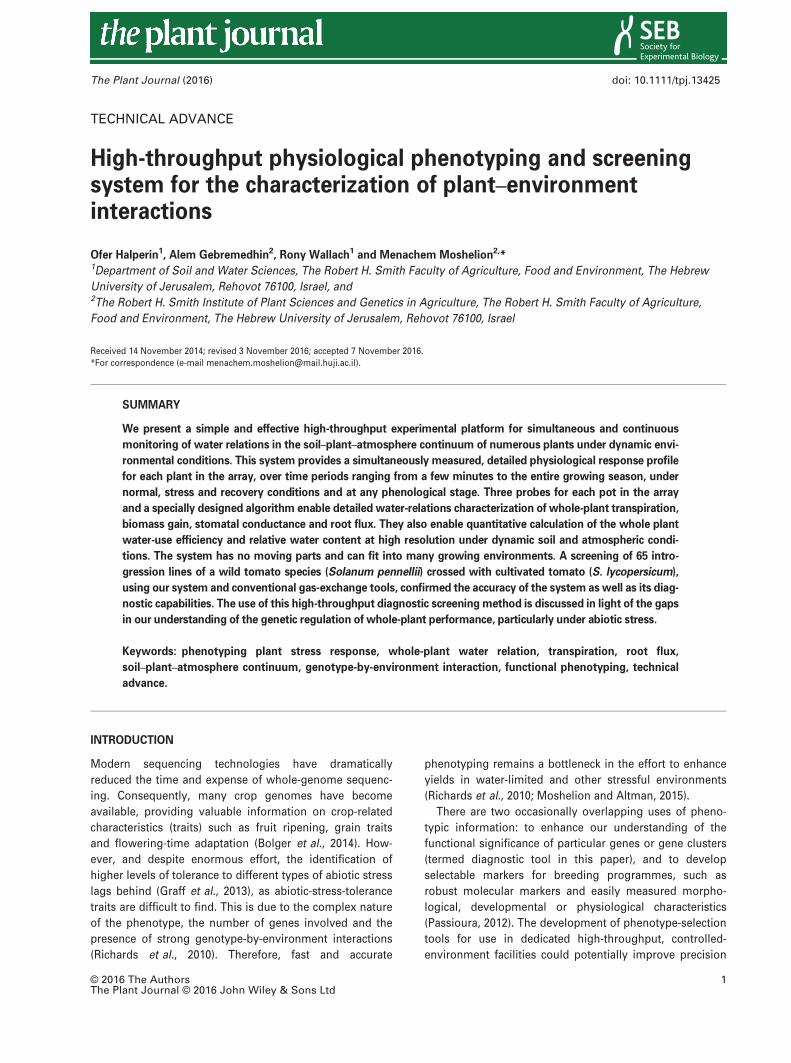
Figure 1. The lysimeter system.
(a) Top view of the greenhouse array (consisting of 96 weighing lysimeters) loaded with ILs, M82, MP1 and Penelli tomato plants. This fully automated system
collects data from all of the units simultaneously.
(b) Drawing of a single unit composed of a 3.9-L pot inserted into an opaque plastic drainage container through an opening in the top of the container. The pot–container system sits on a sensitive temperature-compensated load cell. The purpose of the drainage container is to maintain water availability to the plant (0–600 ml) throughout the day to avoid weight changes caused by daytime irrigation events, which would complicate the calculation of continuous momentary
transpiration rate. A soil probe in each pot continuously monitors the volumetric water content and electrical conductivity of the growth media. The irrigation
system is controlled by preprogrammed valves (CPV) which are part of the control unit.
(c) A block diagram of the system composed of 96 units. The raw data output of the system can be seen in Figure S2. [Colour figure can be viewed at wileyonli-
nelibrary.com].
© 2016 The AuthorsThe Plant Journal © 2016 John Wiley & Sons Ltd, The Plant Journal, (2016), doi: 10.1111/tpj.13425
Physiological phenotyping of whole-plant water relations 3
Comparison of mean whole-plant daily transpiration and
stomatal conductance rates
The tests were conducted on several biological repeats of
M82 and MP1 in an attempt to get statistically significant
results. Here, as before, all plants were placed in the array
and tested simultaneously.
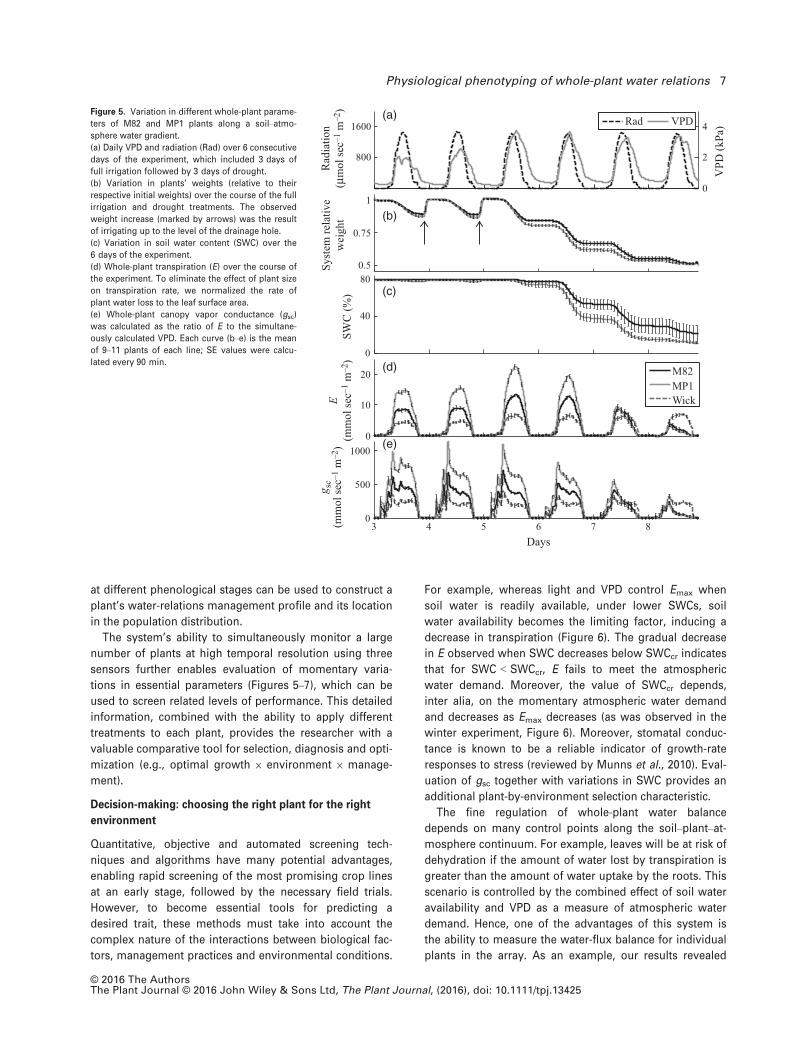
The measured whole-plant transpiration rate (E) and
canopy vapor conductance (gsc) for a broad range of
SWC values (Figure 5) yielded consistently higher values
for MP1 versus M82. Repeating the experiment during the
winter [similar vapor-pressure deficit (VPD) in the green-
house, but ~30% less radiation due to natural light condi-
tions, see Figure S3 and Experimental procedures],
yielded lower maximum E and gsc values with a similar
behavior pattern among the plants and the plants’
responses to the different environmental conditions. Note
that the daily peak in canopy stomatal conductance), gsc
(Figure 5e), was reached ahead of the daily peak in VPD
(Figure 5a). Both peaks were shifted toward the late
morning hours during the winter experiment (Figure S3).
The daily gsc patterns represent the stomata’s response to
the ambient conditions (i.e., stomatal gs is higher under
low VPD conditions and decreases as VPD increases,
assumed to prevent leaf desiccation. This daily stomatal
behavior pattern is known from the literature (e.g., Bro-
dribb and Holbrook, 2004), but its manual measurement
is tedious work that requires major effort and is limited in
the number of plants that can be measured simultane-
ously. In addition, the accuracy of our measurements
were confirmed by gas-exchange apparatuses used to
simultaneously measure a few more control M82 plants
grown in parallel to the plants on the lysimeters, which
yielded similar absolute values (see Experimental proce-
dures and Figure S4).
Comparison of the temporal change in SWC, E or gsc for
many plants might be misleading because SWC depletion
by plants that transpire more is higher than for those that
transpire less, and the former will experience dry soil con-
ditions at an earlier stage. Thus, presenting E versus SWC
(Figure 6) seems more appropriate and has more
Figure 2. Comparison of the whole-plant drought responses of cultivated Solanum lycopersicum (M82) and green-fruited wild-type S. pennellii (Penelli) plants.
M82 (red) and Penelli (green) plants were grown on the lysimeter system in a greenhouse (see Experimental procedures) with a period of full irrigation
(10 days), followed by a drought treatment. Plants were irrigated again (recovered) when the soil reached 15% of soil water content (SWC).
(a) Mean daily cumulative weight gain � SE of control (well irrigated throughout the whole period; solid lines) and drought-treated (dotted lines) plants.
(b, c) (b) Mean daily cumulative transpiration � SE, and (c) mean SWC � SE were measured continually for 45 days (SE bars are shown once every 5 days for
clarity).
(d) The relationship between mean daily cumulative weight gain and transpiration throughout the first 10 days of the well-irrigated treatment. The slope of the
lines indicates water-use efficiency (WUE). Slopes values are significantly different (Student’s t-test, P < 0.05).
(e) Mean � SE whole-plant midday transpiration rate at 80 and 45% SWC. A 76% decrease in E was observed among the Penelli plants, and a 43% decrease
among the M82 plants.
(f) Drought-resistance index (DRI, see Experimental procedures). Different letters above columns represent significant differences (two-way ANOVA: Tukey–Kra-mer, P < 0.05, n = minimum of six plants from each line per treatment).
© 2016 The AuthorsThe Plant Journal © 2016 John Wiley & Sons Ltd, The Plant Journal, (2016), doi: 10.1111/tpj.13425
4 Ofer Halperin et al.
physiological relevance when transpiration regulation in
different plants is being examined.
Relationship between whole-plant transpiration and SWC
The plot of midday transpiration level (E) versus SWC (Fig-
ure 6) showed that E remains constant for a wide range of
SWCs under the given ambient conditions (Emax) and starts
to decrease sharply at a certain SWC, denoted as critical
soil water content (SWCcr). The decrease in E beyond
SWCcr is linear, indicating that SWC becomes a limiting
factor for plant transpiration. Note that this conclusion is
reinforced by the fact that ambient conditions were similar
throughout the drought-treatment period (Figures 5a and
S3a). The E of MP1 was consistently higher than that of
M82 across the range of examined SWC levels and light
conditions during both summer (Figure 6a) and winter
(Figure 6b) experiments. Note that while the summer and
winter experiments differed with respect to level of natural
irradiance, the winter VPD was maintained similar to the
summer VPD by artificial means (Figures 5a and S3a).
When soil water is fully available, the plant’s ability to
convey and transpire water depends on its physiological,
morphological and anatomical characteristics, forming an
inherent Emax (Figure 6c). A comparison of stomatal densi-
ties and apertures of MP1 and M82 revealed similar stom-
atal densities (24 � 3 and 21.3 � 1.3 stomata per 0.1 mm2
for MP1 and M82, respectively, mean � SE, n = at least 16
leaves per line) and significantly wider stomatal apertures
for MP1 versus M82 (45.5 � 1.6 lm2 and 25.2 � 2 lm2,
respectively, mean � SE, n = at least 16 leaves per line) in
the presence of similar soil–atmosphere water-potential
differences. Therefore, one might conclude that in the
presence of similar environmental signals, the sensitivity
of the M82 stomatal response is greater than that of MP1,
(a)
(b)
(c)
(d)
Dai
ly w
eigh
t ga
in (g
)D
aily
tran
spira
tion
(g h
r–1 )
g sc
(g h
r–1 m
ass–1
)D
RI
Figure 3. Ranked physiological characteristics of tomato population.
(a–d) ILs (black bars), M82 (red bars), Penelli (green bars) and additional cultivated tomato cv. MP1 (open bars) were grown on the lysimeter system under peri-
odic intervals of full irrigation and drought. All plants were continuously monitored for: (a) daily whole-plant weight gain; + and � signs above the bars indicate
match or mismatch, respectively, of plant weight relative to field-grown plants, as culled from the literature (see Table S1), revealing 72% agreement between
our measurements and those reported in the literature, (b) daily whole-plant midday transpiration; plant’s relative WUE could be concluded based on the angle
of its position-shift for MP1 and IL5-5, (c) whole-plant midday canopy stomatal conductance (gsc); plant weight was obtained from the lysimeter system, (d)
drought-resistance index (DRI). Each column is the mean of five consecutive days from a single plant � SE.
© 2016 The AuthorsThe Plant Journal © 2016 John Wiley & Sons Ltd, The Plant Journal, (2016), doi: 10.1111/tpj.13425
Physiological phenotyping of whole-plant water relations 5
with M82 exhibiting more conservative water-balance
management behavior.
Whole-plant root-to-shoot water flux and relative water
content (RWC)
An additional important feature of the current screening
system is the continuous whole-plant water-balance phe-
notyping evaluated by simultaneous measurement of the
rates of water flow into the roots (Jr) and out of the canopy
(ET; Figure 7). Jr is evaluated by continuously measuring
SWC (using soil probes, Figures 1 and 5) and ET by contin-
uously measuring lysimeter weight (see Experimental pro-
cedures). The continuous measurement of ET and Jrprovides a view of the temporal difference between the
two fluxes and their variation over time. The difference
between the water inflow and outflow is considered a mea-
sure of the variation of the whole-plant relative water con-
tent (RWCplant). Differences between the two fluxes
indicate that RWCplant is either decreasing or increasing
(Figure 7c and Experimental procedures). In general, water
outflow was higher than inflow for both lines during the
early morning hours. Equilibrium between inflow and out-
flow was reached in the late morning hours and persisted
through midday. Water inflow became higher than the out-
flow during the afternoon hours (Figure S5). The compar-
ison between the daily RWCplant patterns for MP1 and M82
plants indicated a greater daily RWCplant gain for MP1 at
40–50% SWC (Figure 7c). However, under severe stress,
MP1 plants experienced greater RWCplant loss than M82
plants. These observations were congruent with the man-
ual leaf RWC measurements and the growth-rate patterns
of these lines (Figures S6 and S7a, respectively). There
was a high correlation between the daily transpiration and
root water-uptake rates (Figure 8). Furthermore, the posi-
tive slope of the fitted line expressed the plant’s daily
weight gain.
DISCUSSION
The predominant procedure for developing new crop culti-
vars is based on selection of a few plants out of thousands
using conventional field-based selection criteria that
require whole seasons and repeated large-scale field trials.
This can take several years and a great deal of resources,
with a limit on the number of promising candidates that
can be simultaneously screened (Moshelion and Altman,
2015). Soil-drying experiments can at first seem quite
straightforward, but often turn out to be some of the most
difficult to interpret (Verslues et al., 2006). Here, we
demonstrate a noninvasive, high-throughput physiological
phenotyping and screening system which can easily be
integrated in research and development programs aimed
at optimizing genotype-by-environment interactions at pre-
field phases of breeding programs or characterizing plant
nutrition, or in basic plant physiology research, among
others.
Screening by the current system can provide for com-
parative examination and graded ranking of different phys-
iological characteristics [i.e., growth rate, WUE, DRI, ET, E,
gsc, Jv, RWCplant] or elucidation of the relations between
characteristics among an entire population (as the system
can be easily scaled up to much greater numbers of units,
a large germplasm population can be screened as well).
The screening can be performed for different ambient con-
ditions and a variety of plant phenological stages. The rela-
tive difference between the values of each of the
parameters for optimal versus stress conditions can be
quantified as individual stress index (e.g., Figure 2f). Plant
resilience can also be easily evaluated by this system as
the rate at which plants recover from stress after returning
to a well-irrigated regime, with faster recovery indicating a
more resilient plant (Figure S7b). Obviously, any combina-
tion of plant characteristics under different treatments and
Figure 4. Plants (39 days old) of cultivated tomato
Solanum lycopersicum cv. M82, cv. MP1, the wild-
type tomato Solanum pennellii and a few more
selected ILs (see text for explanation).
The pictures were taken at the end of the pretreat-
ment phase of the experiment. Bar = 10 cm. [Colour
figure can be viewed at wileyonlinelibrary.com].
© 2016 The AuthorsThe Plant Journal © 2016 John Wiley & Sons Ltd, The Plant Journal, (2016), doi: 10.1111/tpj.13425
6 Ofer Halperin et al.
at different phenological stages can be used to construct a
plant’s water-relations management profile and its location
in the population distribution.
The system’s ability to simultaneously monitor a large
number of plants at high temporal resolution using three
sensors further enables evaluation of momentary varia-
tions in essential parameters (Figures 5–7), which can be
used to screen related levels of performance. This detailed
information, combined with the ability to apply different
treatments to each plant, provides the researcher with a
valuable comparative tool for selection, diagnosis and opti-
mization (e.g., optimal growth 9 environment 9 manage-
ment).
Decision-making: choosing the right plant for the right
environment
Quantitative, objective and automated screening tech-
niques and algorithms have many potential advantages,
enabling rapid screening of the most promising crop lines
at an early stage, followed by the necessary field trials.
However, to become essential tools for predicting a
desired trait, these methods must take into account the
complex nature of the interactions between biological fac-
tors, management practices and environmental conditions.
For example, whereas light and VPD control Emax when
soil water is readily available, under lower SWCs, soil
water availability becomes the limiting factor, inducing a
decrease in transpiration (Figure 6). The gradual decrease
in E observed when SWC decreases below SWCcr indicates
that for SWC < SWCcr, E fails to meet the atmospheric
water demand. Moreover, the value of SWCcr depends,
inter alia, on the momentary atmospheric water demand
and decreases as Emax decreases (as was observed in the
winter experiment, Figure 6). Moreover, stomatal conduc-
tance is known to be a reliable indicator of growth-rate
responses to stress (reviewed by Munns et al., 2010). Eval-
uation of gsc together with variations in SWC provides an
additional plant-by-environment selection characteristic.
The fine regulation of whole-plant water balance
depends on many control points along the soil–plant–at-mosphere continuum. For example, leaves will be at risk of
dehydration if the amount of water lost by transpiration is
greater than the amount of water uptake by the roots. This
scenario is controlled by the combined effect of soil water
availability and VPD as a measure of atmospheric water
demand. Hence, one of the advantages of this system is
the ability to measure the water-flux balance for individual
plants in the array. As an example, our results revealed
800
1600
Rad
iatio
n(μ
mol
sec–
1 m–2
)
0.5
0.75
1
Syst
em re
lativ
ew
eigh
t0
40
80
SWC
(%)
0
10
20
E(m
mol
sec–
1 m–2
)
3 4 5 6 7 80
500
1000
g sc
(mm
ol se
c–1 m
–2)
Days
0
2
4
VPD
(kPa
)Rad VPD
M82MP1Wick
(a)
(b)
(c)
(d)
(e)
Figure 5. Variation in different whole-plant parame-
ters of M82 and MP1 plants along a soil–atmo-
sphere water gradient.
(a) Daily VPD and radiation (Rad) over 6 consecutive
days of the experiment, which included 3 days of
full irrigation followed by 3 days of drought.
(b) Variation in plants’ weights (relative to their
respective initial weights) over the course of the full
irrigation and drought treatments. The observed
weight increase (marked by arrows) was the result
of irrigating up to the level of the drainage hole.
(c) Variation in soil water content (SWC) over the
6 days of the experiment.
(d) Whole-plant transpiration (E) over the course of
the experiment. To eliminate the effect of plant size
on transpiration rate, we normalized the rate of
plant water loss to the leaf surface area.
(e) Whole-plant canopy vapor conductance (gsc)
was calculated as the ratio of E to the simultane-
ously calculated VPD. Each curve (b–e) is the mean
of 9–11 plants of each line; SE values were calcu-
lated every 90 min.
© 2016 The AuthorsThe Plant Journal © 2016 John Wiley & Sons Ltd, The Plant Journal, (2016), doi: 10.1111/tpj.13425
Physiological phenotyping of whole-plant water relations 7

that during the early morning hours, in both M82 and MP1,
leaf water outflux exceeds the root water influx (Figures 7
and S5). This difference led to a leaf water deficit (i.e.,
reduced RWC at noon). The system’s reliability was con-
firmed by conventional leaf RWC measurements (Fig-
ure S6). Moreover, the high correlation between plant root
water uptake and transpiration rate for well-irrigated plants
indicated that the soil-embedded sensor provides a reliable
estimate of water flux to the plant’s roots and confirms the
RWCplant determination as the balance between the two
variables. Hence, comparison of Figures 7(c) and 8 indi-
cates that the slightly larger than one slope in the latter is
responsible for plant growth (RWCplant > 100%) observed
in the former during the second half of the day.
This momentary high-resolution comparison also enables
the identification of relatively small differences among
plants. For example, during the drought treatment, M82
plants maintained a flux balance similar to that observed
under nonstress conditions. In contrast, in the MP1 plants,
the water deficit increased (i.e., the difference became
greater due to higher ET relative to Jr; Figure 7b), suggest-
ing the existence of a different, less strict regulation mecha-
nism in MP1 plants, resulting in more anisohydric behavior.
The changes in sensitivity of different plants’ responses
may have advantages under certain ambient conditions.
The challenge is to evaluate the relative importance of
each characteristic for plant performance in the field. For
example, high DRI values (Figure 3d) might be a good sur-
vivability trait, but might not be considered important for
crop production in environments with mild to moderate
drought. In those types of environments, more risk-taking
behaviors (i.e., higher gs) might be considered better traits
as they can lead to higher yields (Sade et al., 2009, 2010;
Moshelion et al., 2014). Careful consideration of the
desired traits with a view of expected stress scenarios is a
crucial part of any breeding program.
CONCLUSIONS
The ability to select candidate plants exhibiting a superior
stress-response strategy, in addition to other desirable
traits, is essential for research and development of crops
with the desired adaptation to environmental stress. We
describe a simple, yet robust system that can be easily
installed at any research and development facility. We
expect that use of the relatively rapid screening protocol
and equations detailed herein (which can be easily modified
to fit any particular research program) will speed up the
development process, and allow continuous measurement
of the behavior of crop plants under nonstress and stress
conditions. It is likely that initially, the major benefit of the
screening will be the early elimination of candidates that
are unlikely to perform well in trait-integration field trials
performed under the expected environmental conditions.
The diagnostic capabilities of this system are likely to be
integrated later on into optimization procedures (i.e., plant
adaptation to soils, nutrient composition, etc.), as well as
basic plant physiology research, helping the researcher
translate data into knowledge and decision-making tools.
EXPERIMENTAL PROCEDURES
Experimental setup
The experimental study was conducted in semi-commercialgreenhouses at the Faculty of Agriculture, Food and Environmentin Rehovot, Israel during December 2011 and June 2012 (referredto as winter and summer experiments, respectively). The
0
10
20
30M82MP1
0204060800
2
4
6
SWC (%)
θcr
Sum
mer
Win
ter
E max
(mm
ol se
c–1 m
–2)
SWC
cr(%
)
SWCcr
(a)
(b)
(c)
SWCcr
E max
(mm
ol se
c–1 m
–2)
Figure 6. Midday transpiration versus soil water content (SWC).
(a, b) Midday whole-plant transpiration as a function of SWC over the entire
period of (a) the summer experiment (same plants as in Figure 1) and (b)
the winter experiment (n = 11 for MP1, n = 9 for M82; see Figure S2 for a
description of the ambient conditions).
(c) Mean � SE of the maximum daily transpiration rate (Emax) and
mean � SE critical soil water content (SWCcr). Asterisks indicate no overlap
in 95% confidence intervals.
© 2016 The AuthorsThe Plant Journal © 2016 John Wiley & Sons Ltd, The Plant Journal, (2016), doi: 10.1111/tpj.13425
8 Ofer Halperin et al.
experimental setup included 3.9-L growing pots placed on tem-perature-compensated load cells, referred to as lysimeters andgravimetric system (Tadea-Huntleigh, 1042 C4; Vishay Intertech-nology, Malvern, PA, USA). The pots were filled with a commer-cial growing medium (Matza Gan, Shaham, Givat-Ada, Israel),composed of (w/w) 55% peat, 20% tuff and 25% puffed coconutcoir fiber, with a mixture bulk density of 0.3 g cm�3. Each potwas filled with 2.8 kg potting soil. The volumetric water content
of the fully drained substrate, namely the pot capacity, was 80%.The growing medium is referred to as “soil.” A single plant wasgrown in each pot. Each pot was immersed in a plastic container(13 9 21.5 9 31.5 cm H 9 W 9 L) through a hole in its top cover(Figure 1). Evaporation from the containers and pots was pre-vented by a plastic plate cover, punched in the middle to allowthe plant stem to emerge. Six wet wicks were placed on six addi-tional load cells randomly distributed among the pots withplants. The wicks were made of a woven rag, the lower part ofwhich was submerged in free water. The water loss from thewicks provided a reference for the effect of ambient conditionson transpiration.
Prior to the experiments, three random load cells were exam-ined for reading accuracy, and in particular for drift level underconstant weight-load. These measurements were performed forseveral days, and the results of two sequential representative daysare depicted in Figure S8. No drift in the constant weight readingwas observed. The periodic fluctuations of � 3–4 g (~0.1%) in theload-cell reading that were induced by input voltage fluctuationsof �25 mV (0.25%). These small fluctuations are a result of tem-perature fluctuations in the greenhouse and noise that that isinherent to electronic systems.
In all experiments, 4- to 5-week-old seedlings (on the first dayof the experiment) were used. The plants were sown in small(~50 ml) pots and transferred to the 3.9-L pot 3 weeks later, aftercareful washing of the roots, for an additional 10–14 days. Theplants were grown under natural light conditions and vents blow-ing moist air to ensure that the maximum temperature in thegreenhouse would not exceed 35°C. The temperature and relativehumidity were, respectively, in the range of 25–35°C and 40–60%during the summer experiment and 18–35°C and 20–35% duringthe winter experiment. The temperature and relative humidity in
0
40
80(a)
SWC = 40–50%
0
40
80
Tran
spira
tion
and
root
upt
ake
(g h
–1)
(b)
3 6 9 12 15
90
100
110
RW
Cpl
ant
( % )
(c)
3 6 9 12 15
Time of day (h)
SWC = 10–20%
ET Jr
ET Jr
M82 MP1
M82
MP1
Figure 7. Daily water influx and outflux and whole-
plant water balance at different soil water content
(SWC) levels.
(a–c) Daily pattern of the rate of plant water loss
(ET) and the rate of root water uptake (Jr) measured
simultaneously for (a) M82 and (b) MP1. The cumu-
lative difference between the influx and outflux is
the change in (c) whole-plant relative water content
(RWCplant). Each data point is the mean � SE of at
least nine plants per line. Lines under the curves
indicate a significant difference (Student’s t-test,
P < 0.05, every 30 min) between the transpiration
rate and the rate at which water was taken up by
the roots. Insets show the magnitudes of the slopes
between 07:00 and 09:30 h.
y = 1.0971xR² = 0.7561
0
100
200
300
400
500
600
700
800
900
0 200 400 600 800
Root
dai
ly u
ptak
e (g
)
Plant daily transpiration (g)
Figure 8. Comparison between amounts of water lost by transpiration and
taken up by the roots in a single day (06:00–19:00 h) with soil water content
of ~50% for all M82 and MP1 pots (each point represents a single pot).
A relatively high correlation between daily transpiration and root uptake
was obtained for the entire range. The difference between transpiration and
soil water uptake rates during the day could be attributed to plant weight
gain.
© 2016 The AuthorsThe Plant Journal © 2016 John Wiley & Sons Ltd, The Plant Journal, (2016), doi: 10.1111/tpj.13425
Physiological phenotyping of whole-plant water relations 9
the greenhouse and the photosynthetically active radiation weremonitored using an HC2-S3-L meteo probe (Rotronic, Crawley,UK) and LI-COR 190 Quantum Sensor (Lincoln, NE, USA). Theweighing lysimeters, soil-moisture sensors and environmentalsensors were connected a to a CR1000 data logger through AM16/32B multiplexers (Campbell Scientific, Logan, UT, USA). Readingsof the weighing lysimeters and the environmental sensors weretaken every 15 sec and averages for each 3-min period werestored in the data logger for further analysis. Soil moisture wasmeasured every 3 min.
Each plant was irrigated by four on-surface drippers to ensureuniform water distribution in the pots at the end of the irrigationevent and prior to free drainage. Plants were irrigated in threeconsecutive cycles, each consisting of 20 min watering followedby 40 min drainage, between 23:00 and 02:00. The daily pre-dawn pot weight was determined as the average weightbetween 05:00 and 05:30 h, after ensuring that drainage hadceased. After several days with an empty pot, very goodrepeatability was observed. The surplus water provided in eachirrigation brought the water level in the containers underneaththe pots at the end of the drainage event to 2 cm above the potbase. This water level was achieved by a drainage orifice in thecontainer side wall through which the excess water drained. Inaddition to salt leaching from the pots, the excess irrigationensured that water would be fully available to the well-irrigatedplants throughout the following daylight hours without supple-mental irrigation. The lack of additional irrigation throughout thedaylight hours ensured a monotonic pot-weight decreasebetween subsequent irrigation events. This monotonicityenabled applying the data-analysis algorithm that was devel-oped for this experimental setup. Moreover, reaching an a prioridetermined water level at drainage completion during the nightenabled determining the daily plant weight gain. The procedureis detailed further on. A commercial fertilizer solution (SuperGrow 6-6-6+3, Hortical, Kadima, Israel) was applied with the irri-gation water at 0.2% (v/v) (fertigation).
A soil moisture, salinity and temperature sensor (5TE; DecagonDevices, Pullman, WA, USA) was embedded in each pot to pro-vide time series for these three variables. The measured soildielectric permittivity was converted to volumetric water contentusing a third-order polynomial (Topp et al., 1980). The polynomialcoefficients for the growing medium were determined experimen-tally. Greenhouse measurements of light and VPD before the startof the experiment were similar to the conditions reported in Fig-ures 5 and S3 (for summer and winter experiments) respectively.
The experiment with ILs consisted of 5-week-old ILs (n = 65) ofthe wild tomato species (Penelli) against the background of thecultivated tomato M82, their parents, and the additional cultivatedtomato MP1. The experimental study included two treatments:surplus irrigation and drought. The plants in the drought treat-ment were dehydrated by stopping irrigation.
The daily transpiration (PDT) of each plant was calculated as thedifference between the load-cell readings pre-dawn (Wm) and inthe evening (We) for each day:
PDT ¼ Wm �We (1)
The values of Wm and We were determined as the average load-cell reading over a 30-min period: 15 min prior to and followingthe specified time. This averaging intends to eliminate the effectof temporal variation in ambient conditions (which occurred par-ticularly at the morning and afternoon hours) and random noisethat is associates any electronic and data-acquisition systems. Thedata averaging over 30 time span were found to be adequate.
Being controlled by an orifice in its wall, the water in the con-tainer was constant at the cessation of free drainage, independentof plant weight. This enabled determining the plant weight gain(fresh weight or biomass) at the end of irrigation and drainage forany desired period (day, week, etc.). The plant daily weight gain(DPWn) between consecutive days was:
DPWn ¼ Wn �Wn�1 (2)
where Wn and Wn-1 are the container weights upon drainage ter-mination on consecutive days, n and n – 1. Following Eq. 2, theweight on day n is the sum of plant weight on day n � 1 and theweight gain DPWn-1
PWn ¼ PWn�1 þ DPWn (3)
The whole-plant WUE during a defined period was determinedby the ratio between the sum of the daily plant fresh-weight gain(DPW) and water consumed throughout this period:
WUE ¼P
DPWnPPDTn
(4)
The WUE for the whole plant (Eq. 4) replaces the commonlyused physiological WUE determined as the ratio between theaccumulated CO2 molecules and evaporated H2O, which is usuallydetermined for leaf patches. The values calculated by Eq. 4 arecompatible with integrated WUE, which is expressed as biomassaccumulation or yield per unit of water used (Yoo et al., 2009).Equation (5) was then used to determine plant weight gainthroughout the drought period, when plants were not irrigatedand the above procedure to calculate the plants’ weight gain couldnot be applied: X
DPWn ¼ WUE �X
PDTn (5)
where WUE was calculated for the well-irrigated period (Eq. 4),and PDTn is the measured daily water consumption throughoutthe drought period.
The momentary whole-plant transpiration rate WPT was calcu-lated by multiplying the first derivative of the measured load-celltime series by �1, assuming that the plant’s weight gain duringthe short time interval used to calculate the transpiration rate isnegligible and that under stress conditions, changes in the plantWUE are minor and can be therefore neglected:
WPTk � � dW
dt
� �k
� �Wk �Wk�1
tk � tk�1(6)
Wk and Wk-1 are the load-cell readings at time tk and tk-1, respec-tively. The momentary water flux into the plants roots was simi-larly calculated by:
Jrð Þk � � dðSWCÞdt
� �k
� Vs � �SWCk � SWCk�1
tk � tk�1� Vs (7)
where SWC in a pot is measured by the soil-embedded 5TE sen-sor, and Vs is the soil volume in the pot. In general, a numericalderivative of a time series amplifies the system’s intrinsic noise(load cell, data-acquisition system). The noise amplificationincreases as the sampling interval, tk and tk-1, decreases. Thisnoise was reduced prior to the differentiation (Eqn 6 and 7) bysmoothing the data time series using the Savitzky and Golay(1964) method with a 61-data-point filtering window and a fourth-order polynomial (Wallach et al., 2010).
Given that the spatial water content and root distribution in thepot are nonuniform and thus, neither is water uptake, the accuracyof the water-uptake evaluation by a single sensor was evaluatedby a comparison between the simultaneously measured
© 2016 The AuthorsThe Plant Journal © 2016 John Wiley & Sons Ltd, The Plant Journal, (2016), doi: 10.1111/tpj.13425
10 Ofer Halperin et al.
accumulated water uptake and transpiration rate during the day-light hours (Figure 7). The comparison provided a fairly good fit,especially for the major range of the cumulative water-loss/uptake values.
RWCplant was determined as the balance between the plant’swater outflux (transpiration) and influx (root water uptake) (Eqns.6 and 7). A comparison between the amount of water taken up bythe roots and that lost by transpiration during day 7 (06:00 to19:00 h, when the SWC content was about 50%) is depicted in Fig-ure 8, where each point represents a single pot. A relatively highcorrelation between daily transpiration and root uptake wasobtained for the entire range. Referring to Figure 7, the agreementbetween the daily transpiration and root uptake rates was higherfor days when both were higher.
The difference between the momentary transpiration and soilwater-uptake rates during a single day could be attributed to themomentary changes in RWCplant. The change in RWCplant at agiven time during the day relative to midnight of that day, whenthe RWCplant is assumed to be 100%, was 1. Therefore, RWCplant
was calculated by:
ð1� RWCnÞ�100 ¼ DRWCn ¼Pn
n¼0ðJrn � ETnÞ�DtPW
(8)
where Dt is the sampling time interval (0.05 h in the currentstudy), and n determines the time during the day. PW is the plantweight on the day for which RWCplant is calculated (Figure S7).
Leaf RWC was measured concurrent with RWCplant, accordingto Sade et al. (2015). The leaves used to determine their RWCwere picked at 06:00, 10:00 and 14:00 h on 3 days during thedrought treatment. The leaf fresh weight (FW) was measuredimmediately after cutting. Leaf petioles were soaked for 8 h in a5 mM CaCl solution in a sealed plastic bag, in the dark at roomtemperature. The turgid weight (TW) was determined after peti-ole soaking, and the dry weight (DW) was determined after theleaf was dried at 70°C for 72 h. The leaf RWC was then calculatedas:
RWCleaf ¼ FW� DW
TW� DW
� �� 100 (9)
The leaf RWC was measured for chosen plants of each lineexperiencing three similar SWC levels (~80, ~50 and ~20%). Deci-sions regarding which plants to sample were made before dawn,based on the data collected by the probes continuously monitor-ing the SWC of each pot.
The leaf area ratio (LAR), defined as the ratio of leaf area (LA) toshoot weight at the end of the experiment (m3 g�1), and theshoot-weight ratio (SWR), defined as the ratio between the mea-sured shoot weight and the calculated plant weight at the end ofthe experiment, were calculated for each plant and averaged forplants of the different lines. Plant LA (cm2) was determined dailyby:
LA ¼ PW�SWR�LAR (10)
where SWR = 0.6 for both lines. The transpiration rate normalizedby plant LA (E [mmol sec�1 m�2]) was equivalent to the valuesthat are usually measured by gas-exchange devices for a smallLA. The LA in Eq. 10 refers to the whole plant under examination.The canopy vapor conductance (gsc [mmol sec�1 m�2]) can be cal-culated using Eq. 6 as:
gsc ¼ WPT � Patm
LA � VPD ¼ E � Patm
VPD(11)
where Patm is the atmospheric pressure (101.3 kPa). The VPD,determined as the difference (in kPa) between saturation vapor
pressure and actual vapor pressure of ambient air is frequentlyused to evaluate the atmospheric water demand:
VPD ¼ 1� RHð Þ0:611 � exp 17:502 � T240:97þ T
� �(12)
where T is the air temperature (°C), RH is the relative humidity (0–1) and 0.611 is the saturation vapor pressure at 0°C; 17.502 and240.97 are constants (Buck, 1981).
Temporal comparison of the dependence of momentary andcumulative transpiration rate of plants of different cultivars is prob-lematic. The relation of drought time to SWC and its effect on tran-spiration rate may lead to erroneous conclusions regarding theplant’s ability to cope with drought conditions. Plants that transpiremore than others will experience lower SWC levels at a given timeduring drought than those that transpire less. Therefore, the relationbetween transpiration rate and SWC, rather than time, providesdirect information on how different cultivars cope with increasingsoil dehydration. The average transpiration rate between 11:00 and13:00 hwas plotted versus SWC for each drought day.
A piecewise linear approximation was then fitted for the differ-ent cultivars:
EðhÞ ¼ Emax ; h� hcrEmax þ b h� hcrð Þ ; h\hcr
�(13)
where Emax, b, and hcr are the model-fitting parameters. Thepiecewise linear approximation is based on Cowan’s (1965)hypothesis that transpiration is equal to the lesser of the poten-tial rates representing atmospheric demand, and soil water sup-ply has been widely used in modeling the role of soil moistureon ET (Federer, 1979; Williams and Albertson, 2004 and refer-ences therein).
Drought-resistance index (DRI) = (Es/En)/(Ms/Mn); Es and En arethe genotype mean transpiration rates under stress and nonstressconditions, respectively, and Ms and Mn are the mean transpira-tion rates of all genotypes in the given test under stress and non-stress conditions, respectively.
Gas-exchange measurements
Gas-exchange measurements (Figure S4) were taken with a LI-COR 6400 portable gas-exchange system. Analysis was performedon fully expanded M82 leaves grown under the same conditionsand at the same time in the same greenhouse as plants in Fig-ure 5. Measurements were taken under saturating light(1200 lmol m�2 sec�1; blue light was set to 10% of the photosyn-thetically active photon) with 400 lmol mol�1 CO2 surroundingthe leaf flux density. The leaf-to-air VPD was kept at around 1.5–2.5 kPa during all measurements. Leaf temperature for all mea-surements was ca. 26°C.
Stomatal aperture and density
Abaxial leaf stomatal aperture and density were imprinted onglass as described by Geisler and Sack (2002). All samples werecollected at around 11:00 h. This approach allowed us to reliablyscore hundreds of stomata from each experiment. In brief, light-bodied vinyl polysiloxane dental resin (Heraeus-Kulzer, http://heraeus-dental.com/) was applied to the abaxial leaf side, dried(~1 min) and removed. The resin epidermal imprints were coveredwith nail polish, which was removed once it had dried and servedas a mirror image of the resin imprint. The nail-polish imprintswere placed on microscope slides.
The stomata were counted and photographed under a bright-field inverted microscope (Zeiss 1M7100, Oberkochen, Germany)
© 2016 The AuthorsThe Plant Journal © 2016 John Wiley & Sons Ltd, The Plant Journal, (2016), doi: 10.1111/tpj.13425
Physiological phenotyping of whole-plant water relations 11
on which an HV-D30 CCD camera (Hitachi, Tokyo, Japan) wasmounted. Stomatal images were later analyzed to determine aper-ture size using the ImageJ software (http://rsb.info.nih.gov/ij/)area-measurement tool. The program selection was checked andcorrected if necessary for each stomate. A microscope ruler(Olympus, Tokyo, Japan) was used for the size calibration.
Data analysis
All data analyses were performed using Matlab software (Math-Works, Natick, MA, USA). The dataset included daily data (onevalue per day for each plant) and momentary data acquired every3 min (480 values per day for each plant). Means that were deemedsignificantly different at P < 0.05 were compared using Student’s t-test and analysis of variance (ANOVA) (noted in the figure legends).Comparisons of the parameters of Eq. 13 for the two lines weremade using 95% confidence intervals. Nonoverlapping confidenceintervals indicated a significant difference at P < 0.05.
ACKNOWLEDGMENTS
We thank Mr Gil Lerner and Mr Ziv Attia for their practicaladvice and technical assistance. This study was supported bygrant no. OR309/1-1 from the German-Israeli Project Cooperation(DIP).
SUPPORTING INFORMATION
Additional Supporting Information may be found in the online ver-sion of this article.Figure S1. Comparison of whole-plant normalized transpirationand stomatal conductance of M82 and Penelli.Figure S2. Raw data of the gravimetric system.Figure S3. Whole-plant transpiration regulation in response to asoil–atmosphere water gradient (winter experiment).Figure S4. Midday gas-exchange measurements of M82 plantsusing portable gas-exchange system.Figure S5. Continuous whole-plant transpiration (ET) and rootuptake (Jr) for each individual plant over the course of the daywere the soil water content reached ~50%).Figure S6. Leaf relative water content (RWC) at different levels ofsoil water content (SWC) levels.Figure S7. Full treatment growth-profile regime and recovery-rateanalysis.Figure S8. Variation of input voltage and load-cell reading forthree constant loads during two typical days.
Table S1. Summary of characteristics of field-grown plants fromthe literature.
REFERENCES
Bolger, M.E., Weisshaar, B., Scholz, U., Stein, N., Usadel, B. and Mayer,
K.F.X. (2014) Plant genome sequencing – applications for crop improve-
ment. Curr. Opin. Biotechnol. 26, 31–37.Brodribb, T.J. and Holbrook, N.M. (2004) Diurnal depression of leaf hydrau-
lic conductance in a tropical tree species. Plant Cell Environ. 27, 820–827.Buck, A.L. (1981) New equations for computing vapor pressure and
enhancement factor. J. Appl. Meteorol. 20, 1527–1532.Cowan, I.R. (1965) Transport of water in the soil–plant–atmosphere system.
J. Appl. Ecol. 2, 221–239.Earl, H.J. (2003) A precise gravimetric method for stimulating drought stress
in pot experiments. Crop Sci. 43, 1868–1873.Eshed, Y. and Zamir, D. (1995) An introgression line population. Genetics.
141, 1147–1162.Federer, C.A. (1979) A soil-plant-atmosphere model for transpiration and
availability of soil water. Water Resour. Res. 15, 555–562.Furbank, R.T. and Tester, M. (2011) Phenomics–technologies to relieve the
phenotyping bottleneck. Trends Plant Sci. 16, 635–644.
Geisler, M.J. and Sack, F.D. (2002) Variable timing of developmental pro-
gression in the stomatal pathway in Arabidopsis cotyledons. New Phytol.
153, 469–476.Ghanem, M.E., Marrou, H. and Sinclair, T.R. (2015) Physiological phenotyp-
ing of plants for crop improvement. Trends Plant Sci. 20, 139–144.Golzarian, M.R., Frick, R.A., Rajendran, K., Berger, B., Roy, S., Tester, M.
and Lun, D.S. (2011) Accurate inference of shoot biomass from high-
throughput images of cereal plants. Plant Methods, 7, 2.
Graff, G., Hochman, G. and Zilberman, D. (2013) The research, develop-
ment, commercialization, and adoption of drought and stress-tolerant
crops. In Crop Improvement Under Adverse Conditions (Tuteja, N. and
Gill, S.S., eds). New York: Springer, pp. 1–33.Hartmann, A., Czauderna, T., Hoffmann, R., Stein, N. and Schreiber, F.
(2011) HTPheno: an image analysis pipeline for high-throughput plant
phenotyping. BMC Bioinformatics, 12, 148. doi:10.1186/1471-2105-12-148.
Hsiao, T.C. and Acevedo, E. (1974) Plant responses to water deficits, water-
use efficiency, and drought resistance. Agric. Meteorol. 14, 59–84.Moshelion, M. and Altman, A. (2015) Current challenges and future perspec-
tives of plant and agricultural biotechnology. Trends Biotechnol. 33, 337–342.
Moshelion, M., Halperin, O., Wallach, R., Oren, R. and Way, D.A. (2014) Role
of aquaporins in determining transpiration and photosynthesis in water-
stressed plants: crop water-use efficiency, growth and yield. Plant Cell
Environ. 38, 1785–1793.Munns, R., James, R.A., Sirault, X.R.R., Furbank, R.T. and Jones, H.G. (2010)
New phenotyping methods for screening wheat and barley for beneficial
responses to water deficit. J. Exp. Bot. 61, 3499–3507.Passioura, J.B. (2012) Phenotyping for drought tolerance in grain crops:
when is it useful to breeders? Funct. Plant Biol. 39, 851–859.Pereyra-Irujo, G.A., Gasco, E.D., Peirone, L.S. and Aguirrez�abal, L.A.N.
(2012) GlyPh: a low-cost platform for phenotyping plant growth and
water use. Funct. Plant Biol. 39, 905–913.Richards, R.A., Rebetzke, G.J., Watt, M., Condon, A.G. (Tony), Spielmeyer,
W. and Dolferus, R. (2010) Breeding for improved water productivity in
temperate cereals: phenotyping, quantitative trait loci, markers and the
selection environment. Funct. Plant Biol. 37, 85–97.Sade, N., Vinocur, B.J., Diber, A., Shatil, A., Ronen, G., Nissan, H., Wallach,
R., Karchi, H. and Moshelion, M. (2009) Improving plant stress tolerance
and yield production: is the tonoplast aquaporin SlTIP2;2 a key to isohy-
dric to anisohydric conversion? New Phytol. 181, 651–661.Sade, N., Gebretsadik, M., Seligmann, R., Schwartz, A., Wallach, R. and
Moshelion, M. (2010) The role of tobacco aquaporin1 in improving water
use efficiency, hydraulic conductivity, and yield production under salt
stress. Plant Physiol. 152, 245–254.Sade, N., Galkin, E. and Moshelion, M. (2015) Measuring arabidopsis,
tomato and barley leaf relative water content (RWC). Bio-Protocols, 5,
1–4.Savitzky, A. and Golay, M.J.E. (1964) Smoothing and differentiation of data
by simplified least squares procedures. Anal. Chem. 36, 1627–1639.Taiz, L. and Zeiger, E. (2010) Plant Physiology, Chapter 3, Water and Plant
Cell. 5th edn. Sunderland, MA: Sinauer Associates, Inc., pp. 80–81.Topp, G.C., Davis, J.L. and Annan, A.P. (1980) Electromagnetic determina-
tion of soil water content: measurements in coaxial transmission lines.
Water Resour. Res. 16, 574–582.Vera-Repullo, J.A., Ruiz-Pe~nalver, L., Jim�enez-Buend�ıa, M., Rosillo, J.J. and
Molina-Mart�ınez, J.M. (2015) Software for the automatic control of irriga-
tion using weighing-drainage lysimeters. Agric. Water Manag. 151, 4–12.Verslues, P.E., Agarwal, M., Katiyar-Agarwal, S., Zhu, J. and Zhu, J.-K.
(2006) Methods and concepts in quantifying resistance to drought, salt
and freezing, abiotic stresses that affect plant water status. Plant J. 45,
523–539.Wallach, R., Da-Costa, N., Raviv, M. and Moshelion, M. (2010) Development
of synchronized, autonomous, and self-regulated oscillations in transpi-
ration rate of a whole tomato plant under water stress. J. Exp. Bot. 61,
3439–3449.Williams, C.A. and Albertson, J.D. (2004) Soil moisture controls on canopy-
scale water and carbon fluxes in an African savanna. Water Resour. Res.
40, W09302. doi:10.1029/2004WR003208.
Yoo, C.Y., Pence, H.E., Hasegawa, P.M. and Mickelbart, M.V. (2009) Regula-
tion of transpiration to improve crop water use. Crit. Rev. Plant Sci. 28,
410–431.
© 2016 The AuthorsThe Plant Journal © 2016 John Wiley & Sons Ltd, The Plant Journal, (2016), doi: 10.1111/tpj.13425
12 Ofer Halperin et al.
M82 Penelli
gsc
(g h
-1 m
ass-1
) a
b b
c
b 15
10
5
0
a
M82 Penelli
80 45E
(g h
-1 m
ass-1
) SWC (%) a
b b
c
0.6
0.4
0.2
0
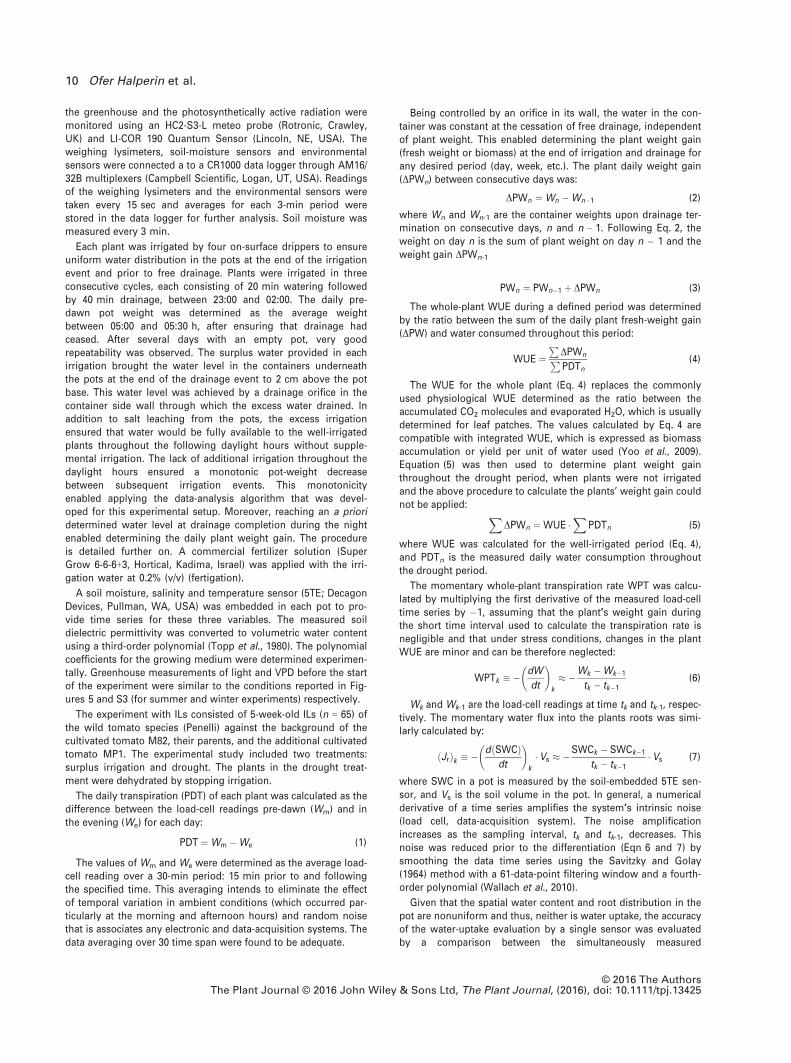
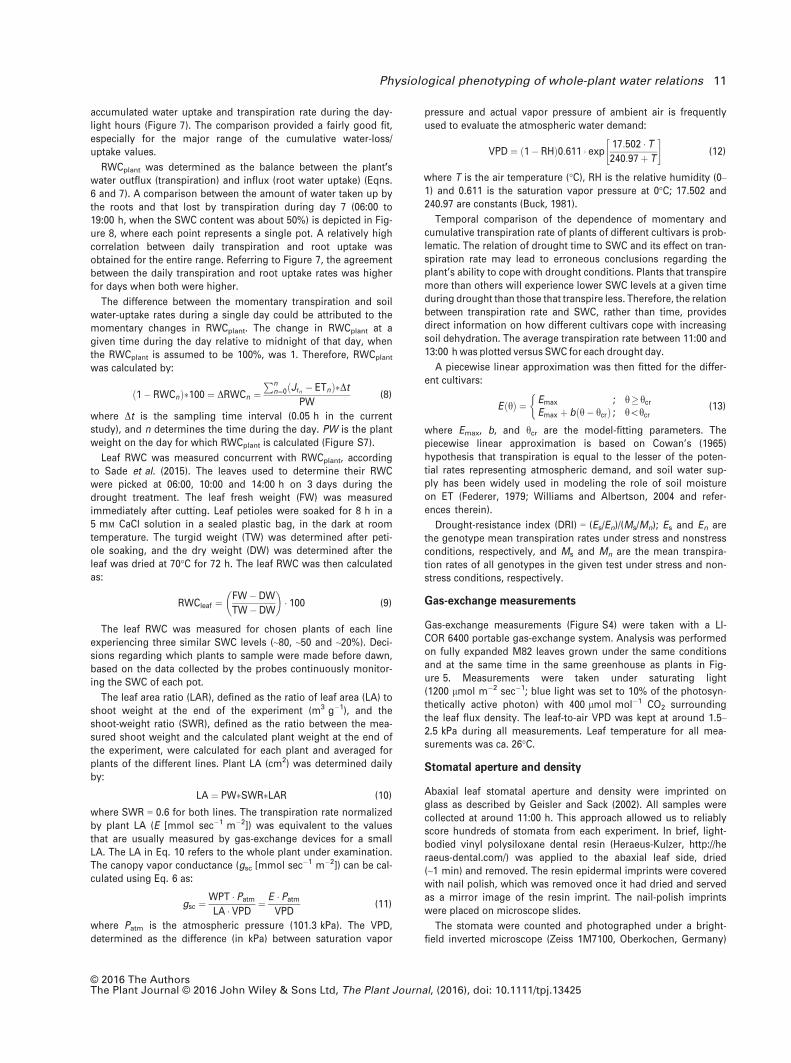
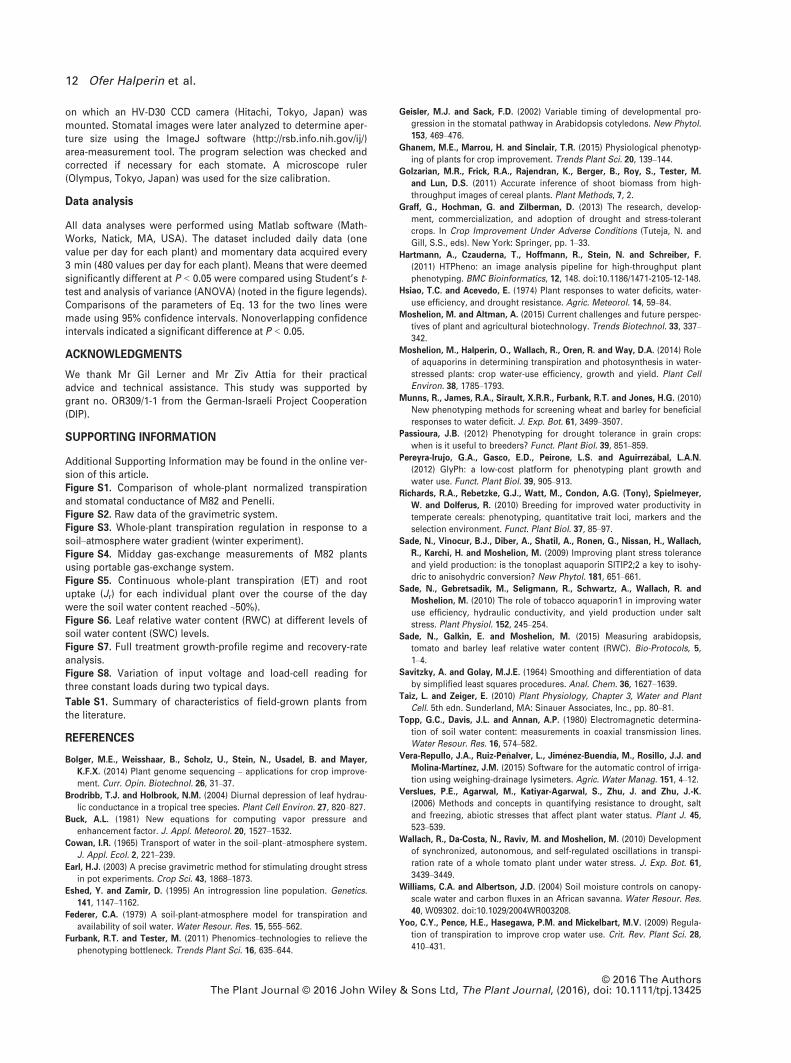
Figure S1. Comparison of whole-plant normalized transpiration and stomatal
conductance of M82 and Penelli plants. (a) Mean ± SE of whole-plant midday
normalized transpiration (E). (b) Mean ± SE of whole-plant midday canopy stomatal
conductance (gsc) at 80% and 45% soil water content (SWC). Plant weight was
obtained from the lysimeter system (see Experimental Procedures). Different letters
above columns represent significant differences (two-way ANOVA: Tukey–Kramer,
P < 0.05; n = minimum of 6 plants of each line per treatment
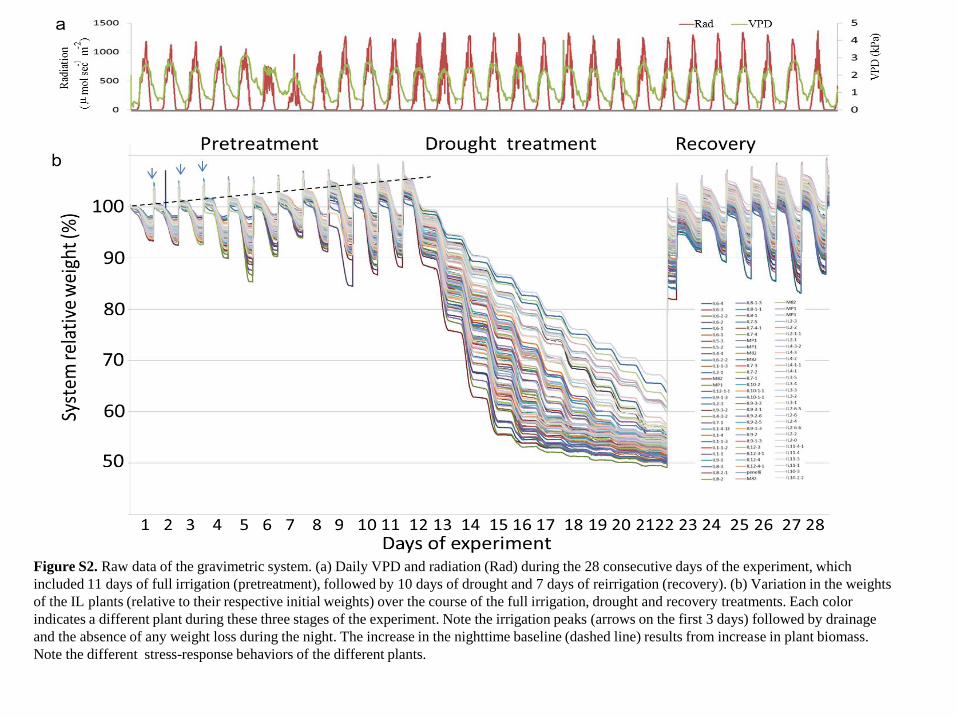
Figure S2. Raw data of the gravimetric system. (a) Daily VPD and radiation (Rad) during the 28 consecutive days of the experiment, which
included 11 days of full irrigation (pretreatment), followed by 10 days of drought and 7 days of reirrigation (recovery). (b) Variation in the weights
of the IL plants (relative to their respective initial weights) over the course of the full irrigation, drought and recovery treatments. Each color
indicates a different plant during these three stages of the experiment. Note the irrigation peaks (arrows on the first 3 days) followed by drainage
and the absence of any weight loss during the night. The increase in the nighttime baseline (dashed line) results from increase in plant biomass.
Note the different stress-response behaviors of the different plants.
a
b
c
d
e
800
1600
Rad
iati
on
( m m
ol
sec - 1
m - 2
)
a
0.6
0.8
1
Syst
em
rela
tive
wei
ght
b
0
40
80
SW
C
(%)
0
2
4
6
E
(mm
ol
sec - 1
m - 2
)
c
d
3 4 5 6 7 8 9 0
500
gs c
(mm
ol
sec - 1
m - 2
)
Days
e
0
2
4
VP
D (
kP
a)
Rad VPD
M82
MP1
Wick
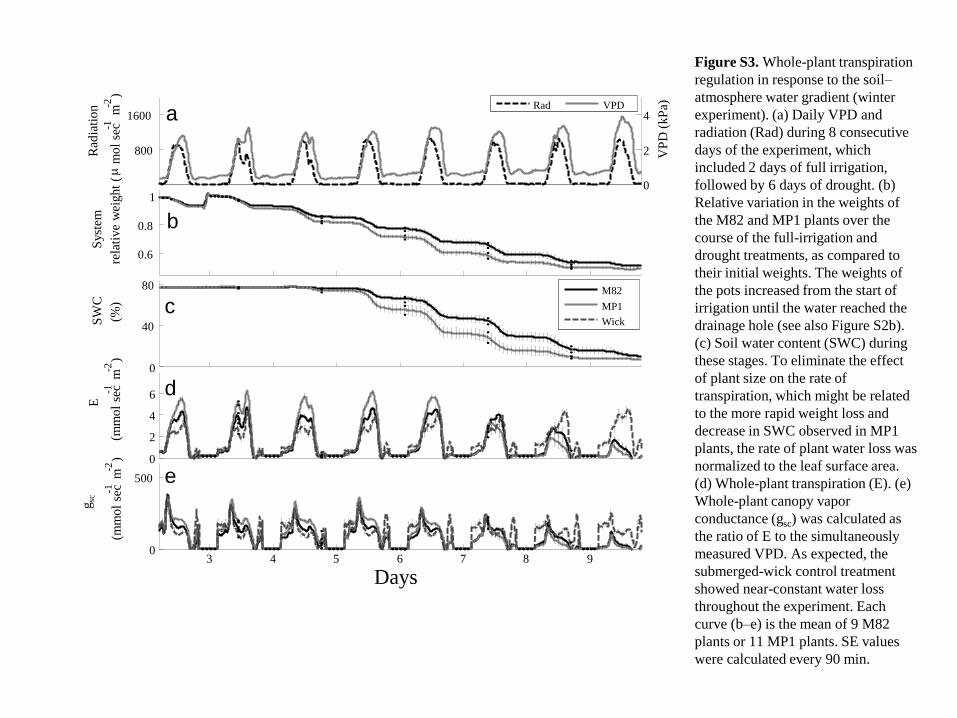
Figure S3. Whole-plant transpiration
regulation in response to the soil–
atmosphere water gradient (winter
experiment). (a) Daily VPD and
radiation (Rad) during 8 consecutive
days of the experiment, which
included 2 days of full irrigation,
followed by 6 days of drought. (b)
Relative variation in the weights of
the M82 and MP1 plants over the
course of the full-irrigation and
drought treatments, as compared to
their initial weights. The weights of
the pots increased from the start of
irrigation until the water reached the
drainage hole (see also Figure S2b).
(c) Soil water content (SWC) during
these stages. To eliminate the effect
of plant size on the rate of
transpiration, which might be related
to the more rapid weight loss and
decrease in SWC observed in MP1
plants, the rate of plant water loss was
normalized to the leaf surface area.
(d) Whole-plant transpiration (E). (e)
Whole-plant canopy vapor
conductance (gsc) was calculated as
the ratio of E to the simultaneously
measured VPD. As expected, the
submerged-wick control treatment
showed near-constant water loss
throughout the experiment. Each
curve (b–e) is the mean of 9 M82
plants or 11 MP1 plants. SE values
were calculated every 90 min.
b ab
a
0
0.3
0.6
0.9
M82 IL8-3 IL2-1 Cherry
803520
gs
(mo
l w
ate
r m
−2 s
ec−
1)
ab ab b
a a bc ab c
a
0
4
8
12
M82 IL8-3 IL2-1 Cherry
E
(mm
ol
wa
ter
m−
2 s
ec−
1)
a
b
b b
a b SWC
a a
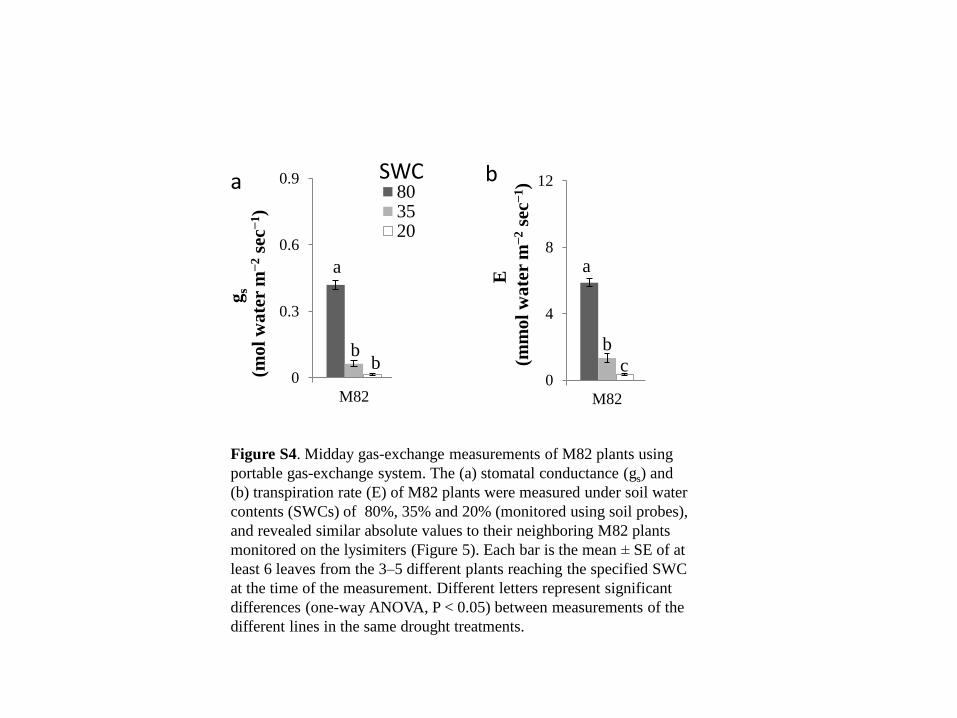
Figure S4. Midday gas-exchange measurements of M82 plants using
portable gas-exchange system. The (a) stomatal conductance (gs) and
(b) transpiration rate (E) of M82 plants were measured under soil water
contents (SWCs) of 80%, 35% and 20% (monitored using soil probes),
and revealed similar absolute values to their neighboring M82 plants
monitored on the lysimiters (Figure 5). Each bar is the mean ± SE of at
least 6 leaves from the 3–5 different plants reaching the specified SWC
at the time of the measurement. Different letters represent significant
differences (one-way ANOVA, P < 0.05) between measurements of the
different lines in the same drought treatments.
6 12 18 0
40
80
120 MP1
Time of day (h)
6 12 18
MP1
6 12 18
MP1
6 12 18
MP1 0
40
80
120 MP1
T
ran
sp
ira
tio
n a
nd
ro
ot u
pta
ke
(g
h-1
)
MP1 MP1 MP1 0
40
80
120 MP1 MP1 MP1 M82 0
40
80
120 M82 M82 M82 M82
ET Jr
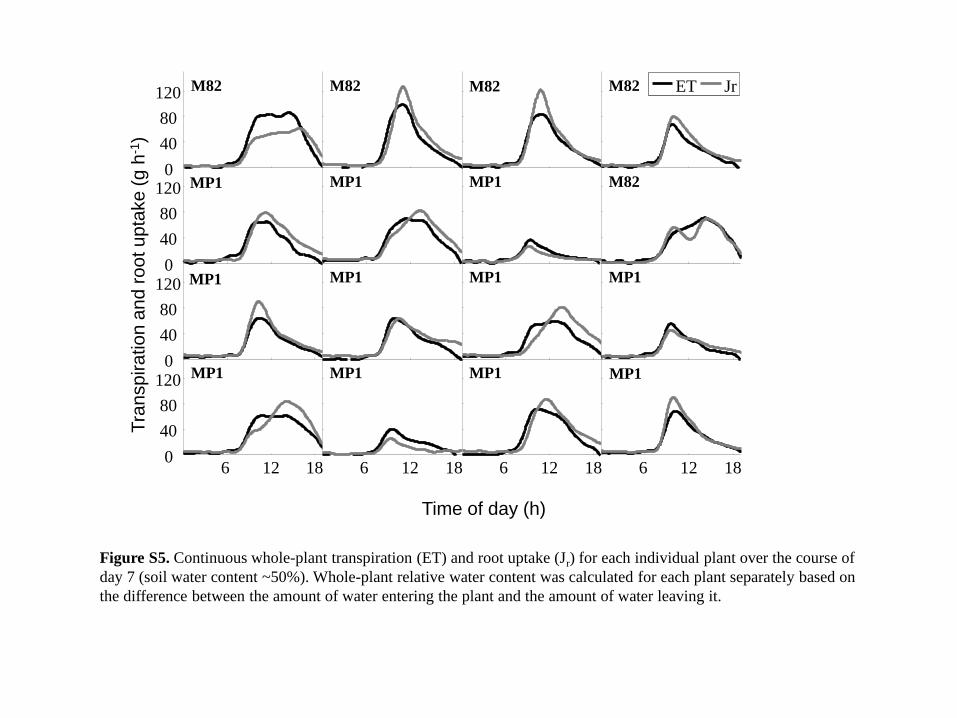
Figure S5. Continuous whole-plant transpiration (ET) and root uptake (Jr) for each individual plant over the course of
day 7 (soil water content ~50%). Whole-plant relative water content was calculated for each plant separately based on
the difference between the amount of water entering the plant and the amount of water leaving it.
80 50 20
SWC (%)
*
a a a a
b b
RW
C (
%)
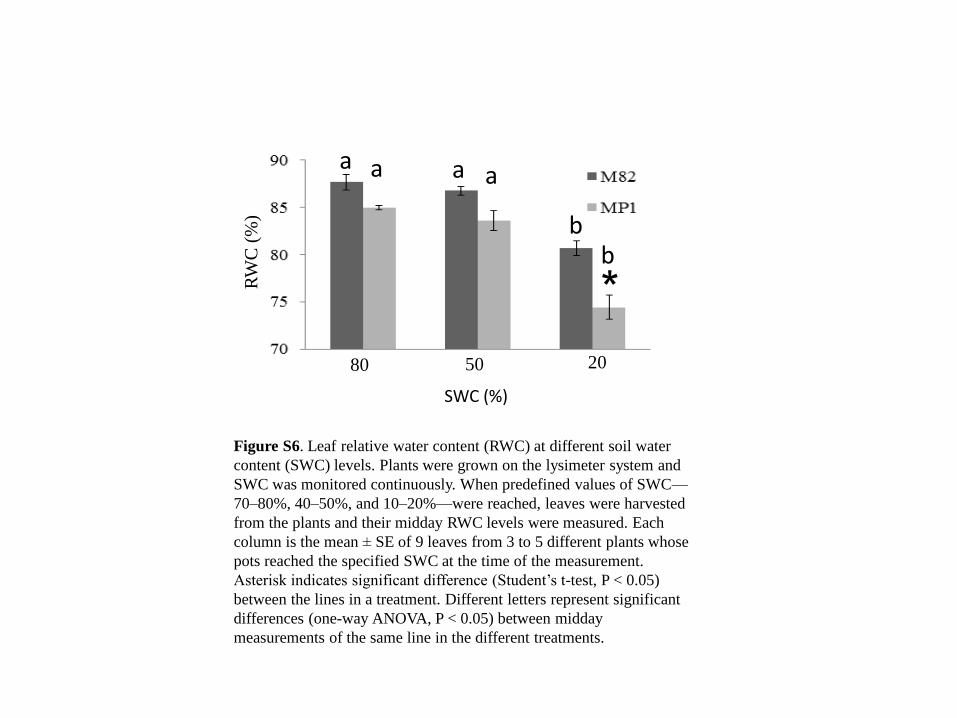
Figure S6. Leaf relative water content (RWC) at different soil water
content (SWC) levels. Plants were grown on the lysimeter system and
SWC was monitored continuously. When predefined values of SWC—
70–80%, 40–50%, and 10–20%—were reached, leaves were harvested
from the plants and their midday RWC levels were measured. Each
column is the mean ± SE of 9 leaves from 3 to 5 different plants whose
pots reached the specified SWC at the time of the measurement.
Asterisk indicates significant difference (Student’s t-test, P < 0.05)
between the lines in a treatment. Different letters represent significant
differences (one-way ANOVA, P < 0.05) between midday
measurements of the same line in the different treatments.
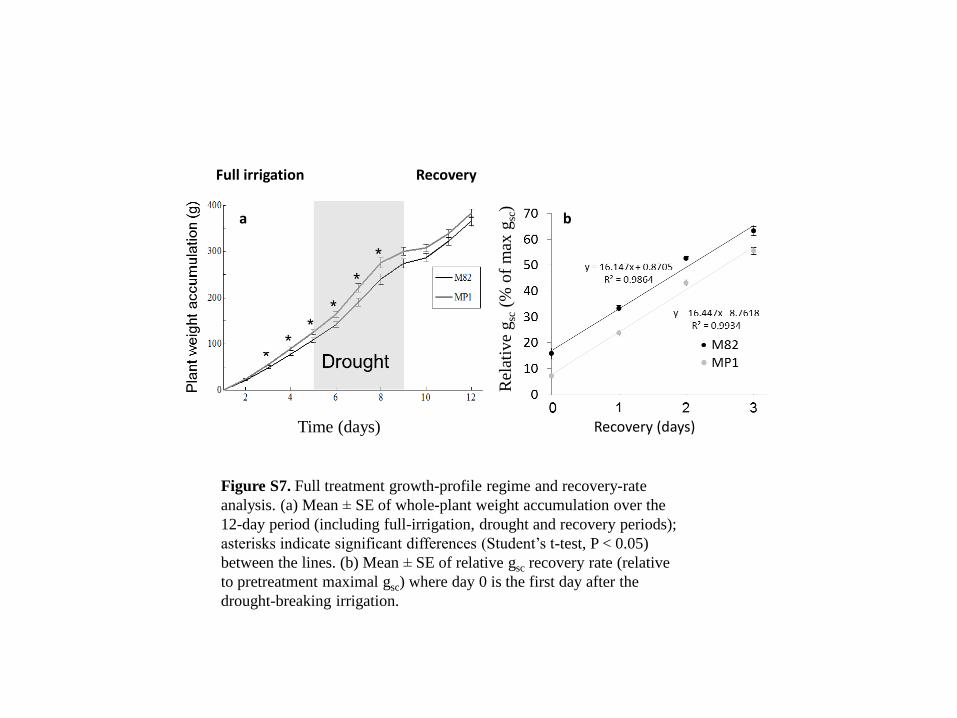
a b
Full irrigation Recovery
Recovery (days) Time (days) Time (days)
Rel
ativ
e g
sc (
% o
f m
ax g
sc)
Figure S7. Full treatment growth-profile regime and recovery-rate
analysis. (a) Mean ± SE of whole-plant weight accumulation over the
12-day period (including full-irrigation, drought and recovery periods);
asterisks indicate significant differences (Student’s t-test, P < 0.05)
between the lines. (b) Mean ± SE of relative gsc recovery rate (relative
to pretreatment maximal gsc) where day 0 is the first day after the
drought-breaking irrigation.
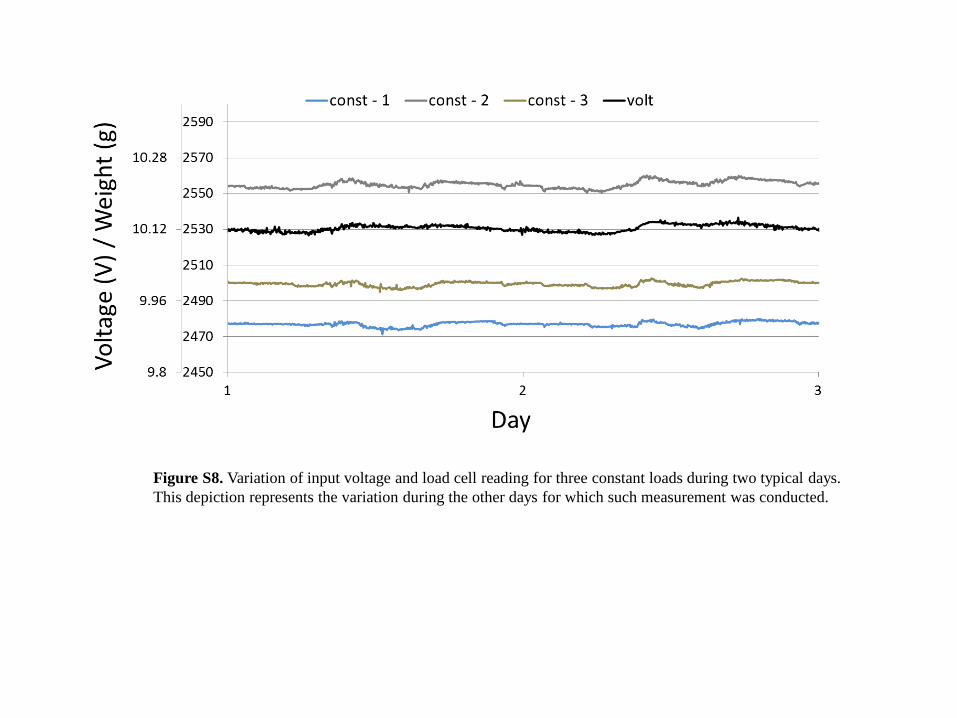
Figure S8. Variation of input voltage and load cell reading for three constant loads during two typical days.
This depiction represents the variation during the other days for which such measurement was conducted.
![High-Throughput Phenotyping and QTL Mapping Reveals the ...Breakthrough Technologies High-Throughput Phenotyping and QTL Mapping Reveals the Genetic Architecture of Maize Plant Growth1[OPEN]](https://static.fdocuments.net/doc/165x107/5e89d63e14d2eb2a2e00cbef/high-throughput-phenotyping-and-qtl-mapping-reveals-the-breakthrough-technologies.jpg)