Highly rugged kinetic method for the enzymatic determination of DNA in agarose gel with array...
11
ANALYTIC4 CHIMICA ACTA Analytica Chimica Acta 329 (1996) 285-295 Highly rugged kinetic method for the enzymatic determination of DNA in agarose gel with array detection using a charge coupled device K.B. Lim, H.L. Pardue” Department of Chemistry. 1393 BRWN Building, Purdue University, West Lafayette, IN 47YU7-13Y3, USA Received 9 December 1995: accepted 3 April 1996 Abstract This paper describes the adaptation and evaluation of an error-compensating method for kinetic determinations of DNA. A single size DNA is used for the initial study. The experimental procedures involve gel electrophoresis with ethidium bromide staining followed by DNase treatment of the agarose gel containing the single DNA band. The time-dependent decrease in fluorescence of the DNA band is monitored using a charge-coupled device camera. A Michaelis-Menten model is fitted to background-and flat-field-corrected response curves to predict the total change in fluorescence expected if the process were monitored to equilibrium. The results are compared to equilibrium and initial-rate methods. Results obtained using the predictive and equilibrium options are linear over 120-fold amounts of DNA (l-120 ng) with 3-6% imprecisions. The equilibrium and predictive-kinetic options are at least an order of magnitude more rugged to changes in ethidium bromide concentration, DNase activity and gel concentration than the initial-rate option. A DNA sample containing multiple fragments was used to evaluate the applicability of this method for more realistic situations. Keywords: Kinetic methods; Array detection; Enzymatic methods; DNA 1. Introduction The need to accelerate the mapping of the human genome [ 1,2] as well as the increasing applications of DNA determinations in both medical [3-51 and forensic [6,7] sciences have placed increasing demands on innovative and improved analytical methodologies for DNA determinations. Many of the most popular methods for DNA determinations involve kinetic- or transient-based * Corresponding author. Fax: +I 317 4961200. 0003.2670/96/$15,00 Q 1996 Elsevier Science B.V. All rights reserved PII SOOO3-2670(96)00174-2 procedures. It is generally recognized that conven- tional approaches to kinetic-based determinations tend to be much less rugged than equilibrium-based determinations involving the same reactions or processes [S]. Several alternative measurement and data-processing options have been developed to reduce effects of experimental variables and improve the ruggedness of kinetic-based determinations [9- 12]. Most studies and applications of these variable- compensating methods have focused on pseudo-first- order responses from conventional reactions in homogeneous solution. However, one of these
Transcript of Highly rugged kinetic method for the enzymatic determination of DNA in agarose gel with array...
ANALYTIC4 CHIMICA ACTA
Analytica Chimica Acta 329 (1996) 285-295
Highly rugged kinetic method for the enzymatic determination of DNA in agarose gel with array detection using a charge coupled
device
K.B. Lim, H.L. Pardue”
Department of Chemistry. 1393 BRWN Building, Purdue University, West Lafayette, IN 47YU7-13Y3, USA
Received 9 December 1995: accepted 3 April 1996
Abstract
This paper describes the adaptation and evaluation of an error-compensating method for kinetic determinations of DNA. A single size DNA is used for the initial study. The experimental procedures involve gel electrophoresis with ethidium bromide staining followed by DNase treatment of the agarose gel containing the single DNA band. The time-dependent decrease in fluorescence of the DNA band is monitored using a charge-coupled device camera. A Michaelis-Menten model is fitted to background-and flat-field-corrected response curves to predict the total change in fluorescence expected if the process were monitored to equilibrium. The results are compared to equilibrium and initial-rate methods. Results obtained using the predictive and equilibrium options are linear over 120-fold amounts of DNA (l-120 ng) with 3-6% imprecisions. The equilibrium and predictive-kinetic options are at least an order of magnitude more rugged to changes in ethidium bromide concentration, DNase activity and gel concentration than the initial-rate option. A DNA sample containing multiple fragments was used to evaluate the applicability of this method for more realistic situations.
Keywords: Kinetic methods; Array detection; Enzymatic methods; DNA
1. Introduction
The need to accelerate the mapping of the human
genome [ 1,2] as well as the increasing applications of DNA determinations in both medical [3-51 and forensic [6,7] sciences have placed increasing demands on innovative and improved analytical methodologies for DNA determinations.
Many of the most popular methods for DNA determinations involve kinetic- or transient-based
* Corresponding author. Fax: +I 317 4961200.
0003.2670/96/$15,00 Q 1996 Elsevier Science B.V. All rights reserved PII SOOO3-2670(96)00174-2
procedures. It is generally recognized that conven- tional approaches to kinetic-based determinations tend to be much less rugged than equilibrium-based determinations involving the same reactions or processes [S]. Several alternative measurement and data-processing options have been developed to reduce effects of experimental variables and improve the ruggedness of kinetic-based determinations [9- 12]. Most studies and applications of these variable- compensating methods have focused on pseudo-first- order responses from conventional reactions in homogeneous solution. However, one of these
286 K.B. Lim, H.L. Pardue/Analytica Chimica Acta 329 (1996) 285-295
approaches, called a predictive kinetic method, has been shown to be applicable to a variety of kinetic responses from both homogeneous chemical reac-
tions and physico-chemical processes [ 10,12-161. A recent study extended the predictive kinetic
method to the enzymatic determination of DNA
species in homogeneous solution [ 171. In that study, a DNAse enzyme was used to catalyze the decomposi- tion of a fluorescent ethidium bromide complex of
DNA (EtBr-DNA complex) causing a time-depen-
dent decrease of fluorescence. A curve-fitting method was used to extrapolate the time-dependent fluores-
cent signal to t=O and t+co. The resulting signal
change, AS = Su - S,, was shown to vary linearly
with DNA concentration and to be very rugged to
changes in variables including temperature and ethidium bromide and DNAse concentrations.
The present study was undertaken to evaluate the
applicability of the predictive kinetic method for DNA species separated by gel electrophoresis.
Briefly, DNA fragments were separated on an agarose gel containing ethidium bromide. After separation,
electrophoretic bands of the fluorescent EtBr-DNA complexes formed on the agarose gels were decom-
posed using DNase enzyme and the decreasing fluorescence was monitored using an imaging detector system based on a charge-coupled device
(CCD)[18]. After background and flat-field correc- tion, time-dependent signals were used to compute
initial and final values of the fluorescence signal and
ultimately the total signal change, AS=& - S,, as
described above. The signal change computed in this way varied linearly with nanogram amounts of DNA
over a IOO-fold range. Performance features includ- ing imprecision, linearity and variable dependencies are compared with initial-rate and equilibrium-based results obtained with the same data sets.
2. Experimental
2.1. Instrumentation
Spectrophotometer. A diode array-based ultra violet/visible spectrophotometer (Model 8450A, Hewlett-Packard) was used for absorbance measure- ments.
Electrophoresis. Agarose gels were cast between rectangular glass plates and notched alumina plates
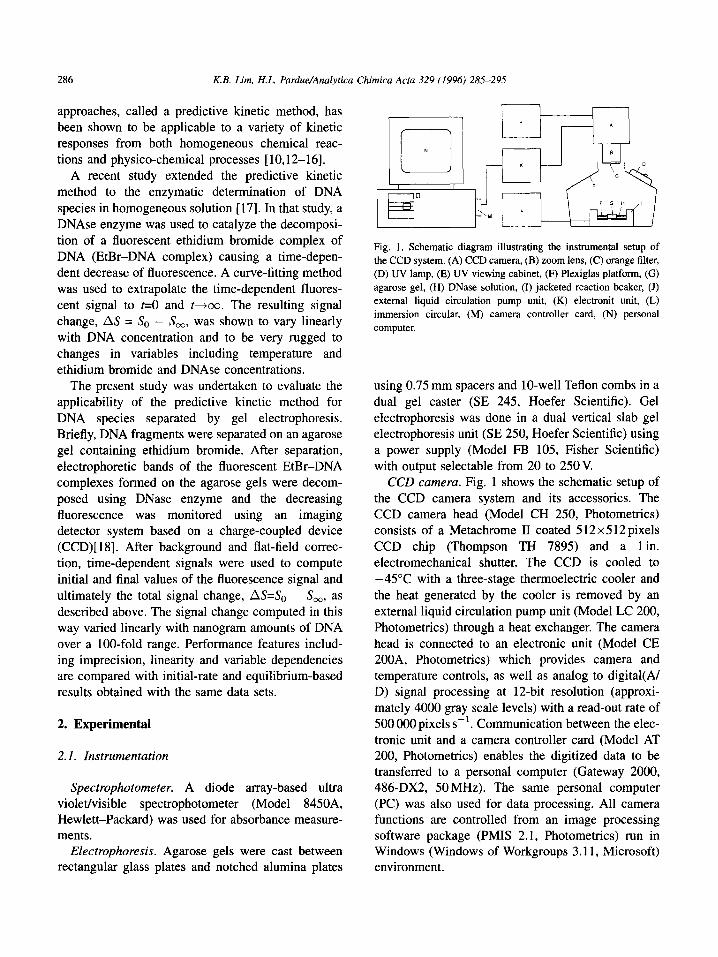
Fig. 1. Schematic diagram illustrating the instrumental setup of
the CCD system. (A) CCD camera, (B) zoom lens, (C) orange filter,
(D) UV lamp, (E) UV viewing cabinet, (F) Plexiglas platform, (G)
agarose gel, (H) DNase solution, (I) jacketed reaction beaker, (J)
external liquid circulation pump unit, (K) electronit unit, (L)
immersion circular, (M) camera controller card, (N) personal
computer.
using 0.75 mm spacers and lo-well Teflon combs in a
dual gel caster (SE 245, Hoefer Scientific). Gel electrophoresis was done in a dual vertical slab gel
electrophoresis unit (SE 250, Hoefer Scientific) using a power supply (Model FB 105, Fisher Scientific)
with output selectable from 20 to 25OV. CCD camera. Fig. 1 shows the schematic setup of
the CCD camera system and its accessories. The CCD camera head (Model CH 250, Photometrics) consists of a Metachrome II coated 5 12 x5 12 pixels
CCD chip (Thompson TH 7895) and a 1 in. electromechanical shutter. The CCD is cooled to
-45°C with a three-stage thermoelectric cooler and
the heat generated by the cooler is removed by an external liquid circulation pump unit (Model LC 200,
Photometrics) through a heat exchanger. The camera head is connected to an electronic unit (Model CE 200A, Photometrics) which provides camera and
temperature controls, as well as analog to digital@/ D) signal processing at 12-bit resolution (approxi- mately 4000 gray scale levels) with a read-out rate of
500 000 pixels s-‘. Communication between the elec- tronic unit and a camera controller card (Model AT 200, Photometrics) enables the digitized data to be
transferred to a personal computer (Gateway 2000, 486-DX2, 50MHz). The same personal computer (PC) was also used for data processing. All camera functions are controlled from an image processing software package (PMIS 2.1, Photometrics) run in Windows (Windows of Workgroups 3.11, Microsoft) environment.

K.B. Lim, H.L. Pardue/Analytica Chimica Acta 329 (1996) 285-295 287
A 28-70mm f3.5-f4.5 D macro zoom lens (Nikkor, Nikon) and a 52mm orange filter (Tiffen, Hauppauge) with transmission
ultraviolet (UV) viewing
cabinet (Cole-Palmer) and UV illumination
temperature was regulated with an immer-
sion circulator (Lauda B-l, Brinkmann Instruments).
at 4°C when not in use and was discarded after 8 h. Solutions of different enzyme activities were pre- pared by diluting the stock solution with degassed
enzyme buffer. DNA samples/other enzymes. Plasmid vector
pSP64 (2999 bp, 1 mgml-‘, Promega), BstN I digested pBR322 molecular weight marker
(1000 mg ml-‘, United States Biochemical), restric-
tive enzyme Xba I (10000units ml-‘, Promega), alkaline phosphatase (E.C. 3.1.3.1) from calf intestine
(26units pl-‘, United States Biochemical), and agar-
ose (Type II, Sigma) were used as received.
2.2. Reagents 2.3. Procedure
All reagents were prepared in doubly distilled water.
Bufsers. A stock Tris-boric acid (TB) buffer solution for gel electrophoresis was prepared to
contain 0.45 mol 1-l Tris-base (Sigma), 0.45 mol 1-l
boric acid (J.T. Baker) adjusted to pH 8.0. This stock solution was diluted lo-fold before it was used for
DNA gel electrophoresis. Stock buffer solution for
DNase experiments (enzyme buffer) contained 50 mmol 1-l NaCl (Mallinckrodt), 50 mmol 1-l Tris- base (Sigma), 5 mmoll-’ MgC12.6H20 (Fisher) and 5 mmoll-’ CaC12 (Matheson Coleman and Bell
Manufacturing Chemists) adjusted to pH 8.0. This stock solution was diluted five-fold before it was used
for the preparation of DNase solutions and subse-
quent enzymatic reactions. Both stock and diluted TB and enzyme buffers were stored at room temperature.
DNA preparation. A 3 ~1 volume of “loxbuffer D” (part of the restrictive enzyme package) and 4 ~1
of Xba I restrictive enzyme were added to approxi-
mately 20 ~1 of pSP64 plasmid vector DNA and the solution was mixed by centrifugation. The mixture
was incubated at 37°C for 18 h to cleave and open the circular double stranded DNA. Then 3 ~1 of alkaline
phosphatase solution was added and the mixture was
incubated for an additional 5 h at 37°C to remove the phosphate groups and prevent the cleaved DNA from
reannealing.
Ethidium bromide. Stock EtBr (United States
Biochemical) solution (500 pg ml-‘) was stored in a
brown bottle at room temperature away from light. It was diluted to 1 mgml-’ with the Tris-borate buffer for the gel electrophoresis experiments.
The concentration of this stock DNA solution was
confirmed by its absorbance at 260 nm. Diluted DNA samples used for electrophoresis were prepared by
serial dilution of the stock with loading dye. The stock and serially diluted DNA solutions were stored
at -20°C and at 4”C, respectively, when not being used.
Loading dye. A loading dye was prepared to contain 0.25% bromophenol blue (Fisher) and 40%
sucrose (Mallinckrodt) in water [19]. The dye was diluted 24-fold with water before use in preparation
of DNA solutions and the electrophoresis experi- ments. Both the stock and diluted dye solutions were stored at 4°C.
Gel electrophoresis. The 0.8% (w/v) gel was prepared by slowly heating the agarose with Tris-
borate buffer containing 1 mg ml-’ EtBr in a water
bath. The agarose mixture was covered during the heating to minimize loss of liquid. The molten gel was then allowed to cool to about 70°C before being
loaded into a glass sandwich and gel caster assembly by a pipetter.
Enzyme solution. DNase I (E.C. 3.1.21.1) solution (bovine pancreas, 2000 KU mg-‘, Boehringer Man- nheim) was freshly prepared as 1000 KU ml-’ in the enzyme buffer. This stock DNase solution was stored
After the agarose gel solidified, the glass sandwich
was then placed onto the vertical gel apparatus and Tris-borate buffer containing 1 pg ml-’ EtBr was poured to both the upper and lower buffer chambers. Then 2 ~1 of each sample from the serially diluted DNA solutions was carefully loaded into separate wells using an ultra-micro pipette (Model 4810,

288 K.B. Lim, H.L. Pam’ue/Analytica Chimica Acta 329 (1996) 285-295
OS-10 ul, Eppendorf, Brinkmann) with microcapil-
lary tip (10 ~1 round, Sigma). Electrophoresis was run for 15 min at 80 V (2 mA). This was sufficient time to
separate the DNA bands from the loading dye, which
may interfere with the enzymatic reaction. DNase reaction. Following electrophoresis, the gel
was removed from the glass sandwich. In order to save space and allow the gel image to fit into the field
of view of the CCD camera, only the part of the gel
containing DNA bands was used for the DNase reaction. Each gel was cut and placed as close to its
natural shape as possible onto a Plexiglas platform. An unstrained gel was expected to be less likely to
move or expand when DNase solution was added. The Plexiglas platform was cut to fit into the jacketed reaction beaker and the back side was spray-painted
black to reduce background scattering.
The platform containing the gel was placed into the empty reaction beaker controlled at 37°C. Adjust-
ments to the CCD camera lens and position of bath
were made so that all DNA bands were within the field of view of the camera. For a typical experiment,
the lens was placed 14 in. from the gel with the focal length set at 50mm with macro focusing.
DNase with appropriate activity was prepared by
diluting the stock with freshly degassed enzyme
buffer. The degassing process was achieved by suction from a water aspirator with constant stirr-
ing. The prepared enzyme then was pre-warmed to 37°C prior to the reaction. A 20 ml aliquot of DNase
solution was needed to completely cover the gels.
Keeping the excitation lamp on, the enzyme solution was poured carefully into the temperature
regulated reaction beaker containing the gels and data acquisition was initiated immediately. Images con-
sisted of a series of 200-frame sequences with 6 s exposure for each frame and a 1 s delay between
frames. Due to the low intensity of the DNA bands, a
binning of two was set for both serial and parallel CCD registers. The image size under binning was 256x 127 pixels and the 200-frame sequence occu- pied a 13 MB storage space.
Data processing. Immediately after the enzymatic reaction, dark- and flat-field correction ([20], (26))
were performed on all images collected in the sequence. Time-dependent dark-field correction is made using a rectangular area at a location on the gel without any DNA band, preferably close to the DNA
band where background correction is needed. Flat
field correction was made using a rectangular area corresponding to the location of each DNA band after
completion of the enzyme reaction.This process compensates for the effects of different light
sensitivities of individual CCD pixels, variations in
the illumination of different parts of the gel surface
and spatial attenuation due to dust particles and bubbles.
Data for the corrected image in computer memory was then used to extract intensity vs. time data. A program written as PMIS macros allows the user to
define a rectangular region around a DNA band on
the first frame of the sequence, and, utilizing the ISUM function from PMIS software, to calculate the summation of intensities from all pixels within the
defined region. Output of the program for this frame is the total band intensity and the time when the
frame is captured. The program then moves on to the
next frame to repeat a similar summation until all 200 frames of the sequence are processed. The output is
then written to a file as a two-column time vs. intensity format.
The predictive curve-fitting method was applied to
each set of intensity vs. time data using a Michaelis-
Menten model [21]. Data for S,, and S, were used to compute the total signal change, As=& - S,. Initial rates were computed from the same data as the linear-
least-squares slopes of signal vs. time during the first
2- to lo-point (13-69 s) ranges of the reaction profiles. Equilibrium results were obtained from the
total intensity of each DNA band at the first image frame before any of the DNA-EtBr complex has
reacted. All results were normalized using the 15 ng DNA sample as an internal standard.
Calibration plots. For calibration studies, six runs were made for several samples with amounts of DNA
in the range from 1 to 120ng.
Variable dependencies. For variable-dependency studies, data were obtained for five bands represent- ing 30 ng of DNA and two bands representing 15 ng of DNA for each value of each variable studied.
Results from the five trials at 30ng of DNA were normalized using the average of the two 15 ng
samples. Relative error coefficients (RECs) were used to compare variable dependencies (degrees of ruggedness) of the different data-processing options. Briefly stated, the REC is the change in concentra-

K.B. Lim, H.L. Pardue/Analytica Chimica Acta 329 (1996) 285-295 289
tion, AC, per unit change in the variable of interest, Av divided by the concentration, C, of analyte (i.e. REC(%) = lOO(AC/AV)lC). For linear calibration plots of signal vs. concentration, the REC at a
particular concentration is given by the slope of a plot
of the ratio, Ri, of intercept-corrected signals vs. numerical values of the variable of interest, in which
Ri=(Sj - a,)l(S, - a,), subscripts r and i represent reference and test values of the variable, and a, is the intercept of the calibration plot (17).
Multicomponent samples. An appropriate volume
of BstN I digested pBR322 molecular weight marker was first loaded onto a 1% (w/v) agarose gel. In
addition, a 15 ng restricted digested pSP64 plasmid DNA was used as the internal standard. Electro-
phoretic separation at 1OOV was done in TB buffer containing 1 mg ml-’ EtBr for 35 min. The gel was
then cut to a size to fit on the Plexiglas platform. The
DNase reaction and CCD imaging were as described previously. The flat-field and background-corrected
data were fitted to a Michaelis-Menten model to yield DS values. The resulting DS values for “unknown” bands were normalized using DS values
for the internal standard. Conversions of the normal- ized DS results to amounts of DNA were achieved by using the calibration plot from the predictive method.
Four different volumes (2, 3, 4 and 5 ml) of molecular weight marker were used to produce a variety of DNA band intensities. The plasmid DNA is
2999 bp in size and will show up as a single band on the same gel with the other four samples. Because
each pBR322 DNA molecule (4363 bp) produces only six fragments (1857, 1060,929, 383, 121 and 13 bp in size) upon digestion by the restrictive enzyme,
the amount of DNA prepared can be calculated
according to the mass ratio of each fragment. Thus, depending on the total amount of DNA loaded, the amount of each fragment associated with each band
can be determined. Agreements between computed results and nominal amounts of DNA prepared were then compared.
3. Results and discussion
Unless noted otherwise, all random uncertainties are reported at the level of one standard deviation (f 1
SD).
3.1. Single-component samples
iTme-dependent responses. Fig. 2 illustrates elec- trophoretic bands for a blank and six masses (l- 120ng) of DNA. Each frame represents the intensity
at a particular point in time during the decomposition
of the E&--DNA complex by DNase. The small rectangular boxes in the first frame illustrate the areas
scanned for each electrophoretic band and for the background near each band. The time-dependent
decrease in the intensity of each band was monitored
and used to compute initial and final intensities. Fig. 3 shows a typical set of background- and flat-
field-corrected response curves obtained from such
data. As expected, a first-order model [lo] fitted data for smaller amounts (1-4ng) of DNA quite well but did not fit data for larger amounts. On the other hand,
a Michaelis-Menten model [21] fit the data for all amounts of DNA quite well and this model was used
for the remainder of this study. Initial and final intensities were computed by fitting tne Michaelis- Menten model to data points in the range from 5 to
195 (34-1364s). Unless stated otherwise, all results reported in the remainder of this paper were obtained using background- and flat-field-corrected data.
Calibration plots. Calibration plots obtained with different gels were linear but had different slopes. To solve this problem, one of the samples in each data
set was used as an internal standard. Fig. 4 shows
some typical calibration plots in which the 15 ng
sample was used as the internal standard. As expected, calibration plots for the equilibrium and predictive-kinetic options are virtually superimposed
and are linear over the full range of DNA masses (l- 120ng) tested. However, the plot for the initial-rate
method curves toward the concentration axis above about 15 ng of DNA, reflecting saturation of the
enzyme at higher substrate concentrations. Least-squares results for these data are included in
Table 1. Least-squares results for the equilibrium and predictive-kinetic options are for the full range of
DNA masses; results for the initial-rate option are for
the range from 1 to 30ng. Intercepts and standard errors of the estimates (SEES) are divided by the slope to convert them to masses (ng) of DNA. The standard deviations of the slopes for the equilibrium and predictive-kinetic options are two- to three-fold smaller than that for the initial-rate option. On the

290 K.B. Lim, H.L. Pardue/Analytica Chimica Acta 329 (1996) 285-295
Fig. 2. Selected flat-field corrected image sequence. Numbers indicated in each frame are (frame number, time). Conditions: 6 s exposure, 1 s
delay. DNA bands (left to right): 0, 1,4, 15, 30, 60, 120 ng. Rectangular regions defining DNA band and background are illustrated in Frame 0.
other hand, the intercept and standard error for the initial-rate option are somewhat smaller than those
for the other options. However, it should be noted that the mass range included for the initial-rate option is only about 25% of that for the other two options.
Although there is little apparent difference be- tween results obtained with the equilibrium and predictive-kinetic methods, one point should be noted when comparing these results. Specifically, use of the enzyme to destroy the EtBr-DNA complex makes it possible to measure the flat-field signal in the area where each electrophoretic band appears and to use
this flat-field signal to correct the raw equilibrium signal. Without use of the enzyme, it would not be
possible to measure the flat field signal. Intercepts for equilibrium calibration plots without flat-field correc- tion were about two-fold larger than with flat-field correction. The reduced intercepts resulting from flat- field correction facilitate use of an internal standard to compensate for differences among gels.
Imprecision. Imprecision was evaluated from data for six runs at each of seven samples between 1 and 120 ng of DNA. Pooled standard deviations (PSDs) for data normalized to the responses corresponding to

K.B. Lim, H.L. Pardue/Analytica Chimica Acta 329 (1996) 285-295 291
I t I 1
Fig. 3. Background- and flat-field-corrected response curves.
Conditions: EtBr, 1 mg ml-‘; DNase, IOOKUml-‘; gel, 0.8%;
37°C. Amounts of DNA (bottom to top): 0, 1,4, 15,30,60, 120ng.
15 ng of DNA are summarized in the last column of
Table 1. These data correspond to pooled relative standard deviations of 16, 19 and 47% for the predictive-kinetic, equilibrium and initial-rate op-
tions, respectively, at 15 ng of DNA. Pooled relative standard deviations are of course smaller for larger
amounts of DNA (3-6% for the equilibrium and
predictive-kinetic options and lo-20% for the initial- rate option) and larger for smaller amounts of DNA.
Combining these PSDs with slopes of calibration
plots leads to detection limits (f3 SD) of 8, 9 and 23 ng for the predictive-kinetic, equilibrium and initial-rate options, respectively. Accordingly,
although the three data-processing options give linear
calibration plots down to significantly smaller amounts of DNA for a single gel, imprecision among
Table 1
Least-squares results for different data-processing methods”,b
0 30 60 90 120
DNA (ng)
Fig. 4. Calibration plots for different data-processing options for
the background- and flat-field-corrected results. Plotted data were
normalized against the internal standard. Predictive (e), equili-
brium (0). initial-rate (0). Conditions as in Fig. 3. For the rate
option, the dashed line represents a linear least-squares fit for the
first five sets of data points. Internal standard, 15 ng DNA.
different gels prevents reliable determinations at the
smaller amounts examined in this study. Improve- ments in the uniformity of gels or use of amplification
methods could extend the useful range to smaller amounts.
The same data were processed without flat-field correction. Imprecisions for the predictive-kinetic
and equilibrium options are two- to three-fold larger (PSD=0.39 and 0.49, respectively) without flat-field correction whereas the imprecision for the initial-rate
option is virtually independent of flat-field correction.
As noted above, conventional applications of the equilibrium method in which the fluorescent tag is
Options Slope (SD)=
lo-’ Units
Intercept/
Sloped (SD)
SEE/
Sloped
r Pooled
SD (ng)
Predictive 6.11 (0.06) 0.733 (0.518) 2.51 0.9982 2.4
Equilibrium 6.20 (0.07) 0.466 (0.605) 3.05 0.9973 2.4
Initial-rate 6.12 (0.19) 0.059 (0.459) 1.89 0.9873 7.0
aData normalized with 15 ng DNA.
bRange of regression: predictive kinetic and equilibrium, O-120 ng DNA; initial-rate, 0-30ng DNA.
‘Units: ngg’
dUnits: ng.
292 K.B. Lim, H.L. Pardue/Analytica Chimica Acta 329 (1996) 285-295
not destroyed cannot exploit flat-field correction as
applied in this study. Accordingly, the precision
obtained here with flat-field correction is two- to three-fold better than might be expected with
conventional methods.
3.2. Variable dependencies
A goal of this study was to evaluate the hypothesis that it should be possible to extend the high degrees of ruggedness observed for applications of the
predictive-kinetic option in homogeneous solution [ 171 to gel electrophoresis. The effects of ethidium
bromide concentration, DNase activity and gel
properties were evaluated and results are reported below.
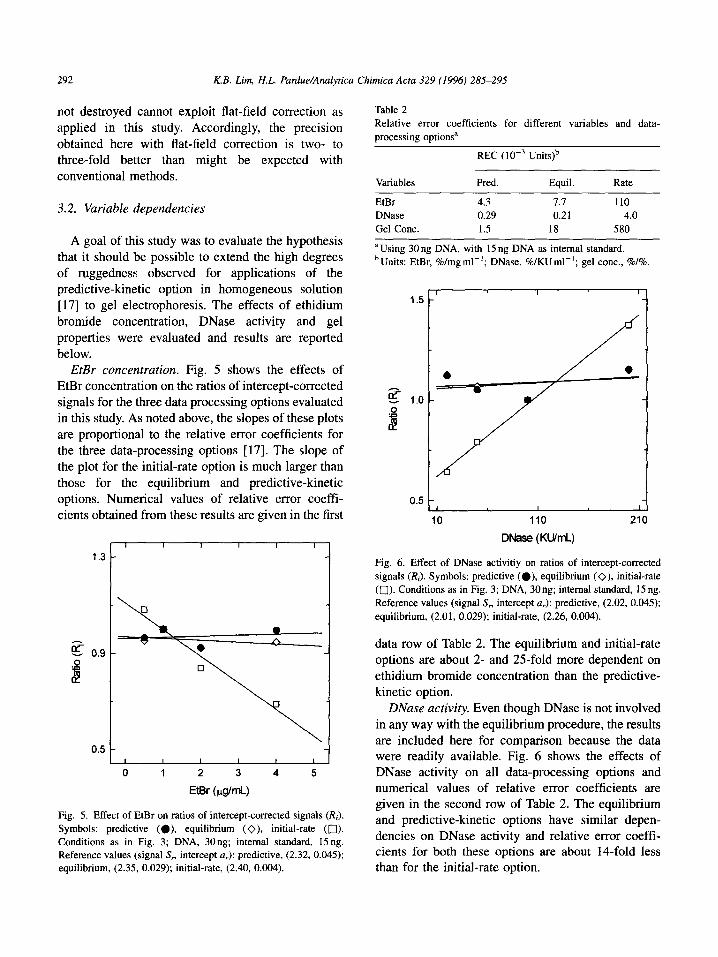
EtBr concentration. Fig. 5 shows the effects of
EtBr concentration on the ratios of intercept-corrected signals for the three data processing options evaluated
in this study. As noted above, the slopes of these plots are proportional to the relative error coefficients for
the three data-processing options [17]. The slope of the plot for the initial-rate option is much larger than
those for the equilibrium and predictive-kinetic
options. Numerical values of relative error coeffr- cients obtained from these results are given in the first
1.3
z 0.9
s d
0.5
I I 1 I I I
Fig. 5. Effect of EtBr on ratios of intercept-corrected signals (I&).
Symbols: predictive (a), equilibrium (O), initial-rate (0).
Conditions as in Fig. 3; DNA, 30ng; internal standard, 15ng. Reference values (signal S, intercept a,): predictive, (2.32, 0.045); equilibrium, (2.35, 0.029); initial-rate, (2.40, 0.004).
Table 2
Relative error coefficients for different variables and data-
processing optionsa
REC (10-s Units)b
Variables Pred. Equil. Rate
EtBr 4.3 7.7 110
DNase 0.29 0.21 4.0
Gel Cont. 1.5 18 580
a Using 30 ng DNA, with 15 ng DNA as internal standard.
b Units: EtBr, %/mg ml-‘; DNase, %/KUml-‘; gel cont., %I%.
I
10 110 210
DNase (KtJImL)
Fig. 6. Effect of DNase activitiy on ratios of intercept-corrected
signals (Ri). Symbols: predictive (O), equilibrium (O), initial-rate
(a). Conditions as in Fig. 3; DNA, 30ng; internal standard, 15 ng.
Reference values (signal S, intercept a,): predictive, (2.02, 0.045);
equilibrium, (2.01, 0.029); initial-rate, (2.26, 0.004).
data row of Table 2. The equilibrium and initial-rate
options are about 2- and 25-fold more dependent on ethidium bromide concentration than the predictive-
kinetic option. DNase activity. Even though DNase is not involved
in any way with the equilibrium procedure, the results
are included here for comparison because the data were readily available. Fig. 6 shows the effects of DNase activity on all data-processing options and numerical values of relative error coefficients are given in the second row of Table 2. The equilibrium and predictive-kinetic options have similar depen-
dencies on DNase activity and relative error coeff- cients for both these options are about 1Cfold less than for the initial-rate option.
K.B. Lim, H.L. Pardue/Analyrica Chimica Acra 329 (1996) 285-295
I I I I I
0.6 0.8 1 .o 1.2
Gel (%)
Fig. 7. Effects of gel concentration on ratios of intercept-corrected
signals (RJ. Symbols: predictive (0). equilibrium (O), initial-rate
(0). Conditions as in Fig. 3; DNA, 30 ng; internal standard, 15 ng.
Reference values (signal S, intercept a,): predictive, (2.32, 0.045);
equilibrium, (2.35, 0.029); initial-rate, (2.40, 0.004).
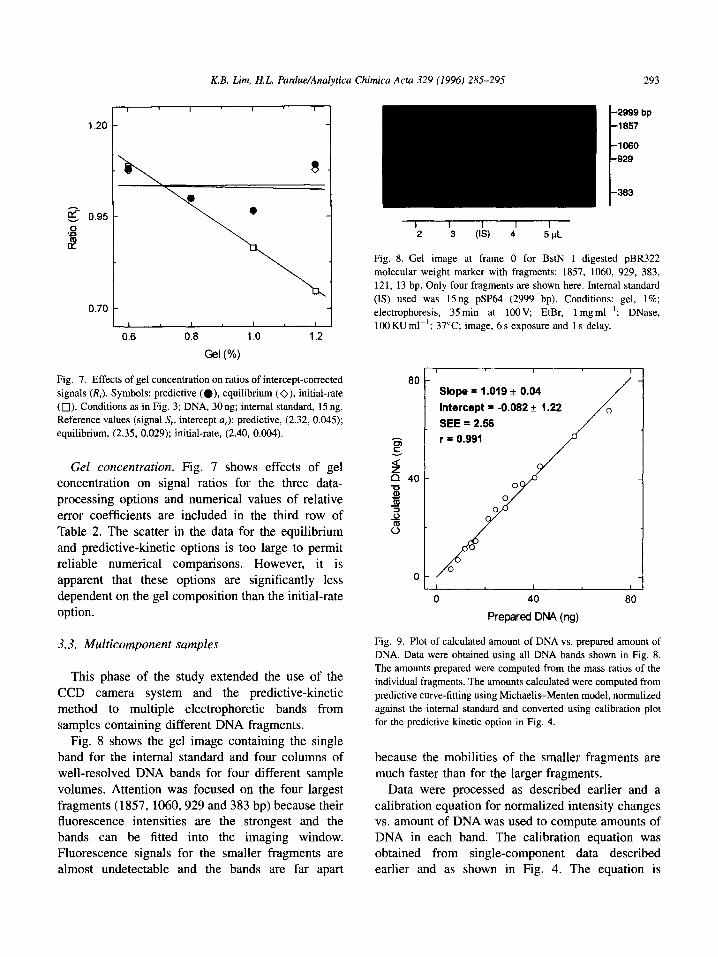
Gel concentration. Fig. 7 shows effects of gel concentration on signal ratios for the three data-
processing options and numerical values of relative
error coefficients are included in the third row of Table 2. The scatter in the data for the equilibrium
and predictive-kinetic options is too large to permit reliable numerical comparisons. However, it is
apparent that these options are significantly less dependent on the gel composition than the initial-rate option.
3.3. Multicomponent samples
This phase of the study extended the use of the
CCD camera system and the predictive-kinetic
method to multiple electrophoretic bands from samples containing different DNA fragments.
Fig. 8 shows the gel image containing the single band for the internal standard and four columns of well-resolved DNA bands for four different sample
volumes. Attention was focused on the four largest fragments (1857, 1060,929 and 383 bp) because their fluorescence intensities are the strongest and the
bands can be fitted into the imaging window. Fluorescence signals for the smaller fragments are almost undetectable and the bands are far apart
293
2999 bp 1857
1060 929
383
Fig. 8. Gel image at frame 0 for BstN I digested pBR322
molecular weight marker with fragments: 1857, 1060, 929, 383,
121, 13 bp. Only four fragments are shown here. Internal standard
(IS) used was 15ng pSP64 (2999 bp). Conditions: gel, 1%;
electrophoresis, 35min at 1oOV. EtBr, 1 mgml-‘; DNase,
100 KU ml-‘; 37°C; image, 6 s exposure and 1 s delay.
t_
Slope = 1.019 f 0.04
Intercept = -0.082 f 1.22 0
SEE = 2.56
r = 0.991
/
0
/
0
0
/ 0
I I 1
0 40 80
Prepared DNA (ng)
Fig. 9. Plot of calculated amount of DNA vs. prepared amount of
DNA. Data were obtained using all DNA bands shown in Fig. 8.
The amounts prepared were computed from the mass ratios of the
individual fragments. The amounts calculated were computed from
predictive curve-fitting using Michaelis-Menten model, normalized
against the internal standard and converted using calibration plot
for the predictive kinetic option in Fig. 4.
because the mobilities of the smaller fragments are
much faster than for the larger fragments.
Data were processed as described earlier and a calibration equation for normalized intensity changes vs. amount of DNA was used to compute amounts of DNA in each band. The calibration equation was obtained from single-component data described earlier and as shown in Fig. 4. The equation is
294 K.B. Lim, H.L. Pardue/Analytica Chimica Acta 329 (1996) 285-295
DSN=0.0611m+0.0448 in which DSN is the normal-
ized intensity change and m is the mass of DNA. Fig. 9 is a plot of computed amounts of DNA in the
16 bands vs. the added amounts. A least-squares fit of
a linear model to the data yielded:
m, = (1.02 f O.O4)m, - (0.08 f 1.2)ng with SEE
= 2.6 ng and r = 0.991
demonstrating good agreement between computed, m,, and added, m,, amounts of DNA. It is noted that
two of the bands processed here are not fully
resolved. Despite the observed overlap, it was possible to quantify the amounts of DNA correspond-
ing to these bands using procedures described above.
Significantly, larger degrees of overlap (decreased resolution) will of course create problems for
procedures used in this study. In such situations, it will be necessary to modify conditions to obtain
better electrophoretic resolution or perhaps to use higher spatial resolution and use transient data from more narrow portions of the bands, such as those near
the center of each peak.
4. Conclusions
This study has confirmed the feasibility of apply- ing the predictive-kinetic method to DNA determina- tions based on reactions on electrophoretic gels. The
predictive method combined with enzymatic degra- dation of the inclusion complex with ethidium
bromide offers several advantages. These include better background correction relative to equilibrium
methods and lower variable dependencies and wider linear ranges than initial-rate methods. Proper choice of the enzyme can, indeed, improve resolution of
DNA and RNA fragments. Although the coupled ethidium bromide/enzyme
degradation reaction method is important in its own
right, it was intended primarily as an example system to test the applicability of the predictive kinetic method to DNA determinations. The principles developed should be applicable to a wide variety of other reactions, including polymerase chain reaction (PCR) [22] or DNA probe hybridization techniques [23-271.
There are some operational problems associated with procedures used in this study. One of the more
serious is movement of the gel during the measure-
ment step. This is related solely to the design of the Plexiglas holder and it should be possible to reduce the problem with improved designs. Also, the electro-
phoretic studies with the imaging camera require a lot of computer capability, including storage space and
processing time. However, this problem is not serious for current technology nor is it unique to the current
approach. In summary, this study has shown that advantages
of the predictive kinetic method previously demon-
strated for the determination of DNA in solution and other more conventional types of reactions can be
extended relatively easily to DNA determinations in
electrophoretic gels.
Acknowledgements
This study was supported in part by Grant GM 13326-27 from the National Institutes of Health.
References
111 121 [31
141
[51
[61
171
181
[91
[lOI
u 11
[I21
u31
[141
u51
[I61
[I71 Cl81
F. Collins and D. Galas, Sceince, 262 (1993) 43.
S. Borman, Chem. Eng. News, Nov. 10, 1994, 21.
B.J. Conner, C.M. Reyes, C. Morin, K. Itakura, R.L. Teplitz
and R.B. Wallace, Proc. Natl. Acad. Sci. U.S.A., 80 (1983)
278.
J.R. Riorden, J.M. Rommens, B.-S. Kerem, N. Alon, R.
Rozmahel, Z. Grzelczak, J. Zielenski, S. Lok, N. Plavsic,
J.-L. Chou, M.L. Drumm, M.C. Iannuzzi, ES. Collins and
L.-C. Tsui, Science, 245 (1989) 1066.
M.E. MacDonald, et. al., Cell 72 (1993) 971.
J. Horgan, J. Sci. Am., Oct. 1994, 33.
P. Zurer, Chem. Eng. News, Oct. 10, 1994, 8.
H.A. Mottola and H.B. Mark, Anal. Chem., 58 (1986) 264R.
R.C. Harris and E. Hultman, Clin. Chem., 29 (1983) 2079-
2081.
G.E. Mieling and H.L. Pardue, Anal. Chem., 50 (1978) 1611.
P.D. Wentzell and S.R. Crouch, Anal. Chem., 58 (1986)
2855.
M.D. Love and H.L. Pardue, Anal. Chim. Acta, 299 (1994)
195.
J.A. Roussin, J. Li and H.L. Pardue, Anal. Chim. Acta, 303
(1995) 199.
C. Hsiech and H.L. Pardue, Anal. Chem., 65114 (1993) 1809.
J. Li and H.L. Pardue, Anal. Chem., 66 (1994) 3765.
C. Uhegbu and H.L. Pardue, Anal. Chem., 65 (1993) 2443.
K.B. Lim and H.L. Pardue, Clin. Chem., 39 (1993) 1850.
R.E. Fields, M.E. Baker, D.A. Radspinner, R.S. Pomeroy and
M.B. Denton, Spectroscopy, 7 (1992) 28.
K.B. Lim, H.L. Pardue/Analytica Chimica Acta 329 (1996) 285-295 295
[19] J. Sambrook, E.F. Fritsch and T. Maniatis, 2nd edn. Cold
Spring Harbor Laboratory Press, New York, 1989, Appendix
B, p. B.24.
[20] R.S. Hampton and S.C. Rutan, Anal. Chem., 65 (1993) 894.
(211 SD. Hamilton and H.L. Pardue, Clin. Chem., 28 (1982)
2359.
1221 N. Arnhelm and C.H. Levenson. Chem. Eng. News. Oct. I,
1990, 36.
[23] M. Wilchek and E.A. Bayer, Anal. Biochem.. 171 (1988) 1.
[24] L.E. Morrison, T.C. Halder and L.M. Stols, Anal. Biochem.,
183 (1989) 231.
[25] E.P. Diamandis and T.K. Christopoulos, Anal. Chem., 62
(1990) 1149A.
[26] D.J. Kemp, D.B. Smith, S.J. Foote, N. Samaras and M.G.
Peterson, Proc. Natl. Acad. Sci. U.S.A., 86 (1989) 2423.
[27] J.A. Matthews and L.J. Kricka, Anal. Biochem., 169 (1988)
I.