Highly Efficient Osmotic Energy Harvesting in Charged ...
10
www.afm-journal.de © 2021 Wiley-VCH GmbH 2009586 (1 of 10) FULL PAPER Highly Efficient Osmotic Energy Harvesting in Charged Boron-Nitride-Nanopore Membranes Aaditya Pendse, Semih Cetindag, Pavel Rehak, Sanjay Behura, Haiqi Gao, Ngoc Hoang Lan Nguyen, Tongshuai Wang, Vikas Berry, Petr Král, Jerry Shan,* and Sangil Kim* Recent studies of the high energy-conversion efficiency of the nanofluidic plat- form have revealed the enormous potential for efficient exploitation of electroki- netic phenomena in nanoporous membranes for clean-energy harvesting from salinity gradients. Here, nanofluidic reverse electrodialysis (NF-RED) consisting of vertically aligned boron-nitride-nanopore (VA-BNNP) membranes is pre- sented, which can efficiently harness osmotic power. The power density of the VA-BNNP reaches up to 105 W m −2 , which is several orders of magnitude higher than in other nanopores with similar pore sizes, leading to 165 mW m −2 of net power density (i.e., power per membrane area). Low-pressure chemical vapor deposition technology is employed to uniformly deposit a thin BN layer within 1D anodized alumina pores to prepare a macroscopic VA-BNNP membrane with a high nanopore density, ≈10 8 pores cm −2 . These membranes can resolve funda- mental questions regarding the ion mobility, liquid transport, and power genera- tion in highly charged nanopores. It is shown that the transference number in the VA-BNNP is almost constant over the entire salt concentration range, which is different from other nanopore systems. Moreover, it is also demonstrated that the BN deposition on the nanopore channels can significantly enhance the diffusio-osmosis velocity by two orders of magnitude at a high salinity gradient, resulting in a huge increase in power density. DOI: 10.1002/adfm.202009586 A. Pendse, Dr. S. Behura, N. H. L. Nguyen, Dr. T. Wang, Prof. V. Berry, Prof. S. Kim Department of Chemical Engineering University of Illinois at Chicago Chicago, IL 60607, USA E-mail: [email protected] S. Cetindag, Prof. J. Shan Department of Mechanical and Aerospace Engineering Rutgers University Piscataway, NJ 08854, USA E-mail: [email protected] Dr. P. Rehak, Dr. H. Gao, Prof. P. Král Department of Chemistry University of Illinois at Chicago Chicago, IL 60607, USA The ORCID identification number(s) for the author(s) of this article can be found under https://doi.org/10.1002/adfm.202009586. great interest due to their high power density and efficiencies in recovery of the Gibbs free energy from salinity gra- dients. [1] In the NF-RED systems, as the width of the nanochannels approaches the scale of the Debye length, the surface charge of the nanochannel wall influ- ences the flow of solvent/solute inside the channel, such that the ionic transport inside nanochannel is dominated by ions with opposite charges with respect to the channel walls. The difference between the counter- and co-ion fluxes results in a net charge migration which generates ionic current. Several simulation studies have proposed that the performance of the NF-RED devices is mainly impacted by the concentration gradient, [2] nanopore geometry, [3] and the ion selectivity of the nanochannel. [3] Among several nanoporous materials, 1D nanofluidic channels (e.g., SiO 2 , [4] polyimide, [5] alumina [6] ) have been widely used to fabricate the NF-RED devices to investigate the effects of ion transports on power generation efficiencies in nanofluidic systems due to their precisely controllable pore diameter with well-defined 1D nanostructures. A recent study on the electric current genera- tion induced in nanofluidic device comprising of single boron- nitride-nanotube (BNNT) has highlighted the great potential for the RED due to its enormous surface charge density, as high as 1 C m −2 . [3] This high surface charge on the BN surface is thus expected to cause a locally high salt ion concentration, which in turn generates an osmotic pressure gradient at the channel wall in the same direction as the salinity gradient. [7] The NF-RED device containing a single BNNT showed giant electrokinetic energy conversion, as high as 1.2 nA, which is two orders of magnitude greater than the pressure-driven streaming current in the same BNNT pore, 15 pA. [3] However, despite these merits, no such macroscopic vertically aligned boron-nitride-nanotube (VA-BNNT) membranes have ever been fabricated and fundamental ion transport properties through the charged nanopores of macroscopic membranes are still unknown. In particular, one should notice that total areal power density predicted from the single pore nanotube or the small testing area of the device does not accurately reflect the performance of macroscopic NF-RED system because the 1. Introduction Recently, the use of nanofluidic reverse electrodialysis (NF- RED) systems for efficient power generation has attained Adv. Funct. Mater. 2021, 2009586
Transcript of Highly Efficient Osmotic Energy Harvesting in Charged ...
www.afm-journal.de
© 2021 Wiley-VCH GmbH2009586 (1 of 10)
Full PaPer
Highly Efficient Osmotic Energy Harvesting in Charged Boron-Nitride-Nanopore Membranes
Aaditya Pendse, Semih Cetindag, Pavel Rehak, Sanjay Behura, Haiqi Gao, Ngoc Hoang Lan Nguyen, Tongshuai Wang, Vikas Berry, Petr Král, Jerry Shan,* and Sangil Kim*
Recent studies of the high energy-conversion efficiency of the nanofluidic plat-form have revealed the enormous potential for efficient exploitation of electroki-netic phenomena in nanoporous membranes for clean-energy harvesting from salinity gradients. Here, nanofluidic reverse electrodialysis (NF-RED) consisting of vertically aligned boron-nitride-nanopore (VA-BNNP) membranes is pre-sented, which can efficiently harness osmotic power. The power density of the VA-BNNP reaches up to 105 W m−2, which is several orders of magnitude higher than in other nanopores with similar pore sizes, leading to 165 mW m−2 of net power density (i.e., power per membrane area). Low-pressure chemical vapor deposition technology is employed to uniformly deposit a thin BN layer within 1D anodized alumina pores to prepare a macroscopic VA-BNNP membrane with a high nanopore density, ≈108 pores cm−2. These membranes can resolve funda-mental questions regarding the ion mobility, liquid transport, and power genera-tion in highly charged nanopores. It is shown that the transference number in the VA-BNNP is almost constant over the entire salt concentration range, which is different from other nanopore systems. Moreover, it is also demonstrated that the BN deposition on the nanopore channels can significantly enhance the diffusio-osmosis velocity by two orders of magnitude at a high salinity gradient, resulting in a huge increase in power density.
DOI: 10.1002/adfm.202009586
A. Pendse, Dr. S. Behura, N. H. L. Nguyen, Dr. T. Wang, Prof. V. Berry, Prof. S. KimDepartment of Chemical EngineeringUniversity of Illinois at ChicagoChicago, IL 60607, USAE-mail: [email protected]. Cetindag, Prof. J. ShanDepartment of Mechanical and Aerospace EngineeringRutgers UniversityPiscataway, NJ 08854, USAE-mail: [email protected]. P. Rehak, Dr. H. Gao, Prof. P. KrálDepartment of ChemistryUniversity of Illinois at ChicagoChicago, IL 60607, USA
The ORCID identification number(s) for the author(s) of this article can be found under https://doi.org/10.1002/adfm.202009586.
great interest due to their high power density and efficiencies in recovery of the Gibbs free energy from salinity gra-dients.[1] In the NF-RED systems, as the width of the nanochannels approaches the scale of the Debye length, the surface charge of the nanochannel wall influ-ences the flow of solvent/solute inside the channel, such that the ionic transport inside nanochannel is dominated by ions with opposite charges with respect to the channel walls. The difference between the counter- and co-ion fluxes results in a net charge migration which generates ionic current. Several simulation studies have proposed that the performance of the NF-RED devices is mainly impacted by the concentration gradient,[2] nanopore geometry,[3] and the ion selectivity of the nanochannel.[3]
Among several nanoporous materials, 1D nanofluidic channels (e.g., SiO2,[4] polyimide,[5] alumina[6]) have been widely used to fabricate the NF-RED devices to investigate the effects of ion transports
on power generation efficiencies in nanofluidic systems due to their precisely controllable pore diameter with well-defined 1D nanostructures. A recent study on the electric current genera-tion induced in nanofluidic device comprising of single boron-nitride-nanotube (BNNT) has highlighted the great potential for the RED due to its enormous surface charge density, as high as 1 C m−2.[3] This high surface charge on the BN surface is thus expected to cause a locally high salt ion concentration, which in turn generates an osmotic pressure gradient at the channel wall in the same direction as the salinity gradient.[7] The NF-RED device containing a single BNNT showed giant electrokinetic energy conversion, as high as 1.2 nA, which is two orders of magnitude greater than the pressure-driven streaming current in the same BNNT pore, 15 pA.[3] However, despite these merits, no such macroscopic vertically aligned boron-nitride-nanotube (VA-BNNT) membranes have ever been fabricated and fundamental ion transport properties through the charged nanopores of macroscopic membranes are still unknown. In particular, one should notice that total areal power density predicted from the single pore nanotube or the small testing area of the device does not accurately reflect the performance of macroscopic NF-RED system because the
1. Introduction
Recently, the use of nanofluidic reverse electrodialysis (NF-RED) systems for efficient power generation has attained
Adv. Funct. Mater. 2021, 2009586
www.afm-journal.dewww.advancedsciencenews.com
2009586 (2 of 10) © 2021 Wiley-VCH GmbH
areal power density does not scale linearly with the number of pores due to the interactions between neighboring pore access resistances and their influences on hydrodynamic flow.[8]
Here, we report a facile and robust method for the fabrica-tion of a macroscopic 1D boron-nitride-nanopore (VA-BNNP) membrane comprising of high-density vertically aligned pores with a density of 108 nanopores cm−2 and demonstrate its high-efficiency electrokinetic energy conversion. The VA-BNNP membranes were fabricated by tuning the deposition rate of a thin hexagonal boron nitride (h-BN) layer on a porous ano-dized alumina oxide (AAO) membrane template. We systemati-cally investigated the effect of the solution pH (surface-charge) on the osmotic current and the power density in the VA-BNNP membranes. Furthermore, we supplement our experimental results with analyses and molecular simulation studies to explain the fundamental ion transport mechanism in the BNNP which are responsible for the efficient energy conversion prop-erties of the BNNP. Single BNNP pore generated a maximum power density of ≈100 W m−1 with energy conversion efficiency of 12%, resulting in an areal power density of 165 mW m−2 from the NF-RED device with 108 nanopores cm−2. Our results demonstrate the great potential of the BN-based membrane for RED application, which could overcome the low power density limitation of RED systems based on ion-exchange membranes or the nanofluidic channel devices.[4b,9]
2. Results and Discussion
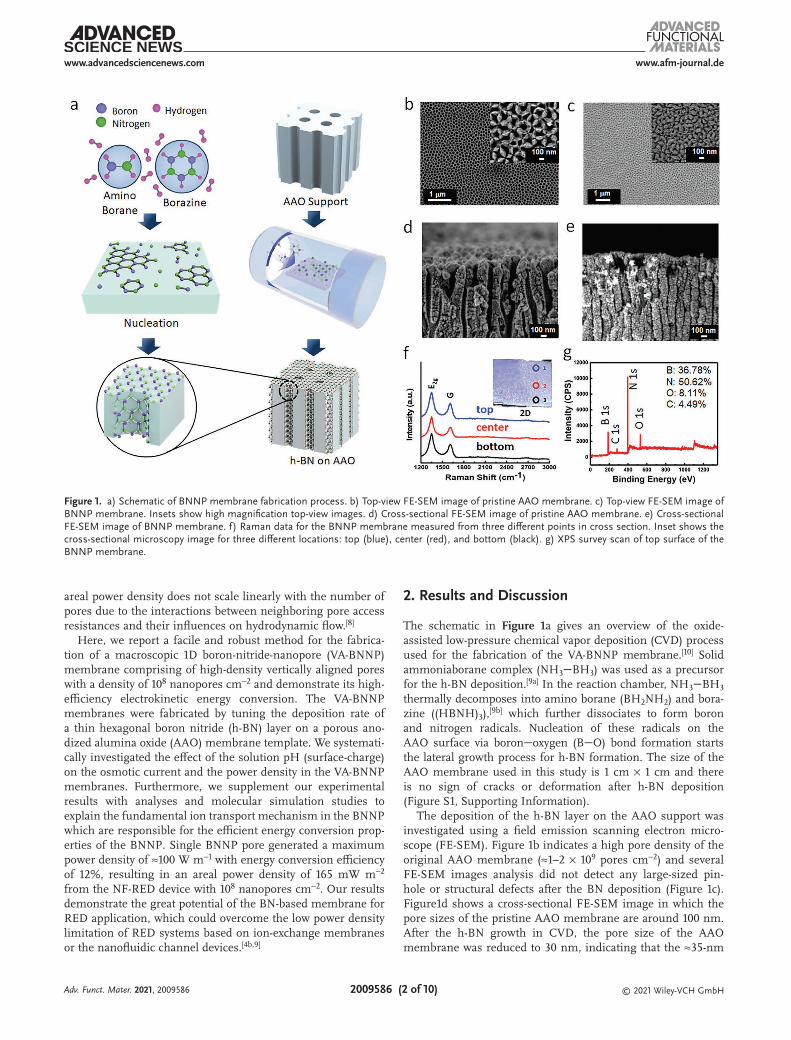
The schematic in Figure 1a gives an overview of the oxide-assisted low-pressure chemical vapor deposition (CVD) process used for the fabrication of the VA-BNNP membrane.[10] Solid ammoniaborane complex (NH3BH3) was used as a precursor for the h-BN deposition.[9a] In the reaction chamber, NH3BH3 thermally decomposes into amino borane (BH2NH2) and bora-zine ((HBNH)3),[9b] which further dissociates to form boron and nitrogen radicals. Nucleation of these radicals on the AAO surface via boronoxygen (BO) bond formation starts the lateral growth process for h-BN formation. The size of the AAO membrane used in this study is 1 cm × 1 cm and there is no sign of cracks or deformation after h-BN deposition (Figure S1, Supporting Information).
The deposition of the h-BN layer on the AAO support was investigated using a field emission scanning electron micro-scope (FE-SEM). Figure 1b indicates a high pore density of the original AAO membrane (≈1–2 × 10⁹ pores cm−2) and several FE-SEM images analysis did not detect any large-sized pin-hole or structural defects after the BN deposition (Figure 1c). Figure1d shows a cross-sectional FE-SEM image in which the pore sizes of the pristine AAO membrane are around 100 nm. After the h-BN growth in CVD, the pore size of the AAO membrane was reduced to 30 nm, indicating that the ≈35-nm
Figure 1. a) Schematic of BNNP membrane fabrication process. b) Top-view FE-SEM image of pristine AAO membrane. c) Top-view FE-SEM image of BNNP membrane. Insets show high magnification top-view images. d) Cross-sectional FE-SEM image of pristine AAO membrane. e) Cross-sectional FE-SEM image of BNNP membrane. f) Raman data for the BNNP membrane measured from three different points in cross section. Inset shows the cross-sectional microscopy image for three different locations: top (blue), center (red), and bottom (black). g) XPS survey scan of top surface of the BNNP membrane.
Adv. Funct. Mater. 2021, 2009586
www.afm-journal.dewww.advancedsciencenews.com
2009586 (3 of 10) © 2021 Wiley-VCH GmbH
thick h-BN film was uniformly deposited on the surface of the nanopores throughout the AAO membrane (Figure 1e and Figure S2, Supporting Information). In addition to the pore size analysis based on the FE-SEM, we confirmed the active pore size distribution of the BNNP membrane by measuring the rejection of neutral Au nanoparticles with different diam-eters ranging from 10 to 100 nm, which can provide a more accurate analysis of the active pore size of the membranes. The calculated pore size distribution curve (Figure S3 and Table S1, Supporting Information) predicted the average pore size of the membrane to be around 30 nm which is consistent with the SEM image analysis results. Besides, the total pore density values of the pristine AAO and the BNNP membrane were cal-culated to be 1.69 × 10⁹ and 2.47 × 10⁸ pores cm−2 respectively from KCl diffusion test (Figure S4 and Table S2, Supporting Information). This decrease in the pore density of the BNNP membrane is likely caused by blockage of some nanopores during the CVD process. In addition, the vertically aligned nanoporous structure is visible in the cross-section view of the BNNP membrane indicating uniform growth of the h-BN film throughout the inner pore-surface of the AAO support (Figure 1e).
In order to investigate the uniform quality of the h-BN layers, we measured Raman spectra for three different locations in the cross-section of the membrane. All three Raman spectra measured from the three different cross-sectional regions (marked with blue (top side), red (center), and black (bottom side)) show the almost identical intensity and peak position suggesting uniform deposition of the h-BN layer (Figure 1f). Subsequent peaks at ≈1366 cm−1 indicate E2g phonon vibra-tion in the h-BN layer.[9a] In addition to the E2g peak, a small G peak at ≈1620 cm–1 is also observed due to the presence of small quantities of carbon possibly from some carbon impu-rities in the AAO matrix. To further investigate the spatial coverage and consistency of the carbon on the BNNP-AAO membrane, Raman spatial scans were also acquired to map the E2g and the G phonons, which are attributed to BN and carbon, respectively (Figure S5, Supporting Information). A scan area of 50 µm × 50 µm showed 99.55% area with carbon’s G phonon, thus confirming carbon’s near-uniform coverage. Moreover, the small magnitude of the 2D phonon peak in the Raman spectra (Figure 1f) shows that most of the carbon is not in its crystalline graphenic (sp2 hybridized) form, which can be conjectured as carbon incorporated into the BN matrix or in its amorphous form. As shown in Figure 1g, the X-ray photoelec-tron spectroscopy (XPS) survey scan of the top surface of the BNNP indicates all the characteristic peaks of B 1s and N 1s at binding energy (BE) ≈190.53 and ≈191.59 eV, and ≈398.13 eV corresponding to the BN,[11] OBN,[12] and NB[11] bonding respectively, thus confirming the presence of a high purity h-BN layer on the AAO substrate (high-resolution XPS scan for B and N are shown in Figure S6a,b, Supporting Information). As also observed in the Raman spectra, the elemental stoichiometric analysis shows small amount of carbon content, ≈4%. We have not observed the presence of carbon in h-BN layer deposited on other oxide substrates (silicon oxide, alumina oxides). It is spec-ulated that some carbonaceous components in the AAO matrix migrate onto the AAO surface and mix with h-BN layer during the CVD process at high temperatures.
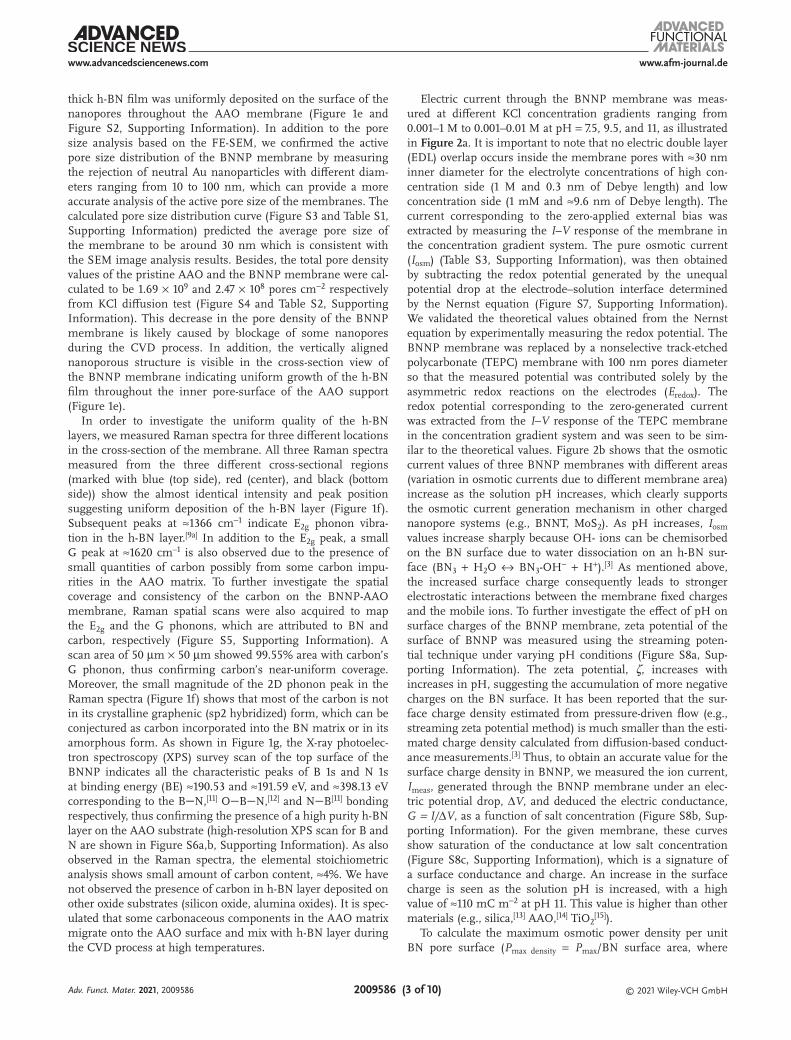
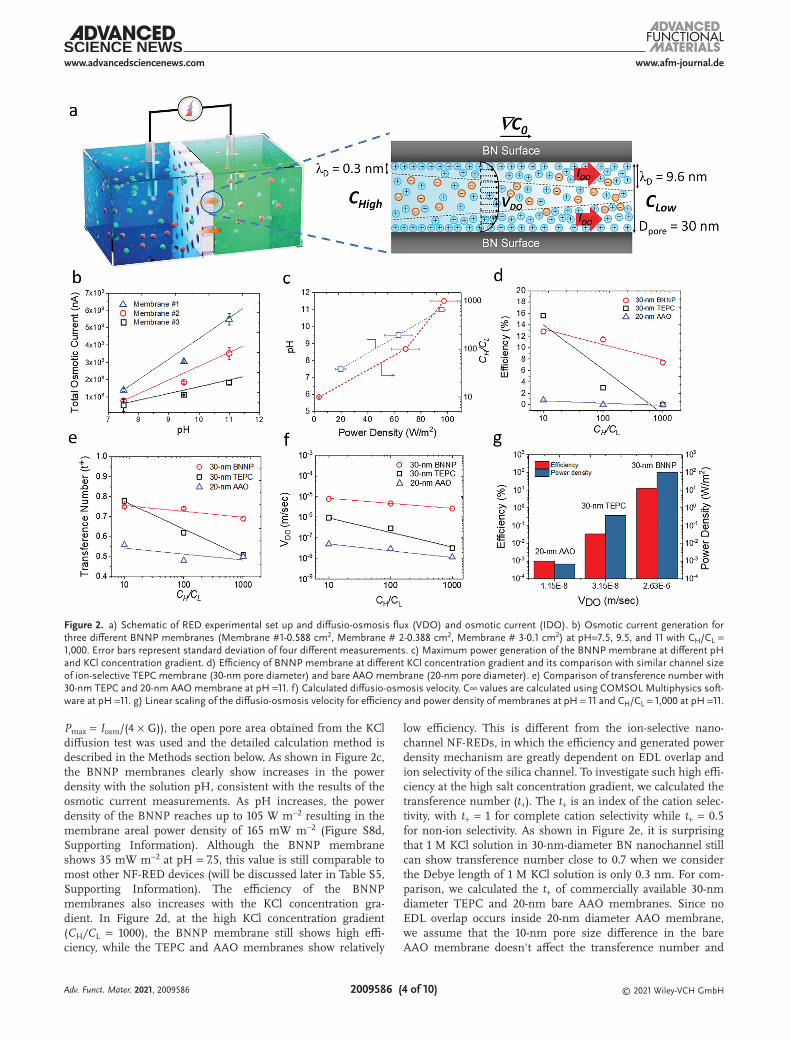
Electric current through the BNNP membrane was meas-ured at different KCl concentration gradients ranging from 0.001–1 M to 0.001–0.01 M at pH = 7.5, 9.5, and 11, as illustrated in Figure 2a. It is important to note that no electric double layer (EDL) overlap occurs inside the membrane pores with ≈30 nm inner diameter for the electrolyte concentrations of high con-centration side (1 M and 0.3 nm of Debye length) and low concentration side (1 mM and ≈9.6 nm of Debye length). The current corresponding to the zero-applied external bias was extracted by measuring the I–V response of the membrane in the concentration gradient system. The pure osmotic current (Iosm) (Table S3, Supporting Information), was then obtained by subtracting the redox potential generated by the unequal potential drop at the electrode–solution interface determined by the Nernst equation (Figure S7, Supporting Information). We validated the theoretical values obtained from the Nernst equation by experimentally measuring the redox potential. The BNNP membrane was replaced by a nonselective track-etched polycarbonate (TEPC) membrane with 100 nm pores diameter so that the measured potential was contributed solely by the asymmetric redox reactions on the electrodes (Eredox). The redox potential corresponding to the zero-generated current was extracted from the I–V response of the TEPC membrane in the concentration gradient system and was seen to be sim-ilar to the theoretical values. Figure 2b shows that the osmotic current values of three BNNP membranes with different areas (variation in osmotic currents due to different membrane area) increase as the solution pH increases, which clearly supports the osmotic current generation mechanism in other charged nanopore systems (e.g., BNNT, MoS2). As pH increases, Iosm values increase sharply because OH- ions can be chemisorbed on the BN surface due to water dissociation on an h-BN sur-face (BN3 + H2O ↔ BN3-OH− + H+).[3] As mentioned above, the increased surface charge consequently leads to stronger electrostatic interactions between the membrane fixed charges and the mobile ions. To further investigate the effect of pH on surface charges of the BNNP membrane, zeta potential of the surface of BNNP was measured using the streaming poten-tial technique under varying pH conditions (Figure S8a, Sup-porting Information). The zeta potential, ζ, increases with increases in pH, suggesting the accumulation of more negative charges on the BN surface. It has been reported that the sur-face charge density estimated from pressure-driven flow (e.g., streaming zeta potential method) is much smaller than the esti-mated charge density calculated from diffusion-based conduct-ance measurements.[3] Thus, to obtain an accurate value for the surface charge density in BNNP, we measured the ion current, Imeas, generated through the BNNP membrane under an elec-tric potential drop, ∆V, and deduced the electric conductance, G = I/∆V, as a function of salt concentration (Figure S8b, Sup-porting Information). For the given membrane, these curves show saturation of the conductance at low salt concentration (Figure S8c, Supporting Information), which is a signature of a surface conductance and charge. An increase in the surface charge is seen as the solution pH is increased, with a high value of ≈110 mC m−2 at pH 11. This value is higher than other materials (e.g., silica,[13] AAO,[14] TiO2
[15]).To calculate the maximum osmotic power density per unit
BN pore surface (Pmax density = Pmax/BN surface area, where
Adv. Funct. Mater. 2021, 2009586
www.afm-journal.dewww.advancedsciencenews.com
2009586 (4 of 10) © 2021 Wiley-VCH GmbH
Pmax = Iosm/(4 × G)), the open pore area obtained from the KCl diffusion test was used and the detailed calculation method is described in the Methods section below. As shown in Figure 2c, the BNNP membranes clearly show increases in the power density with the solution pH, consistent with the results of the osmotic current measurements. As pH increases, the power density of the BNNP reaches up to 105 W m−2 resulting in the membrane areal power density of 165 mW m−2 (Figure S8d, Supporting Information). Although the BNNP membrane shows 35 mW m−2 at pH = 7.5, this value is still comparable to most other NF-RED devices (will be discussed later in Table S5, Supporting Information). The efficiency of the BNNP membranes also increases with the KCl concentration gra-dient. In Figure 2d, at the high KCl concentration gradient (CH/CL = 1000), the BNNP membrane still shows high effi-ciency, while the TEPC and AAO membranes show relatively
low efficiency. This is different from the ion-selective nano-channel NF-REDs, in which the efficiency and generated power density mechanism are greatly dependent on EDL overlap and ion selectivity of the silica channel. To investigate such high effi-ciency at the high salt concentration gradient, we calculated the transference number (t+). The t+ is an index of the cation selec-tivity, with t+ = 1 for complete cation selectivity while t+ = 0.5 for non-ion selectivity. As shown in Figure 2e, it is surprising that 1 M KCl solution in 30-nm-diameter BN nanochannel still can show transference number close to 0.7 when we consider the Debye length of 1 M KCl solution is only 0.3 nm. For com-parison, we calculated the t+ of commercially available 30-nm diameter TEPC and 20-nm bare AAO membranes. Since no EDL overlap occurs inside 20-nm diameter AAO membrane, we assume that the 10-nm pore size difference in the bare AAO membrane doesn't affect the transference number and
Figure 2. a) Schematic of RED experimental set up and diffusio-osmosis flux (VDO) and osmotic current (IDO). b) Osmotic current generation for three different BNNP membranes (Membrane #1-0.588 cm2, Membrane # 2-0.388 cm2, Membrane # 3-0.1 cm2) at pH=7.5, 9.5, and 11 with CH/CL = 1,000. Error bars represent standard deviation of four different measurements. c) Maximum power generation of the BNNP membrane at different pH and KCl concentration gradient. d) Efficiency of BNNP membrane at different KCl concentration gradient and its comparison with similar channel size of ion-selective TEPC membrane (30-nm pore diameter) and bare AAO membrane (20-nm pore diameter). e) Comparison of transference number with 30-nm TEPC and 20-nm AAO membrane at pH =11. f) Calculated diffusio-osmosis velocity. C∞ values are calculated using COMSOL Multiphysics soft-ware at pH =11. g) Linear scaling of the diffusio-osmosis velocity for efficiency and power density of membranes at pH = 11 and CH/CL = 1,000 at pH =11.
Adv. Funct. Mater. 2021, 2009586
www.afm-journal.dewww.advancedsciencenews.com
2009586 (5 of 10) © 2021 Wiley-VCH GmbH
diffusio-osmosis velocity (VDO) values of the membrane. The transference numbers of two reference membranes approach 0.5 at high concentration gradient (CH/CL = 1000), as observed in 26-nm silica nanochannel[4b] and 50-nm AAO membrane.[6] The TEPC membrane shows higher t+ at low salt concentration due to its relatively higher surface charge density compared to bare AAO at 10 mM (ζ = −3.2 mV versus −1.7 mV at pH = 11), however, it decreases rapidly as salt concentration increases because the ion selectivity caused by the influence of surface charge and salt concentration decrease with an increase in the salt concentration, t+ ∝ |4σ/(zFd(⟨C+⟩ + ⟨C−⟩)|.[4b] Here, σ is sur-face charge density, z is ion valance, F is Faraday’s constant, and d is channel diameter. Thus, our results strongly indi-cate that the power generation mechanism in the BN-based nanochannel follows different mechanisms from the Donnan-exclusion-based ion selectivity mechanism in the typical RED nanochannel. Siria et al. suggested that high osmotic current could be resulted from the diffusio-osmosis by an osmotic pres-sure gradient within the diffuse layer at the BN interface and solution.[3] In the BN nanopore configuration, the salt concen-tration difference gives rise to an osmotic pressure gradient within the diffuse layer at the interfaces which induces the dif-fusio-osmotic flow inside the BN nanopores. The velocity of the diffusion-osmotic flow comes from a balance between viscous flow and the osmotic pressure gradient within the Debye layer. This diffusio-osmotic transport can drag the cationic charges inside the double layer resulting in charge separation and the generation of osmotic current in the system as illustrated in Figure 2a. The increase in the power with the solution pH can be attributed to the higher local ion concentration gradient resulting from the increased surface charge.
The diffusio-osmotic velocity (VDO) can be related to the dif-ference between the osmotic permeance and electro-osmotic
response of the surface, 4
[ 2 ln(1 )]ln2ε
πηβζ γ= − − − ∞V
kT
Ze
kT
Ze
d C
dxDO .[16]
Here, ε is the permittivity, η is the viscosity, ζ is surface zeta potential, T is solution temperature, e is the electron charge, k is the Boltzmann constant, β = (D+ − D–)/(D+ + D–) denotes the
difference between cation and anion diffusivities, tanh4
γ ζ=
Ze
kT,
ln ∞d C
dx is the concentration gradient along the tube channel,
and C∞ is bulk salt concentration inside the channel far away from the channel surface. We estimated C∞ values by using COMSOL modeling. Figure 2f quantifies diffusio-osmosis velocity in the BNNP at different salt concentrations. The TEPC and AAO membrane show the minor contribution of VDO values to transference number and these values decrease rap-idly with an increase in salt concentration. On the other hand, surprisingly, the VDO in the BNNP is nearly constant over the entire salt concentration range and its value at CH/CL = 1000 is two orders magnitude higher than that of the AAO and TEPC membranes. This phenomenon is very different from ion transport in functionalized carbon nanotube membranes, in which enhanced ion transport only occurs at low salt con-centration.[17] In addition, in our BNNP membranes, the con-tribution of the diffusio-osmosis monotonically increases the efficiency and power density of the NF-RED system. As shown in Figure 2g, the deposition of the BN layer on the AAO surface increases the efficiency and the power density by four orders
of magnitude and five orders of magnitude, respectively, as the VDO increases by two orders of magnitude from the bare AAO membrane.
We further investigated the ion-selective performance of BNNP membranes using 10 mM anion (2,6-Naphthalene disul-fonic acid; NDS) and 10 mM cation (Ruthenium bipyridine; RB) with similar bulk diffusivity and ion valance (Table S4, Supporting Information) under pressure and diffusion condi-tions. In pressure-driven permeation tests, the BNNP mem-brane shows same mole flux (≈4.3 × 10³ liter m−2 ·hr) for the NDS and RB as there is no double layer overlap (1.8 nm of Debye length) in the 30-nm pores and ion fluxes through bulk flow region are large (Figure S9, Supporting Information). In the diffusion test condition, the BNNP membrane shows the higher diffusional flux of the RB (4.41 mol m−2·sec) than the NDS (0.88 mol m−2·sec). This confirms that the BNNP mem-brane can selectively transport cation over anion even with a large portion of the bulk flow region in the pore and thus, sur-face phenomenon plays an important role in its high efficiency.
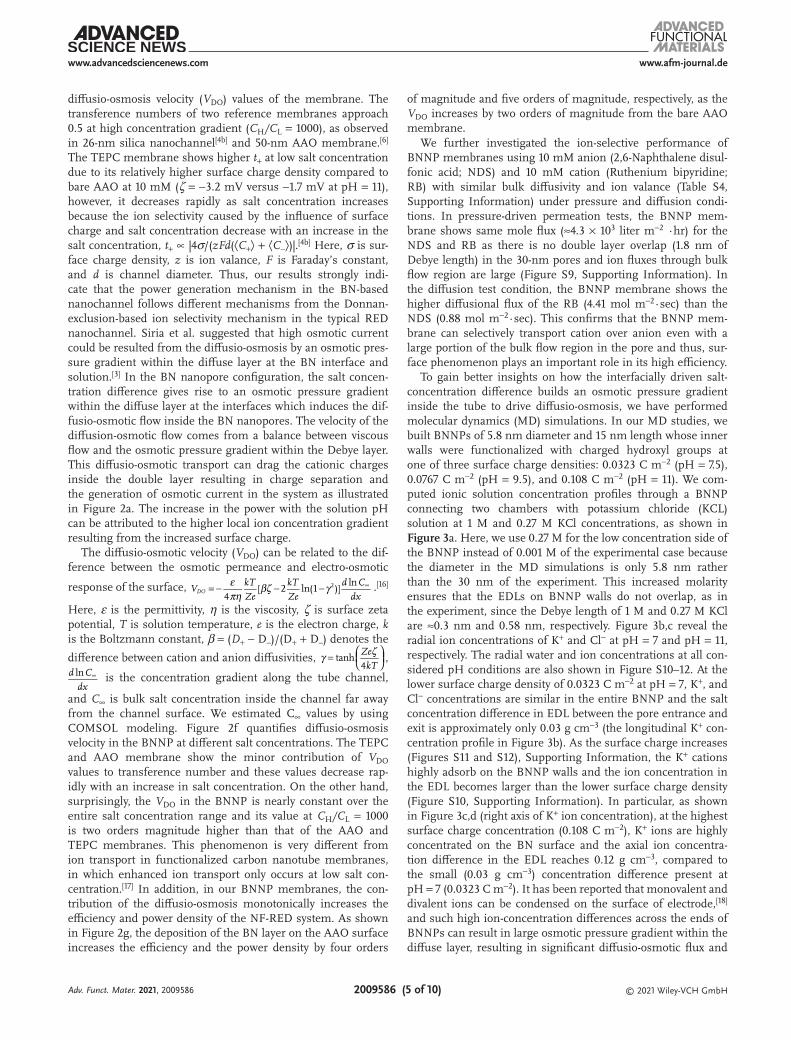
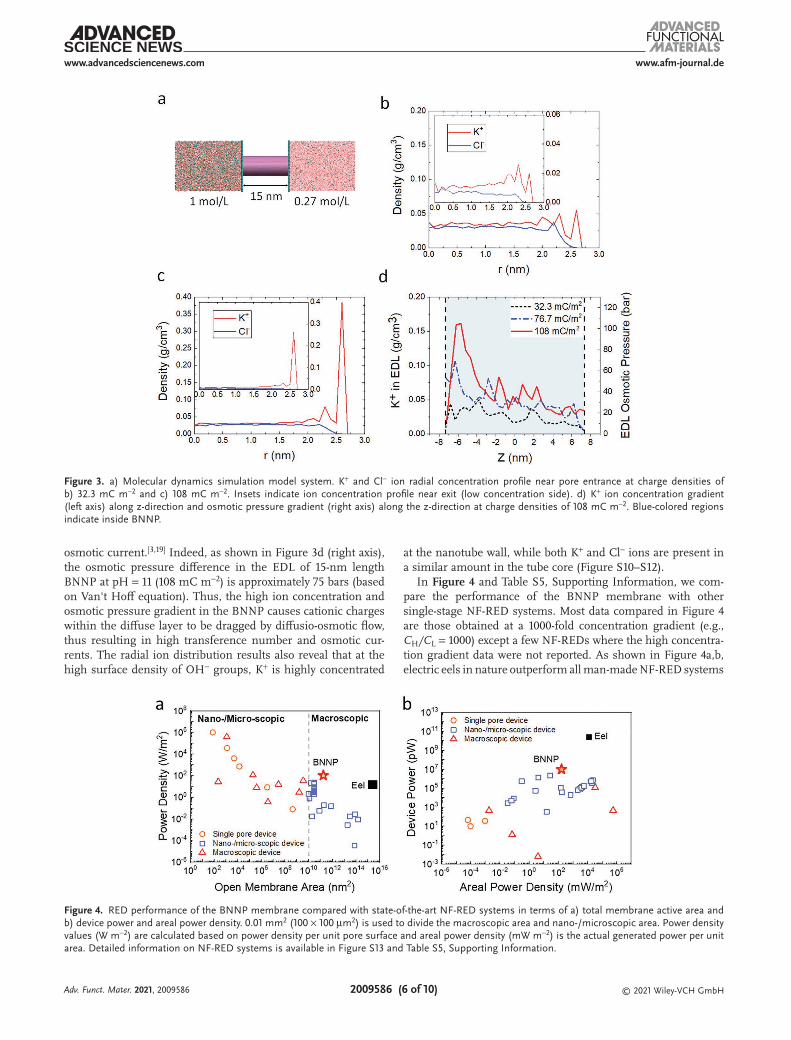
To gain better insights on how the interfacially driven salt-concentration difference builds an osmotic pressure gradient inside the tube to drive diffusio-osmosis, we have performed molecular dynamics (MD) simulations. In our MD studies, we built BNNPs of 5.8 nm diameter and 15 nm length whose inner walls were functionalized with charged hydroxyl groups at one of three surface charge densities: 0.0323 C m−2 (pH = 7.5), 0.0767 C m−2 (pH = 9.5), and 0.108 C m−2 (pH = 11). We com-puted ionic solution concentration profiles through a BNNP connecting two chambers with potassium chloride (KCL) solution at 1 M and 0.27 M KCl concentrations, as shown in Figure 3a. Here, we use 0.27 M for the low concentration side of the BNNP instead of 0.001 M of the experimental case because the diameter in the MD simulations is only 5.8 nm rather than the 30 nm of the experiment. This increased molarity ensures that the EDLs on BNNP walls do not overlap, as in the experiment, since the Debye length of 1 M and 0.27 M KCl are ≈0.3 nm and 0.58 nm, respectively. Figure 3b,c reveal the radial ion concentrations of K+ and Cl− at pH = 7 and pH = 11, respectively. The radial water and ion concentrations at all con-sidered pH conditions are also shown in Figure S10–12. At the lower surface charge density of 0.0323 C m−2 at pH = 7, K+, and Cl− concentrations are similar in the entire BNNP and the salt concentration difference in EDL between the pore entrance and exit is approximately only 0.03 g cm−3 (the longitudinal K+ con-centration profile in Figure 3b). As the surface charge increases (Figures S11 and S12), Supporting Information, the K+ cations highly adsorb on the BNNP walls and the ion concentration in the EDL becomes larger than the lower surface charge density (Figure S10, Supporting Information). In particular, as shown in Figure 3c,d (right axis of K+ ion concentration), at the highest surface charge concentration (0.108 C m−2), K+ ions are highly concentrated on the BN surface and the axial ion concentra-tion difference in the EDL reaches 0.12 g cm−3, compared to the small (0.03 g cm−3) concentration difference present at pH = 7 (0.0323 C m−2). It has been reported that monovalent and divalent ions can be condensed on the surface of electrode,[18] and such high ion-concentration differences across the ends of BNNPs can result in large osmotic pressure gradient within the diffuse layer, resulting in significant diffusio-osmotic flux and
Adv. Funct. Mater. 2021, 2009586
www.afm-journal.dewww.advancedsciencenews.com
2009586 (6 of 10) © 2021 Wiley-VCH GmbH
osmotic current.[3,19] Indeed, as shown in Figure 3d (right axis), the osmotic pressure difference in the EDL of 15-nm length BNNP at pH = 11 (108 mC m−2) is approximately 75 bars (based on Van't Hoff equation). Thus, the high ion concentration and osmotic pressure gradient in the BNNP causes cationic charges within the diffuse layer to be dragged by diffusio-osmotic flow, thus resulting in high transference number and osmotic cur-rents. The radial ion distribution results also reveal that at the high surface density of OH− groups, K+ is highly concentrated
at the nanotube wall, while both K+ and Cl− ions are present in a similar amount in the tube core (Figure S10–S12).
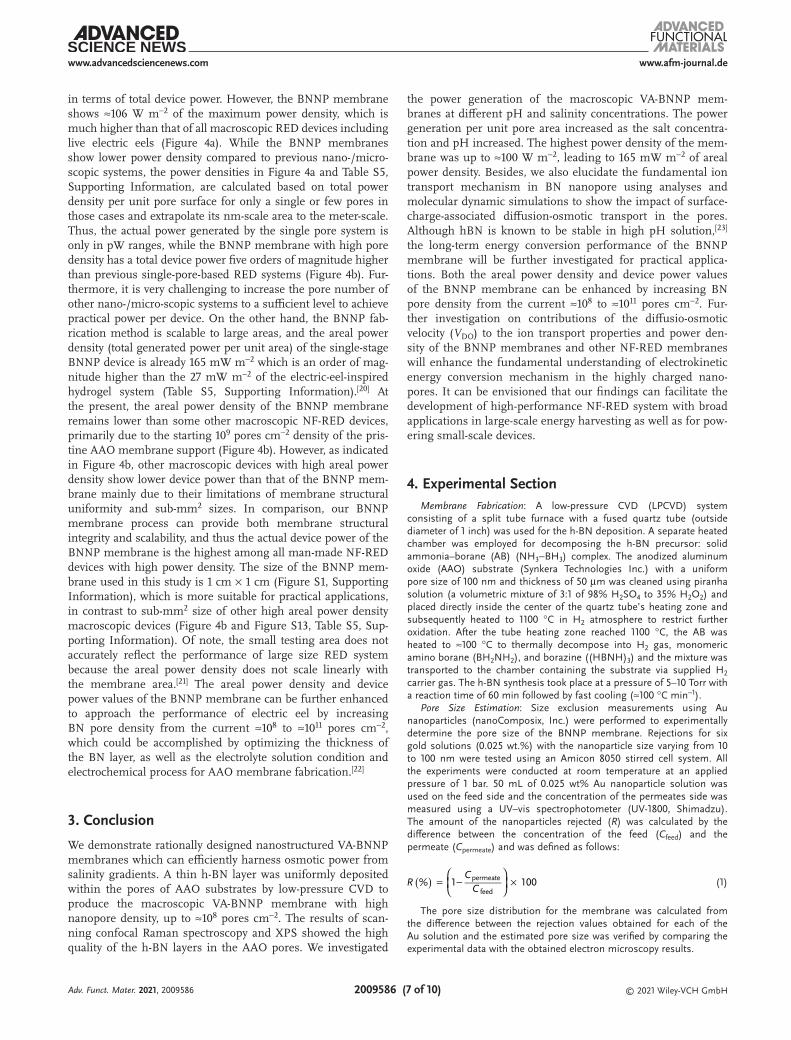
In Figure 4 and Table S5, Supporting Information, we com-pare the performance of the BNNP membrane with other single-stage NF-RED systems. Most data compared in Figure 4 are those obtained at a 1000-fold concentration gradient (e.g., CH/CL = 1000) except a few NF-REDs where the high concentra-tion gradient data were not reported. As shown in Figure 4a,b, electric eels in nature outperform all man-made NF-RED systems
Figure 4. RED performance of the BNNP membrane compared with state-of-the-art NF-RED systems in terms of a) total membrane active area and b) device power and areal power density. 0.01 mm2 (100 × 100 µm2) is used to divide the macroscopic area and nano-/microscopic area. Power density values (W m−2) are calculated based on power density per unit pore surface and areal power density (mW m−2) is the actual generated power per unit area. Detailed information on NF-RED systems is available in Figure S13 and Table S5, Supporting Information.
Figure 3. a) Molecular dynamics simulation model system. K+ and Cl− ion radial concentration profile near pore entrance at charge densities of b) 32.3 mC m−2 and c) 108 mC m−2. Insets indicate ion concentration profile near exit (low concentration side). d) K+ ion concentration gradient (left axis) along z-direction and osmotic pressure gradient (right axis) along the z-direction at charge densities of 108 mC m−2. Blue-colored regions indicate inside BNNP.
Adv. Funct. Mater. 2021, 2009586
www.afm-journal.dewww.advancedsciencenews.com
2009586 (7 of 10) © 2021 Wiley-VCH GmbH
in terms of total device power. However, the BNNP membrane shows ≈106 W m−2 of the maximum power density, which is much higher than that of all macroscopic RED devices including live electric eels (Figure 4a). While the BNNP membranes show lower power density compared to previous nano-/micro-scopic systems, the power densities in Figure 4a and Table S5, Supporting Information, are calculated based on total power density per unit pore surface for only a single or few pores in those cases and extrapolate its nm-scale area to the meter-scale. Thus, the actual power generated by the single pore system is only in pW ranges, while the BNNP membrane with high pore density has a total device power five orders of magnitude higher than previous single-pore-based RED systems (Figure 4b). Fur-thermore, it is very challenging to increase the pore number of other nano-/micro-scopic systems to a sufficient level to achieve practical power per device. On the other hand, the BNNP fab-rication method is scalable to large areas, and the areal power density (total generated power per unit area) of the single-stage BNNP device is already 165 mW m−2 which is an order of mag-nitude higher than the 27 mW m−2 of the electric-eel-inspired hydrogel system (Table S5, Supporting Information).[20] At the present, the areal power density of the BNNP membrane remains lower than some other macroscopic NF-RED devices, primarily due to the starting 109 pores cm−2 density of the pris-tine AAO membrane support (Figure 4b). However, as indicated in Figure 4b, other macroscopic devices with high areal power density show lower device power than that of the BNNP mem-brane mainly due to their limitations of membrane structural uniformity and sub-mm2 sizes. In comparison, our BNNP membrane process can provide both membrane structural integrity and scalability, and thus the actual device power of the BNNP membrane is the highest among all man-made NF-RED devices with high power density. The size of the BNNP mem-brane used in this study is 1 cm × 1 cm (Figure S1, Supporting Information), which is more suitable for practical applications, in contrast to sub-mm2 size of other high areal power density macroscopic devices (Figure 4b and Figure S13, Table S5, Sup-porting Information). Of note, the small testing area does not accurately reflect the performance of large size RED system because the areal power density does not scale linearly with the membrane area.[21] The areal power density and device power values of the BNNP membrane can be further enhanced to approach the performance of electric eel by increasing BN pore density from the current ≈108 to ≈1011 pores cm−2, which could be accomplished by optimizing the thickness of the BN layer, as well as the electrolyte solution condition and electrochemical process for AAO membrane fabrication.[22]
3. Conclusion
We demonstrate rationally designed nanostructured VA-BNNP membranes which can efficiently harness osmotic power from salinity gradients. A thin h-BN layer was uniformly deposited within the pores of AAO substrates by low-pressure CVD to produce the macroscopic VA-BNNP membrane with high nanopore density, up to ≈108 pores cm−2. The results of scan-ning confocal Raman spectroscopy and XPS showed the high quality of the h-BN layers in the AAO pores. We investigated
the power generation of the macroscopic VA-BNNP mem-branes at different pH and salinity concentrations. The power generation per unit pore area increased as the salt concentra-tion and pH increased. The highest power density of the mem-brane was up to ≈100 W m−2, leading to 165 mW m−2 of areal power density. Besides, we also elucidate the fundamental ion transport mechanism in BN nanopore using analyses and molecular dynamic simulations to show the impact of surface-charge-associated diffusion-osmotic transport in the pores. Although hBN is known to be stable in high pH solution,[23] the long-term energy conversion performance of the BNNP membrane will be further investigated for practical applica-tions. Both the areal power density and device power values of the BNNP membrane can be enhanced by increasing BN pore density from the current ≈108 to ≈1011 pores cm−2. Fur-ther investigation on contributions of the diffusio-osmotic velocity (VDO) to the ion transport properties and power den-sity of the BNNP membranes and other NF-RED membranes will enhance the fundamental understanding of electrokinetic energy conversion mechanism in the highly charged nano-pores. It can be envisioned that our findings can facilitate the development of high-performance NF-RED system with broad applications in large-scale energy harvesting as well as for pow-ering small-scale devices.
4. Experimental SectionMembrane Fabrication: A low-pressure CVD (LPCVD) system
consisting of a split tube furnace with a fused quartz tube (outside diameter of 1 inch) was used for the h-BN deposition. A separate heated chamber was employed for decomposing the h-BN precursor: solid ammonia–borane (AB) (NH3−BH3) complex. The anodized aluminum oxide (AAO) substrate (Synkera Technologies Inc.) with a uniform pore size of 100 nm and thickness of 50 µm was cleaned using piranha solution (a volumetric mixture of 3:1 of 98% H2SO4 to 35% H2O2) and placed directly inside the center of the quartz tube’s heating zone and subsequently heated to 1100 °C in H2 atmosphere to restrict further oxidation. After the tube heating zone reached 1100 °C, the AB was heated to ≈100 °C to thermally decompose into H2 gas, monomeric amino borane (BH2NH2), and borazine ((HBNH)3) and the mixture was transported to the chamber containing the substrate via supplied H2 carrier gas. The h-BN synthesis took place at a pressure of 5–10 Torr with a reaction time of 60 min followed by fast cooling (≈100 °C min−1).
Pore Size Estimation: Size exclusion measurements using Au nanoparticles (nanoComposix, Inc.) were performed to experimentally determine the pore size of the BNNP membrane. Rejections for six gold solutions (0.025 wt.%) with the nanoparticle size varying from 10 to 100 nm were tested using an Amicon 8050 stirred cell system. All the experiments were conducted at room temperature at an applied pressure of 1 bar. 50 mL of 0.025 wt% Au nanoparticle solution was used on the feed side and the concentration of the permeates side was measured using a UV–vis spectrophotometer (UV-1800, Shimadzu). The amount of the nanoparticles rejected (R) was calculated by the difference between the concentration of the feed (Cfeed) and the permeate (Cpermeate) and was defined as follows:
RC
C( ) = −
×% 1 100permeate
feed (1)
The pore size distribution for the membrane was calculated from the difference between the rejection values obtained for each of the Au solution and the estimated pore size was verified by comparing the experimental data with the obtained electron microscopy results.
Adv. Funct. Mater. 2021, 2009586
www.afm-journal.dewww.advancedsciencenews.com
2009586 (8 of 10) © 2021 Wiley-VCH GmbH
Pore Density Estimation: The pore density of the BNNP membrane was calculated using a KCl diffusion test. Initially, 10 mL of 0.01 M potassium chloride (KCl) solution (Sigma-Aldrich) was used as a feed with Barnstead NANOpure deionized (DI) water (18.2 MΩ cm) on the permeate side. Both the feed and the permeate solutions were placed in a PermeGear side-bi-side diffusion cell (Figure S4a, Supporting Information) and stirred continuously to enable efficient mixing. The conductivity of the permeate solution was monitored by a conductivity electrode (Orion O13016MD), connected to a Thermo Scientific Orion Star A212 conductivity meter, and the data was collected at regular time intervals. At such low feed concentrations, however, ion permeation through the charged BNNP membrane could be obstructed due to the concentration polarization effects near the membrane surface which would introduce an error in the pore density estimation. Thus, the diffusion of the KCl solution with higher molarity (0.5 M) was tested occasionally in between experiments to ensure that the porosity of the BNNP membrane was maintained. The ionic flux was calculated from the measured conductivity using an appropriate calibration curve of the KCl concentration versus conductivity (Figure S4b, Supporting Information). The permeable pore area (Ap) was estimated from the following equation:
AJ l
D C( ) = ××Permeable pore area p (2)
where D is the bulk diffusivity of KCl at 21 °C (≈1.7 × 10⁻⁵ cm2 s−1), C is the concentration of the feed (0.5 M), l is the membrane thickness (50 µm), and J is the experimental steady-state flux of KCl (mol s−1). The total number of pores (εp) on the membrane surface and the permeable pore density can be calculated from the following equations:
AA
Totalnumber of pores( )pp
mε = (3)
dPermeable pore density (pores cm )
4
2 p
2
ε
π− =
(4)
where d is the pore diameter (30 nm) and Am is the membrane area exposed in the diffusion experiment. Similar to the pore size, the experimental pore density values obtained using the KCl diffusion test were also verified using the results from the SEM image analysis. The pore density of the pristine AAO support was calculated using the same technique as mentioned above and the obtained data was compared with the BNNP membrane to determine the reduction in the number of open pores after the deposition of the h-BN on the AAO support.
Ion Exclusion Measurement: To understand the separation properties of the charged h-BN nanopores, rejection of anionic 2,6-Naphthalene disulfonic acid (10 mM) (Sigma Aldrich) and cationic Tris(bipyridine)ruthenium(II) chloride (10 mM) (Sigma Aldrich) dyes through the BNNP membrane was investigated using a standard diffusion test (Table S4, Supporting Information). A PermeGear side-bi-side glass diffusion cell setup (Figure S4a, Supporting Information) was employed for the measurement. The feed side was filled with 10 mL of test solution adjusted to a pH 10 with DI water on the permeate side and the experiment was allowed to run for 24 h. The concentration of the NDS and the RB dyes diffusing through the membrane was analyzed by measuring the absorbance of the permeate solution using UV–vis spectroscopy (UV-1800, Shimadzu) and the dye rejection was calculated using Equation (1).
Osmotic Current and Power Density Measurement: Nanofluidic transport experiments were conducted as follows. Simply, fabricated membranes were mounted and clamped between two reservoirs with a Chemical-Resistant Viton O-Rings and tested in a custom-made two-reservoir electrochemical cell. Chlorinated Ag/AgCl electrodes were used in both reservoirs to apply trans-membrane potential and measure the currents. I–V curves of membranes were recorded at various pH conditions and electrolyte concentrations using a Gamry Reference 600+ with pA resolution enclosed in a Faraday cage.
Before each measurement, membranes to be tested were flushed with EtOH: H2O (1:1 volume) solutions by applying pressure of 15 kPa for 3 h and flushed again with DI water for another 3 h to ensure the wetting of nanopores were established. In addition to wetting of the membrane, this flushing process also helped to unclog the pores after extensive experiments. The cleaning process was repeated when it’s necessary. After the cleaning, approximately 30 min stabilization time was allowed for the membranes in test solution when the solutions with different conductivity or pH were exchanged.
To measure the osmotic current across the membrane resulting from the salinity gradient, the procedure used by Siria et al. was followed.[3] Briefly, KCl was used as a probe electrolyte to primarily investigate the effect of surface charge density of the BNNP on the power generation mechanism because the K+ (≈1.96 × 10⁻⁹ m2 s−1) and the Cl− (≈2.03 × 10⁻⁹ m2 s−1) ions have similar diffusion coefficients, which minimized any possible the electric field that may arise from a difference in the cation and anion mobilities.[24] pH of the solutions was changed by adding KOH solutions. For example, 0.13 mM KOH ions added to adjust pH = 11, which was significantly lower as compared to the bulk solution concentration. For each measurement, the applied voltage was varied between −0.4 V to +0.4 V and −0.3 V to +0.3 V and the corresponding current was recorded to obtain an I–V curve. This was then used to calculate the conductance (Gion) through the membrane using the linear fit between −0.2 V to +0.2 V,
GCurrent A
Potential(V)ion( )= (5)
In order to extract the current of interest (Imeas), the value at Vapplied = 0 was used.
I G Eredox ion redox= × (6)
I I V I( 0)osm meas applied redox= = − (7)
The osmotic power values resulting from the transport through the membrane were theoretically calculated from the obtained osmotic current and conductance values.
P IG4max
osm2
ion= ×
(8)
Since the ion transport occurs only through the open pores, the osmotic power values were normalized using the total permeable pore area.
P PN ( r )maxdensity
max2π
=×
(9)
where “Pmax” is the calculated osmotic power, “N” is the total number of pores, and “r” is the nanopore radius.
Surface Charge Density Measurement: A semiquantitative analysis of concentration and conductivity was used to estimate the surface charge density of the BNNP.[25] The ion current, I, generated through the BNNP membrane was measured under an electric potential drop, ∆V. Conductance measurements result from linear fit of the current versus voltage between −0.3 V and 0.3 V. These electric conductance values were measured as a function of the salt concentration and the obtained values were normalized by the estimated pore number density to calculate the experimental conductance through a single BNNP. The conductance of a single nanopore (G) was considered as the sum of two effects: the bulk ionic conductance (GB) and the contribution of surface charges (GS). The theoretical conductance (G) was calculated using,[3]
G G G e C RL
e RL
µ π µ π α( )= + = + ∑ +2 2 1B S2
s
2 (10)
Here Cs is the KCl concentration, e is the electronic charge, μ is the KCl mobility, Σ is the surface charge density on the BNNP membrane (in C m−2) and the correction α accounts for the electro-osmotic
Adv. Funct. Mater. 2021, 2009586
www.afm-journal.dewww.advancedsciencenews.com
2009586 (9 of 10) © 2021 Wiley-VCH GmbH
contribution to conductance. The surface charge density value in the above equation was varied so as to get the best fit of the theoretical equation to the experimental values. Each measurement was repeated three times and the average of the I–V curve was used to calculate the conductance corresponding to the salt given salt concentration.
Numerical Simulation: The ion transport in the nanotubes was simulated based on the coupled 2D Poisson and Nernst−Planck equations using the commercial finite element package, COMSOL 5.4a. The same dimensions of the actual membrane were used as the geometrical parameters for the numerical model. A nanotube with a radius of 15 nm, length of 50 µm, tortuosity factor of 1.0 was constructed for simulating the ion transport in the BNNP (Figure S14a,b, Supporting Information). The measured tortuosity factor (1.07) of the BNNP-AAO membrane (Figure S2, Supporting Information) was close to unity, and the BNNP of the membrane was assumed as a straight nanopore. Two electrolyte reservoirs with a KCl concentration of 1 M and 0.001 M were introduced on either side of the nanotube. The negatively charged BNNP surface was modeled by imposing a surface charge boundary condition (−108 mC m−2) along the nanochannel wall. The model solves for the concentrations of K+ and Cl− (Figure S14c, Supporting Information) and the electric field inside the nanotube system.
The cation and the anion concentration profiles along the center of the nanochannel were plotted (Figure S14d, Supporting Information) and the cation concentration values at the entrance and the exit of the nanochannel were used to measure the total change in the bulk concentration over the length of the nanotube (dlnC∞/dx). The obtained value was then used to calculate the diffusio-osmotic velocity (VDO). Similar model with the corresponding geometrical parameters was used to calculate the diffusion-osmotic velocity in the AAO and the TEPC membrane.
Molecular Dynamics Simulations: The ionic solution flow was simulated by a BNNT functionalized on its inner walls by charged hydroxyl groups at 108, 76.7, and 32.3 mC m−2 concentrations (Figure S10, Supporting Information). The diameter and length of BNNT are about 5.8 and 15 nm, respectively. The BNNT was connected to two chambers with potassium chloride (KCL) solution at 1 (left) and 0.27 mol L−1 (right) KCl concentrations, respectively. To save substantial computation time during the MD simulation studies, BNNP of 5.8-nm diameter and 15-nm length was built. 0.27 M was used for the low concentration side of the BNNP instead of 0.001 M of the experimental case, which was adjusted for 15-nm long tube. A fixed graphene slab was located at the end of each solution chamber with a vacuum layer in order to cut off the connection between the two chambers, meantime the vacuum layer can keep ions and water freely exchange between the two chambers.
The MD simulations were performed with NAMD,[26] using a modified CHARMM force field. Water molecules (TIP3P model[27]), ions, hydrogen group, and graphene sheet were described by the CHARMM general force field. The Lennard-Jones parameters for B and N atoms were evaluated from literature,[28] using MP2/6-31G level of theory to determine partial charges of functionalized BNNTs. The systems were simulated at a temperature of 300 K with a Langevin dynamics, a damping constant of 0.1 ps−1 and a time step of 2 fs in an NVT ensemble, with periodic boundary conditions imposed in all three directions. The partial mesh Ewald summation[29] was used to describe a long-rang Columbic coupling. The switching distance for non-bonded interactions was set to 8 Å, and the cut-off was set to 10 Å. There were two graphene slabs (not shown) placed away from the reservoirs in order to ensure that the only flow between the reservoirs occurred through the BNNT. Figure S10–S12 shows the average radial ion concentration profiles calculated at different positions along the functionalized BNNT after ≈30 ns of simulations. The ions distributions were averaged over 3 nm long regions selected at the BNNT entrance (high concentrated solution), center, and exit (low concentrated solution).
Supporting InformationSupporting Information is available from the Wiley Online Library or from the author.
AcknowledgementsA.P. and S.C. contributed equally to this work. This work was supported by a grant from the National Science Foundation (Grant No. CMMI-1762905).
Conflict of InterestThe authors declare no conflict of interest.
Data Availability StatementThe authors declare that all the data generated and analyzed during this study are included within this Article and its Supplementary Information. The datasets are available from the corresponding authors on reasonable request.
Keywordsblue energy, boron nitride, diffusio-osmosis, ion transport, membrane, osmotic energy harvesting
Received: November 9, 2020Revised: December 22, 2020
Published online:
[1] a) J. Hwang, S. Kataoka, A. Endo, H. Daiguji, Lab Chip 2016, 16, 3824; b) A. Esfandiar, B. Radha, F. Wang, Q. Yang, S. Hu, S. Garaj, R. Nair, A. Geim, K. Gopinadhan, Science 2017, 358, 511.
[2] L. Bocquet, E. Charlaix, Chem. Soc. Rev. 2010, 39, 1073.[3] A. Siria, P. Poncharal, A.-L. Biance, R. Fulcrand, X. Blase,
S. T. Purcell, L. Bocquet, Nature 2013, 494, 455.[4] a) C. Duan, A. Majumdar, Nat. Nanotechnol. 2010, 5, 848;
b) D.-K. Kim, C. Duan, Y.-F. Chen, A. Majumdar, Microfluid. Nano-fluid. 2010, 9, 1215.
[5] W. Guo, L. Cao, J. Xia, F.-Q. Nie, W. Ma, J. Xue, Y. Song, D. Zhu, Y. Wang, L. Jiang, Adv. Funct. Mater. 2010, 20, 1339.
[6] B. D. Kang, H. J. Kim, M. G. Lee, D.-K. Kim, Energy 2015, 86, 525.[7] M. Turek, B. Bandura, Desalination 2007, 205, 67.[8] a) M. Macha, S. Marion, V. V. R. Nandigana, A. Radenovic, Nat. Rev.
Mater. 2019, 4, 588; b) A. Gadaleta, C. Sempere, S. Gravelle, A. Siria, R. Fulcrand, C. Ybert, L. Bocquet, Phys. Fluids 2014, 26, 012005; c) J. Su, D. Ji, J. Tang, H. Li, Y. Feng, L. Cao, L. Jiang, W. Guo, Chin. J. Chem. 2018, 36, 417.
[9] a) S. Behura, P. Nguyen, S. Che, R. Debbarma, V. Berry, J. Am. Chem. Soc. 2015, 137, 13060; b) K. K. Kim, A. Hsu, X. Jia, S. M. Kim, Y. Shi, M. Hofmann, D. Nezich, J. F. Rodriguez-Nieva, M. Dresselhaus, T. Palacios, Nano Lett. 2011, 12, 161; c) J. N. Weinstein, F. B. Leitz, Science 1976, 191, 557.
[10] S. Casanova, S. Mistry, S. Mazinani, M. K. Borg, Y. J. Chew, D. Mattia, Nanoscale 2020, 12, 21138.
[11] a) L. Song, L. Ci, H. Lu, P. B. Sorokin, C. Jin, J. Ni, A. G. Kvashnin, D. G. Kvashnin, J. Lou, B. I. Yakobson, Nano Lett. 2010, 10, 3209; b) Y. Shi, C. Hamsen, X. Jia, K. K. Kim, A. Reina, M. Hofmann, A. L. Hsu, K. Zhang, H. Li, Z.-Y. Juang, M. Dresselhaus, L.-J. Li, L. Kong, Nano Lett. 2010, 10, 4134.
[12] a) D. Liu, W. Lei, S. Qin, Y. Chen, Sci. Rep. 2014, 4, 4453; b) M. Petravic, R. Peter, I. Kavre, L. H. Li, Y. Chen, L.-J. Fan, Y.-W. Yang, Phys. Chem. Chem. Phys. 2010, 12, 15349.
[13] D. Stein, M. Kruithof, C. Dekker, Phys. Rev. Lett. 2004, 93, 035901.
Adv. Funct. Mater. 2021, 2009586
www.afm-journal.dewww.advancedsciencenews.com
2009586 (10 of 10) © 2021 Wiley-VCH GmbH
[14] A. Hernandez, F. Martinez, A. Martın, P. Prádanos, J. Colloid Inter-face Sci. 1995, 173, 284.
[15] K. Seshadri, M. Selvaraj, R. Kesavamoorthy, M. Srinivasan, K. Varatharajan, K. Lal, V. Krishnasamy, J. Sol-Gel Sci. Technol. 2003, 28, 327.
[16] D. Prieve, J. Anderson, J. Ebel, M. Lowell, J. Fluid Mech. 1984, 148, 247.
[17] M. Lokesh, S. K. Youn, H. G. Park, Nano Lett. 2018, 18, 6679.[18] J. M. Bloch, W. Yun, Phys. Rev. A 1990, 41, 844.[19] J. L. Anderson, Annu. Rev. Fluid Mech. 1989, 21, 61.[20] T. B. Schroeder, A. Guha, A. Lamoureux, G. VanRenterghem,
D. Sept, M. Shtein, J. Yang, M. Mayer, Nature 2017, 552, 214.[21] C. Chen, D. Liu, L. He, S. Qin, J. Wang, J. M. Razal, N. A. Kotov,
W. Lei, Joule 2020, 4, 247.[22] W. Lee, R. Ji, U. Gösele, K. Nielsch, Nat. Mater. 2006, 5, 741.
[23] C. Chen, J. Wang, D. Liu, C. Yang, Y. Liu, R. S. Ruoff, W. Lei, Nat. Commun. 2018, 9, 1902.
[24] D. Parkhurst, C. Appelo, Water Resources Div., Denver, CO 2011.[25] S. Qin, D. Liu, G. Wang, D. Portehault, C. J. Garvey, Y. Gogotsi,
W. Lei, Y. Chen, J. Am. Chem. Soc. 2017, 139, 6314.[26] J. C. Phillips, R. Braun, W. Wang, J. Gumbart, E. Tajkhorshid,
E. Villa, C. Chipot, R. D. Skeel, L. Kale, K. Schulten, J. Comput. Chem. 2005, 26, 1781.
[27] W. L. Jorgensen, J. Chandrasekhar, J. D. Madura, R. W. Impey, M. L. Klein, J. Chem. Phys. 1983, 79, 926.
[28] a) H. Gao, Q. Shi, D. Rao, Y. Zhang, J. Su, Y. Liu, Y. Wang, K. Deng, R. Lu, J. Phys. Chem. C 2017, 121, 22105; b) C. Y. Won, N. R. Aluru, J. Am. Chem. Soc. 2007, 129, 2748.
[29] U. Essmann, L. Perera, M. L. Berkowitz, T. Darden, H. Lee, L. G. Pedersen, J. Chem. Phys. 1995, 103, 8577.
Adv. Funct. Mater. 2021, 2009586