Highlights of this Month’s Edition - U.S.-CHINA · Highlights of this Month’s Edition ... and...
25
February 7, 2017 U.S.-China Economic and Security Review Commission 1 Highlights of this Month’s Edition Bilateral trade: The U.S. trade deficit declined to $347 billion in 2016, a 5.5 percent decrease year-on-year, due to weakened imports; U.S. service exports hit a record high, aided by increased Chinese tourism spending in the United States. Bilateral policy issues: U.S. firms operating in China in 2016 report similar levels of profitability, but perceive a decline in the overall investment environment driven in part by concerns over China’s discriminatory and restrictive regulatory policies. Quarterly review of China’s economy: China’s GDP growth hit 6.7 percent in 2016, supported by higher government spending and record bank lending; President Xi Jinping talks up globalization at Davos amid bleak exports. Policy trends in China’s economy: Chinese government’s continued efforts to battle capital outflows are bearing fruit; China instructs Internet providers to end unauthorized VPN use and establishes funds for information infrastructure and development of domestic Internet companies. Sector focus – Aluminum: U.S. government tightens antidumping and countervailing duties and launches a WTO case to fight China’s excess aluminum production. Bilateral Trade U.S. Trade Deficit Decreases for First Time Since 2009 The U.S. goods deficit with China declined to $347 billion, a 5.5 percent decrease year-on-year in 2016, and the first time the annual deficit has shrunk since 2009 (see Figure 1). 1 The decline in U.S. goods imports from China, which fell 4.2 percent in 2016 compared to 2015, accounted for the deficit reduction. 2 U.S. goods exports to China were down 0.3 percent from 2015 levels, decreasing from $116.1 billion to $115.8 billion in 2016. 3 This marks the second consecutive year U.S. goods exports to China have declined (goods exports fell 6.3 percent year-on-year in 2015). 4 Before 2015, U.S. annual goods exports to China had grown for six consecutive years. 5 The fourth quarter of 2016 was particularly strong for U.S. goods exports to China, which increased 13.2 percent year-on-year. 6 U.S. goods imports from China, meanwhile, increased 1.2 percent in the fourth quarter of 2016 compared to the same period in 2015. 7 As a result, the quarterly deficit declined 3 percent year-on-year. 8
Transcript of Highlights of this Month’s Edition - U.S.-CHINA · Highlights of this Month’s Edition ... and...

February 7, 2017
U.S.-China Economic and Security Review Commission 1
Highlights of this Month’s Edition
Bilateral trade: The U.S. trade deficit declined to $347 billion in 2016, a 5.5 percent decrease year-on-year,
due to weakened imports; U.S. service exports hit a record high, aided by increased Chinese tourism spending
in the United States.
Bilateral policy issues: U.S. firms operating in China in 2016 report similar levels of profitability, but perceive
a decline in the overall investment environment driven in part by concerns over China’s discriminatory and
restrictive regulatory policies.
Quarterly review of China’s economy: China’s GDP growth hit 6.7 percent in 2016, supported by higher
government spending and record bank lending; President Xi Jinping talks up globalization at Davos amid bleak
exports.
Policy trends in China’s economy: Chinese government’s continued efforts to battle capital outflows are
bearing fruit; China instructs Internet providers to end unauthorized VPN use and establishes funds for
information infrastructure and development of domestic Internet companies.
Sector focus – Aluminum: U.S. government tightens antidumping and countervailing duties and launches a
WTO case to fight China’s excess aluminum production.
Bilateral Trade
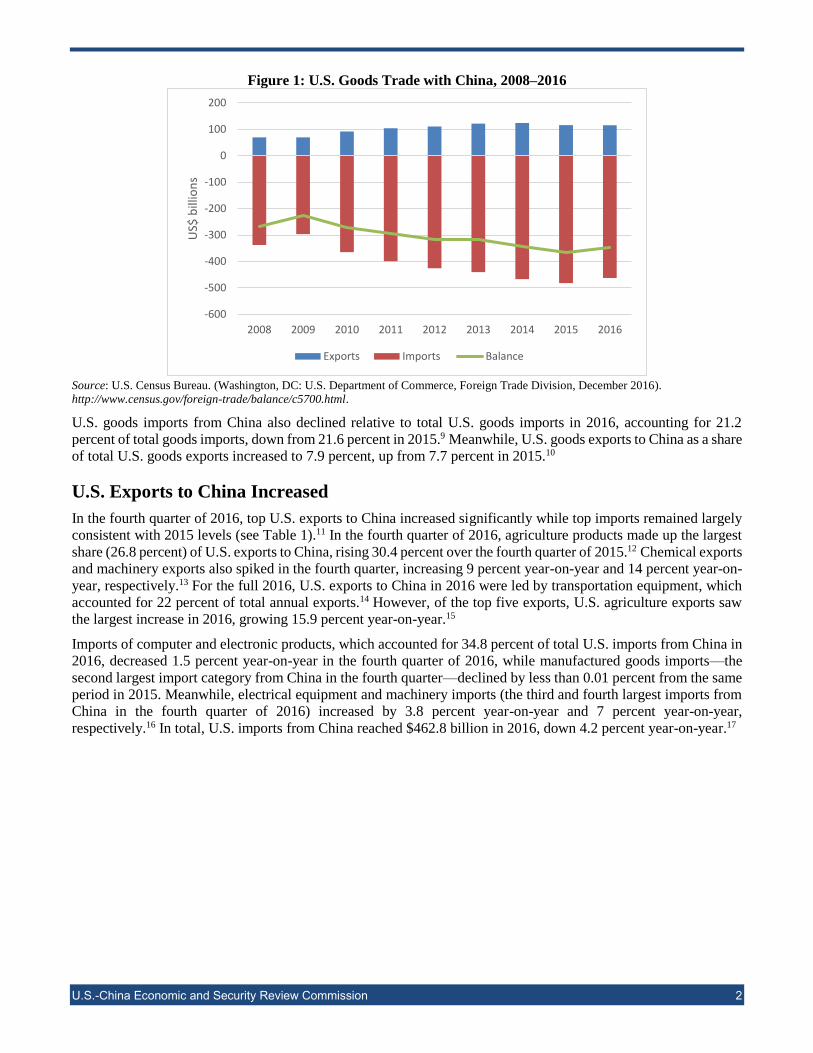
U.S. Trade Deficit Decreases for First Time Since 2009
The U.S. goods deficit with China declined to $347 billion, a 5.5 percent decrease year-on-year in 2016, and the
first time the annual deficit has shrunk since 2009 (see Figure 1).1 The decline in U.S. goods imports from China,
which fell 4.2 percent in 2016 compared to 2015, accounted for the deficit reduction.2 U.S. goods exports to China
were down 0.3 percent from 2015 levels, decreasing from $116.1 billion to $115.8 billion in 2016.3 This marks the
second consecutive year U.S. goods exports to China have declined (goods exports fell 6.3 percent year-on-year in
2015).4 Before 2015, U.S. annual goods exports to China had grown for six consecutive years.5 The fourth quarter
of 2016 was particularly strong for U.S. goods exports to China, which increased 13.2 percent year-on-year.6 U.S.
goods imports from China, meanwhile, increased 1.2 percent in the fourth quarter of 2016 compared to the same
period in 2015.7 As a result, the quarterly deficit declined 3 percent year-on-year.8
U.S.-China Economic and Security Review Commission 2
Figure 1: U.S. Goods Trade with China, 2008–2016
Source: U.S. Census Bureau. (Washington, DC: U.S. Department of Commerce, Foreign Trade Division, December 2016).
http://www.census.gov/foreign-trade/balance/c5700.html.
U.S. goods imports from China also declined relative to total U.S. goods imports in 2016, accounting for 21.2
percent of total goods imports, down from 21.6 percent in 2015.9 Meanwhile, U.S. goods exports to China as a share
of total U.S. goods exports increased to 7.9 percent, up from 7.7 percent in 2015.10
U.S. Exports to China Increased
In the fourth quarter of 2016, top U.S. exports to China increased significantly while top imports remained largely
consistent with 2015 levels (see Table 1).11 In the fourth quarter of 2016, agriculture products made up the largest
share (26.8 percent) of U.S. exports to China, rising 30.4 percent over the fourth quarter of 2015.12 Chemical exports
and machinery exports also spiked in the fourth quarter, increasing 9 percent year-on-year and 14 percent year-on-
year, respectively.13 For the full 2016, U.S. exports to China in 2016 were led by transportation equipment, which
accounted for 22 percent of total annual exports.14 However, of the top five exports, U.S. agriculture exports saw
the largest increase in 2016, growing 15.9 percent year-on-year.15
Imports of computer and electronic products, which accounted for 34.8 percent of total U.S. imports from China in
2016, decreased 1.5 percent year-on-year in the fourth quarter of 2016, while manufactured goods imports—the
second largest import category from China in the fourth quarter—declined by less than 0.01 percent from the same
period in 2015. Meanwhile, electrical equipment and machinery imports (the third and fourth largest imports from
China in the fourth quarter of 2016) increased by 3.8 percent year-on-year and 7 percent year-on-year,
respectively.16 In total, U.S. imports from China reached $462.8 billion in 2016, down 4.2 percent year-on-year.17
-600
-500
-400
-300
-200
-100
0
100
200
2008 2009 2010 2011 2012 2013 2014 2015 2016
US$
bill
ion
s
Exports Imports Balance

U.S.-China Economic and Security Review Commission 3
Table 1: U.S. Trade with China: Top Five Exports and Imports
(US$ millions)
Source: U.S. Census Bureau. (Washington, DC: U.S. Department of Commerce, Foreign Trade Division, December 2016).
Advanced Technology Products
The U.S. trade deficit with China in advanced technology products (ATP) was $114.2 billion in 2016, a $6.9 billion
decline from 2015 (see Table 2).18 Imports of information and communication products (ICT) were the main
contributor to the deficit, accounting for 90 percent of total ATP imports in 2016.19 Meanwhile, aerospace products
remain the largest U.S. ATP export to China, accounting for 43.7 percent of total ATP exports to China in 2016,
followed by electronics (18 percent) and ICT (14.4 percent).20 U.S. ATP exports to and imports from China both
decreased in 2016; total ATP exports fell 2.3 percent year-on-year (largely due to aerospace exports declining by
5.5 percent year-on-year) and total ATP imports from China decreased 4.7 percent year-on-year (largely due to a
4.7 percent decline in ICT imports compared to 2015).21
Table 2: ATP Trade 2016
(US$ millions)
Source: U.S. Census Bureau. (Washington, DC: U.S. Department of Commerce, Foreign Trade Division, December 2016).
http://www.census.gov/foreign-trade/statistics/product/atp/2016/06/ctryatp/atp5700.html.
U.S. Top-Five Exports to China U.S. Top-Five Imports from China
Exports
Share of
total
(%)
Change
over Q4'15
(%) Imports
Share of total
(%)
Change
over Q4'15
(%)
Quarter 4 (Oct-Dec'16)Agriculture Products 9,776.1 26.8% 30.4% Computer and Electronic Products 48,323.64 38.4% -1.5%
Transportation Equipment 6,643.1 18.2% 0.7%
Miscellaneous Manufactured
Commodities 11,455.0 9.1% 0.0%
Computer & Electronic Products 4,491.9 12.3% -1.7% Electrical Equipment 10,632.3 8.5% 3.8%
Chemicals 3,712.9 10.2% 9.0% Machinery, Except Electrical 7,442.0 5.9% 7.0%
Machinery, Except Electrical 4,193.27 11.5% 14.0% Apparel and Accessories 7,230.4 5.7% -8.5%
Other 7,626.0 20.9% - Other 40,726 32.4% -
Total 36,443.26 100.0% 13.2% Total 125,809.30 100.0% 1.2%
2016 Total
Transportation Equipment 25,499.9 22.0% Computer and Electronic Products 161,262.9 34.8%
Agriculture Products 17,259.1 14.9% Misc. Manufactured Commodities 39,417.0 8.5%
Computer & Electronic Products 17,096.1 14.8% Electrical Equipment 40,608.8 8.8%
Chemicals 13,489.1 11.7% Machinery, Except Electrical 30,427.5 6.6%
Machinery, Except Electrical 8,263.2 7.1% Apparel and Accessories 30,341.8 6.6%
Other 34,167.6 29.5% Other 160,755 34.7%
Total 115,775.1 100.0% Total 462,813.0 100.0%
Quarter 4 (Oct-Dec'16)
2016 Total
Exports Imports
Balance
Q4'16
Balance
Q4'15
Balance
YOY Exports Imports
Balance
2016
Balance
2015
TOTAL 8,233 44,594 -36,361 -35,891 1.3% 33,436 147,597 -114,161 -120,719
(01) Biotechnology 233 36 197 156 26.3% 852 135 717 672
(02) Life Science 924 715 209 238 -12.2% 3,447 2,667 780 869
(03) Opto-Electronics 119 1,378 -1,259 -1,992 -36.8% 467 5,690 -5,223 -6,594
(04) Information & Communications 1,195 40,762 -39,567 -38,997 1.5% 4,809 132,769 -127,960 -134,146
(05) Electronics 1,622 949 673 715 -5.9% 6,004 3,770 2,234 2,472
(06) Flexible Manufacturing 536 309 227 189 20.1% 2,769 1,083 1,686 1,588
(07) Advanced Materials 57 104 -47 -33 42.4% 231 367 -136 -197
(08) Aerospace 3,531 210 3,321 3,857 -13.9% 14,623 882 13,741 14,600
(09) Weapons 0 42 -42 -48 -12.5% 3 144 -141 -156
(10) Nuclear Technology 17 88 -71 27 -363.0% 231 89 142 171
2016 Q4 Cumulative year-to-date
U.S.-China Economic and Security Review Commission 4
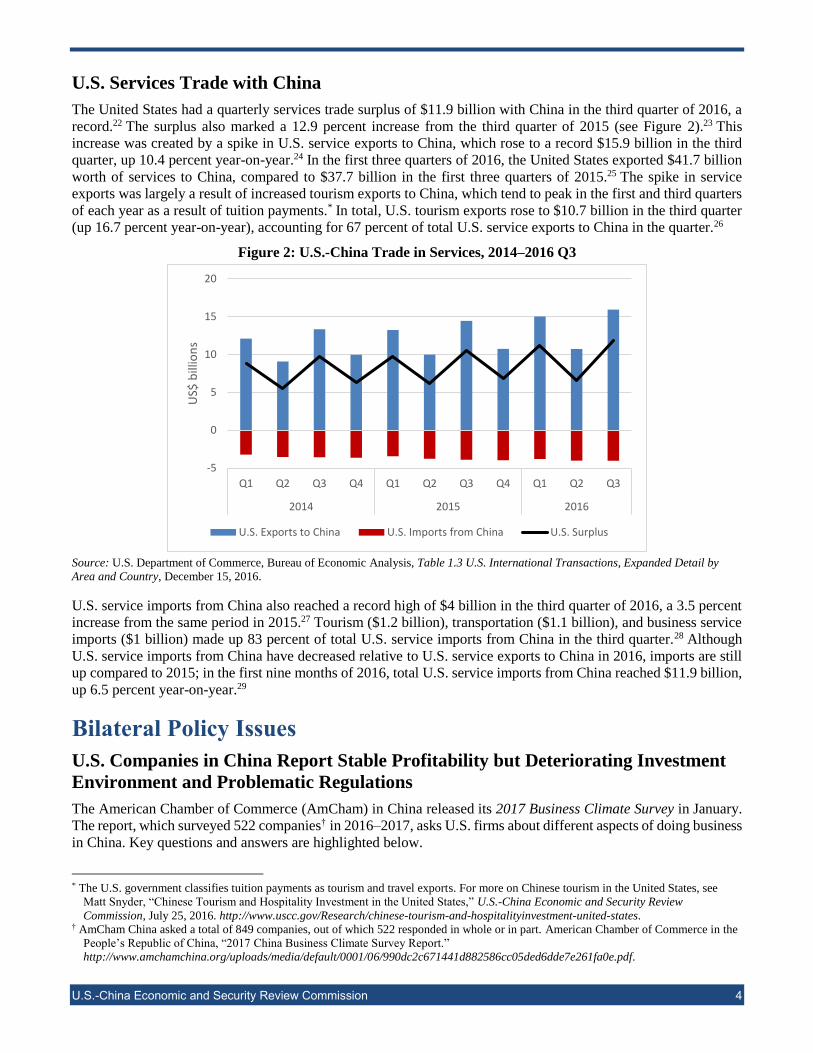
U.S. Services Trade with China
The United States had a quarterly services trade surplus of $11.9 billion with China in the third quarter of 2016, a
record.22 The surplus also marked a 12.9 percent increase from the third quarter of 2015 (see Figure 2).23 This
increase was created by a spike in U.S. service exports to China, which rose to a record $15.9 billion in the third
quarter, up 10.4 percent year-on-year.24 In the first three quarters of 2016, the United States exported $41.7 billion
worth of services to China, compared to $37.7 billion in the first three quarters of 2015.25 The spike in service
exports was largely a result of increased tourism exports to China, which tend to peak in the first and third quarters
of each year as a result of tuition payments.* In total, U.S. tourism exports rose to $10.7 billion in the third quarter
(up 16.7 percent year-on-year), accounting for 67 percent of total U.S. service exports to China in the quarter.26
Figure 2: U.S.-China Trade in Services, 2014–2016 Q3
Source: U.S. Department of Commerce, Bureau of Economic Analysis, Table 1.3 U.S. International Transactions, Expanded Detail by
Area and Country, December 15, 2016.
U.S. service imports from China also reached a record high of $4 billion in the third quarter of 2016, a 3.5 percent
increase from the same period in 2015.27 Tourism ($1.2 billion), transportation ($1.1 billion), and business service
imports ($1 billion) made up 83 percent of total U.S. service imports from China in the third quarter.28 Although
U.S. service imports from China have decreased relative to U.S. service exports to China in 2016, imports are still
up compared to 2015; in the first nine months of 2016, total U.S. service imports from China reached $11.9 billion,
up 6.5 percent year-on-year.29
Bilateral Policy Issues
U.S. Companies in China Report Stable Profitability but Deteriorating Investment
Environment and Problematic Regulations
The American Chamber of Commerce (AmCham) in China released its 2017 Business Climate Survey in January.
The report, which surveyed 522 companies† in 2016–2017, asks U.S. firms about different aspects of doing business
in China. Key questions and answers are highlighted below.
* The U.S. government classifies tuition payments as tourism and travel exports. For more on Chinese tourism in the United States, see
Matt Snyder, “Chinese Tourism and Hospitality Investment in the United States,” U.S.-China Economic and Security Review
Commission, July 25, 2016. http://www.uscc.gov/Research/chinese-tourism-and-hospitalityinvestment-united-states. † AmCham China asked a total of 849 companies, out of which 522 responded in whole or in part. American Chamber of Commerce in the
People’s Republic of China, “2017 China Business Climate Survey Report.”
http://www.amchamchina.org/uploads/media/default/0001/06/990dc2c671441d882586cc05ded6dde7e261fa0e.pdf.
-5
0
5
10
15
20
Q1 Q2 Q3 Q4 Q1 Q2 Q3 Q4 Q1 Q2 Q3
2014 2015 2016
US$
bill
ion
s
U.S. Exports to China U.S. Imports from China U.S. Surplus
U.S.-China Economic and Security Review Commission 5
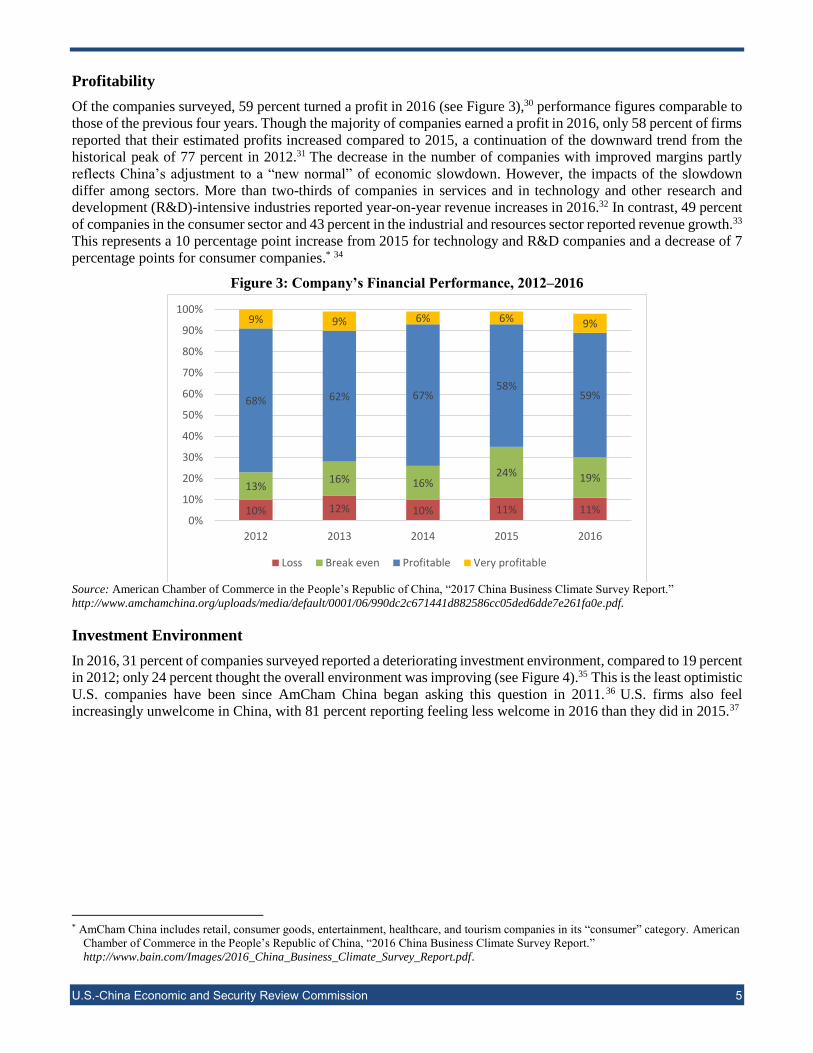
Profitability
Of the companies surveyed, 59 percent turned a profit in 2016 (see Figure 3),30 performance figures comparable to
those of the previous four years. Though the majority of companies earned a profit in 2016, only 58 percent of firms
reported that their estimated profits increased compared to 2015, a continuation of the downward trend from the
historical peak of 77 percent in 2012.31 The decrease in the number of companies with improved margins partly
reflects China’s adjustment to a “new normal” of economic slowdown. However, the impacts of the slowdown
differ among sectors. More than two-thirds of companies in services and in technology and other research and
development (R&D)-intensive industries reported year-on-year revenue increases in 2016.32 In contrast, 49 percent
of companies in the consumer sector and 43 percent in the industrial and resources sector reported revenue growth.33
This represents a 10 percentage point increase from 2015 for technology and R&D companies and a decrease of 7
percentage points for consumer companies.* 34
Figure 3: Company’s Financial Performance, 2012–2016
Source: American Chamber of Commerce in the People’s Republic of China, “2017 China Business Climate Survey Report.”
http://www.amchamchina.org/uploads/media/default/0001/06/990dc2c671441d882586cc05ded6dde7e261fa0e.pdf.
Investment Environment
In 2016, 31 percent of companies surveyed reported a deteriorating investment environment, compared to 19 percent
in 2012; only 24 percent thought the overall environment was improving (see Figure 4).35 This is the least optimistic
U.S. companies have been since AmCham China began asking this question in 2011.36 U.S. firms also feel
increasingly unwelcome in China, with 81 percent reporting feeling less welcome in 2016 than they did in 2015.37
* AmCham China includes retail, consumer goods, entertainment, healthcare, and tourism companies in its “consumer” category. American
Chamber of Commerce in the People’s Republic of China, “2016 China Business Climate Survey Report.”
http://www.bain.com/Images/2016_China_Business_Climate_Survey_Report.pdf.
10% 12% 10% 11% 11%
13%16% 16%
24% 19%
68% 62% 67%58%
59%
9% 9% 6% 6% 9%
0%
10%
20%
30%
40%
50%
60%
70%
80%
90%
100%
2012 2013 2014 2015 2016
Loss Break even Profitable Very profitable

U.S.-China Economic and Security Review Commission 6
Figure 4: The Quality of China’s Investment Environment Is…
Source: American Chamber of Commerce in the People’s Republic of China, “2017 China Business Climate Survey Report.”
http://www.amchamchina.org/uploads/media/default/0001/06/990dc2c671441d882586cc05ded6dde7e261fa0e.pdf.
Top Challenges
The report’s list of the top five challenges U.S. businesses face in the coming year helps explain this pessimism. In
2017, firms anticipate inconsistent regulations and increasing labor costs to be the biggest challenges (see Table
3).38 This is the fifth consecutive year these were the top two challenges. Despite their increasing profits, only 10
percent of technology and R&D companies are optimistic about the implementation and enforcement of regulations
over the next two years.39 Services, consumer, and industrial and resources firms were a little more sanguine; about
one fifth of these firms were optimistic about future regulation.40 U.S. businesses have previously expressed
concerns that Chinese regulations are more frequently and severely applied to foreign firms. For example, in 2014
the U.S. Chamber of Commerce stated that China’s antimonopoly law was enforced “disproportionately against
foreign companies to achieve industrial policy goals,” and found that anticompetition fines were higher for foreign
firms than for Chinese businesses (on average 3.3 percent of the previous year’s sales for foreign firms versus 2.5
percent for Chinese firms).41
Sixty-five percent of total respondents are concerned about rising labor costs in 2017, and 45 percent are concerned
with the rising cost of social benefits, compared to 34 percent of companies surveyed in 2016.42 The Pudong
Innovation Research Institute (a think tank founded by the Shanghai government’s Science and Technology
Commission) estimated Chinese labor costs rose about 9 percent in 2016.43 Wage increases are partly the natural
result of market forces. From 2011 to 2015, China’s working age population shrank by about 20 million.44 Though
labor demand has also fallen, it has not kept pace with the decline in supply. In 2014, for example, the labor supply
in cities* decreased by 4.4 percent, while labor demand has decreased by only 2.2 percent.45 Zeng Xiangquan, head
of the School of Human Resources at Renmin University, forecast that the 2016 labor supply would fall at a rate
comparable to that of the previous five years.46
According to the Pudong Innovation Research Institute, another main driver of the increase in labor costs is the
“overly high social insurance contribution rate” of Chinese firms.47 Social insurance contribution is the amount both
foreign and domestic employers are required to pay toward their employees’ health insurance, unemployment
insurance, and social security. In China, the required contribution ratio can reach up to 40 percent of an employee’s
* These data are from a Chinese government unemployment survey that includes large- to medium-sized cities, but importantly excludes
the rural population, migrant workers, and new graduates. Dan Steinbock, “China’s Labor Market Adaptation to Slower Growth,”
Economy Watch, March 3, 2015. http://www.economywatch.com/features/Chinas-Labor-Market-Adaptation-to-Slower-Growth.03-03-
15.html.
19% 18%29% 26% 31%
53%48%
39% 41%45%
28%34% 32% 33%
24%
0%
10%
20%
30%
40%
50%
60%
70%
80%
90%
100%
2012 2013 2014 2015 2016
Deteriorating Staying the same Improving

U.S.-China Economic and Security Review Commission 7
wages.* 48 As a result of higher labor costs, China’s neighboring countries are becoming more cost competitive. An
average factory worker in China earned $27.50 per day in 2015, compared with $8.60 in Indonesia and $6.70 in
Vietnam.49
Among companies surveyed, concerns over labor expenses and regulation were compounded by uncertainty over
investment restrictions. Two-thirds of companies either doubt or are unsure whether China will further open markets
to foreign investment, and domestic protectionism in general became their third-biggest reported challenge in
2017.50
Table 3: Top Five Business Challenges in China for U.S. Firms, 2013–2017
2013 2014 2015 2016 2017
Labor costs: 44%
Labor costs: 61%
Labor costs: 61%
Inconsistent regulatory
interpretation and unclear laws:
57%
Inconsistent regulatory
interpretation and unclear laws:
58%
Inconsistent regulatory
interpretation and unclear laws:
38%
Inconsistent regulatory
interpretation and unclear laws:
39%
Inconsistent regulatory
interpretation and unclear laws:
47%
Labor costs: 54%
Labor costs: 58%
Shortage of qualified
employees: 35%
Shortage of qualified
employees: 37%
Shortage of qualified
employees: 42%
Obtaining required licenses:
29%
Increasing Chinese protectionism:
32%
Corruption: 30%
Shortage of qualified
management: 31%
Shortage of qualified
management: 32%
Shortage of qualified
employees: 29%
Shortage of qualified
management: 30%
Shortage of qualified
management: 30%
Obtaining required licenses:
31%
Increasing Chinese protectionism:
30%
Industry overcapacity:
29%
Obtaining required licenses:
29%
Source: American Chamber of Commerce in the People’s Republic of China, “2017 China Business Climate Survey Report.”
http://www.amchamchina.org/uploads/media/default/0001/06/990dc2c671441d882586cc05ded6dde7e261fa0e.pdf
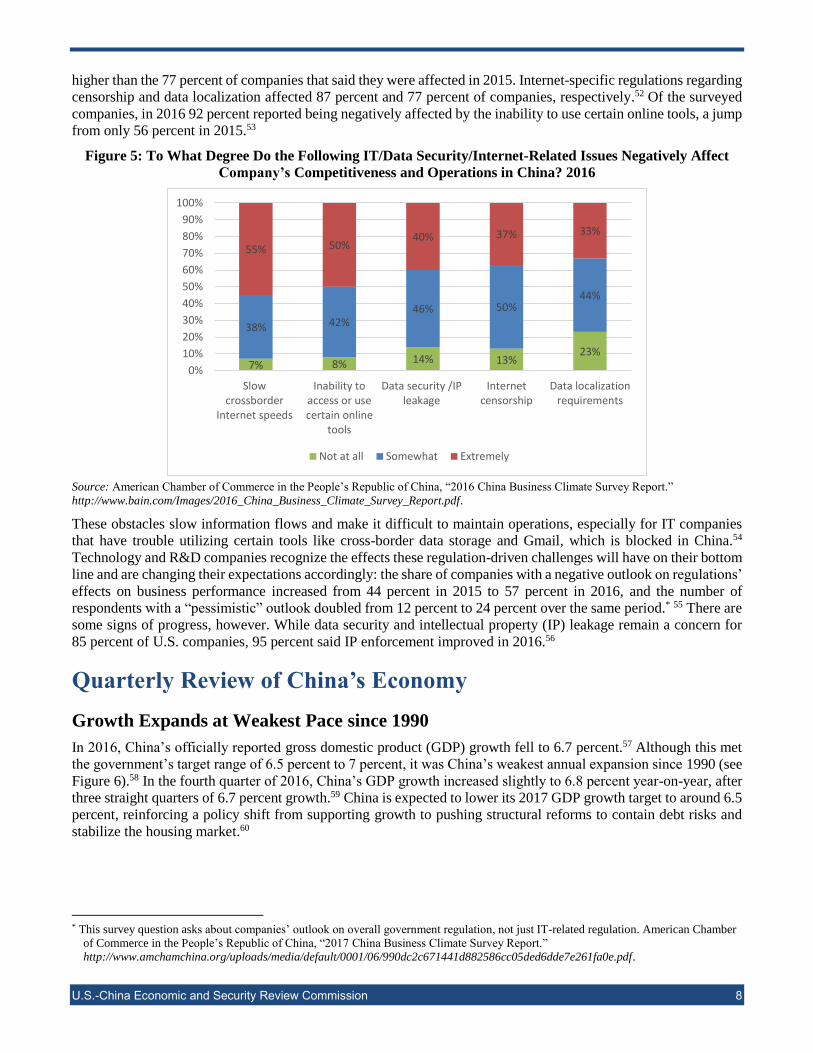
Information Technology (IT) and Data Security
AmCham China asked all survey participants about the degree to which five specific issues related to Internet
access, regulation, and security hindered their business operations in 2016. These issues continue to be a major
obstacle for U.S. companies doing business in China (see Figure 5). Throttled Internet speeds affected 93 percent
of firms, limiting their productivity and reducing their ability to conduct basic research.† 51 This is significantly
* The different forms of insurance and the rates companies are required to pay vary widely according to location, and the required ratio is
difficult to determine for many foreign firms. The rate companies are required to pay also depends on the type of insurance. For instance,
Beijing requires higher contributions from companies for employee medical insurance than for unemployment insurance. Amelia Tsui,
“Social Security in China: What a Foreign Company Needs to Know,” China Briefing, April 17, 2015. http://www.china-
briefing.com/news/2015/04/17/social-security-in-china-what-a-foreign-company-needs-to-know.html. † The phrasing of this question was slightly different in the 2016 report. In 2016, the survey asked if companies were affected by
“unreliable or inconsistent Internet access and speed.” American Chamber of Commerce in the People’s Republic of China, “2016 China
Business Climate Survey Report.” http://www.bain.com/Images/2016_China_Business_Climate_Survey_Report.pdf.
U.S.-China Economic and Security Review Commission 8
higher than the 77 percent of companies that said they were affected in 2015. Internet-specific regulations regarding
censorship and data localization affected 87 percent and 77 percent of companies, respectively.52 Of the surveyed
companies, in 2016 92 percent reported being negatively affected by the inability to use certain online tools, a jump
from only 56 percent in 2015.53
Figure 5: To What Degree Do the Following IT/Data Security/Internet-Related Issues Negatively Affect
Company’s Competitiveness and Operations in China? 2016
Source: American Chamber of Commerce in the People’s Republic of China, “2016 China Business Climate Survey Report.”
http://www.bain.com/Images/2016_China_Business_Climate_Survey_Report.pdf.
These obstacles slow information flows and make it difficult to maintain operations, especially for IT companies
that have trouble utilizing certain tools like cross-border data storage and Gmail, which is blocked in China.54
Technology and R&D companies recognize the effects these regulation-driven challenges will have on their bottom
line and are changing their expectations accordingly: the share of companies with a negative outlook on regulations’
effects on business performance increased from 44 percent in 2015 to 57 percent in 2016, and the number of
respondents with a “pessimistic” outlook doubled from 12 percent to 24 percent over the same period.* 55 There are
some signs of progress, however. While data security and intellectual property (IP) leakage remain a concern for
85 percent of U.S. companies, 95 percent said IP enforcement improved in 2016.56
Quarterly Review of China’s Economy
Growth Expands at Weakest Pace since 1990
In 2016, China’s officially reported gross domestic product (GDP) growth fell to 6.7 percent.57 Although this met
the government’s target range of 6.5 percent to 7 percent, it was China’s weakest annual expansion since 1990 (see
Figure 6).58 In the fourth quarter of 2016, China’s GDP growth increased slightly to 6.8 percent year-on-year, after
three straight quarters of 6.7 percent growth.59 China is expected to lower its 2017 GDP growth target to around 6.5
percent, reinforcing a policy shift from supporting growth to pushing structural reforms to contain debt risks and
stabilize the housing market.60
* This survey question asks about companies’ outlook on overall government regulation, not just IT-related regulation. American Chamber
of Commerce in the People’s Republic of China, “2017 China Business Climate Survey Report.”
http://www.amchamchina.org/uploads/media/default/0001/06/990dc2c671441d882586cc05ded6dde7e261fa0e.pdf.
7% 8% 14% 13%23%
38% 42%46% 50%
44%
55% 50%40% 37% 33%
0%
10%
20%
30%
40%
50%
60%
70%
80%
90%
100%
Slowcrossborder
Internet speeds
Inability toaccess or usecertain online
tools
Data security /IPleakage
Internetcensorship
Data localizationrequirements
Not at all Somewhat Extremely

U.S.-China Economic and Security Review Commission 9
Figure 6: China’s GDP Growth, 2011–2015
(year-on-year)
Source: China’s National Bureau of Statistics via CEIC database.
Doubts over the credibility of official economic statistics persist. In January 2017, the governor of the northeastern
province of Liaoning admitted that city and county officials in Liaoning had inflated growth data by at least 20
percent from 2011 to 2014.61 This admission came after the director of China’s National Bureau of Statistics
acknowledged in a December 2016 column for the state-run People’s Daily, “Some local statistics are falsified, and
fraud and deception happen from time to time.”62 Nonetheless, many economists assess 2016’s steady growth as
real, achieved on the back of higher government spending and record bank lending.63
In 2016, fixed asset investment (FAI) cooled, growing 8.1 percent year-on-year, the slowest annual pace since
1999.64 State investment was deployed to offset the weakness in private investment: FAI by state-owned enterprises
(SOEs) outpaced that by private firms, expanding 18.7 percent year-on-year compared with a 3.2 percent lift in
private sector FAI (see Figure 7).65 SOEs’ share of FAI reached 35.7 percent in 2016, the highest level for state
spending since February 2011.66 In 2016, SOEs’ profits edged up to 1.7 percent year-on-year, after dropping 6.7
percent year-on-year in 2015, buoyed by gains in industrial production and sales in the fourth quarter of 2016.67
Figure 7: China’s Fixed Asset Investment
(year-on-year)
9.2%
7.8%7.7%
7.4%
6.9%
6.7%
6.0%
6.5%
7.0%
7.5%
8.0%
8.5%
9.0%
9.5%
2011 2012 2013 2014 2015 2016
Official GDP Growth Rate Target
0%
5%
10%
15%
20%
25%
30%
35%
2012 2013 2014 2015 2016
Overall FAI State Firms Private
U.S.-China Economic and Security Review Commission 10
Source: China’s National Bureau of Statistics via CEIC database.
Consumption and Services Remain Robust, Manufacturing Stabilizes
Strong retail sales and services activity offer some evidence that China is transitioning to a more consumption- and
services-driven economy. In 2016, domestic consumption remained a key driver of growth, contributing the bulk
of GDP growth at 64.6 percent.68 However, consumption fell slightly as a share of GDP, dipping 1.8 percent from
2015.69 Retail sales—a gauge of domestic consumption—rose 10.4 percent year-on-year in 2016, led by robust
increases in online retail sales, which grew 26.2 percent year-on-year.70 However, household income growth has
not picked up: in 2016, China’s national per capita disposable income rose 6.3 percent year-on-year in real terms to
$3,469 (renminbi [RMB] 23,821), compared to an increase of 7.4 percent in 2015.71
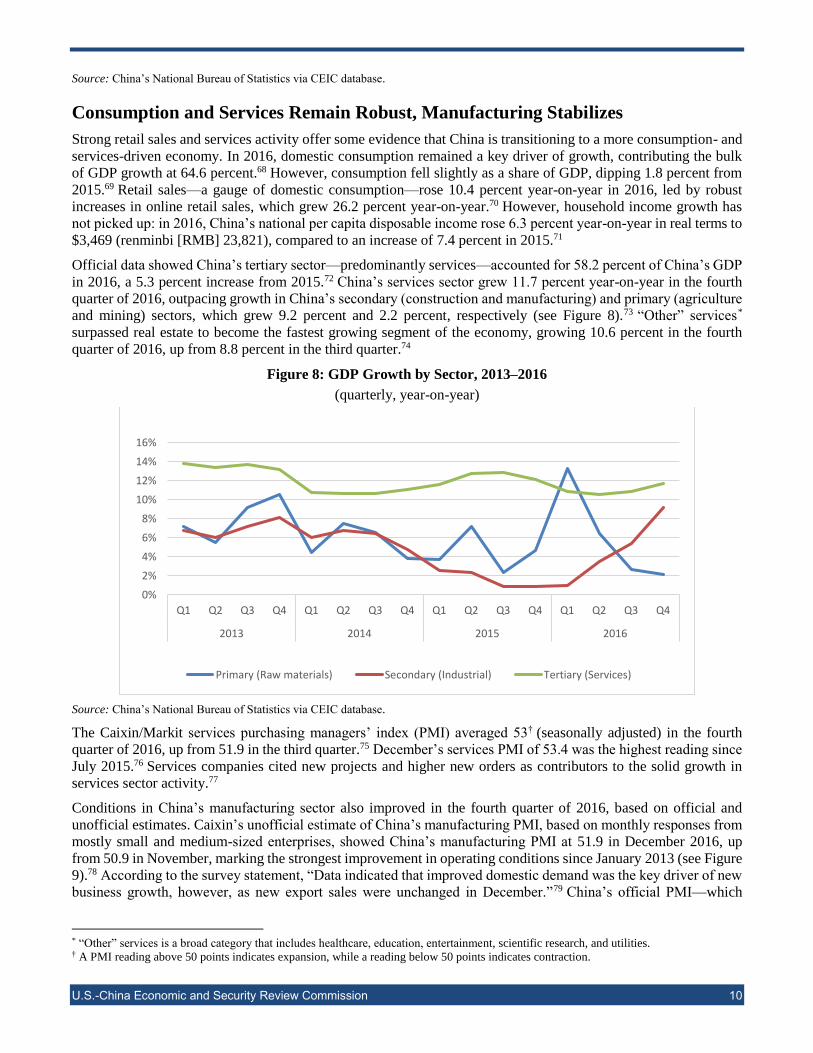
Official data showed China’s tertiary sector—predominantly services—accounted for 58.2 percent of China’s GDP
in 2016, a 5.3 percent increase from 2015.72 China’s services sector grew 11.7 percent year-on-year in the fourth
quarter of 2016, outpacing growth in China’s secondary (construction and manufacturing) and primary (agriculture
and mining) sectors, which grew 9.2 percent and 2.2 percent, respectively (see Figure 8).73 “Other” services*
surpassed real estate to become the fastest growing segment of the economy, growing 10.6 percent in the fourth
quarter of 2016, up from 8.8 percent in the third quarter.74
Figure 8: GDP Growth by Sector, 2013–2016
(quarterly, year-on-year)
Source: China’s National Bureau of Statistics via CEIC database.
The Caixin/Markit services purchasing managers’ index (PMI) averaged 53† (seasonally adjusted) in the fourth
quarter of 2016, up from 51.9 in the third quarter.75 December’s services PMI of 53.4 was the highest reading since
July 2015.76 Services companies cited new projects and higher new orders as contributors to the solid growth in
services sector activity.77
Conditions in China’s manufacturing sector also improved in the fourth quarter of 2016, based on official and
unofficial estimates. Caixin’s unofficial estimate of China’s manufacturing PMI, based on monthly responses from
mostly small and medium-sized enterprises, showed China’s manufacturing PMI at 51.9 in December 2016, up
from 50.9 in November, marking the strongest improvement in operating conditions since January 2013 (see Figure
9).78 According to the survey statement, “Data indicated that improved domestic demand was the key driver of new
business growth, however, as new export sales were unchanged in December.”79 China’s official PMI—which
* “Other” services is a broad category that includes healthcare, education, entertainment, scientific research, and utilities. † A PMI reading above 50 points indicates expansion, while a reading below 50 points indicates contraction.
0%
2%
4%
6%
8%
10%
12%
14%
16%
Q1 Q2 Q3 Q4 Q1 Q2 Q3 Q4 Q1 Q2 Q3 Q4 Q1 Q2 Q3 Q4
2013 2014 2015 2016
Primary (Raw materials) Secondary (Industrial) Tertiary (Services)

U.S.-China Economic and Security Review Commission 11
focuses on larger SOEs—reached 51.4 in December.80 Value-added industrial growth—viewed by markets as a
proxy for economic growth—expanded 6 percent year-on-year in 2016.81
Figure 9: China’s Manufacturing PMI and Industrial Value Added, September 2013–December 2016
Source: China’s National Bureau of Statistics via CEIC database.
Record Lending Sustains Growth, but Delays Deleveraging
Despite rising debt concerns and pledges from Chinese leaders to curb financial risks, Chinese banks issued a record
$1.84 trillion (RMB 12.65 trillion) in new loans in 2016 (see Figure 10), an 8 percent increase from 2015.82 New
loans were front-loaded in the first quarter of 2016, with Chinese banks releasing $701 billion (RMB 4.7 trillion)
of credit, an amount that exceeded the $687 billion (RMB 4.6 trillion) released in the first quarter of 2009 during
the global financial crisis.83 New loans increased sharply in December 2016, reaching $149.9 billion (RMB 1.04
trillion), up from $114.5 billion (RMB 794.6 billion) in November.84 Strong credit growth throughout 2016 suggests
Beijing has prioritized its growth goals over deleveraging. According to data from the Bank for International
Settlements, China’s total debt reached a record $27.2 trillion, or 255 percent of GDP, in the second quarter of 2016,
up from 235 percent of GDP a year ago.85
Figure 10: New Loans Issued by Chinese Banks, 2008–2016
(quarterly, year-on-year)
Source: The People’s Bank of China via CEIC database.
47.0
47.5
48.0
48.5
49.0
49.5
50.0
50.5
51.0
51.5
52.0
5%
6%
7%
8%
9%
10%
11%
Industrial Value Added, YoY (LHS) Caixin Manufacturing PMI (RHS)
0.0
0.5
1.0
1.5
2.0
2.5
3.0
3.5
4.0
4.5
5.0
Q1 Q3 Q1 Q3 Q1 Q3 Q1 Q3 Q1 Q3 Q1 Q3 Q1 Q3 Q1 Q3 Q1 Q3
2008 2009 2010 2011 2012 2013 2014 2015 2016
RM
B t
rilli
on
s

U.S.-China Economic and Security Review Commission 12
Amid Bleak Export Data, Xi Champions Globalization
In a January 2017 speech at the World Economic Forum in Davos, Chinese President and General Secretary of the
Chinese Communist Party Xi Jinping defended globalization and free trade:86 “The problems troubling the world
are not caused by globalization.... [They are] not an inevitable outcome of economic globalization,” he said,
comparing protectionism to “locking oneself in a dark room.”87 While President Xi’s characterization of China’s
commitment to open markets does not square with reality (see AmCham China’s business climate survey results,
discussed earlier in this issue), it underscores Beijing’s concerns of a further slowdown in global trade as well as
the importance of exports to the Chinese economy.
In 2016, China’s global exports fell 7.7 percent in dollar terms from the previous year, the biggest decline since the
depths of the global financial crisis in 2009.88 China’s weak export performance reflects persistently anemic global
demand and rising labor and material costs. China’s imports dropped 5.5 percent in dollar terms for the full year in
2016, narrowing China’s trade surplus to $510 billion from $594 billion in 2015.89 In the fourth quarter of 2016,
China’s exports contracted 5.2 percent year-on-year in dollar terms and decreased 11.3 percent year-on-year by
volume (see Figures 11 and 12).90 Imports increased 2.5 percent year-on-year in dollar terms and increased 7.9
percent year-on-year by volume.91 Rising imports of bulk commodities such as crude oil, iron ore, copper, and
soybeans partially account for the increase in imports.92
Figure 11: Change in Chinese Exports and Imports in Dollar Terms, 2013–2016
(quarterly, year-on-year)
Source: China’s General Administration of Customs via CEIC database.
-20%
-15%
-10%
-5%
0%
5%
10%
15%
20%
Q1 Q2 Q3 Q4 Q1 Q2 Q3 Q4 Q1 Q2 Q3 Q4 Q1 Q2 Q3 Q4
2013 2014 2015 2016
Exports Imports

U.S.-China Economic and Security Review Commission 13
Figure 12: Change in Chinese Exports and Imports in Volume Terms, 2013–2016
(quarterly, year-on-year)
Source: China’s General Administration of Customs via CEIC database.
Policy Trends in China’s Economy
Chinese Government Steps up Efforts to Stem Capital Outflows
The first few weeks of 2017 saw the Chinese government continuing its fight against capital outflows after more
than $300 billion left the country in the first three quarters of 2016,* including new controls on outbound foreign
direct investment (FDI) and cross-border capital flows. It is the Chinese government’s longstanding policy to
encourage big companies, including major SOEs, to “go out” in search of valuable assets and technology. In 2016,
total outbound Chinese FDI reached $170.1, 93 with SOEs registering a number of high-profile acquisitions,
including a $43 billion bid for Swiss pesticides and seeds group Syngenta by the state-owned ChemChina. However,
the pace of capital outflow has spooked Chinese regulators, who have introduced a number of measures to stem
capital outflows.
Negative list for outbound FDI by SOEs: The State-Owned Assets Supervision and Administration
Commission (SASAC), which administers China’s central-government SOEs, announced it would create a
“negative list” for projects in which SOEs should not invest. 94 While SASAC has not yet released the list,
it indicated SOEs should focus on pursuing deals in their “core business areas,” that improve their
competitiveness and “innovative capabilities,” among other goals.95
Tightened regulations for financial institutions: The China Banking Regulatory Commission (CBRC)
instructed commercial banks to increase their risk and compliance management for outbound investment
projects, bolster anti-money laundering supervision, and strengthen due diligence and post-loan
management.96
U.S. dollar-denominated bonds: According to Reuters, the People’s Bank of China (PBOC), China’s
central bank, gave oral guidance to banks to issue more U.S. dollar-denominated bonds.97 Analysts believe
the PBOC wants to limit RMB depreciation by keeping U.S. dollars in China rather than flowing into
investments offshore.
* For more on Chinese capital outflows, see U.S.-China Economic and Security Review Commission, Economics and Trade Bulletin,
January 9, 2017, 6–9. http://origin.www.uscc.gov/sites/default/files/trade_bulletins/Jan%202017%20TB_1.9.17_FINAL.pdf.
-20%
-10%
0%
10%
20%
30%
40%
50%
60%
Q1 Q2 Q3 Q4 Q1 Q2 Q3 Q4 Q1 Q2 Q3 Q4 Q1 Q2 Q3 Q4
2013 2014 2015 2016
Exports Imports

U.S.-China Economic and Security Review Commission 14
Bar on net RMB outflows: The Financial Times reported that Chinese regulators have introduced new
rules that require banks in key cities to prevent net outflows of the RMB. Banks in Shanghai must “import”
the same amount of RMB as is remitted overseas by a client, ensuring no net outflows, while banks in
Beijing must “import” more RMB than is remitted overseas, ensuring a net inflow of capital.98
Bitcoin crackdown: In January, the PBOC met with China’s three largest bitcoin exchanges, urging them
to follows regulations “strictly” and “clean up” any irregularities, apparently prompted by the fear that
Chinese investors were using the cryptocurrency to transfer large amounts of capital out of China.99 Caixin,
a well-regarded financial news publication, reported that PBOC regulators instructed two of the exchanges
not to mention RMB depreciation in their marketing materials.100 On January 23, four Chinese bitcoin
exchanges announced they will begin charging a 0.2 percent transaction fee, apparently in response to the
PBOC admonition.101 The transaction fee is expected to cut down on speculative investment in bitcoin and
address some of the capital flight fears.
MSCI, a stock index provider, has indicated the Chinese government’s restrictions on free movement of capital out
of the country put in jeopardy potential inclusion of Chinese stocks in its emerging markets benchmark.102 In June
2016, MSCI declined to include China’s A-shares in its emerging markets index for the third year in a row due to
persistent concerns over restrictions on capital flows.103
Though the Chinese government’s attempts to stem capital outflows are starting to pay off, they are harming its
efforts to promote the RMB as an international currency. As regulators close loopholes and tighten restrictions, the
use of the RMB for settling cross-border trade and outbound foreign direct investment (ODI) has plummeted (see
Figure 13).
Figure 13: RMB Cross-Border Trade and ODI Settlement, 2015–2016
Source: People’s Bank of China via CEIC database.
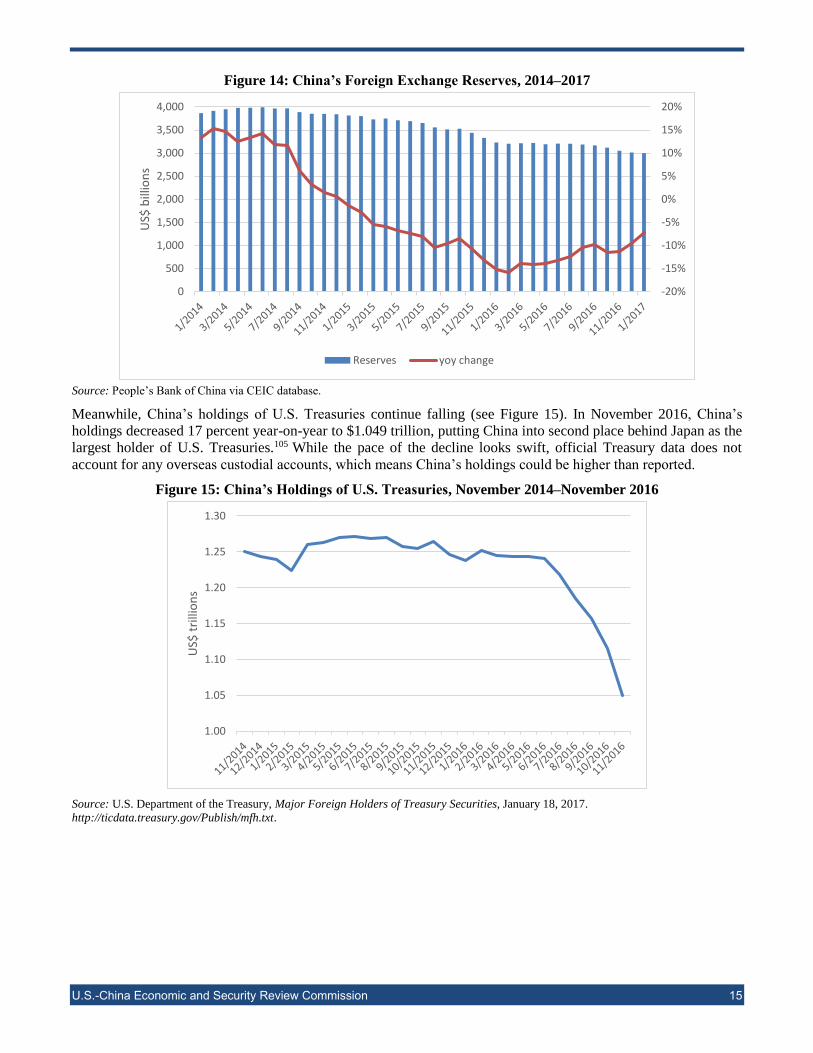
At the same time, the fall in China’s foreign exchange reserves appears to be slowing down. In January 2017,
China’s reserves dropped to $2.998 trillion, the lowest pace of decline year-on-year since July 2015 (see Figure
14).104
0
50
100
150
200
250
0
100
200
300
400
500
600
700
800
RM
B b
illio
ns
RM
B b
illio
ns
Trade settlement (LHS) ODI settlement (RHS)
U.S.-China Economic and Security Review Commission 15
Figure 14: China’s Foreign Exchange Reserves, 2014–2017
Source: People’s Bank of China via CEIC database.
Meanwhile, China’s holdings of U.S. Treasuries continue falling (see Figure 15). In November 2016, China’s
holdings decreased 17 percent year-on-year to $1.049 trillion, putting China into second place behind Japan as the
largest holder of U.S. Treasuries.105 While the pace of the decline looks swift, official Treasury data does not
account for any overseas custodial accounts, which means China’s holdings could be higher than reported.
Figure 15: China’s Holdings of U.S. Treasuries, November 2014–November 2016
Source: U.S. Department of the Treasury, Major Foreign Holders of Treasury Securities, January 18, 2017.
http://ticdata.treasury.gov/Publish/mfh.txt.
-20%
-15%
-10%
-5%
0%
5%
10%
15%
20%
0
500
1,000
1,500
2,000
2,500
3,000
3,500
4,000
US$
bill
ion
s
Reserves yoy change
1.00
1.05
1.10
1.15
1.20
1.25
1.30
US$
tri
llio
ns

U.S.-China Economic and Security Review Commission 16
China Directs Companies to Crack Down on Virtual Private Networks (VPNs),
Provides Funds for Internet Companies and Digital Infrastructure
As part of a 14-month effort to “clean up and regulate the Internet service access market,” China’s Ministry of
Industry and Information Technology (MIIT) directed Chinese Internet providers to remove users of VPNs *
operating without the consent of Chinese telecommunication authorities.106 According to a statement from MIIT,
domestic Internet providers must investigate the usage of their networks to make sure clients do not use VPNs “to
conduct cross-border business activities” without approval from the Chinese government.107 While Chinese law
already requires individuals and businesses in China to seek permission from the government to use VPNs, this new
statement effectively charges Chinese Internet companies with enforcement of VPN registration and may hold them
accountable for failing to do so.108
Given the tight control the Chinese government exerts over Internet access, many Chinese Internet users turn to
VPNs as a way to access material blocked by Chinese censors. According to censorship watchdog GreatFire.org,
China currently blocks 171 of the 1,000 most visited websites internationally—including Google, YouTube, and
Facebook—and in total denies access to at least 80,600 sites.109 Use of VPNs in China is relatively widespread; a
survey in 2016 reported that 28 percent of Chinese adult Internet users have used a VPN.110 To the extent that these
VPNs are used to access material blocked by the Chinese government or communicate privately without the
surveillance of government censors, they are unlikely to be registered with the Chinese government.
The enlistment of Chinese Internet companies in removing access to unauthorized VPNs adds another tool to the
Chinese government’s methods for restricting VPN use. As many VPN providers are located overseas, the Chinese
government can throttle down bandwidth to connections outside of China or may block or redirect access to IP
addresses and domain names associated with VPN providers.111 Historically, the Chinese government has cracked
down on VPN use during important political events such as the 70th anniversary celebration of the end of World
War II in 2015 or the meeting of the National People’s Congress in 2016.112 Internet analysts expect a similar
crackdown in 2017 as the Communist Party of China meets to restructure its leadership at the 19th Party Congress.113
The new measure also continues a trend of the Chinese government utilizing private companies to consolidate its
control over online content. In January 2017, Apple removed the New York Times app from its online store in China,
closing one of the few ways to access the news site from the Mainland, and in 2016, Facebook—in a bid to gain
access to China’s market—reportedly created software that would allow the Chinese government to control content
appearing in Chinese users’ Facebook feeds.114
The degree to which the new VPN control measure will target businesses or individuals is not clear. On the one
hand, the South China Morning Post reports suggest individuals may not be affected, citing a statement from a
prominent Chinese VPN provider that registered VPN use is still legal in China.115 On the other hand, Lester Ross,
a Beijing-based attorney who advises U.S. tech companies and other experts cited by the Washington Post, argue
the measure suggests China is willing to tolerate the registered use of VPNs by companies for business purposes
but not by individuals seeking to circumvent online censorship. 116 The language of the MIIT statement is
ambiguous, citing the necessity of approval for “information channels to conduct cross-border business
activities.”117 As such, the scope of the new measure will likely depend on how it is enforced.
Businesses use VPNs to protect sensitive communication and data transfer from interception and may use them to
access digital services blocked by China’s firewall. As noted in AmCham China’s 2017 Business Climate Survey,
blocked access to online tools is a growing problem for U.S. businesses in China.118 In 2017, 92 percent of surveyed
firms in China reported that the inability to access certain online tools negatively affected their business, up from
71 percent in 2016.119 Additionally, 87 percent of reporting U.S. businesses said that China’s Internet censorship
had harmed their business in 2017, an increase from 79 percent in 2016.120
As China seeks tighter control over Internet access, it also created two new initiatives to support domestic Internet
companies. On January 22, the Chinese government announced it had launched an Internet investment fund to be
run by the Ministry of Finance and Cyberspace Administration of China.121 According to state media, the fund will
* A virtual private network is an online connection secured through encryption that ensures communication between two computers cannot
read by outside parties. It can be used to ensure privacy protection or to access websites blocked by Internet regulators. Webopedia.com,
“VPN—Virtual Private Network.” http://www.webopedia.com/TERM/V/VPN.html.

U.S.-China Economic and Security Review Commission 17
total more than $14.5 billion and will be used to purchase equity stakes in Chinese Internet firms to make them
“bigger and stronger.”122 Much of the funding will come from Chinese state banks and telecommunication firms,
with Industrial Commercial Bank of China, China Mobile, and China Unicom providing an initial $4.4 billion in
investment.123 Additionally, Chinese state banks will provide debt financing to domestic Internet companies. China
Development Bank, the Agricultural Bank of China, and the Industrial Commercial Bank of China have made $21.7
billion in credit lines available to Chinese Internet firms.124
The Chinese government also announced new funding to improve the country’s Internet infrastructure. On January
13, the National Development and Reform Commission committed $170 billion to expanding Internet coverage
over the next three years.125 The funds will be directed to constructing 2 million new 4G base stations, 90,000
kilometers of high-speed fiber optic cables, and a 50 percent increase in the number or points of presence connected
to overseas networks*—from 80 to 120.126 This new infrastructure is intended to connect all urban spaces and 95
percent of rural areas to broadband Internet access by 2018 and boost the number of Chinese mobile users to 75
percent of the population.127 If successful, these targets would significantly increase China’s Internet connectivity.
As of 2015, only 19 percent of the Chinese population had a broadband subscription, and 43 percent of the
population accessed the Internet through a mobile device.128
Sector Focus: China’s Overproduction Continues to Harm the
U.S. Aluminum Sector Strong Chinese government support for its domestic aluminum sector has created vast overproduction, lowering
global prices and squeezing the profitability of U.S. and other foreign aluminum firms. U.S. and other global
aluminum companies have restructured and cut back production to minimize financial losses, leaving the United
States with only one aluminum smelter operating at full capacity in 2017.129 The U.S. Department of Commerce
(DOC) has sought to address China’s unfair trade practices by applying antidumping and countervailing duties on
specific Chinese aluminum products, but improper labeling and transshipping of products are circumventing these
protections. In addition, the unwillingness of the Chinese government to eliminate subsidies for its aluminum
industries—despite the U.S. government raising its concerns at four bilateral meetings—led the Office of the U.S.
Trade Representative (USTR) to request consultations at the World Trade Organization (WTO) in January 2017
challenging China’s subsidies to its primary aluminum firms.130
Chinese Excess Production
To meet its rising domestic demand and support employment, China’s government has been subsidizing the
domestic aluminum sector through direct grants, interest-free loans, transfers of low-cost state-owned land, and
preferential regulatory treatment.131 For example, Aluminum Corporation of China Limited (Chalco),† the world’s
largest aluminum producer, received $257.1 million (RMB 1.77 billion) in government grants in 2015 alone.132
With government support, Chinese aluminum producers expanded capacity by around 243 percent from 2007 to
2015 despite a 46 percent decline in global prices over that period.133 China’s aluminum production also grew over
tenfold from 2.8 million metric tons in December 2000 to 28.9 million metric tons in December 2016 (Figure 16).134
In December 2016, China accounted for 56.1 percent of global aluminum production, a sharp increase from the
13.2 percent global share it held in December 2000. 135
* A point of presence is an access point that connects Internet users associated with a certain network (such as an Internet service provider)
with other networks on the Internet more broadly. Network Encyclopedia, “Point of Presence (POP).”
http://www.thenetworkencyclopedia.com/entry/point-of-presence-pop/. † Chalco was established in September 2001 as a joint stock company. Its parent and holding company is the Aluminum Corporation of
China (Chinalco), which is wholly owned by the State-Owned Assets Supervision and Administration of the State Council. Aluminum
Corporation of China Limited, “2014 Annual Report.” http://www.chalco.com.cn/zlgfen/rootfiles/2015/04/23/1429749255321579-
1429749255323762.pdf.
U.S.-China Economic and Security Review Commission 18
Figure 16: World Aluminum Production by Amount, 2000–2016
Note: Data are monthly figures.
Source: International Aluminum Institute, “Primary Aluminum Production,” World Aluminum, January 23, 2017. http://www.world-
aluminium.org/statistics/.
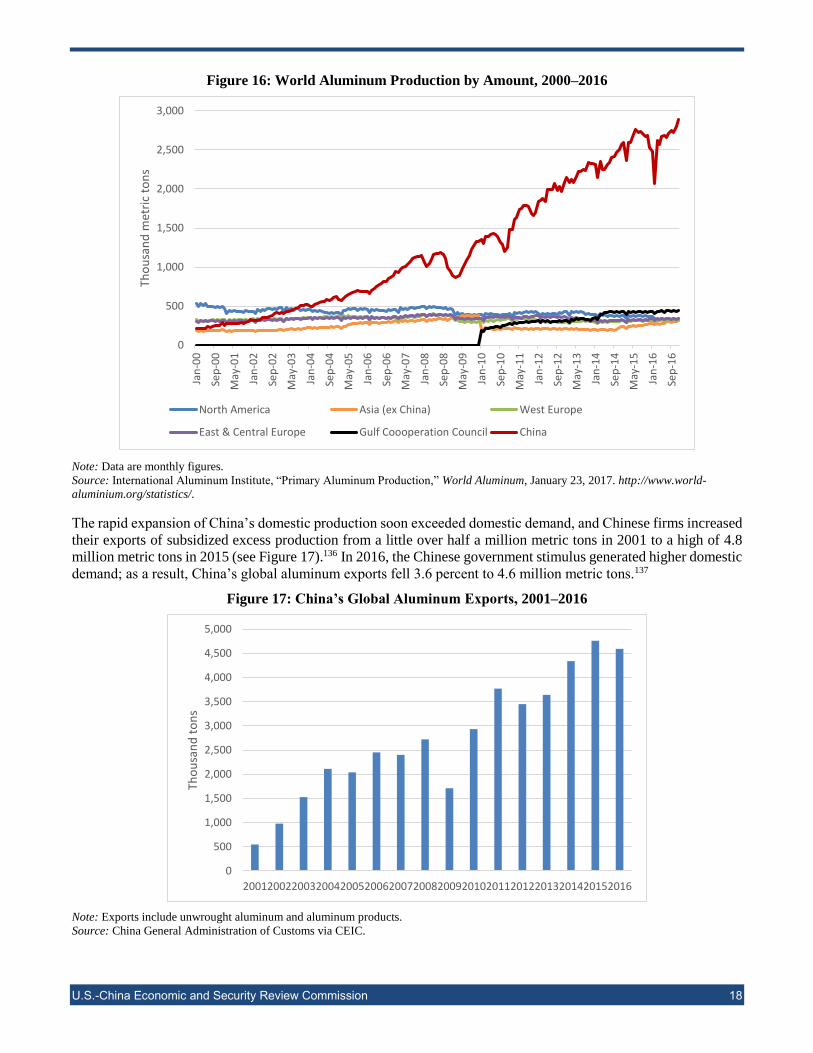
The rapid expansion of China’s domestic production soon exceeded domestic demand, and Chinese firms increased
their exports of subsidized excess production from a little over half a million metric tons in 2001 to a high of 4.8
million metric tons in 2015 (see Figure 17).136 In 2016, the Chinese government stimulus generated higher domestic
demand; as a result, China’s global aluminum exports fell 3.6 percent to 4.6 million metric tons.137
Figure 17: China’s Global Aluminum Exports, 2001–2016
Note: Exports include unwrought aluminum and aluminum products.
Source: China General Administration of Customs via CEIC.
0
500
1,000
1,500
2,000
2,500
3,000
Jan
-00
Sep
-00
May
-01
Jan
-02
Sep
-02
May
-03
Jan
-04
Sep
-04
May
-05
Jan
-06
Sep
-06
May
-07
Jan
-08
Sep
-08
May
-09
Jan
-10
Sep
-10
May
-11
Jan
-12
Sep
-12
May
-13
Jan
-14
Sep
-14
May
-15
Jan
-16
Sep
-16
Tho
usa
nd
met
ric
ton
s
North America Asia (ex China) West Europe
East & Central Europe Gulf Coooperation Council China
0
500
1,000
1,500
2,000
2,500
3,000
3,500
4,000
4,500
5,000
2001200220032004200520062007200820092010201120122013201420152016
Tho
usa
nd
to
ns
U.S.-China Economic and Security Review Commission 19
Chinese Exports and Subsidized Production Weaken U.S. Smelters
The combined impact of higher electricity costs and low prices from the influx of subsidized Chinese exports to the
global market is putting U.S. smelters out of business and forcing U.S. firms such as Alcoa to transition to more
high-end products such as high-grade aluminum for automobiles and airplanes.138 The number of U.S. aluminum
smelters fell from 14 in 2011 to 5 in 2016, with only 1 operating at full capacity.139 These closures and curtailments
led to the number of U.S. jobs in alumina refining and primary aluminum to plummet from 12,787 jobs in 2013 to
5,376 in 2016.140
From 2012 to 2015, U.S. imports of semifabricated aluminum products from China increased 183 percent, according
to data from the Aluminum Association, the U.S. aluminum industry trade group.141 In response to the deluge of
subsidized Chinese imports into the United States, the DOC applied antidumping duties ranging between 32.8
percent and 33.3 percent and countervailing duties between 8 percent and 374.2 percent at the time of transaction
on specific Chinese aluminum extrusions beginning in March 2011.142
However, some Chinese companies circumvented these duties by transshipping production through a third country
or labeling shipments improperly.143 In 2014, U.S. aluminum firms uncovered an almost 1 million metric ton
aluminum stockpile—nearly 6 percent of the world’s inventory—in Mexico.144 The U.S. Aluminum Extruders
Council, a U.S. trade association, later connected this stockpile to the Chinese firm Zhongwang Holdings Ltd., the
world’s second-largest producer of aluminum extrusions.145 In October 2015, they filed a petition with the DOC
against Zhongwang Holdings Ltd. for systematically and illegally evading duties on aluminum extrusions,146 and in
March 2016 the DOC initiated an investigation against Zhongwang Holdings Ltd. and eight of its affiliates to
determine if these Chinese firms were evading the 2011 antidumping and countervailing duties.147
The Aluminum Extruders Council presented the stockpile as part of their evidence to the DOC148 and publicly
released their findings to the Wall Street Journal in September 2016.149 Zhongwang Holdings Ltd. denies any
allegations.150 Shortly after this stockpile was publicly revealed, most of the aluminum was moved to Vietnam,
another major transshipment point to the United States.151 In December 2016, the DOC found that Zhongwang
Holdings Ltd. was illegally transshipping aluminum extrusions into the United States through Mexico and Vietnam
to avoid the 374.2 percent duties.152 In January 2017 at the Port of Long Beach in California, the U.S. Department
of Homeland Security seized $25 million worth of suspected aluminum from the U.S. firm Perfectus Aluminum
Inc., a firm with close links to the owner of Zhongwang Holdings Ltd.153
Beyond stricter enforcement of duty evasion, the United States has raised its concerns with China over China’s
subsidies to its aluminum sectors at several meetings, including the U.S.-China Joint Commission on Commerce
and Trade meeting in November 2015; the U.S.-China Strategic and Economic Dialogue meeting in June 2016; a
meeting between President Barack Obama and Chinese President and General Secretary of the Chinese Communist
Party Xi Jinping in Hangzhou, China in September 2016; and the November 2016 Joint Commission on Commerce
and Trade meeting.154 However, these discussions have not resulted in meaningful changes to Chinese government
policy.
In January 2017, the USTR requested consultations with China at the WTO regarding China’s subsidies to its
primary aluminum producers since 2007.155 The United States alleges the Chinese government has provided low-
cost financing and inputs to its primary aluminum producers, which displaced and impeded U.S. imports of primary
aluminum into China and the global market, suppressed global prices, and increased China’s global market share.156
The request for consultations is the first step in the dispute settlements process.
For inquiries, please contact a member of our economics and trade team (Nargiza Salidjanova,
[email protected]; Bart Carfagno, [email protected]; Michelle Ker, [email protected]; Katherine Koleski,
[email protected]; Sean O’Connor, [email protected]; or Matt Snyder, [email protected]).

U.S.-China Economic and Security Review Commission 20
Disclaimer: The U.S.-China Economic and Security Review Commission was created by Congress to report on the
national security implications of the bilateral trade and economic relationship between the United States and the People’s
Republic of China. For more information, visit www.uscc.gov or join the Commission on Facebook!
This report is the product of professional research performed by the staff of the U.S.-China Economic and Security
Review Commission, and was prepared at the request of the Commission to support its deliberations. Posting of the report
to the Commission’s website is intended to promote greater public understanding of the issues addressed by the
Commission in its ongoing assessment of U.S.-China economic relations and their implications for U.S. security, as
mandated by Public Law 106-398 and Public Law 113-291. However, it does not necessarily imply an endorsement by
the Commission, any individual Commissioner, or the Commission’s other professional staff, of the views or conclusions
expressed in this staff research report.
Endnotes
1 U.S. Census Bureau. (Washington, DC: U.S. Department of Commerce, Foreign Trade Division, December 2016).
http://www.census.gov/foreign-trade/balance/c5700.html. 2 U.S. Census Bureau. (Washington, DC: U.S. Department of Commerce, Foreign Trade Division, December 2016).
http://www.census.gov/foreign-trade/balance/c5700.html. 3 U.S. Census Bureau. (Washington, DC: U.S. Department of Commerce, Foreign Trade Division, December 2016).
http://www.census.gov/foreign-trade/balance/c5700.html. 4 U.S. Census Bureau. (Washington, DC: U.S. Department of Commerce, Foreign Trade Division, December 2016).
http://www.census.gov/foreign-trade/balance/c5700.html. 5 U.S. Census Bureau. (Washington, DC: U.S. Department of Commerce, Foreign Trade Division, December 2016).
http://www.census.gov/foreign-trade/balance/c5700.html. 6 U.S. Census Bureau. (Washington, DC: U.S. Department of Commerce, Foreign Trade Division, December 2016).
http://www.census.gov/foreign-trade/balance/c5700.html. 7 U.S. Census Bureau. (Washington, DC: U.S. Department of Commerce, Foreign Trade Division, December 2016).
http://www.census.gov/foreign-trade/balance/c5700.html. 8 U.S. Census Bureau. (Washington, DC: U.S. Department of Commerce, Foreign Trade Division, December 2016).
http://www.census.gov/foreign-trade/balance/c5700.html. 9 U.S. Census Bureau. (Washington, DC: U.S. Department of Commerce, Foreign Trade Division, December 2016).
http://www.census.gov/foreign-trade/balance/c5700.html. 10 U.S. Census Bureau. (Washington, DC: U.S. Department of Commerce, Foreign Trade Division, December 2016).
http://www.census.gov/foreign-trade/balance/c5700.html. 11 U.S. Census Bureau. (Washington, DC: U.S. Department of Commerce, Foreign Trade Division, December 2016). 12 U.S. Census Bureau. (Washington, DC: U.S. Department of Commerce, Foreign Trade Division, December 2016). 13 U.S. Census Bureau. (Washington, DC: U.S. Department of Commerce, Foreign Trade Division, December 2016). 14 U.S. Census Bureau. (Washington, DC: U.S. Department of Commerce, Foreign Trade Division, December 2016). 15 U.S. Census Bureau. (Washington, DC: U.S. Department of Commerce, Foreign Trade Division, December 2016). 16 U.S. Census Bureau. (Washington, DC: U.S. Department of Commerce, Foreign Trade Division, December 2016). 17 U.S. Census Bureau. (Washington, DC: U.S. Department of Commerce, Foreign Trade Division, December 2016). 18 U.S. Census Bureau. (Washington, DC: U.S. Department of Commerce, Foreign Trade Division, December 2016).
http://www.census.gov/foreign-trade/statistics/product/atp/2016/06/ctryatp/atp5700.html. 19 U.S. Census Bureau. (Washington, DC: U.S. Department of Commerce, Foreign Trade Division, December 2016).
http://www.census.gov/foreign-trade/statistics/product/atp/2016/06/ctryatp/atp5700.html. 20 U.S. Census Bureau. (Washington, DC: U.S. Department of Commerce, Foreign Trade Division, December 2016).
http://www.census.gov/foreign-trade/statistics/product/atp/2016/06/ctryatp/atp5700.html. 21 U.S. Census Bureau. (Washington, DC: U.S. Department of Commerce, Foreign Trade Division, December 2016).
http://www.census.gov/foreign-trade/statistics/product/atp/2016/06/ctryatp/atp5700.html. 22 U.S. Department of Commerce, Bureau of Economic Analysis, Table 1.3 U.S. International Transactions, Expanded Detail by Area and
Country, December 15, 2016. 23 U.S. Department of Commerce, Bureau of Economic Analysis, Table 1.3 U.S. International Transactions, Expanded Detail by Area and
Country, December 15, 2016. 24 U.S. Department of Commerce, Bureau of Economic Analysis, Table 1.3 U.S. International Transactions, Expanded Detail by Area and
Country, December 15, 2016. 25 U.S. Department of Commerce, Bureau of Economic Analysis, Table 1.3 U.S. International Transactions, Expanded Detail by Area and
Country, December 15, 2016.

U.S.-China Economic and Security Review Commission 21
26 U.S. Department of Commerce, Bureau of Economic Analysis, Table 1.3 U.S. International Transactions, Expanded Detail by Area and
Country, December 15, 2016. 27 U.S. Department of Commerce, Bureau of Economic Analysis, Table 1.3 U.S. International Transactions, Expanded Detail by Area and
Country, December 15, 2016. 28 U.S. Department of Commerce, Bureau of Economic Analysis, Table 1.3 U.S. International Transactions, Expanded Detail by Area and
Country, December 15, 2016. 29 U.S. Department of Commerce, Bureau of Economic Analysis, Table 1.3 U.S. International Transactions, Expanded Detail by Area and
Country, December 15, 2016. 30 American Chamber of Commerce in the People’s Republic of China, “2017 China Business Climate Survey Report.”
http://www.amchamchina.org/uploads/media/default/0001/06/990dc2c671441d882586cc05ded6dde7e261fa0e.pdf. 31 American Chamber of Commerce in the People’s Republic of China, “2017 China Business Climate Survey Report.”
http://www.amchamchina.org/uploads/media/default/0001/06/990dc2c671441d882586cc05ded6dde7e261fa0e.pdf. 32 American Chamber of Commerce in the People’s Republic of China, “2016 China Business Climate Survey Report.”
http://www.bain.com/Images/2016_China_Business_Climate_Survey_Report.pdf. 33 American Chamber of Commerce in the People’s Republic of China, “2017 China Business Climate Survey Report.”
http://www.amchamchina.org/uploads/media/default/0001/06/990dc2c671441d882586cc05ded6dde7e261fa0e.pdf. 34 American Chamber of Commerce in the People’s Republic of China, “2016 China Business Climate Survey Report.”
http://www.bain.com/Images/2016_China_Business_Climate_Survey_Report.pdf; American Chamber of Commerce in the People’s
Republic of China, “2017 China Business Climate Survey Report.”
http://www.amchamchina.org/uploads/media/default/0001/06/990dc2c671441d882586cc05ded6dde7e261fa0e.pdf. 35 American Chamber of Commerce in the People’s Republic of China, “2017 China Business Climate Survey Report.”
http://www.amchamchina.org/uploads/media/default/0001/06/990dc2c671441d882586cc05ded6dde7e261fa0e.pdf. 36 American Chamber of Commerce in the People’s Republic of China, “2017 China Business Climate Survey Report.”
http://www.amchamchina.org/uploads/media/default/0001/06/990dc2c671441d882586cc05ded6dde7e261fa0e.pdf. 37 American Chamber of Commerce in the People’s Republic of China, “2017 China Business Climate Survey Report.”
http://www.amchamchina.org/uploads/media/default/0001/06/990dc2c671441d882586cc05ded6dde7e261fa0e.pdf. 38 American Chamber of Commerce in the People’s Republic of China, “2017 China Business Climate Survey Report.”
http://www.amchamchina.org/uploads/media/default/0001/06/990dc2c671441d882586cc05ded6dde7e261fa0e.pdf. 39 American Chamber of Commerce in the People’s Republic of China, “2017 China Business Climate Survey Report.”
http://www.amchamchina.org/uploads/media/default/0001/06/990dc2c671441d882586cc05ded6dde7e261fa0e.pdf. 40 American Chamber of Commerce in the People’s Republic of China, “2017 China Business Climate Survey Report.”
http://www.amchamchina.org/uploads/media/default/0001/06/990dc2c671441d882586cc05ded6dde7e261fa0e.pdf. 41 U.S. Chamber of Commerce, “Competing Interests in China’s Competition Law Enforcement: China’s Anti-Monopoly Law Application
and the Role of Industrial Policy,” August 31, 2014. https://www.uschamber.com/sites/default/files/aml_final_090814_final_locked.pdf. 42 American Chamber of Commerce in the People’s Republic of China, “2017 China Business Climate Survey Report.”
http://www.amchamchina.org/uploads/media/default/0001/06/990dc2c671441d882586cc05ded6dde7e261fa0e.pdf. 43 Fran Wang, “China’s Labor Costs to Rise Nearly 9% in 2016, Think Tank Says,” Caixin, November 18, 2016.
http://english.caixin.com/2016-11-18/101009068.html. 44 Wu Yan, “China’s Labor Market: Shrinking Workforce, Rising Wages,” China Daily, November 11, 2016.
http://www.chinadaily.com.cn/china/2016-11/21/content_27444998.htm. 45 Dan Steinbock, “China’s Labor Market Adaptation to Slower Growth,” Economy Watch, March 3, 2015.
http://www.economywatch.com/features/Chinas-Labor-Market-Adaptation-to-Slower-Growth.03-03-15.html. 46 Wu Yan, “China’s Labor Market: Shrinking Workforce, Rising Wages,” China Daily, November 11, 2016.
http://www.chinadaily.com.cn/china/2016-11/21/content_27444998.htm. 47 Fran Wang, “China’s Labor Costs to Rise Nearly 9% in 2016, Think Tank Says,” Caixin, November 18, 2016.
http://english.caixin.com/2016-11-18/101009068.html. 48 Fran Wang, “China's Labor Costs to Rise Nearly 9% in 2016, Think Tank Says,” Caixin, November 18, 2016.
http://english.caixin.com/2016-11-18/101009068.html. 49 Economist, “A Tightening Grip,” March 14, 2015. http://www.economist.com/news/briefing/21646180-rising-chinese-wages-will-only-
strengthen-asias-hold-manufacturing-tightening-grip. 50 American Chamber of Commerce in the People’s Republic of China, “2017 China Business Climate Survey Report.”
http://www.amchamchina.org/uploads/media/default/0001/06/990dc2c671441d882586cc05ded6dde7e261fa0e.pdf. 51 American Chamber of Commerce in the People’s Republic of China, “2016 China Business Climate Survey Report.”
http://www.bain.com/Images/2016_China_Business_Climate_Survey_Report.pdf. 52 American Chamber of Commerce in the People’s Republic of China, “2017 China Business Climate Survey Report.”
http://www.amchamchina.org/uploads/media/default/0001/06/990dc2c671441d882586cc05ded6dde7e261fa0e.pdf. 53 American Chamber of Commerce in the People’s Republic of China, “2016 China Business Climate Survey Report.”
http://www.bain.com/Images/2016_China_Business_Climate_Survey_Report.pdf. 54 Margaux Schreurs, “How China’s Internet Censorship Affects Foreign Business,” Global Risk Insights, February 26, 2015.
http://globalriskinsights.com/2015/02/how-chinas-internet-censorship-affects-foreign-business/. 55 American Chamber of Commerce in the People’s Republic of China, “2016 China Business Climate Survey Report.”
http://www.bain.com/Images/2016_China_Business_Climate_Survey_Report.pdf; American Chamber of Commerce in the People’s
Republic of China, “2017 China Business Climate Survey Report.”
http://www.amchamchina.org/uploads/media/default/0001/06/990dc2c671441d882586cc05ded6dde7e261fa0e.pdf.
U.S.-China Economic and Security Review Commission 22
56 American Chamber of Commerce in the People’s Republic of China, “2017 China Business Climate Survey Report.”
http://www.amchamchina.org/uploads/media/default/0001/06/990dc2c671441d882586cc05ded6dde7e261fa0e.pdf. 57 China’s National Bureau of Statistics via CEIC database. 58 China’s National Bureau of Statistics via CEIC database; Gabriel Wildau, “China GDP Hits 2016 Target as Trump Headwinds Loom,”
Financial Times, January 20, 2017. https://www.ft.com/content/3533b1b0-ddfb-11e6-9d7c-be108f1c1dce. 59 China’s National Bureau of Statistics via CEIC database. 60 Kevin Yao, “China to Target around 6.5 Percent Growth in 2017: Sources,” Reuters, January 25, 2017.
http://www.reuters.com/article/us-china-growth-idUSKBN1501G6; Xinhua, “Six Key Areas to Watch on China’s Economy in 2017,”
December 31, 2016. http://news.xinhuanet.com/english/2016-12/31/c_135946645.htm. 61 Song Shiqing, “What’s Behind China’s Mass Fabrication of Official Figures?” Caixin, January 19, 2017.
http://www.caixinglobal.com/2017-01-19/101046909.html; Fran Wang, “Liaoning Government Admits False Growth Data from 2011-
14,” Caixin, January 18, 2017. www.caixinglobal.com/2017-01-18/101046468.html; and Tom Hancock, “China Province Admits
Falsifying Fiscal Data,” Financial Times, January 18, 2017. https://www.ft.com/content/b25d1b32-dd37-11e6-9d7c-be108f1c1dce. 62 Gabriel Wildau, “China Statistics Chief Admits Some Economic Data Are False,” Financial Times, December 8, 2016.
https://www.ft.com/content/0361c1a4-bcfe-11e6-8b45-b8b81dd5d080. 63 Keith Bradsher, “China’s Economy Grows Strongly, Yet Central Banks Eases Policy,” New York Times, January 19, 2017.
https://www.nytimes.com/2017/01/19/business/china-gdp-economic-growth.html. 64 Kevin Yao, “China 2016 Fixed Asset Investment Grows 8.1 Pct, Slowest since 1999,” Reuters, January 19, 2017.
http://www.reuters.com/article/china-economy-activity-idUSB9N1EZ018. 65 China’s National Bureau of Statistics via CEIC database. 66 Hudson Lockett, “China Retail Sales Accelerate but Industry Output, Investment Slower,” Financial Times, January 20, 2017.
https://www.ft.com/content/087e88b7-ef01-3e16-900b-c94878affa53. 67 China Daily, “Chinese SOEs Profits Edge up in 2016,” January 26, 2017. http://www.chinadaily.com.cn/business/2017-
01/26/content_28062676.htm; Elias Glenn and Lusha Zhang, “China’s 2016 Industrial Profits Rise Most in Three Years on Commodities
Recovery,” Reuters, January 26, 2017. http://uk.reuters.com/article/uk-china-economy-industrial-profits-idUKKBN15A06L. 68 Gordon G. Chang, “China Consumption Growth Down--And Heading Lower Fast,” Forbes, January 22, 2017.
www.forbes.com/sites/gordonchang/2017/01/22/china-consumption-growth-down-and-heading-lower-fast/#7602e9aa4947. 69 Gordon G. Chang, “China Consumption Growth Down--And Heading Lower Fast,” Forbes, January 22, 2017.
www.forbes.com/sites/gordonchang/2017/01/22/china-consumption-growth-down-and-heading-lower-fast/#7602e9aa4947. 70 Keith Bradsher, “China’s Economy Grows Strongly, Yet Central Banks Eases Policy,” New York Times, January 19, 2017.
https://www.nytimes.com/2017/01/19/business/china-gdp-economic-growth.html. 71 China Daily, “China's Personal Income Rises 6.3% in 2016,” January 20, 2017. www.chinadaily.com.cn/business/2017-
01/20/content_28010029.htm. 72 Yawen Chen, Elias Glenn, and Kevin Yao, “China’s Property, Financial Sectors’ Growth Slower in Q4 Despite Uptick in Services,”
Reuters, January 22, 2017. http://www.reuters.com/article/us-china-economy-gdp-idUSKBN1560BQ. 73 China’s National Bureau of Statistics via CEIC database. 74 Yawen Chen, Elias Glenn, and Kevin Yao, “China’s Property, Financial Sectors’ Growth Slower in Q4 Despite Uptick in Services,”
Reuters, January 22, 2017. http://www.reuters.com/article/us-china-economy-gdp-idUSKBN1560BQ. 75 Caixin Purchasing Managers’ Index, “Caixin China General Services PMI,” December 5, 2016.
https://www.markiteconomics.com/Survey/PressRelease.mvc/532a73daeda94135a474d967e5bea006; Caixin Purchasing Managers’
Index, “Caixin China General Services PMI,” November 3, 2016.
https://www.markiteconomics.com/Survey/PressRelease.mvc/a472974d580444bd95a6aa45e9363881. 76 Elias Glenn, “China Services Sector Activity Rises to 17-Month High in December: Caixin PMI,” Reuters, January 4, 2017.
http://www.reuters.com/article/us-china-economy-pmi-services-caixin-idUSKBN14P05A. 77 Caixin Purchasing Managers’ Index, “Caixin China General Services PMI,” December 5, 2016.
https://www.markiteconomics.com/Survey/PressRelease.mvc/532a73daeda94135a474d967e5bea006; Caixin Purchasing Managers’
Index, “Caixin China General Services PMI,” November 3, 2016.
https://www.markiteconomics.com/Survey/PressRelease.mvc/a472974d580444bd95a6aa45e9363881. 78 Caixin Purchasing Managers’ Index, “Caixin China General Manufacturing PMI,” January 3, 2017.
https://www.markiteconomics.com/Survey/PressRelease.mvc/f932b8523bac48cba794b454c2ee02dc. 79 Caixin Purchasing Managers’ Index, “Caixin China General Manufacturing PMI,” January 3, 2017.
https://www.markiteconomics.com/Survey/PressRelease.mvc/f932b8523bac48cba794b454c2ee02dc. 80 China’s National Bureau of Statistics, China's PMI Was 51.4 Percent in December, January 4, 2017.
www.stats.gov.cn/english/PressRelease/201701/t20170104_1449789.html. 81 China’s National Bureau of Statistics via CEIC database. 82 People’s Bank of China via CEIC database; Kevin Yao, “China to Target around 6.5 Percent Growth in 2017: Sources,” Reuters, January
25, 2017. http://www.reuters.com/article/us-china-growth-idUSKBN1501G6; Xin Zhiming, “Stability and Progress to Be Economic
Keys,” China Daily, December 17, 2016. www.chinadaily.com.cn/bizchina/2016-12/17/content_27695465.htm. 83 China’s National Bureau of Statistics via CEIC database. 84 China’s National Bureau of Statistics via CEIC database. 85 Bank for International Settlements, “Total Credit to the Non-Financial Sectors,” December 2, 2016.
http://www.bis.org/statistics/totcredit.htm. 86 James Anderlini, Wang Feng, and Tom Mitchell, “Xi Jinping Delivers Robust Defense of Globalization at Davos,” Financial Times,
January 17, 2017. https://www.ft.com/content/67ec2ec0-dca2-11e6-9d7c-be108f1c1dce.

U.S.-China Economic and Security Review Commission 23
87 Xi Jinping, Speech to Davos, January 17, 2017. https://www.weforum.org/agenda/2017/01/full-text-of-xi-jinping-keynote-at-the-world-
economic-forum. 88 Elias Glenn and Sue-Lin Wong, “China Posts Worst Export Fall since 2009 as Fears of U.S. Trade War Loom,” Reuters, January 13,
2017. www.reuters.com/article/us-china-economy-trade-idUSKBN14X0FD, 89 Elias Glenn and Sue-Lin Wong, “China Posts Worst Export Fall since 2009 as Fears of U.S. Trade War Loom,” Reuters, January 13,
2017. www.reuters.com/article/us-china-economy-trade-idUSKBN14X0FD, 90 China’s General Administration of Customs via CEIC database. 91 China’s General Administration of Customs via CEIC database. 92 Kevin Yao, “China Seen Posting Steady Fourth Quarter GDP Growth of 6.7 Percent,” Reuters, January 19, 2017.
www.reuters.com/article/us-china-economy-idUSKBN15339T. 93 Han Wei and Fran Wang, “China to Issue Negative List for State Firms’ Outbound Investment,” January 19, 2017.
http://www.caixinglobal.com/2017-01-19/101046849.html. 94 Han Wei and Fran Wang, “China to Issue Negative List for State Firms’ Outbound Investment,” January 19, 2017.
http://www.caixinglobal.com/2017-01-19/101046849.html. 95 Han Wei and Fran Wang, “China to Issue Negative List for State Firms’ Outbound Investment,” January 19, 2017.
http://www.caixinglobal.com/2017-01-19/101046849.html. 96 Reuters, “China’s Banking Regulator Issues Guidelines on Outbound Investment,” January 25, 3017. http://www.reuters.com/article/us-
china-banking-risk-control-idUSKBN159106?mc_cid=fe7766b761&mc_eid=02c3d466d6. 97 Ina Zhou, “Chinese Banks Told to Issue Dollar-Denominated Debt-Sources,” Reuters, January 22, 2017. 98 Tom Mitchell et al., “China Clamps down on Banks Moving Currency Overseas,” Financial Times, January 27, 2017. 99 Gabriel Wildau, “China Probes Bitcoin Exchanges amid Capital Flight Fears,” Financial Times, January 10, 2017. 100 Gabriel Wildau, “China Probes Bitcoin Exchanges amid Capital Flight Fears,” Financial Times, January 10, 2017. 101 Joseph Adinolfi, “Bitcoin Holds above $900 as Fears of Chinese Crackdown Fade,” MarketWatch, January 24, 2017. 102 Reuters, “Exclusive: MSCI Head Expresses Concern on China Capital Controls,” January 24, 2017 103 Jennifer Hughes and Nicole Bullock, “MCSI Delays Including China A-Shares in its Indices,” Financial Times, June 15, 2016.
https://www.ft.com/content/a3681d18-3218-11e6-ad39-3fee5ffe5b5b. 104 People’s Bank of China via CEIC database. 105 U.S. Department of the Treasury, Major Foreign Holders of Treasury Securities, January 18, 2017.
http://ticdata.treasury.gov/Publish/mfh.txt. 106 ChinaLawTranslate.com, “MIIT Notice on Cleaning up and Regulating the Internet Access Service Market.”
http://www.chinalawtranslate.com/%E5%B7%A5%E4%B8%9A%E5%92%8C%E4%BF%A1%E6%81%AF%E5%8C%96%E9%83%A8
%E5%85%B3%E4%BA%8E%E6%B8%85%E7%90%86%E8%A7%84%E8%8C%83%E4%BA%92%E8%81%94%E7%BD%91%E7%
BD%91%E7%BB%9C%E6%8E%A5%E5%85%A5%E6%9C%8D%E5%8A%A1/?lang=en. 107 ChinaLawTranslate.com, “MIIT Notice on Cleaning up and Regulating the Internet Access Service Market.”
http://www.chinalawtranslate.com/%E5%B7%A5%E4%B8%9A%E5%92%8C%E4%BF%A1%E6%81%AF%E5%8C%96%E9%83%A8
%E5%85%B3%E4%BA%8E%E6%B8%85%E7%90%86%E8%A7%84%E8%8C%83%E4%BA%92%E8%81%94%E7%BD%91%E7%
BD%91%E7%BB%9C%E6%8E%A5%E5%85%A5%E6%9C%8D%E5%8A%A1/?lang=en. 108 Leonhard Weese, “What Does China’s VPN Ban Really Mean?” Forbes, January 27, 2017.
http://www.forbes.com/sites/leonhardweese/2017/01/25/what-does-chinas-vpn-ban-really-mean/#3496f64eefdc. 109 GreatFire.org, “Online Censorship in China,” https://en.greatfire.org/analyzer. 110 Katie Young, “4 Things to Know about VPN Users,” Global Web Index, February 2, 2016. https://www.globalwebindex.net/blog/4-
things-to-know-about-vpn-users. 111 Eve Xiao, “Behind the Scenes: Here’s Why Your VPN Is down in China,” TechNode, March 17, 2016.
http://technode.com/2016/03/17/behind-scenes-heres-vpn/. 112 Josh Ye, “China Tightens Great Firewall by Declaring Unauthorized VPN Services Illegal,” South China Morning Post, January 23,
2017. http://www.scmp.com/news/china/policies-politics/article/2064587/chinas-move-clean-vpns-and-strengthen-great-firewall; Josh
Horwitz, “An Initiative to ‘Clean Up’ China’s Internet Will Make It Even Harder to Jump the Great Firewall,” Quartz, January 24, 2017.
https://qz.com/893238/china-is-cracking-down-on-vpns-making-it-harder-to-jump-the-great-firewall/. 113 Josh Ye, “China Tightens Great Firewall by Declaring Unauthorized VPN Services Illegal,” South China Morning Post, January 23,
2017. http://www.scmp.com/news/china/policies-politics/article/2064587/chinas-move-clean-vpns-and-strengthen-great-firewall. 114 Katie Benner, “Apple Removes New York Times Apps from its Store in China,” New York Times, January 4, 2017.
https://www.nytimes.com/2017/01/04/business/media/new-york-times-apps-apple-china.html; Mike Isaac, “Facebook Said to Create
Censorship Tool to Get Back into China,” New York Times, November 22, 2016.
https://www.nytimes.com/2016/11/22/technology/facebook-censorship-tool-china.html. 115 Sidney Leng, “The Who, What and Why in China’s Latest VPN Crackdown,” South China Morning Post, January 26, 2017.
http://www.scmp.com/news/china/policies-politics/article/2065432/who-what-and-why-chinas-latest-vpn-crackdown. 116 Josh Horwitz, “An Initiative to ‘Clean Up’ China’s Internet Will Make It Even Harder to Jump the Great Firewall,” Quartz, January 24,
2017. https://qz.com/893238/china-is-cracking-down-on-vpns-making-it-harder-to-jump-the-great-firewall/; Emily Rauhala, “Forget
Xi’s Defense of Globalization. China Just Fortified the Great Wall,” Washington Post, January 23, 2017.
https://www.washingtonpost.com/news/worldviews/wp/2017/01/23/forget-xis-defense-of-globalization-china-just-fortified-the-great-
firewall/?tid=sm_tw&utm_term=.b574005b30bf. 117 ChinaLawTranslate.com, “MIIT Notice on Cleaning up and Regulating the Internet Access Service Market.”
http://www.chinalawtranslate.com/%E5%B7%A5%E4%B8%9A%E5%92%8C%E4%BF%A1%E6%81%AF%E5%8C%96%E9%83%A8

U.S.-China Economic and Security Review Commission 24
%E5%85%B3%E4%BA%8E%E6%B8%85%E7%90%86%E8%A7%84%E8%8C%83%E4%BA%92%E8%81%94%E7%BD%91%E7%
BD%91%E7%BB%9C%E6%8E%A5%E5%85%A5%E6%9C%8D%E5%8A%A1/?lang=en. 118 American Chamber of Commerce in the People’s Republic of China, “2017 Business Climate Report,” January 2017, 47.
http://www.amchamchina.org/about/press-center/amcham-statement/amcham-china-releases-2017-business-climate-survey; 119 American Chamber of Commerce in the People’s Republic of China, “2017 Business Climate Report,” January 2017, 47.
http://www.amchamchina.org/about/press-center/amcham-statement/amcham-china-releases-2017-business-climate-survey; American
Chamber of Commerce in the People’s Republic of China, “2016 Business Climate Report,” January 2016, 43.
http://www.bain.com/Images/2016_China_Business_Climate_Survey_Report.pdf. 120 American Chamber of Commerce in the People’s Republic of China, “2017 Business Climate Report,” January 2017, 47.
http://www.amchamchina.org/about/press-center/amcham-statement/amcham-china-releases-2017-business-climate-survey; American
Chamber of Commerce in the People’s Republic of China, “2016 Business Climate Report,” January 2016, 43.
http://www.bain.com/Images/2016_China_Business_Climate_Survey_Report.pdf. 121 Xie Yu, “China Sets up 100 Billion Yuan State Fund to Invest in the Internet,” South China Morning Post, January 22, 2017.
http://www.scmp.com/business/china-business/article/2064386/china-sets-100-billion-yuan-state-fund-invest-internet. 122 China’s Internet Investment Fund to Set up a Total Size of 100 Billion Yuan,” Xinhua, January 22, 2017.
http://news.xinhuanet.com/fortune/2017-01/22/c_1120364443.htm. 123 Xie Yu, “China Sets up 100 Billion Yuan State Fund to Invest in the Internet,” South China Morning Post, January 22, 2017.
http://www.scmp.com/business/china-business/article/2064386/china-sets-100-billion-yuan-state-fund-invest-internet. 124 Xie Yu, “China Sets up 100 Billion Yuan State Fund to Invest in the Internet,” South China Morning Post, January 22, 2017.
http://www.scmp.com/business/china-business/article/2064386/china-sets-100-billion-yuan-state-fund-invest-internet. 125 China Daily, “China to Invest 1.2 Trillion Yuan in Information Infrastructure,” January 13, 2017.
http://www.chinadaily.com.cn/business/tech/2017-01/13/content_27945298.htm. 126 China Daily, “China to Invest 1.2 Trillion Yuan in Information Infrastructure,” January 13, 2017.
http://www.chinadaily.com.cn/business/tech/2017-01/13/content_27945298.htm. 127 China Daily, “China to Invest 1.2 Trillion Yuan in Information Infrastructure,” January 13, 2017.
http://www.chinadaily.com.cn/business/tech/2017-01/13/content_27945298.htm. 128 World Bank, “Fixed Broadband Subscriptions (Per 100 People).” http://data.worldbank.org/indicator/IT.NET.BBND.P2?locations=CN;
James Griffiths, “There Are 668 Million Internet Users in China, and Almost All of Them Are Using Smartphones,” South China
Morning Post, July 23, 2015. http://www.scmp.com/tech/social-gadgets/article/1843115/there-are-668-million-internet-users-china-and-
almost-all-them. 129 Office of the U.S. Trade Representative, Obama Administration Files WTO Complaint on China’s Subsidies to Aluminum Producers,
January 17, 2017. https://ustr.gov/about-us/policy-offices/press-office/press-releases/2017/january/Obama-Administration-Files-WTO-
Complaint-China-Aluminum. 130 Office of the U.S. Trade Representative, Obama Administration Files WTO Complaint on China’s Subsidies to Aluminum Producers,
January 17, 2017. https://ustr.gov/about-us/policy-offices/press-office/press-releases/2017/january/Obama-Administration-Files-WTO-
Complaint-China-Aluminum. 131 Alex Lawson, “Aluminum Cos, Demand US Action against Chinese Subsidies,” Law360, November 2, 2015.
http://www.law360.com/articles/721873/aluminum-cos-demand-us-action-against-chinese-subsidies. 132 Andy Home, “U.S. Complaint against China’s Aluminum Sector Risks Back-Firing: Andy Home,” Reuters, January 16, 2017.
http://www.reuters.com/article/us-aluminium-trade-ahome-idUSKBN1501Y8; China Daily, “Aluminum Companies Consider
Consolidation under SOE Reform Program,” China Mining, September 6, 2015. http://en.chinamining.com.cn/News/2015-09-
06/1441503244d73599.html. 133 Office of the U.S. Trade Representative, Obama Administration Files WTO Complaint on China’s Subsidies to Aluminum Producers,
January 17, 2017. https://ustr.gov/about-us/policy-offices/press-office/press-releases/2017/january/Obama-Administration-Files-WTO-
Complaint-China-Aluminum. 134 International Aluminum Institute, “Primary Aluminum Production,” World Aluminum, October 20, 2015. http://www.world-
aluminium.org/statistics/. 135 International Aluminum Institute, “Primary Aluminum Production,” World Aluminum, October 20, 2015. http://www.world-
aluminium.org/statistics/. 136 China General Administration of Customs data via CEIC. 137 China General Administration of Customs data via CEIC; Mark O’Hara, “Why Chinese Aluminum Production Still Matters for Alcoa,”
Market Realist, January 5, 2017. http://marketrealist.com/2017/01/why-chinese-aluminum-production-still-matters-for-alcoa/. 138 U.S. Department of the Interior, U.S. Geological Survey, Metal Industry Indicators, October 2015.
http://minerals.usgs.gov/minerals/pubs/mii/1510/miioct15.pdf; Biman Mukherji, “China’s Aluminum Producers Stare down Price
Plunge,” Wall Street Journal, August 4, 2015. http://www.wsj.com/articles/chinas-aluminum-producers-stare-down-price-plunge-
1438686345; David Wren, “Gov. Haley: South Carolina Has Done All It Can to Save Century Aluminum Smelter,” Post and Courier,
October 28, 2015. http://www.postandcourier.com/article/20151028/PC05/151029284. 139 Office of the U.S. Trade Representative, Obama Administration Files WTO Complaint on China’s Subsidies to Aluminum Producers,
January 17, 2017. https://ustr.gov/about-us/policy-offices/press-office/press-releases/2017/january/Obama-Administration-Files-WTO-
Complaint-China-Aluminum. 140 Aluminum Association, “China & Trade.” http://www.aluminum.org/china-trade. 141 Aluminum Association, “China & Trade.” http://www.aluminum.org/china-trade.
U.S.-China Economic and Security Review Commission 25
142 U.S. Department of Commerce, International Trade Administration, Fact Sheet: Commerce Finds Dumping and Subsidization of
Aluminum Extrusions from the People’s Republic of China. http://enforcement.trade.gov/download/factsheets/factsheet-prc-alum-ext-
adcvd-final-032911.pdf. 143 WhistleBlower Attorneys Blog (Green LLP), “Aluminum Importers Settle Allegations of Avoiding Anti-Dumping and Countervailing
Duties on Products from China,” April 1, 2015. http://www.whistleblowerattorneys-blog.com/2015/04/aluminum-importers-settle-
allegations-of-avoiding-anti-dumping-and-countervailing-duties-on-products-from-china.html. 144 Scott Patterson, John W. Miller, and Chuin-wei Yap, “Chinese Billionaire Linked to Giant Aluminum Stockpile in Mexican Desert,”
Wall Street Journal, September 9, 2016. https://www.wsj.com/articles/chinese-billionaire-linked-to-giant-aluminum-stockpile-in-
mexican-desert-1473356054. 145 Scott Patterson, John W. Miller, and Chuin-wei Yap, “Chinese Billionaire Linked to Giant Aluminum Stockpile in Mexican Desert,”
Wall Street Journal, September 9, 2016. https://www.wsj.com/articles/chinese-billionaire-linked-to-giant-aluminum-stockpile-in-
mexican-desert-1473356054. 146 Aluminum Extruders Council, “AEC Files Scope Clarification and Circumvention Case against China Zhongwang Ltd.,” October 23,
2015. http://www.aec.org/?page=2015_ZhongwangCase. 147 China Trade Extra, “Commerce Starts Anti-Circumvention Probe on Chinese Aluminum Extrusions,” March 25, 2016.
http://chinatradeextra.com/daily-news/commerce-starts-anti-circumvention-probe-chinese-aluminum-extrusions. 148 U.S. Department of Commerce, Antidumping and Countervailing Duty Orders on Aluminum Extrusions from the People’s Republic of
China: Final Scope Ruling on Certain Aluminum Pallets, December 7, 2016, 2. http://enforcement.trade.gov/download/prc-ae/scope/98-
aluminum-pallets-7dec16.pdf. 149 Scott Patterson, John W. Miller, and Chuin-wei Yap, “Chinese Billionaire Linked to Giant Aluminum Stockpile in Mexican Desert,”
Wall Street Journal, September 9, 2016. https://www.wsj.com/articles/chinese-billionaire-linked-to-giant-aluminum-stockpile-in-
mexican-desert-1473356054. 150 Scott Patterson, John W. Miller, and Chuin-wei Yap, “Chinese Billionaire Linked to Giant Aluminum Stockpile in Mexican Desert,”
Wall Street Journal, September 9, 2016. https://www.wsj.com/articles/chinese-billionaire-linked-to-giant-aluminum-stockpile-in-
mexican-desert-1473356054. 151 Scott Patterson, “Aluminum Billionaire Planning Escape from China: Lawyer,” Wall Street Journal, December 28, 2016.
http://www.wsj.com/articles/aluminum-billionaire-planning-escape-from-china-lawyer-1482953518. 152 Scott Patterson, “U.S. Seizes $25 Million Worth of Aluminum Linked to Chinese Billionaire,” Wall Street Journal, January 13, 2017.
http://www.wsj.com/articles/u-s-seizes-25-million-worth-of-aluminum-linked-to-chinese-billionaire-1484303409; U.S. Department of
Commerce, Antidumping and Countervailing Duty Orders on Aluminum Extrusions from the People’s Republic of China: Final Scope
Ruling on Certain Aluminum Pallets, December 7, 2016, 10–11. http://enforcement.trade.gov/download/prc-ae/scope/98-aluminum-
pallets-7dec16.pdf. 153 Scott Patterson, “U.S. Seizes $25 Million Worth of Aluminum Linked to Chinese Billionaire,” Wall Street Journal, January 13, 2017.
http://www.wsj.com/articles/u-s-seizes-25-million-worth-of-aluminum-linked-to-chinese-billionaire-1484303409. 154 Office of the U.S. Trade Representative, Obama Administration Files WTO Complaint on China’s Subsidies to Aluminum Producers,
January 17, 2017. https://ustr.gov/about-us/policy-offices/press-office/press-releases/2017/january/Obama-Administration-Files-WTO-
Complaint-China-Aluminum. 155 Office of the U.S. Trade Representative, Obama Administration Files WTO Complaint on China’s Subsidies to Aluminum Producers,
January 17, 2017. https://ustr.gov/about-us/policy-offices/press-office/press-releases/2017/january/Obama-Administration-Files-WTO-
Complaint-China-Aluminum. 156 World Trade Organization, “China – Subsidies to Producers of Primary Aluminum: Request for Consultations by the United States,”
January 12, 2017.