Highlights of the Alberta Economy - Home - Alberta, … of the Alberta Economy 2012 Message from...
52
Highlights of the Alberta Economy 2012
Transcript of Highlights of the Alberta Economy - Home - Alberta, … of the Alberta Economy 2012 Message from...

Highlights of the Alberta Economy 2012

Message from Honourable Alison M. Redford, QC Premier of AlbertaOur province’s economy is moving in new and exciting directions. Alberta’s wealth of talented individuals are set to take a leadership role in this new global reality by taking Alberta to the world.
Alberta has the distinct ability to realize its full potential by having a solid foundation to work from and embrace. It begins with having one of the most dependable energy sectors in the world, our position as a global energy supplier and a leader in responsible and sustainable development. Environmental stewardship is an essential element of Alberta’s approach and we have the regulatory framework and the people in place to ensure that we achieve the correct balance between development and conservation. That balance has been essential to our province’s success in the past and will be in the future.
Alberta is open to investment from all parts of the world and we are working to attract new and diverse investment to the province. Open borders and strong relations with existing and emerging trade and investment partners are critical to the success of Alberta’s economy. Our commitment to growing and expanding our economy is demonstrated by the high level of investment in the province, which is more than double the national average on a per capita basis.
Our innovation, entrepreneurial spirit and having one of the most competitive business climates in the world are the cornerstones of Alberta. In addition to this foundation, we also have our natural beauty and our greatest resource, Albertans. In every corner of the province, Albertans have always led the way with an eye on the future, building on our strengths and finding new approaches to ensure we are always striving for the best quality of life.
Alison M. Redford, QCPremier of Alberta

Table of Contents
4 Alberta: The Best Place to Live, Work and Do Business
6 Economic Highlights
8 Growth
9 Economic Prosperity
10 Attractive Investment Climate
11 Exports
12 A Diversified and Resource-based Economy
14 Energy
15 Environment
16 Agriculture
17 Forestry
18 Manufacturing
19 Advanced Technology Industries
20 Advanced Technology (Broadband Usage)
21 Financial Services
23 Tourism
24 Doing Business in Alberta
26 Competitiveness
27 Entrepreneurship
28 Research & Development
29 Government
30 Competitive Corporate Taxes
31 Provincial and State Corporate Taxes
32 Educated Work Force
34 Working in Alberta
36 Strong Labour Market
38 Low Personal Taxes
40 Family Income
41 Standard of Living
42 Living in Alberta
44 People
45 Education
46 Quality of Education
47 Health Care
48 Arts and Culture
50 Donations and Volunteerism
51 Alberta Online Resources

C A N A D A
U S A
M E X I C O
A L B E R TA
Grande Prairie
Edmonton
Jasper
Red Deer
Calgary
Lethbridge
High Level
Fort McMurray
Peace River
Banff
Medicine Hat
Lloydminster
Cold Lake
Alberta: The Best Place to Live, Work and Do Business

• Alberta is Canada’s second most western province. The province’s borders touch the Canadian Rocky Mountains to the west, the vast prairies to the east, the United States to the south and the Canadian Arctic to the north.
• On average, the province’s 3.8 million people are the youngest of all Canadian provinces, with a median age of 36.5 years.
• One of every six Albertans was born outside of Canada.
• 63.4 per cent of the Alberta’s labour force aged 25 years and older is holding a post-secondary degree, diploma or certificate.
• During the past 20 years, Alberta’s economy has led the nation in average annual economic growth, and is poised to lead again in economic growth in 2012 and 2013.
• The energy sector is Alberta’s driving economic force. Other key industry sectors of the economy include:
• petrochemicals,
• agriculture and agri-food,
• forest products,
• industrial machinery and metal fabrication,
• tourism, and
• Information and communications technology.
• Alberta’s international airports in Edmonton and Calgary provide excellent air service to both domestic and international destinations.
• To promote its presence in key markets, Alberta operates ten international trade and investment offices, including six in Alberta’s second-largest market, Asia.

Economic Highlights

DiD yOu knOW? In 2011, per capita investment in
Alberta was $23,461, more than double the national average of $10,758.
Alberta’s oil sands account for about six per cent of Canada’s overall Green House Gases emissions and Canada is responsible for about 2 per cent of global emissions.
Although Alberta’s energy sector accounts for a little over one-quarter of its GDP, the province’s GDP shares of other sectors, such as construction, finance and real estate, and business and commercial services grew significantly between 1985 and 2011.

8 Economic Highlights
GrowthALBERTA POiSED TO LEAD ECOnOMiC GROWTH in THE nEXT TWO yEARS
• Alberta led all provinces in average annual economic growth over the last 20 years.
• Over a span of one year, Alberta’s population increased by 1.6 per cent to reach a little over 3.8 million by July 2011.
• Between 2001 and 2011, Alberta accounted for 20.4 per cent of Canada’s population growth.
• In 2011, the official Statistics Canada Census indicated that the population of Alberta increased by 10.8 per cent or 354,907 since the previous census completed in 2006.
• In 2011, the Alberta economy expanded by an estimated 5.2 per cent, the highest provincial growth reported. Private sector forecasts suggest that Alberta will lead the nation in economic growth in 2012 and 2013.
• In 2011, more than two million Albertans were employed, international merchandise exports were $93 billion, and investment totaled $89 billion.
Growth In Selected Indicators: 2001 - 2011 (per cent change)▉ Alberta ▉ Canada
Population*22.5
11.6
Employment28.4
15.8
GDP30.8
21.2
Goods Exports
63.611.7
investment109.9
79.3
* Census Estimate
Source: Statistics Canada and Alberta Enterprise and Advanced Education
9Economic Highlights
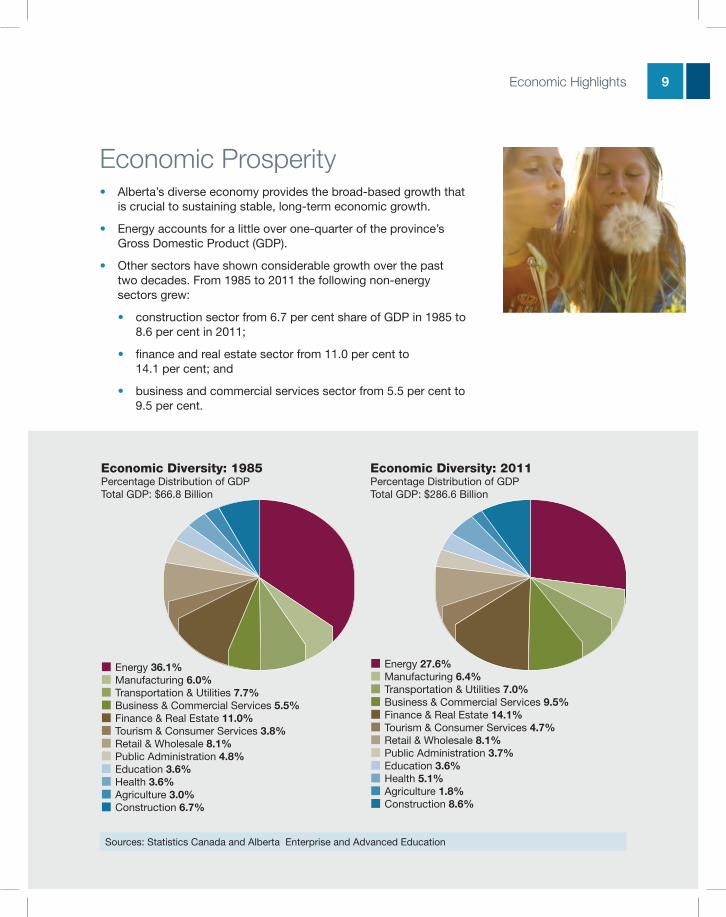
Economic Prosperity• Alberta’s diverse economy provides the broad-based growth that
is crucial to sustaining stable, long-term economic growth.
• Energy accounts for a little over one-quarter of the province’s Gross Domestic Product (GDP).
• Other sectors have shown considerable growth over the past two decades. From 1985 to 2011 the following non-energy sectors grew:
• construction sector from 6.7 per cent share of GDP in 1985 to 8.6 per cent in 2011;
• finance and real estate sector from 11.0 per cent to 14.1 per cent; and
• business and commercial services sector from 5.5 per cent to 9.5 per cent.
Economic Diversity: 1985Percentage Distribution of GDPTotal GDP: $66.8 Billion
Economic Diversity: 2011Percentage Distribution of GDPTotal GDP: $286.6 Billion
█ Energy 27.6%█ Manufacturing 6.4%█ Transportation & Utilities 7.0%█ Business & Commercial Services 9.5%█ Finance & Real Estate 14.1%█ Tourism & Consumer Services 4.7%█ Retail & Wholesale 8.1%█ Public Administration 3.7%█ Education 3.6%█ Health 5.1%█ Agriculture 1.8%█ Construction 8.6%
█ Energy 36.1%█ Manufacturing 6.0%█ Transportation & Utilities 7.7%█ Business & Commercial Services 5.5%█ Finance & Real Estate 11.0%█ Tourism & Consumer Services 3.8%█ Retail & Wholesale 8.1%█ Public Administration 4.8%█ Education 3.6%█ Health 3.6%█ Agriculture 3.0%█ Construction 6.7%
Sources: Statistics Canada and Alberta Enterprise and Advanced Education
10 Economic Highlights
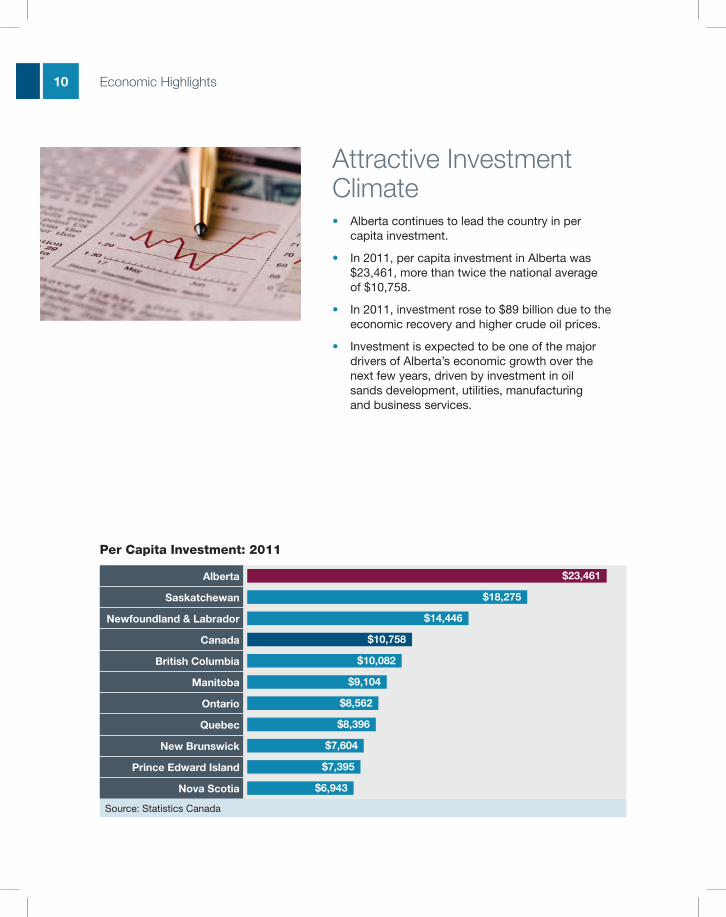
Attractive Investment Climate• Alberta continues to lead the country in per
capita investment.
• In 2011, per capita investment in Alberta was $23,461, more than twice the national average of $10,758.
• In 2011, investment rose to $89 billion due to the economic recovery and higher crude oil prices.
• Investment is expected to be one of the major drivers of Alberta’s economic growth over the next few years, driven by investment in oil sands development, utilities, manufacturing and business services.
Per Capita Investment: 2011
Alberta $23,461
Saskatchewan $18,275
newfoundland & Labrador $14,446
Canada $10,758
British Columbia $10,082
Manitoba $9,104
Ontario $8,562
Quebec $8,396
new Brunswick $7,604
Prince Edward island $7,395
nova Scotia $6,943
Source: Statistics Canada

11Economic Highlights
Exports• In 2011, Alberta exported $93.1 billion worth of
goods to 188 countries, an increase of 18.3 per cent from 2010.
• In 2011, Alberta’s exports increased primarily as a result of higher prices and volumes of crude oil and agricultural commodities.
• Alberta exports an increasing amount and variety of manufactured products such as petrochemicals and metals and machinery.
• Between 2008 and 2009, exports in manufactured products fell sharply due to the deteriorating global markets. Manufacturing exports started to recover in 2010 and increased by 9.4 per cent between 2010 and 2011 as a result of higher exports of machinery, fabricated metals and chemicals.
Alberta’s Major Exports 2011* ($ Billions)
Total Exports of Goods: $93.1 Billion
Crude Petroleum 52.1
Gas & Gas Liquids 12.1
Petrochemicals 7.2
Metals & Machinery 5.8
Crops & Livestock 4.6
Processed Food & Beverages 3.3
Forestry Products 2.1
Refined Petroleum Products 1.5
Sulphur & Coal 1.5
Electronic & Electrical Products 0.9
Others 1.8
* Export of services is not included in this estimate
Sources: Statistics Canada and Alberta Enterprise and Advanced Education
A Diversified and Resource-based Economy

DiD yOu knOW? Between 2001 and 2011, Alberta’s
manufacturing shipments increased by 55.8 per cent to $70.9 billion and international goods exports increased 63.6 per cent to $93.1 billion.
Over the past 10 years, Alberta’s financial services industry has experienced exceptional growth fuelled by high levels of capital investment in Alberta’s energy sector.
Alberta is the first jurisdiction in North America to legislate limits for large emitters across all sectors— including the oil sands—and the only jurisdiction in North America which requires emitters to pay if they don’t meet the targets.
In November 2011, Alberta opened a new Oil Sands Information Portal which focuses on the cumulative effects of development on the oil sands region’s Air, Water, Land, Climate Change and Biodiversity/Wildlife. The portal has both an interactive map display and a data library. It can be accessed by going to the website: http://environment.alberta.ca/apps/osip/

14 A Diversified and Resource-based Economy
EnergyEnERGy REVEnuE
• In 2011, Alberta produced about 74 per cent of Canada’s crude oil and 71 per cent of its natural gas.
• Alberta has the third largest petroleum reserves in the world, after Saudi Arabia and Venezuela.
• The Energy Resources Conservation Board forecasts that crude oil production from oil sands will more than double to about 3.7 million barrels per day by 2021, up from 1.7 million barrels per day in 2011.
• In 2011, gross revenues from all hydrocarbons were $89.8 billion, with revenues from crude oil including the oil sands, accounting for about three-quarters of the total.
ALBERTA’S EnERGy EXPORTS
• In 2011, energy resource exports accounted for $65.8 billion of Alberta’s exports, about 71 per cent of Alberta’s total exports of goods that year.
Alberta’s Energy Revenues 2011Total: $89.8 Billion
Alberta’s Energy Exports 2011Total: $65.8 Billion
█ Crude Oil 74.7%█ Natural Gas & Gas Liquids 23.5%█ Coal and Sulphur 1.8%
█ Crude Oil 79.2%█ Natural Gas & Gas Liquids 18.4%█ Coal and Sulphur 2.3%
Sources: Statistics Canada, Energy Resources Conservation Board, Alberta Enterprise and Advanced Education
15A Diversified and Resource-based Economy
Environment• Alberta’s oil sands account for about six
per cent of Canada’s overall Green House Gases (GHG) emissions and Canada is responsible for about two per cent of global emissions.
• This means Alberta’s oil sands contribute approximately one-tenth of one per cent of the world’s GHG emissions.
• Alberta is implementing a world-class, integrated and science-based environmental monitoring system to deliver comprehensive and transparent monitoring for air, land, water and biodiversity across the province, starting in the oil sands region.
• Large emitters over 100,000 tonnes of GHGs per year must meet mandatory reduction targets. Emitters unable to meet the target must pay $15-per-tonne into a clean energy technology fund (worth $257 million as of April 2011), or purchase Alberta offset carbon credits. Alberta is the only
jurisdiction in North America with this requirement.
• Strict limits are placed on industry water use through a Water Management Framework for the Lower Athabasca River. This leading-edge framework puts a week-by-week cap on how much water oil sands companies can remove, and is tied to the naturally fluctuating flow of the river.
• Air quality is monitored 24 hours a day, 365 days a year across the province. Air quality in the oil sands region is rated at Low Health Risk - the best air quality level - 97 per cent of the time.
• The Alberta government has committed $2 billion (CDN) to commercial scale carbon capture and storage projects. Our $2 billion fund is one of the largest commitments to this technology in the world… from a province of only 3.8 million people.

16 A Diversified and Resource-based Economy
Agriculture• Alberta has one of the world’s most productive
agricultural economies, with a total farm area of 50.5 million acres or 20.4 million hectares used for crop and livestock production.
• In 2011, total farm cash receipts for Alberta reached a record $10.5 billion, representing 21.1 per cent of Canada’s primary agricultural production. The province also posted the country’s highest cattle market receipts, and was third in total crop market receipts.
• Alberta has an expanding value-added agricultural products sector. In 2011, manufacturing sales of Alberta’s food processing industry was a record $11.3 billion. Meat product manufacturing accounted for more than half of the sector’s sales.
Alberta’s Major Agricultural Products 2011 ($ Billions)
Farm Cash Receipts, Total: $10.46 Billion
Beef Cattle 3.20
Canola & Flax 2.60
Other* 1.87
Wheat (incl. Durum) 1.58
Dairy 0.50
Hogs 0.41
Oats, Rye & Barley 0.30
* Includes specialty cash crops, honey, poultry, eggs, program payments, etc.
Source: Statistics Canada

17A Diversified and Resource-based Economy
Forestry• In 2011, shipments of forest products reached $4.0
billion, and exports were $2.1 billion.
• Fifty-eight per cent or 38 million hectares of Alberta is forested. Of the forested area, about 60 per cent or 22.5 million hectares are considered suitable for harvest.
• Alberta’s commercially productive timber land base of 26.1 million hectares covers 40 per cent of Alberta’s total area and includes in excess of 2.2 billion cubic metres (m3) of growing stock.
• Annually, Alberta allows 29.7 million m3 to be harvested, of which 18.4 million m3 is coniferous, and 11.3 million m3 is deciduous.

18 A Diversified and Resource-based Economy
Manufacturing• Between 2001 and 2011, the value of Alberta’s
manufacturing shipments increased by 55.8 per cent to $70.9 billion.
• Even though Alberta’s manufacturing sector was hard hit by the global recession of 2008 – 2009, real manufacturing output (GDP) in Alberta still grew by 21.3 per cent between 2001 and 2011.
• By comparison, Canadian manufacturing output declined by 10.4 per cent over the same period.
• In 2011, Alberta’s manufacturing output (GDP) increased by 11.8 per cent. The largest manufacturing sectors were food products, chemicals, industrial machinery and fabricated metals.
• About 30 per cent of manufacturing output consists of value-added industrial products such as fabricated metals, machinery and electronics.
Value of Alberta Manufacturing Shipments 2011 ($ Billions)
Total: $70.9 Billion
Refined Petroleum 18.8
Chemical Products 12.8
Food & Beverage 12.2
Machinery 8.3
Fabricated Metals 5.4
Forest Products* 4.0
Construction Materials 2.0
Plastics 1.5
Electrical & Electronic Products 0.9
Furniture & Fixtures 0.8
Other Manufacturing 4.2
* Includes wood and pulp & paper industries
Source: Statistics Canada

19A Diversified and Resource-based Economy
Advanced Technology Industries• Alberta’s key advanced technology sectors include
clean energy, information and communication technology (ICT), life sciences and nanotechnology.
• The Alberta government, through Alberta Innovates, is committed to working with industry to support new technology development, increase commercialization and develop new markets and opportunities.
• Alberta’s ICT industry includes 4,200 companies and about 53,000 employees generating about $10 billion in annual revenues in 2011 making ICT one of Alberta’s key sectors.
• Alberta is home to more than 130 bio-industry companies, employing more than 4,500 workers. The majority of companies operate in the health, biotechnology and medical devices and equipment sectors. Revenues for this growing sector are estimated to be $800 million annually.
• The University of Alberta is home to the National Institute for Nanotechnology which is striving to be one of the top five nanotechnology centres in the world.

20 A Diversified and Resource-based Economy
Broadband Usage – International 2010 (Percentage of Households Accessing the Internet by Broadband)
korea 97
norway 83
Germany 75
Canada 73
France 67
Japan 63
italy 49
Sources: Statistics Canada and Organisation for Economic Co-operation and Development (OECD)
Broadband Usage – Canada 2010 (Percentage of Households Accessing the Internet by Broadband)
Alberta 80
British Columbia 79
Ontario 74
Canada 73
Saskatchewan 71
nova Scotia 70
Prince Edward island 69
Manitoba 68
newfoundland & Labrador 67
new Brunswick 66
Quebec 62
Source: Statistics Canada
Advanced Technology (Broadband Usage)
21A Diversified and Resource-based Economy
Financial Services• Over the past 10 years, Alberta’s financial services
sector has experienced exceptional growth fuelled by high levels of capital investment in Alberta’s energy sector. With almost $98 billion of capital investment expected in Alberta this year alone, the sector appears poised for additional growth.
• This sector includes six major Canadian Banks and is also home to the headquarters of a number of regional financial institutions including Canadian Western Bank, Servus Credit Union, ATB Financial, and Alberta Investment Management Corporation (AIMCO) as well as branches of 75 per cent of the top 20 global investment banks.
• Alberta has developed world-class expertise in niche sectors in financial services such as asset management and energy finance.
• In 2011, the financial services sector contributed $8.7 billion dollars to Alberta’s economy, accounting for roughly 4.7 per cent of the province’s total GDP.
• Between 2002 and 2011, the financial services sector GDP rose by 64 per cent, outpacing all other industries in the province. By comparison, GDP in Canada’s financial services sector rose by 32 per cent over the same period.

22 A Diversified and Resource-based Economy
Financial Services Employment Growth 2002–2011
Percentage Increase in Employment
Alberta 27
Ontario 22
Canada 20
British Columbia 19
Quebec 18
Source: Statistics Canada
Financial Services GDP Growth 2002–2011
Percentage Increase in GDP
Alberta 64
British Columbia 43
Quebec 34
Canada 32
Ontario 29
Source: Statistics Canada
Financial Services

23A Diversified and Resource-based Economy
Alberta Tourism Receipts by Visitor Origin: 2010Total: $5.5 Billion
Overnight Tourism by Tourism Destination Region: 2010Total: 41.01 Million Person Nights
█ Alberta 53%█ Other Canada 24%█ United States 10%█ Overseas 13%
█ Calgary & Area 27%█ Alberta South 9%█ Unspecified Region 3%█ Alberta North 6%█ Alberta Central 16%█ Edmonton & Area 23%█ Canadian Rockies 16%
Sources: Statistics Canada and Alberta Tourism, Parks and Recreation
Tourism• Tourism in Alberta is a significant economic
driver. It supports more than 90,000 jobs across Alberta, and generated approximately $5.5 billion in revenues in 2010. Nearly 47 per cent of these revenues, about $2.6 billion, came from out-of-province visitors.
• The Calgary and Area Tourism Destination Region was Alberta’s top tourism draw in 2010, accounting for 27.0 per cent of all person-nights spent in the province. Edmonton and Area, Canadian Rockies, and Central Tourism Destination Regions followed closely behind, accounting for 23.1 per cent, 15.6 per cent, and 15.5 per cent respectively.
• Alberta offers its residents and visitors exceptional tourism experiences and adventures. We have world-renowned attractions, vibrant cities, and the most diverse and scenic landscapes in North America. Alberta has five UNESCO World Heritage Sites, more than 480 provincial parks, 18 provincial historic sites, and five national parks.
• Tourism contributes to Albertans’ quality of life through the network of tourism attractions, facilities, festivals and events. It also supports the conservation and protection of Alberta’s natural and cultural landscapes as these are one of the foundations for the industry’s success.

Doing Business in Alberta

DiD yOu knOW? In 2011, Alberta had the highest GDP
per capita of any state or province in North America.
Alberta’s attractive business environment has resulted in the province posting the second fastest growing small business sector in Canada over the last 10 years.
Alberta has one of the most competitive business tax environments in North America. Alberta’s 2012 combined federal and provincial corporate income tax rate of 25 per cent is the lowest in the country.
In 2011, 63.4 per cent of Alberta’s labour-force – 25 years of age and older – reported holding a university degree, post-secondary diploma or certificate.

26 Doing Business in Alberta
Competitiveness• In 2011, labour productivity in Alberta’s business sector was
higher than in any other province. The total value added per hour worked in Alberta exceeded the Canadian average by about 18 per cent.
• Alberta’s productivity advantage over other Canadian provinces is substantial; however, its rate of productivity growth has been slow in recent years. The primary cause of this low productivity growth rate is due to changes in the nature and composition of Alberta’s energy output.
• While Alberta’s long-term economic growth prospects remain strong due to energy prices, increased productivity growth will be important to optimize the economic benefits from energy investment in Alberta, and to encourage higher value added activity and industrial diversification.
• In 2010, Alberta Competitiveness Act was passed. The Act aims to better coordinate the efforts of government and industry to ensure the province remains one of the most competitive jurisdictions in the world.
Business Sector Labour Productivity 2011 (Real GDP per Hour Worked, in 2002 constant dollars)
Alberta $46.00
newfoundland & Labrador $45.20
Saskatchewan $43.80
Canada $38.90
Ontario $38.30
Quebec $36.60
British Columbia $36.40
Manitoba $34.40
new Brunswick $31.40
nova Scotia $29.40
Prince Edward island $25.40
Source: Statistics Canada – GDP at basic prices

27Doing Business in Alberta
Small Business – Cornerstone of the Economy 2001-2011 [Percentage Change in Small Business Establishments (Less than 50 Employees)]
Ontario 12.6
Alberta 11.9
British Columbia 9.3
Canada 5.5
Manitoba 0.3
Quebec -2.5
newfoundland & Labrador -4.3
nova Scotia -6.4
Saskatchewan -7.3
new Brunswick -8.7
Prince Edward island -18.1
Sources: Canadian Business Patterns, Statistics Canada
Entrepreneurship• Alberta’s dynamic and innovative business climate is
evident by the growth in the number of small businesses. For the last decade, Alberta has led Canada in number of new small businesses.
• From 2001 to 2011, Alberta enjoyed an increase of 15,288 or 11.9 per cent in the number of small business establishments (business establishments with less than 50 employees).
• Alberta’s small business corporate income tax rate is three per cent, and between 2001 and 2009 the small business income threshold was more than doubled to $500,000.
• Since it launched in 2009, the Innovation Voucher Program has helped small technology and knowledge-based companies in Alberta. In the 2011-12 fiscal year, 72 vouchers were awarded to small technology businesses, assisting them to transform innovative ideas into commercial products or services and gain a competitive advantage in domestic and export markets.
• The Government of Alberta has invested $100 million to attract more venture capital to Alberta to grow early-stage technology companies.

28 Doing Business in Alberta
Research & Development• Alberta Innovates allows businesses, government
and academia to collaborate and gain access to world renowned experts and one-of-a-kind infrastructure and equipment to solve complex problems.
• The Alberta government’s research and development expenditures are among the highest in Canada, on a per capita basis, partially thanks to annual draws on two research endowment funds currently valued at over $2 billion.
• Collectively, Alberta Innovates and Campus Alberta have attracted some of the world’s largest and most successful corporations and researchers to partner with Alberta.
• Alberta is at the forefront of key research areas, such as biorefining and biocomposite materials, nanotechnology, cleaner energy production and alternative energy, cardiovascular health, brain health, diabetes, biomedical technologies, and infectious diseases.
• Alberta Innovates is also bridging the gap between the lab and the market with programs to support small and medium business succeed.
• Alberta’s provincial SR&ED tax credit is worth 10 per cent of a company’s eligible expenditures up to $4 million, for a maximum credit of $400,000.
• Researchers, industry, and government continue to work together to create a collaborative research and innovation system and stronger companies. Enterprise and Advanced Education is committed to facilitating alignment, collaboration and investment for Alberta’s long-term social, economic and environmental benefit.
Under the banner Alberta innovates, the Alberta government created new organizations that focus Alberta’s provincial research efforts in the areas of agriculture, forestry, energy and environment, health, and technology commercialization. They Include:• Bio Solutions• Energy and Environment Solutions• Health Solutions • Technology Futures• Alberta Research and
Innovation Authority

29Doing Business in Alberta
Government• The Alberta government is committed to free
enterprise, sustainable economic development, a competitive tax environment and strong infrastructure.
• Alberta’s strong fiscal position, minimal debt, and a savings account built from past surpluses enhanced the government’s ability to respond to the recession, supporting services, programs and infrastructure plans without jeopardizing Alberta’s low tax regime.
• As of March 31, 2012, Alberta’s Heritage Trust Fund (long-term savings) was about $14.5 billion.
• As of March 31, 2012, Alberta’s Sustainability Fund (savings from past surpluses) was about $7.5 billion.
Provincial Net Financial Assets/Debt as a per cent of GDP: 2011-2012
Alberta 9.3
Saskatchewan -5.1
British Columbia -16.4
newfoundland & Labrador
-25.7
Manitoba -25.8
new Brunswick -33.0
nova Scotia -35.2
Prince Edward island -35.5
Ontario -37.1
Canada -37.5
Quebec -51.0
Source: Alberta Treasury Board and Finance

30 Doing Business in Alberta
Competitive Corporate Taxes• With recent tax changes, Alberta has one of the
most competitive business tax environments in North America.
• The combined federal/provincial corporate income tax rate in Alberta is 25 per cent in 2012. This is the lowest combined federal/provincial corporate income tax rate in the country.
• By comparison, the combined average federal/state corporate income tax rate in the U.S. is 39.2 per cent.
• In 2006, the Government of Alberta reduced its general corporate income tax rate to 10 per cent. The Government of Canada has reduced the general corporate income tax rate to 15 per cent.
• The low income tax rates combined with no provincial capital taxes or taxes on financial institutions, no payroll taxes, no sales tax, and a publicly funded health-care system makes Alberta’s tax environment very competitive.
• In 2009, Alberta’s health care premiums were eliminated.
Comparison of Corporate Income Taxes (per cent)▉ Federal ▉ Provincial/State
united States Jan. 2012 6.532.7 39.2*
Alberta Jan. 2012 10.015.0 25.0
* 6.5 per cent represents the average effective top general state corporate income tax rate. U.S. rates known as of January 2012.
Sources: Alberta Enterprise and Advanced Education, Tax Foundation and KPMG

31Doing Business in Alberta
Provincial and State Corporate Taxes Provincial Corporate income Tax Rates (per cent)
Province General Manufacturing & Processing Small Business
Alberta 10.0 10.0 3.0
British Columbia 10.0 10.0 2.5
New Brunswick 10.0 10.0 4.5
Quebec 11.9 11.9 8.0
Manitoba 12.0 12.0 0.0
Saskatchewan 12.0 10.0 2.0
Ontario 11.5 10.0 4.5
Newfoundland & Labrador 14.0 5.0 4.0
Prince Edward Island 16.0 16.0 1.0
Nova Scotia 16.0 16.0 4.0
Federal 15.0 15.0 11.0
State Corporate income Tax Rates (per cent)
Province General Manufacturing & Processing Small Business
Oregon 7.6 7.6 7.1
California 8.84 8.84 8.84
North Dakota 5.2 5.2 4.98
Montana 6.75 6.75 6.75
Idaho 7.6 7.6 7.6
Colorado 4.63 4.63 4.63
Utah 5.0 5.0 5.0
New Mexico 7.6 7.6 4.8
Louisiana 8.0 8.0 7.25
Arizona 6.97 6.97 6.97
Federal 35.0 31.85 34.0
Note: Rates as of February, 2012
The U.S. small business rate is the effective tax rate for the first US$505,526 (comparable to the Canadian threshold of Cdn$500,000)
The small business income threshold for Nova Scotia and Manitoba is Cdn$400,000. For all other provinces the small business income threshold is Cdn$500,000
Sources: Canada Revenue Agency, PWC Tax News Network, Federation of Tax Administrators
32 Doing Business in Alberta
Educated Work Force• Alberta’s labour force consists of more than two
million well-educated workers.
• In 2011, 63.4 per cent of the labour force 25 years of age and older reported holding a university degree, post-secondary diploma or certificate.
• Alberta’s education system provides a learning environment conducive to economic and social success and encourages an environment that supports the pursuit of life-long learning.
• The Canadian Council on Learning’s Composite Learning Index (CLI) combines data based on 17 indicators and 25 specific measures that look at the learning environment. Indicators range from access to on-the-job-training, early childhood development programs, access to resources such as libraries, and exposure to sports, media, recreation and cultural events.
• In 2010, Alberta’s CLI was the highest among the Canadian provinces, with an index of 82. This represented a three percentage point advantage over second-ranked Ontario, and a seven percentage point advantage over the Canadian CLI.
• As of December 31st 2011, there were about 57,000 registered apprentices training at approximately 14,500 employer sites around Alberta.
• Alberta’s apprenticeship and industry training system is second to none, training over 20 per cent of Canada’s apprentices, despite having only 11 per cent of its labour force.

33Doing Business in Alberta
Educated Work ForceComposite Learning Index 2010
Alberta 82.0
Ontario 79.0
British Columbia 78.0
Saskatchewan 77.0
Manitoba 76.0
Canada 75.0
nova Scotia 71.0
Prince Edward island 69.0
Quebec 68.0
new Brunswick 65.0
newfoundland & Labrador 61.0
Source: Canadian Council on Learning

Working in Alberta

DiD yOu knOW? Alberta is the only province without
a provincial sales tax, and has the lowest gasoline taxes in the country.
Since 2001, Alberta employment has grown an average of 46,350 new jobs per year – a growth rate of 2.5 per cent per annum.
Albertans pay low personal income taxes with the lowest top marginal income tax rate and the highest basic and spousal tax credits in Canada.

36 Working in Alberta
Strong Labour Market• Since 2004, Alberta’s unemployment rate has been
one of the three lowest of all the provinces in Canada.
• While the recent global recession resulted in increases in unemployment, Alberta’s labour market has since recovered and is now at a balanced level. Employment opportunities are expected to continue to grow as stronger economic growth resumes in Alberta.
• Since 2001, Alberta employment has grown an average of 46,350 new jobs per year: a growth rate of 2.5 per cent per annum. In 2011, employment in the Alberta economy increased by 77,500 from 2010.
• From 2006 to 2010, Alberta’s unemployment rate averaged 4.7 per cent, compared to 5.8 per cent in British Columbia and 7.4 per cent in Ontario over the same period. Alberta’s unemployment rate was 5.5 per cent in 2011.

37Working in Alberta
Strong Labour MarketUnemployment Rates (per cent) by Province: 2006–2010 (average) and 2011▉ 2006–2010 ▉ 2011
Saskatchewan4.6
5.0
Manitoba4.7
5.4
Alberta4.7
5.5
Canada6.9
7.4
British Columbia5.8
7.5
Quebec7.87.8
Ontario7.4
7.8
nova Scotia8.4
8.8
new Brunswick8.6
9.5
Prince Edward island
11.111.3
newfoundland & Labrador
14.312.7
Source: Statistics Canada

38 Working in Alberta
Low Personal Taxes• Alberta’s personal tax advantage results from a low
single rate tax system, no general sales tax, and the lowest gasoline tax among the provinces.
• Albertans pay low personal income taxes, with the lowest top marginal income tax rate and the highest basic and spousal tax credit amounts in Canada.
• As provided in the following examples, in Alberta, a two-income family of four:
• Earning $75,000 pays about $2,000 less in total taxes than in Ontario and about $3,500 less than in British Columbia.
• Earning $125,000 pays almost $3,100 less in total taxes than in Ontario and about $7,800 less than in Quebec.
Top Marginal Personal Income Tax Rates 2012 (per cent)▉ Federal Personal income Tax ▉ Provincial Personal income Tax
Alberta 10.029.0 39.0
newfoundland & Labrador 13.329.0 42.3
new Brunswick 14.329.0 43.3
British Columbia 14.729.0 43.7
Saskatchewan 15.029.0 44.0
Manitoba 17.429.0 46.4
Prince Edward island 18.429.0 47.4
Ontario 19.029.0 48.0
Quebec* 24.024.2 48.2
nova Scotia 21.029.0 50.0
* Quebec residents receive an abatement of 16.5 per cent of basic federal tax because of the province’s decision to opt out of federal cash transfers in support of provincial programs
Source: PricewaterhouseCoopers (PWC) Tax Facts, May 31st, 2012

39Working in Alberta
Comparison of Provincial and Federal Taxes by Province (Two-income family of four earning $75,000*)▉ Total Federal Tax ▉ Total Provincial Tax
Alberta $2,880 $12,398
Saskatchewan $4,267 $13,816
Ontario $4,891 $14,439
Quebec $5,491 $15,220
British Columbia $6,404 $15,923
Manitoba $6,438 $15,932
new Brunswick $6,563 $16,069
newfoundland & Labrador $6,793 $16,303
nova Scotia $7,590 $17,083
Prince Edward island $7,609 $17,095
Source: Alberta Treasury Board and Finance (*as of March 2012)
Comparison of Provincial and Federal Taxes by Province (Two-income family of four earning $125,000*)▉ Total Federal Tax ▉ Total Provincial Tax
Alberta $7,140 $28,394
Saskatchewan $10,005 $31,273
Ontario $10,197 $31,480
British Columbia $10,601 $31,885
new Brunswick $12,305 $33,538
Manitoba $12,651 $33,852
newfoundland & Labrador $12,887 $34,119
Prince Edward island $14,257 $35,448
nova Scotia $14,945 $36,129
Quebec $14,696 $36,230
Source: Alberta Treasury Board and Finance (*as of March 2012)
Note: Unlike in previous Highlights of the Alberta Economy presentation reports, tobacco taxes were not included in the personal taxes calculations since most Albertans do not smoke. Alberta’s rankings will not change even if tobacco taxes were included in the comparisons.
Low Personal Taxes
40 Working in Alberta
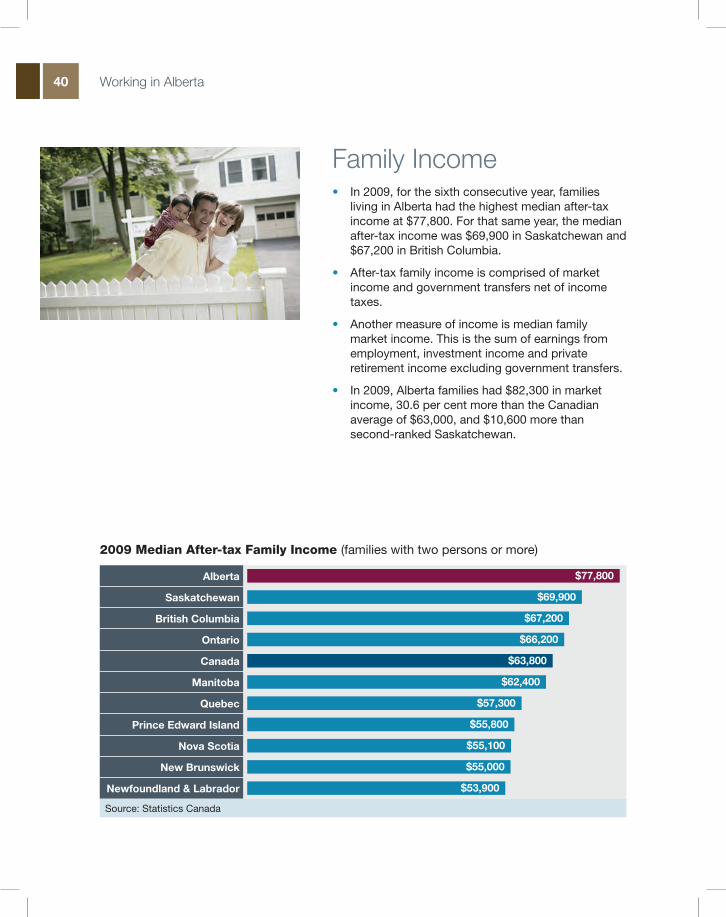
Family Income• In 2009, for the sixth consecutive year, families
living in Alberta had the highest median after-tax income at $77,800. For that same year, the median after-tax income was $69,900 in Saskatchewan and $67,200 in British Columbia.
• After-tax family income is comprised of market income and government transfers net of income taxes.
• Another measure of income is median family market income. This is the sum of earnings from employment, investment income and private retirement income excluding government transfers.
• In 2009, Alberta families had $82,300 in market income, 30.6 per cent more than the Canadian average of $63,000, and $10,600 more than second-ranked Saskatchewan.
2009 Median After-tax Family Income (families with two persons or more)
Alberta $77,800
Saskatchewan $69,900
British Columbia $67,200
Ontario $66,200
Canada $63,800
Manitoba $62,400
Quebec $57,300
Prince Edward island $55,800
nova Scotia $55,100
new Brunswick $55,000
newfoundland & Labrador $53,900
Source: Statistics Canada

41Working in Alberta
Standard of Living• Alberta has been the nation’s leader
in economic well-being for more than 30 years.
• As a measure economic welfare, the Ottawa-based Centre for the Study of Living Standards has developed an Index of Economic Well-Being.
• The Index of Economic Well-Being focuses on consumption rather than production and emphasizes the household perspective. It includes measures of wealth, the distribution of income and wealth, economic security, environmental sustainability and non-market activities such as household work.
• In 2011, Alberta maintained the top spot in the nation with an index value of 0.735, a 21 per cent advantage over the Canadian index value of 0.606.
• The province’s strong performance in economic well-being indicators was also evident in international comparisons. In 2010, Alberta ranked second in an international comparison of economic well-being in Alberta and 14 OECD nations.
Index of Economic Well-Being Provincial Comparison: 2011
Alberta 0.735
newfoundland 0.609
Canada 0.606
Saskatchewan 0.605
Ontario 0.588
Manitoba 0.579
British Columbia 0.575
Quebec 0.560
Prince Edward island 0.551
new Brunswick 0.533
nova Scotia 0.529
Source: Centre for the Study of Living Standards
Index of Economic Well-Being International Comparison: 2010
norway 0.811
Alberta 0.675
Denmark 0.663
Germany 0.654
Belgium 0.651
netherlands 0.629
Sweden 0.619
Finland 0.615
France 0.600
Canada 0.569
united kingdom 0.557
Australia 0.540
italy 0.511
united States 0.480
Spain 0.449
Source: Centre for the Study of Living Standards

Living in Alberta

DiD yOu knOW? Alberta is home to an ethnically
diverse population with a strong representation of Aboriginal people and an increasing number of migrants from Asia and other regions.
Alberta students had the fourth highest average score in science in the 2009 Program for International Student Assessment examinations which are conducted in 75 jurisdictions including 10 Canadian provinces.
Alberta ranks first among the Canadian provinces in age/gender adjusted per capita spending on government health expenditures.

44 Living in Alberta
People• Alberta is home to an ethnically diverse
population of over 3.8 million people.
• One in six Albertans was born outside of Canada, making Alberta one of the most multi-national and multi-cultural provinces in the country.
• Alberta has the youngest population of all Canadian provinces with a median age of 36.5. This compares to a median age of 40.6 in Canada.
• A vast majority of the population are of European ancestry, with a strong representation of Aboriginal people and an increasing number of migrants from Asia and other regions. This all contributes to the province’s rich cultural diversity.
Alberta Population by Ethnic Origin, 2006
Ethnic Origin numberTotal Pop. (per cent)
Total 3,256,355 100.0
English 885,825 27.2
German 679,705 20.9
Canadian 667,405 20.5
Scottish 661,265 20.3
Irish 539,160 16.6
French 388,210 11.9
Ukrainian 332,180 10.2
Dutch (Netherlands) 172,910 5.3
Polish 170,935 5.2
North American Indian 169,355 5.2
Norwegian 144,585 4.4
Chinese 137,600 4.2
Swedish 93,810 2.9
Russian 92,020 2.8
East Indian 88,165 2.7
Métis 83,235 2.6
Italian 82,015 2.5
Welsh 76,115 2.3
American 64,200 2.0
Danish 58,825 1.8
Filipino 54,305 1.7
British Isles 53,855 1.7
Hungarian 48,665 1.5
Austrian 36,480 1.1
Spanish 30,995 1.0
Romanian 26,870 0.8
Vietnamese 25,170 0.8
Swiss 22,185 0.7
Note: These numbers add up to more than the population due to multiple responses.
Source: Statistics Canada, 2006 Census of Population

45Living in Alberta
Education• Albertans are among the best educated people in North
America.
• Campus Alberta includes 26 diverse educational institutions, modern facilities, integrated technologies, and online learning combine to create innovative teaching and research opportunities for over 269,000 students, spanning every region of the province.
• Campus Alberta is instrumental in supporting learners, society and the economy. It is a comprehensive, coordinated publicly funded post-secondary system that ensures all Albertans have access to affordable and high quality learning opportunities to meet their lifelong learning goals. This system has benefited from significant ongoing public investment in recent years.
• Campus Alberta is supplemented by a multitude of community-based, religious, and vocational training opportunities. Together, Alberta’s post-secondary providers are offering the quality education and training Albertans need, where and when they need it.
Comprehensive Academic & Research Institutions
University of Alberta; University of Calgary; University of Lethbridge; Athabasca University
Baccalaureate & Applied Studies Institutions Grant MacEwan University; Mount Royal University
Polytechnic Institutions NAIT*; SAIT*
Comprehensive Community Institutions
Bow Valley College; Grand Prairie Regional College; Keyano College; Lethbridge College; Medicine Hat College; NorQuest College; Northern Lakes College; Olds College; Portage College; Red Deer College; Lakeland College
Independent Academic Institutions
Ambrose University College; Canadian University College; Concordia University College of Alberta; The King’s University College; St. Mary’s University College
Specialized Arts & Culture Institutions Alberta College of Art and Design; The Banff Centre
* Northern Alberta Institute of Technology and Southern Alberta Institute of Technology

46 Living in Alberta
Quality of Education• Alberta ranks with the world’s best in terms of the
quality of education.
• The Program for International Student Assessment (PISA) is a tool developed by the Organization for Economic Cooperation and Development (OECD) to provide policy-oriented indicators of the skills and knowledge of 15-year olds’ capabilities as they near the end of compulsory education. Since 2000, PISA reports on reading literacy, mathematical literacy and scientific literacy every three years.
• The 2009 examinations placed Alberta among the top ranks of 75 jurisdictions including 10 Canadian provinces where the tests were conducted. Alberta students have the fourth highest average score in science, the fifth highest score in reading, and the eleventh highest score in mathematics.
Top Scores in Mathematics, Science and Reading 2009 PISA* Examinations
Mathematics Science Reading
Rank Jurisdiction Score Rank Jurisdiction Score Rank Jurisdiction Score
1 Shanghai-China 600 1 Shanghai-China 575 1 Shanghai-China 556
2 Singapore 562 2 Finland 554 2 Korea 539
3 Hong Kong-China 555 3 Hong Kong-China 549 3 Finland 536
4 Korea 546 4 Alberta 545 4 Hong Kong-China 533
5 Chinese Taipei 543 5 Singapore 542 5 Alberta 533
6 Quebec 543 6 Japan 539 6 Ontario 531
7 Finland 541 7 Korea 538 7 Singapore 526
8 Liechtenstein 536 8 British Columbia 535 8 British Columbia 525
9 Switzerland 534 9 New Zealand 532 9 Canada 524
10 Japan 529 10 Ontario 531 10 Quebec 522
11 Alberta 529 11 Canada 529 11 New Zealand 521
12 Canada 527 12 Estonia 528 12 Japan 520
42 United States 487 31 United States 502 24 United States 500
* PISA tests 15-year-olds mathematics, science and reading skills.
Note: The rank is out of 75 jurisdictions (average = 500).
Sources: Measuring Up: Canadian Results of the OECD PISA Study, Statistics Canada
47Living in Alberta
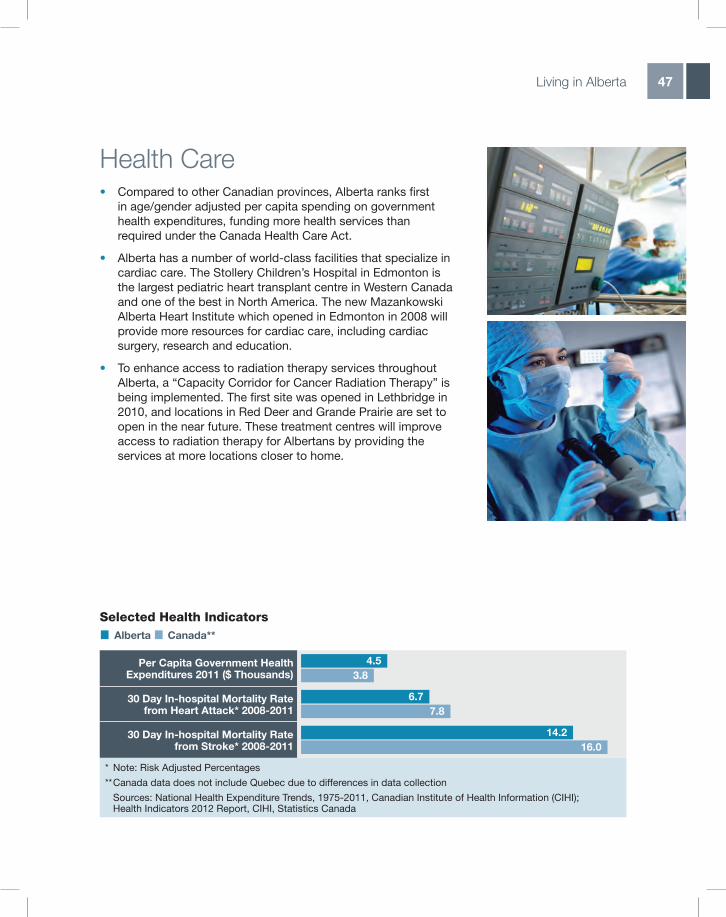
Health Care• Compared to other Canadian provinces, Alberta ranks first
in age/gender adjusted per capita spending on government health expenditures, funding more health services than required under the Canada Health Care Act.
• Alberta has a number of world-class facilities that specialize in cardiac care. The Stollery Children’s Hospital in Edmonton is the largest pediatric heart transplant centre in Western Canada and one of the best in North America. The new Mazankowski Alberta Heart Institute which opened in Edmonton in 2008 will provide more resources for cardiac care, including cardiac surgery, research and education.
• To enhance access to radiation therapy services throughout Alberta, a “Capacity Corridor for Cancer Radiation Therapy” is being implemented. The first site was opened in Lethbridge in 2010, and locations in Red Deer and Grande Prairie are set to open in the near future. These treatment centres will improve access to radiation therapy for Albertans by providing the services at more locations closer to home.
Selected Health Indicators▉ Alberta ▉ Canada**
Per Capita Government Health Expenditures 2011 ($ Thousands)
4.53.8
30 Day in-hospital Mortality Rate from Heart Attack* 2008-2011
6.77.8
30 Day in-hospital Mortality Rate from Stroke* 2008-2011
14.216.0
* Note: Risk Adjusted Percentages
** Canada data does not include Quebec due to differences in data collection
Sources: National Health Expenditure Trends, 1975-2011, Canadian Institute of Health Information (CIHI); Health Indicators 2012 Report, CIHI, Statistics Canada

48 Living in Alberta
Arts and Culture• Alberta’s cultural policy, The Spirit of Alberta, supports
and creates opportunities for excellence in the arts, recreation and sports, and encourages the growth of the cultural industries.
• Alberta is a leader among the Canadian provinces in government investment in the arts and culture. Albertans spend more per capita than any other Canadians on culture, and Albertan companies provide the highest level of per capita support to the arts in Canada.
• Each year, over 170 arts presenters bring music, dance, film, literature, theatre and the visual arts to communities throughout the province. In 2010-11, the Alberta Film Development Program invested in over 50 film, television and digital media projects to develop local production expertise and talent.
• Alberta Culture Days is an annual celebration of heritage, cultural diversity and provincial pride. In 2011, thousands of Albertans enjoyed 1,046 events and activities in 93 communities across the province showcasing the importance of culture.
• Calgary and Edmonton, Alberta’s two major cities, have vigorous live music, theatre and visual arts scenes, as well as symphony, opera and ballet. Alberta’s Jubilee Auditoria are Canada’s second and third top theatre venues by ticket sales in 2010.
• Smaller cities and towns also offer unique cultural experiences with an array of festivals and arts presentations to experience performing and visual arts.
• Residents and visitors alike enjoy performances by 10 major performing arts companies (opera, ballet, symphony and theatre companies), 44 professional performing arts companies and 155 community performing arts organizations.
• The Alberta Foundation for the Arts collection of artwork by Alberta artists is exhibited in over 445 venues throughout the province.
• Alberta is home to 30 public and institutional art galleries, including the renovated Art Gallery of Alberta, in addition to numerous world class private commercial galleries.

49Living in Alberta
Arts and CulturePrivate Sector Support of Performing Arts: 2008 (per capita dollars)
Alberta 6.35
Ontario 5.77
British Columbia 4.64
Manitoba 4.46
Quebec 3.17
Saskatchewan 2.34
nova Scotia 1.80
Note: Excludes statistics for Prince Edward Island, Newfoundland & Labrador and New Brunswick which were suppressed to meet the confidentiality requirements of the Statistics Act.
Source: Statistics Canada
Average Household Spending on Live Performing Arts: 2009 (annual dollars)
Saskatchewan 141
Alberta 135
Manitoba 123
Ontario 113
Canada 105
Prince Edward island 101
British Columbia 98
Quebec 88
nova Scotia 80
new Brunswick 72
newfoundland & Labrador 56
Source: Statistics Canada

50 Doing Business in Alberta
Charitable Donor Statistics: Average Annual Donations, 2010 (dollars)
Alberta 562
Saskatchewan 544
British Columbia 543
Ontario 526
Manitoba 519
Prince Edward island 479
Canada 446
new Brunswick 380
nova Scotia 369
newfoundland & Labrador 331
Quebec 208
Source: Canadian Survey of Giving, Volunteering and Participating, Statistics Canada
Donations and Volunteerism• Charitable donations, volunteering time to charitable and
non-profit organizations, and helping people in need directly help build community.
• The Canada Survey of Giving, Volunteering and Participating (CSGVP) undertaken by Statistics Canada aims to collect information to better understand what motivates Canadians to undertake these activities and in the process optimize this positive influence in society.
• Albertans give generously of their time and money for charitable causes. The 2010 CSGVP survey shows the volunteer rate in Alberta has grown almost 7 per cent in the last six years.
• In 2010, the volunteerism rate of Albertans in support of schools, charitable and other non-profit organizations was 54.7 per cent compared to 47 per cent in Canada. The average annual donation for Alberta was $562, the highest in the country and far outpacing the Canadian average of $446. The total annual volunteer hours were 228 million hours.
Alberta Online ResourcesAlberta Government www.alberta.ca Alberta Enterprise and eae.alberta.caAdvanced Education www.albertacanada.com
Doing Business in Alberta: Investing and Locating www.albertacanada.com/intl-business/establishing-a-company.htmlExporting your Products www.albertacanada.com/ab-business/exporting-your-products.htmlIndustry Sectors www.albertacanada.com/ab-business/alberta-industries.htmlRegional Development www.albertacanada.com/about-alberta/ regional-economic-development.htmlCommunity/Market Information www.albertacanada.com/about-alberta/the-economy.html
Visiting Alberta: Travel Alberta www.travelalberta.comList of Festivals in Alberta www.culture.alberta.ca/arts/artsfestivalsVacations Guide www.travelalberta.com/en/Vacation_Guides/Pages/ default.aspx?mrkt=CanadaProvincial Parks albertaparks.caTourism www.tpr.alberta.ca
Working and Living in Alberta: Immigrating www.albertacanada.com/immigration Things to Do www.tpr.alberta.ca and culture.alberta.ca/arts/artsfestivals/default.aspxHealth Care www.health.alberta.caEducation www.education.alberta.caAlberta Learning Information Service alis.alberta.caAdvanced Education and Technology eae.alberta.ca

For more information, contact:
Alberta Enterprise and Advanced Education 4th Floor, Commerce Place 10155-102 Street Edmonton, Alberta, Canada T5J 4L6
Tel. 780-427-6787 Fax 780-422-0061
ISBN: 978-1-4601-0357-9 ISSN: 1911-2513
August 2012