Highlights fra DANMAP 2018
44
Highlights fra DANMAP 2018
Transcript of Highlights fra DANMAP 2018

Highlights fraDANMAP
2018

DTU Fødevareinstituttet15. november 2019
Antibiotikaforbrug til dyr og mennesker – historisk overblik

DTU Fødevareinstituttet15. november 2019
Udvikling i antibiotikaforbrug til dyr og mennesker (kg aktivt stof)
131
tons
49
tons
2009 2014 2018
53
tons
50
tons
114
tons
100
tons

DTU Fødevareinstituttet15. november 2019
Relative fordelinger af biomasse og antibiotikaforbrug, dyr
Note: The live biomass is estimated from census data (pigs, cattle and pet animals) and production data (poultry, fur animals, aquaculture).
For poultry, the figures comprise only the biomass for the main production types (turkeys and broilers). The live biomass estimates for
poultry, aquaculture, horses and pet animals are based on 2012 data and may well be underestimated.
Biomasse Aktivt stof
DANMAP 2018

DTU Fødevareinstituttet15. november 2019
Antibiotika forbrug til svin (kg aktivt stof)
74.935
kg
2017 2018
- 0,4%
74.658
kg
104.068
kg
86.017
kg
74.658
kg
2009 2014 2018
- 28%
- 13%

DTU Fødevareinstituttet15. november 2019
Antibiotika forbrug til svin ( kg aktivt stof & behandlinger)
74.935
kg
2017 2018
- 0,4%
74.658
kg
104.068
kg
86.017
kg
74.658
kg
2009 2014 2018
- 28%
28
DAPD
34
DAPD
23
DAPD
- 33%
- 13%
24
DAPD
23
DAPD
2017 2018
- 4%
Eller målt i DAPD (DADD pr 1000 dyr pr dag)
10 DAPD svarer til at 1% af den pågældende population er under behandling på en given dag

DTU Fødevareinstituttet15. november 2019
0
1
2
3
4
5
6
7
8
9
10
11
09 10 11 12 13 14 15 16 17 18
DA
PD
(D
AD
D p
er
1000 a
nim
als
per
day)
Aminoglycosides Amphenicols
Lincosamides(a) Macrolides
Penicillin's, b-lactamase sensitive Penicillin's, others(b)
Pleuromutilins Sulfonamides and trimethoprim
Tetracyclines
All age groups, adjusted
0
20
40
60
80
100
120
140
09 10 11 12 13 14 15 16 17 18
Sows and piglets Weaners Finishers All age groups, adjusted
DA
PD
(D
AD
D p
er
1000 a
nim
als
per
day)
Antibiotika forbrug til svin – fald i behandlinger
DANMAP 2018

DTU Fødevareinstituttet15. november 2019
Forbrug af colistin og 3. og 4. generations cephalosporiner
3/9/2020
0
1
2
3
4
5
6
7
8
09 10 11 12 13 14 15 16 17 18
DA
PD
(D
AD
D p
er
1000 a
nim
als
per
day)
Sows and piglets Weaners
Finishers All age groups, adjusted
Colistin
0
20
40
60
80
100
120
09 10 11 12 13 14 15 16 17 18
Systemic treatment of pigs
Systemic treatment of cattle
Intramammary treatment of cattle
Kg a
ctive c
om
pound
Cephalosporins - 3rd and 4th generation
DANMAP 2018

DTU Fødevareinstituttet15. november 2019
Antibiotikaforbrug til kvæg 2009-2018
12.370
kg
2017 2018
+4%
12.865
kg
0.0
0.5
1.0
1.5
2.0
2.5
3.0
09 10 11 12 13 14 15 16 17 18
DA
PD
(D
AD
D p
er
1000 a
nim
als
per
day)
Aminoglycosides Amphenicols Cephalosporins Fluoroquinolones
Lincosamides Macrolides Other AB Penicillins, b-lactamase sensitive
Penicillins, others(a) Pleuromutilins Sulfonamides and trimethoprim Tetracyclines
Cattle
< 1 year
0.0
0.5
1.0
1.5
2.0
2.5
3.0
09 10 11 12 13 14 15 16 17 18
DA
PD
(D
AD
D p
er
1000 a
nim
als
per
day)
Cattle
> 1 year
DANMAP 2018

DTU Fødevareinstituttet15. november 2019
Forbruget til mink næsten halveret
0
10
20
30
40
50
60
09 10 11 12 13 14 15 16 17 18
DA
PD
(D
AD
D p
er
1000 a
nim
als
per
day)
Sulf-Trim
Lincosamides
Aminoglycosides
Macrolides
Penicillin's, others(a)
Tetracyclines
6.156
kg
3.689
kg
2017 2018
- 40%
! Øget fokus
! Handlingsplan
DANMAP 2018

DTU Fødevareinstituttet15. november 2019
Varm sommer presser forbruget til fisk i vejret
3557
kg
1697
kg
2017 2018
! Varm sommer
! Valg af antibiotika

DTU Fødevareinstituttet15. november 2019
ESVAC 2017 – Antibiotikaforbrug i EU

DTU Fødevareinstituttet15. november 2019
Fuldt følsomme Campylobacter jejuni (%) fra isolater
fra kyllinger, kvæg og humane infektioner
DANMAP 2018

DTU Fødevareinstituttet15. november 2019
Forekomst af ciprofloxacin resistens i Campylobacter jejuni
isolater fra kyllinger, kvæg og humane infektioner
DANMAP 2018

DTU Fødevareinstituttet15. november 2019
Relative fordelinger af (%) fuldt følsomme, resistente og multi-
resistente Salmonella Typhimurium fra svin, svinekød og humane
infektionerDANMAP 2018

DTU Fødevareinstituttet15. november 2019
Tendenser – E. coliFigure 7.2 Resistance (%) among Escherichia coli isolates from broilers, cattle and pigs, Denmark
DANMAP 2018
Broilers
Danish
Cattle
Danish
Pigs
Danish

DTU Fødevareinstituttet15. november 2019
Sammenhæng mellem antibiotika forbrug og fuldt
følsomme E. coli isolater fra slagtesvin og kvæg
DANMAP 2018

Antibiotikaforbruget til mennesker
Det totale forbrug
primærsektoren
hospitalssektoren

TOTALFORBRUGET AF ANTIBIOTIKA TIL MENNESKER

FORBRUGET I PRIMÆRSEKTOREN
Figure 5.3 Consumption of leading antimicrobial groups for systemic use in primary health care, DID, Denmark
DANMAP 2018
Data used for this f igure is based on total sales in Denmark (individuals and clinics)
ATC numbers stem from the 2019 edition of the Anatomical Therapeutic Chemical (ATC) classif ication system
0
1
2
3
4
5
6
2009 2010 2011 2012 2013 2014 2015 2016 2017 2018
DD
D p
er 1
00
0 in
ha
bit
an
t-d
ay
Beta-lactamase sensitivepenicillins (J01CE)
Penicillins with extendedspecrum (J01CA)
Macrolides (J01FA)
Tetracyclines (J01AA)
Beta-lactamase resistantpenicillins (J01CF)
Fluoroquinolones (J01MA)
Comb. of penicillins, incl.beta-lactamase inhibitors(J01CR)
Penicilliner udgør fortsat 2/3 af det samlede forbrug i primærsektoren – men forholdet mellem penicillinerne har
ændret sig væsentligt

HOSPITALSFORBRUGET
På hospitalerne udgjorde penicillinerne 54 %

TENDENSER OVER TID
149,8
27,8
18,6
55,3
324,6
-19,1
2,4
94,3
161,5
102,6
64,4
44,9
-19,0
258,9
156,8
726,7
184,0
41,2
Udv. 2009-
2018 i %
Table 5.8 Consumption of antimicrobial agents for systemic use in somatic hospitals (DDD/100 bed-days), Denmark
2009 2010 2011 2012 2013 2014 2015 2016 2017 2018
J01AA Tetracyclines 0,95 0,99 1,07 1,54 1,45 1,63 1,80 2,08 2,04 2,37
J01CA Penicillins w ith extended spectrum 12,02 11,45 11,35 12,47 12,88 13,56 14,11 14,46 15,66 15,37
J01CE Beta-lactamase sensitive penicillins 8,75 8,24 9,02 9,31 9,40 9,31 9,08 9,18 10,03 10,38
J01CF Beta-lactamase resistant penicillins 6,69 6,88 7,69 7,96 8,69 8,96 9,22 8,75 8,81 10,39
J01CRComb. of penicillins. incl. beta-
lactamase inhibitors 3,83 4,83 6,48 9,30 10,92 12,76 14,40 15,00 13,48 16,26
J01DC Second-generation cephalosporins 11,08 11,15 14,34 13,35 12,26 11,36 10,12 9,23 10,78 8,97
J01DD Third-generation cephalosporins 1,17 1,01 1,07 1,03 1,08 1,00 1,04 1,03 1,33 1,20
J01DH Carbapenems 1,42 1,61 2,33 2,51 2,76 1,92 2,79 2,68 2,83 2,77
J01EEComb. of sulfonamides and
trimethoprim. incl. derivatives 2,22 1,86 2,91 3,26 4,28 4,68 5,06 5,20 5,40 5,80
J01FA Macrolides 3,08 3,17 3,26 3,38 3,27 3,64 4,34 4,69 5,68 6,25
J01FF Lincosamides 0,46 0,43 0,48 0,60 0,64 0,65 0,57 0,62 0,64 0,76
J01GB Aminoglycosides 1,42 1,55 1,84 2,05 2,10 1,55 1,61 1,90 2,18 2,06
J01MA Fluoroquinolones 8,40 8,24 8,39 8,37 8,60 8,51 8,09 7,26 6,98 6,81
J01XB Polymyxins 0,06 0,09 0,08 0,09 0,12 0,19 0,17 0,19 0,19 0,23
J01XX08 Linezolid 0,20 0,20 0,29 0,31 0,36 0,34 0,44 0,36 0,37 0,52
J01XX09 Daptomycin 0,02 0,02 0,01 0,02 0,02 0,03 0,04 0,05 0,08 0,14
A07AA09 Intestinal antiinfectives (vancomycin) 0,17 0,25 0,40 0,47 0,49 0,52 0,47 0,49 0,52 0,50
J01,
P01AB01,
A07AA09
Antibacterial agents for systemic use,
including metronidazole and
vancomycin (total)
70,35 70,28 79,70 84,92 88,39 89,49 91,77 91,92 95,96 99,31
ATC group(a)Year
Therapeutic group
Udvikling, hvis målt i DDD/100 indlæggelser (DAD): 264 DAD i 2009 til 292 DAD i 2018 = 10 %

HOSPITALSFORBRUGET I DE NORDISKE LANDE, 2017
Vidar Möller, Folkhälsomyndigheten, 2018

HOSPITALSFORBRUGET I DE NORDISKE LANDE, 2017

HOSPITALSFORBRUGET I DE NORDISKE LANDE, 2017


MÅL 1, REDUKTION I ANTAL RECEPTER

MÅL 1
Figure 5.7b consumption of most used antimicrobials against respiratory infections and urinary tract infections, Denmark
DANMAP 2018
Data used in this f igure is based on registered sales to individuals
ATC numbers stem from the 2019 edition of the Anatomical Therapeutic Chemical (ATC) classif ication system
0
1
2
3
4
5
6
2009 2010 2011 2012 2013 2014 2015 2016 2017 2018
DD
D/1
00
0 i
nh
ab
ita
nt-
da
ys
Makrolides (J01FA), males
Makrolides (J01FA), females
Beta-lactamase sensitive penicillins (J01CE), males
Beta-lactamase sensitive penicillins (J01CE), females
0
1
2
3
4
2009 2010 2011 2012 2013 2014 2015 2016 2017 2018
DD
D/1
00
0 i
nh
ab
ita
nt-
da
ys
Trimethoprim (J01EA01) and Nitrofurantoin (J01XE01), males
Trimethoprim (J01EA01) and Nitrofurantoin (J01XE01), females
Pivmecillinam (J01CA08) and Sulfamethizol (J01EB02), males
Pivmecillinam (J01CA08) and Sulfamethizol (J01EB02), females
Penicillin V og makrolider har været
faldende siden 2012,
Nu følger antibiotika brugt til
behandling af urinvejsinfektion?

MÅL 2, ØG ANDELEN AF PENICILLIN V
33
43%
44%47%
Indenfor visse sygdomsgrupper stiger andelen af penicillin samtidig med at forbruget falder –
eksempel med indikationen mellemørebetændelse til små børn
Antibiotika brugt i
behandling af
mellemøre-
betændelse
til små børn
(0 – 4 år)

MÅL 3, REDUCER ANDELEN AF KRITISK VIGTIGE PÅ HOSP.
I Danmark er 3
antibiotikaklasser i
særligt fokus:
Cefalosporiner
Fluorkinoloner
Carbapenemer
Dette skyldes deres
vigtige betydning i
behandlingen af akut syge
patienter med fx
blodforgiftning og deres
samtidige evne til at skabe
resistens, hvilket gør at de
skal bruges med særlig
omtanke

Resistens i humane kliniske bakterier
National overvågning
Databaseret
Isolatbaseret
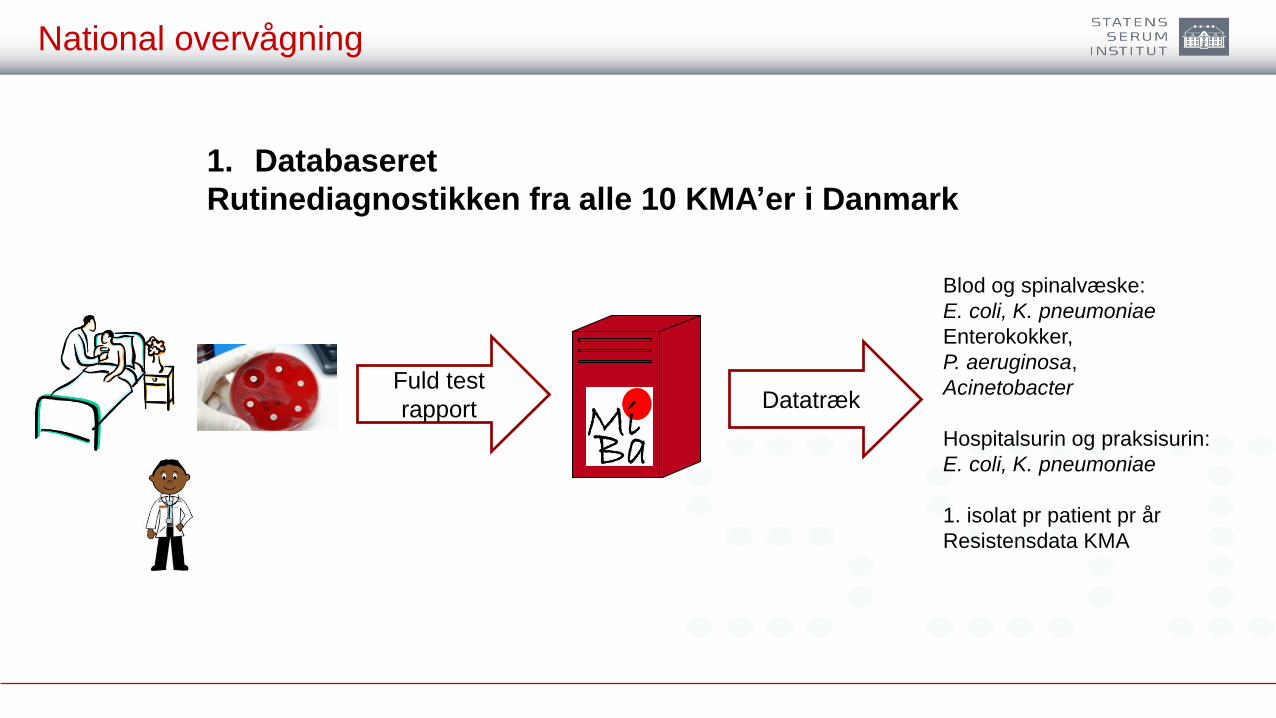
National overvågning
Fuld test
rapport Datatræk
Blod og spinalvæske:
E. coli, K. pneumoniae
Enterokokker,
P. aeruginosa,
Acinetobacter
Hospitalsurin og praksisurin:
E. coli, K. pneumoniae
1. isolat pr patient pr år
Resistensdata KMA
1. Databaseret
Rutinediagnostikken fra alle 10 KMA’er i Danmark

Total antal overvågede bakteriæmier
47%
19%
7%
11%
7%
5%4%
E. coli S. aureus S. pneumoniae
K. pneumoniae E. faecium E. faecalis
P. aeruginosa

Bakteriæmier per 100.000 indbyggere
51%
64%
-20%

E. coli, invasive
Figure 8.3 E. coli. Resistance (%) in invasive
isolates from humans, Denmark
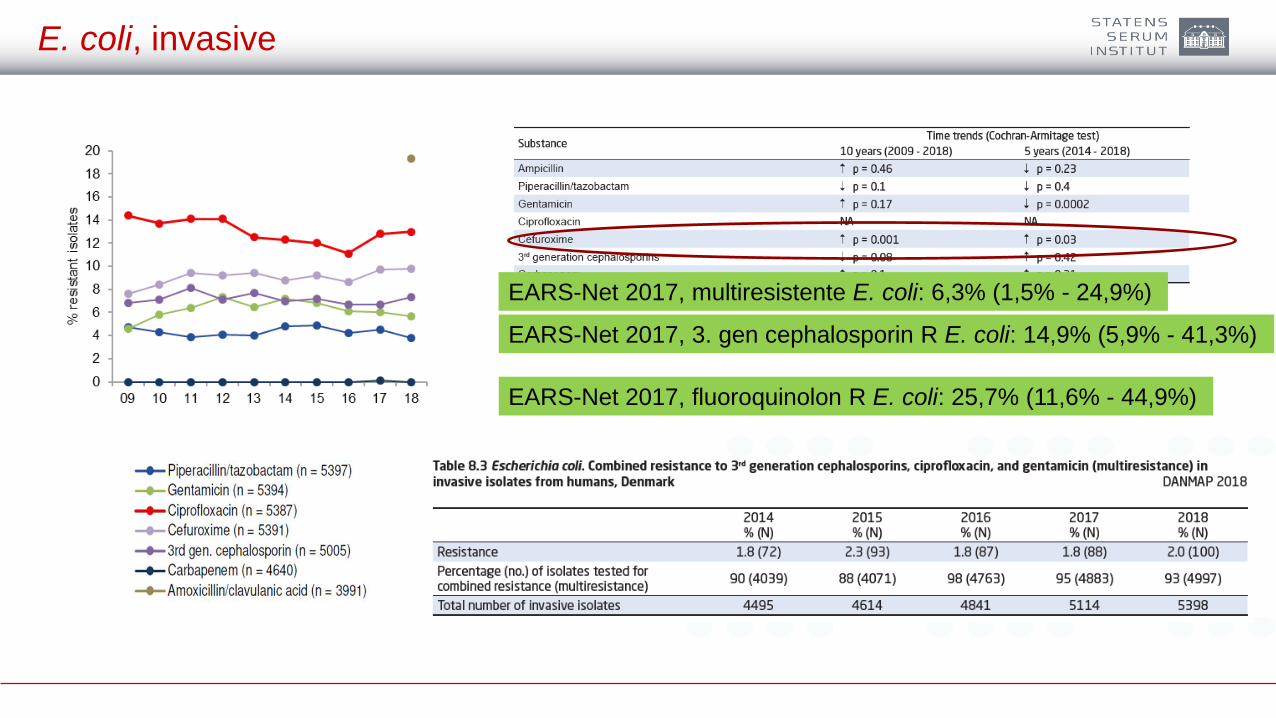
E. coli, invasive
EARS-Net 2017, multiresistente E. coli: 6,3% (1,5% - 24,9%)
EARS-Net 2017, 3. gen cephalosporin R E. coli: 14,9% (5,9% - 41,3%)
EARS-Net 2017, fluoroquinolon R E. coli: 25,7% (11,6% - 44,9%)

K. pneumoniae, invasive
Figure 8.6 K. pneumoniae. Resistance (%) in
invasive isolates from humans, Denmark
EARS-Net 2017, multiresistente K. pneumoniae: 20,5% (0% - 57,1%)
EARS-Net 2017, 3. gen cephalosporin R K. pneumoniae: 31,2% (4,6% - 76,3%)
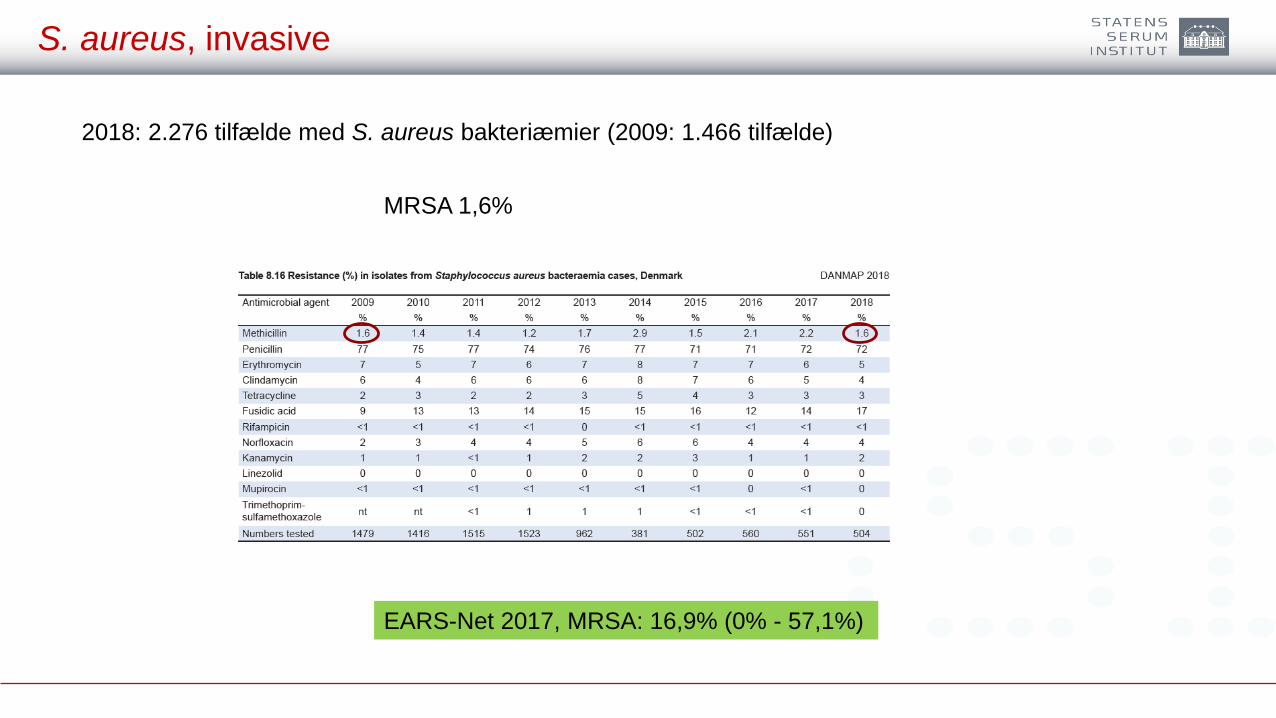
S. aureus, invasive
2018: 2.276 tilfælde med S. aureus bakteriæmier (2009: 1.466 tilfælde)
MRSA 1,6%
EARS-Net 2017, MRSA: 16,9% (0% - 57,1%)

Enterokokker, invasive
EARS-Net 2017, VRE: 14,9% (0% - 43,9%)

VRE, kliniske
Figure 8.14 Numbers of Enterococcus faecium and Enterococcus faecalis
isolates carrying vanA and vanB genes from clinical samples submitted to SSI
2009-2018 supplemented with data obtained from MiBa from 2016-2018, Denmark

CPE, kliniske + screeninger
2018: 156 CPE fra 141 pt, 15 fra blod
2017: 104 CPE fra 96 pt, 5 fra blod
2008-2013: 31 CPE
0
20
40
60
80
100
120
140
160
180
2008 2009 2010 2011 2012 2013 2014 2015 2016 2017 2018
OXA-48-group NDM NDM/OXA-48-group KPC VIM
More than one isolate was included from the same patient, if the isolates belonged to different bacterial species
and/or harboured different carbapenemases
Figure 8.13 Numbers of carbapenemase-producing Enterobacterales
(CPE), 2008-2018, Denmark

MRSA, nye tilfælde og epidemiologisk udvikling
2018: 3.669 nye MRSA anmeldelser
TUSIND TAK FOR OPMÆRKSOMHEDEN
Tusind tak til alle vores fantastiske
kolleger:
På SSI,
På DTU
I Fødevarestyrelsen
Og til alle vores samarbejdspartnere,
- på institutionerne
- i myndighederne
Og ikke mindst til de læger, tandlæger og
veterinærer,
Der tager prøverne og løfter opgaven
Om en fælles antibiotika-indsats