
HIGHLAND CREEK WASTEWATER TREATMENT PLANT 2017 … · Approval(ECA) Sewage No. 8261‐99EP4S,...
51
HIGHLAND CREEK WASTEWATER TREATMENT PLANT 2017 Annual Report March 31, 2018
Transcript of HIGHLAND CREEK WASTEWATER TREATMENT PLANT 2017 … · Approval(ECA) Sewage No. 8261‐99EP4S,...

HIGHLAND CREEK WASTEWATER TREATMENT PLANT
2017 Annual Report
March 31, 2018


CITY OF TORONTO WASTEWATER TREATMENT PLANT ANNUAL REPORTS
HIGHLAND CREEK WASTEWATER TREATMENT PLANT 2017 ANNUAL REPORT
EXECUTIVE SUMMARY
The Highland Creek Treatment Plant (HCTP) is one of four wastewater treatment facilities operated by the City of Toronto. This facility, located at 51 Beechgrove Drive has a rated capacity of 219,000 m3/day, or 219 ML/day, and serves an equivalent population of approximately 533,000. The Highland Creek Treatment Plant discharges into Lake Ontario and operates under Environmental Compliance Approval (ECA) Sewage No. 8261‐99EP4S, issued on October 28, 2015.
The average daily flow rate in 2017 was 170.9 ML/day. Influent concentrations of Biochemical Oxygen Demand (BOD5), Total Phosphorus (TP) and Total Suspended Solids (TSS) averaged 221.4 mg/L, 5.2 mg/L and 246.7 mg/L, respectively.
Highland Creek Treatment Plant achieved the following effluent quality and loading rates in 2017 in comparison to ECA limits:
ECA1 2017 Final Effluent Total Suspended Solids (TSS) 25 mg/L 14.1 mg/L Carbonaceous Biological Oxygen Demand (CBOD5) 25 mg/L 7.2 mg/L Total Phosphorus (TP) 1 mg/L 0.7 mg/L Escherichia Coli (E. Coli)2 200 CFU/100mL 16 CFU/100mL pH 6.0‐9.5 6.7 Total Chlorine Residual (TRC) (Dechlorination) 0.02 mg/L 0.004 mg/L TSS Loading Rate 5,475 kg/day 2,406 kg/day CBOD5 Loading Rate 5,475 kg/day 1,233 kg/day TP Loading Rate 219 kg/day 125 kg/day
1 Referenced from ECA No. 8261‐99EP4S, issued on October 28, 2015. 2 Arithmetic mean of monthly geometric mean data.
During 2017, the sludge feed flow to the dewatering centrifuges averaged 1,849 m3/day which resulted in 43.3 dry tonnes of dewatered solids being generated per day.
Ferrous chloride consumption for phosphorus removal was 9.54 tonnes as iron (Fe) per 1000ML wastewater treated. Polymer consumption in 2017 for waste activated sludge (WAS) thickening and sludge dewatering totalled 7.93 tonnes per 1000 ML treated. Total sodium hypochlorite (12%) consumption for disinfection totalled 52.14 m3 per 1000 ML. Sodium Bisulphite (SBS) (38%) consumption for effluent dechlorination totalled 15.79 m3 per 1000 ML.
There was one bypass occurrence in 2017 where there was no reduction in total effluent quality over the duration of the event. The total bypass flow was estimated to be 0.468 ML.
-i‐
CITY OF TORONTO WASTEWATER TREATMENT PLANT ANNUAL REPORTS
HIGHLAND CREEK WASTEWATER TREATMENT PLANT 2017 ANNUAL REPORT
The plant continued with various capital projects. Notable projects included: Biosolids Treatment Upgrades, and the Headworks and Odour Control Upgrades. A variety of preventative, predictive and reactive maintenance was completed, including the calibration of effluent monitoring equipment.
Total annual consumption of potable water, hydro, and natural gas was 2,642 m3, 30.6M kWh, and 6.6M m3, respectively. Plant operating costs for 2017 totalled $20.1M. In 2017, the Highland Creek Treatment Plant had an establishment of 68.5 employees. As of December 31, 2017 there were two health and safety incidents and two days lost due to work related injuries.
-ii‐
CITY OF TORONTO WASTEWATER TREATMENT PLANT ANNUAL REPORTS
HIGHLAND CREEK WASTEWATER TREATMENT PLANT 2017 ANNUAL REPORT
TABLE OF CONTENTS
EXECUTIVE SUMMARY.................................................................................................................................. i
GLOSSARY OF ABBREVIATIONS.....................................................................................................................v
1. INTRODUCTION.................................................................................................................................. 1
2. PLANT PROCESS OVERVIEW................................................................................................................ 2
2.1. Influent..................................................................................................................................................2 2.2. Preliminary Treatment..........................................................................................................................2 2.3. Primary Treatment................................................................................................................................2 2.4. Secondary Treatment............................................................................................................................2 2.5. Final Effluent .........................................................................................................................................3 2.6. Solids Handling......................................................................................................................................3 2.7. Solids Management ..............................................................................................................................3
3. 2017 PROCESS SUMMARY .................................................................................................................. 4
3.1. Process Parameters...............................................................................................................................4 3.2. Biosolids Management .........................................................................................................................6 3.3. Chemical Usage.....................................................................................................................................6 3.4. Bypasses, Overflows and Spills .............................................................................................................7 3.4.1. Bypasses................................................................................................................................................7 3.4.2. Overflows..............................................................................................................................................7 3.4.3. Spills ......................................................................................................................................................7 3.5. Complaints ............................................................................................................................................7 3.6 Effluent Quality Assurance or Control Measures..................................................................................7
4. CAPITAL PROJECTS.............................................................................................................................. 8
5. MAINTENANCE................................................................................................................................... 9
5.1. Solids Handling (Work Area 1) ..............................................................................................................9 5.2. Liquids Handling (Work Area 2) ..........................................................................................................10 5.3. Plant Services 1 (Work Area 3)............................................................................................................10 5.4. Plant Services 2 (Work Area 4)............................................................................................................11
6. UTILITIES ...........................................................................................................................................11
7. ADMINISTRATION .............................................................................................................................13
7.1. Operations and Maintenance Costs....................................................................................................13 7.2. Human Resources ...............................................................................................................................14 7.3. Occupational Health & Safety .............................................................................................................14 7.4. Staff Training and Development .........................................................................................................15 7.5. Utility Operator Certification ..............................................................................................................17 7.6. MOECC/MOL Correspondence ...........................................................................................................17
-iii‐
CITY OF TORONTO WASTEWATER TREATMENT PLANT ANNUAL REPORTS
HIGHLAND CREEK WASTEWATER TREATMENT PLANT 2017 ANNUAL REPORT
APPENDICES
APPENDIX A – Plant Schematic APPENDIX B – Influent and Effluent 2017 Performance Charts APPENDIX C – Historical Performance Data APPENDIX D – Influent and Effluent Metal Concentrations APPENDIX E – Dewatered Sludge Metal Analyses APPENDIX F – LOF Notice of Modification to Sewage Works
LIST OF TABLES
Table 1: Final Effluent Parameters ........................................................................................................ 4 Table 2: Process Summary..................................................................................................................... 5 Table 3: Chemical Usage Summary ....................................................................................................... 6 Table 4: Capital Projects ........................................................................................................................ 8 Table 5: Summary of Effluent Monitoring Equipment Calibration and Maintenance .......................... 9 Table 6: Average Unit and Total Utility Cost ....................................................................................... 12 Table 7: Plant Staffing.......................................................................................................................... 14 Table 8: Wastewater Treatment Certificates ...................................................................................... 17 Table 9: Correspondence submitted to the MOECC ........................................................................... 17
LIST OF FIGURES
Figure 1: Monthly Utility Consumption (Water, Hydro, Natural Gas)................................................. 12 Figure 2: Operations and Maintenance Cost Breakdown ................................................................... 13 Figure 3: Highland Creek Health & Safety Injury Summary................................................................. 15
-iv‐
CITY OF TORONTO WASTEWATER TREATMENT PLANT ANNUAL REPORTS
HIGHLAND CREEK WASTEWATER TREATMENT PLANT 2017 ANNUAL REPORT
GLOSSARY OF ABBREVIATIONS AAC Annual Average Concentration BOD5 Five‐Day Biochemical Oxygen Demand CBOD5 Five‐Day Carbonaceous Biochemical Oxygen Demand CEU Continuing Education Units CFU Colony Forming Units DAF Dissolved Air Flotation E. Coli Escherichia Coli ECA Environmental Compliance Approval Fe Iron HCTP Highland Creek Treatment Plant HP Horsepower HRT Hydraulic Retention Time kg kilogram kWh Kilowatt‐hour M Million MAC Monthly Average Concentration MGMD Monthly Geometric Mean Concentration MOECC Ministry of Environment and Climate Change MWh Megawatt‐hour m3 Cubic metre m3 /day Cubic metre per day mA Milliamps mg/L Milligrams per litre mL Millilitre ML Megalitre No. Number Q Flow Rate RAS Return Activated Sludge SBS Sodium Bisulphite SBS (P) Sodium Bisulphite Presence SS Suspended Solids TCR Total Chlorine Residual TP Total Phosphorus TS Total Solids TSS Total Suspended Solids TVS Total Volatile Solids TWAS Thickened Waste Activated Sludge μg/L Micrograms per litre WAS Waste Activated Sludge
-v‐

CITY OF TORONTO WASTEWATER TREATMENT PLANT ANNUAL REPORTS
HIGHLAND CREEK WASTEWATER TREATMENT PLANT 2017 ANNUAL REPORT
Definitions
% 1
%
100
-vi‐

CITY OF TORONTO WASTEWATER TREATMENT PLANT ANNUAL REPORTS
HIGHLAND CREEK WASTEWATER TREATMENT PLANT 2015 ANNUAL REPORT
1. INTRODUCTION
The Highland Creek Treatment Plant (HCTP) is one of four wastewater treatment facilities operated by the City of Toronto under the responsibility of the Wastewater Treatment section of Toronto Water. The facility is located at 51 Beechgrove Drive, south of Lawrence Avenue East and services an area bounded by Steeles Avenue on the north, Victoria Park Avenue on the west, the Rouge River on the east and Lake Ontario on the south. This area contains an estimated connected population of 533,000. The Highland Creek Treatment Plant has a rated capacity of 219,000 m3/day, or 219 ML/day.
Major treatment processes include preliminary treatment, primary treatment, secondary treatment, phosphorus removal with ferrous chloride, final effluent disinfection using sodium hypochlorite, and final effluent dechlorination using sodium bisulphite. Treated effluent is discharged to Lake Ontario. Solids handling processes include Waste Activated Sludge Thickening, sludge stabilization by anaerobic digestion followed by dewatering using high speed centrifuges. Two multiple hearth incinerators are used for the disposal of the dewatered biosolids. Numerous auxiliary systems are required for the proper operation of plant processes and include potable water, process water, HVAC, electrical power distribution, natural gas, and instrument air.
The Ministry of the Environment and Climate Change (MOECC) has classified the Highland Creek Treatment Plant as a Class IV wastewater treatment facility under Regulation 129/04. The facility operates under ECA Sewage No. 8261‐99EP4S, issued on October 28, 2015.
This report is a summary of plant operations and performance in 2017. Highlights of the report include a discussion of effluent quality and summaries of process operations, maintenance, chemical and utility consumption, capital projects, operational costs and human resources.
1
CITY OF TORONTO WASTEWATER TREATMENT PLANT ANNUAL REPORTS
HIGHLAND CREEK WASTEWATER TREATMENT PLANT 2017 ANNUAL REPORT
2. PLANT PROCESS OVERVIEW
A description of the plant process is included below. A Plant process flow diagram is included in Appendix A. Additional information on the plant's process can be found on the City of Toronto website1.
2.1. Influent
Wastewater from the Morningside Sanitary Trunk Sewer and Highland Creek Sanitary Trunk Sewer flows to the plant via a common sewer.
2.2. Preliminary Treatment
Raw wastewater enters the Headworks for grit and screenings removal. Aerated grit channels, cyclones and classifiers are used to remove and dewater grit; climber‐type bar screens remove rags and large pieces of debris. Ferrous chloride is applied at the head of the aerated grit channels for phosphorous removal. The removed grit and screenings are hauled to a sanitary landfill site.
2.3. Primary Treatment
Primary Treatment occurs in the Primary Clarification Tanks, where the flow velocity of the wastewater is reduced to allow heavier solids to settle to the bottom and lighter solids float to the top. There are 12 Primary Clarification Tanks. Sludge collectors in the tanks sweep the settled sludge, called "primary" or "raw" sludge, into sludge hoppers. The primary sludge and scum is then pumped out for further treatment and the wastewater, called "primary effluent", continues onto secondary treatment.
2.4. Secondary Treatment
The primary effluent receives secondary treatment through a conventional, suspended biomass activated sludge process in the Aeration Tanks. The mixed liquor consists of primary effluent mixed with return activated sludge (RAS), which is sludge removed from the Final Clarification Tanks and contains micro‐organisms that naturally occur in wastewater and facilitate its degradation. In the presence of oxygen, these micro‐organisms break down organic material in the wastewater. Air is supplied to the Aeration Tanks through electrically driven blowers. There are a total of 16 Aeration Tanks each equipped with ceramic fine bubble dome diffusers2.
The mixed liquor from the Aeration Tanks flows to 16 large quiescent Final Clarification Tanks, where the Activated Sludge is allowed to settle. A controlled quantity of this sludge is returned to the
1 https://www.toronto.ca/services‐payments/water‐environment/managing‐sewage‐in‐toronto/wastewater‐treatment‐
plants‐and‐reports/ 2 With exception of the first 2 sections of Aeration Tank 8.
2

CITY OF TORONTO WASTEWATER TREATMENT PLANT ANNUAL REPORTS
HIGHLAND CREEK WASTEWATER TREATMENT PLANT 2017 ANNUAL REPORT
Aeration Tanks as RAS in order to maintain a sufficient biomass concentration. The excess is removed as Waste Activated Sludge (WAS) and thickened using centrifuges.
2.5. Final Effluent
Sodium Hypochlorite is used to disinfect and kill pathogens in the final effluent. Sodium Bisulphite (SBS) is added after disinfection to remove excess chlorine (dechlorinate) from the wastewater, helping to protect the aquatic environment. The final effluent is discharged to Lake Ontario through an outfall pipe extending approximately 1000 m into the lake from the shore
2.6. Solids Handling
Primary sludge and scum, from the Primary Clarification Tanks, is first fed into primary anaerobic digesters. Secondary sludge (WAS), from the Secondary Clarification Tanks, is thickened through centrifugation before it is also fed into primary digesters, where it undergoes the same process as primary sludge. Centrifugation reduces the volume of sludge by separating solids from liquid. The Thickening process consists of five centrifuges. All primary sludge, thickened WAS (TWAS), and scum from the Primary and Secondary Clarification Tanks, collectively called sludge, is treated, handled and disposed of in a similar manner, consisting of anaerobic digestion, intermediate blending and storage, dewatering and then incineration and ash handling.
Anaerobic digestion is the biological degradation (stabilization) of organic materials (sludge and scum) in the absence of oxygen – it reduces volume of solids, destroys pathogens and mitigates sludge odour. The process produces digester gas, made up predominantly of methane. This gas is used as a supplementary fuel for plant needs, including process and space heating, thereby reducing the plant's operating costs and carbon footprint. The digesters are operated in the mesophilic temperature range (34 – 38oC). The target operating temperature for the digesters is 36oC. The Digestion process consists of a digester control building and four primary digesters.
Following digestion, the biosolids are conditioned with a polymer and dewatered by centrifugation. Centrifugation reduces the volume of sludge by separating solids from liquid. The Dewatering process consists of five centrifuges.
2.7. Solids Management
The dewatered biosolids are incinerated in one of the two multiple‐hearth incinerators. This thermal reduction process produces an ash that is mixed with effluent water from the scrubbers and pumped to one of two ash lagoons. When a lagoon is full, ash is removed and hauled to a landfill site for final disposal.
3

‐
CITY OF TORONTO WASTEWATER TREATMENT PLANT ANNUAL REPORTS
HIGHLAND CREEK WASTEWATER TREATMENT PLANT 2017 ANNUAL REPORT
3. 2017 PROCESS SUMMARY
3.1. Process Parameters
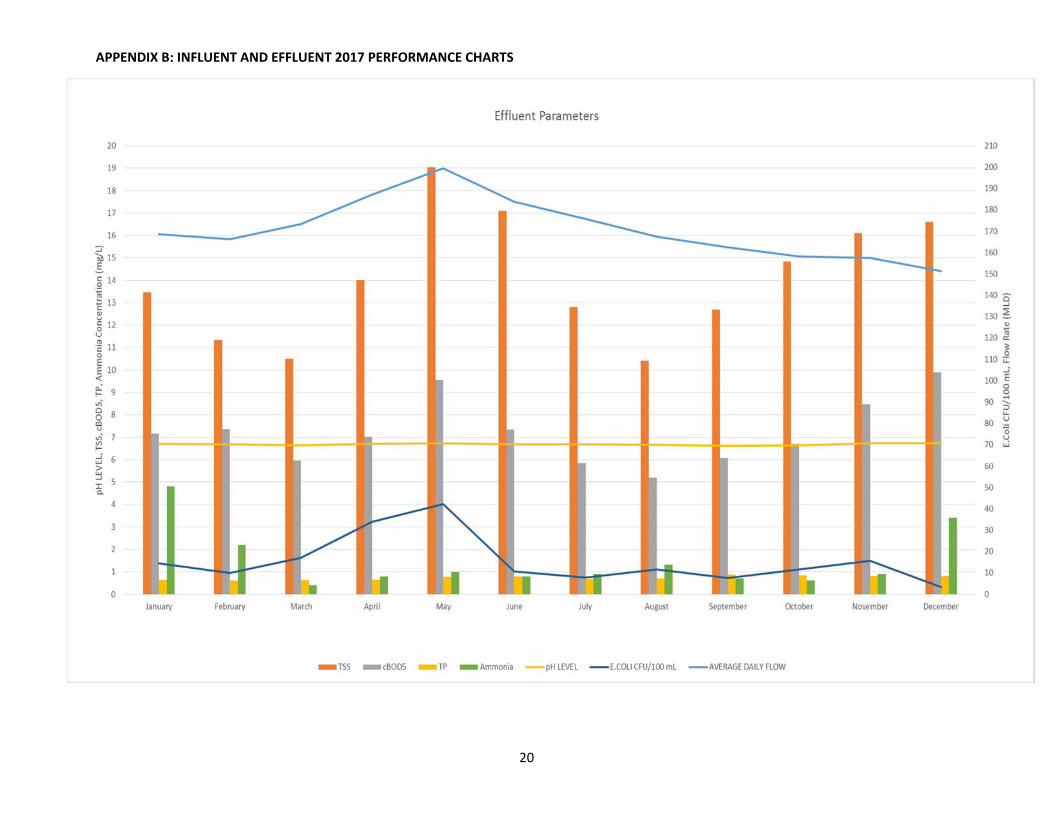
In 2017, the Highland Creek Treatment Plant continued to produce a high quality effluent. A summary of key final effluent parameters against the ECA objectives and limits are shown in Table 1. Regulated parameters are highlighted. Influent and effluent performance charts are available in Appendix B. Historical performance data is included in Appendix C.
Table 1: Final Effluent Parameters
Parameter cBOD5 (mg/L) TSS (mg/L) TP (mg/L) Chlorine Residual (mg/L)
E Coli (count/100mL)
January 7.2 13.5 0.64 0.006 15 February 7.4 11.3 0.60 0.006 10 March 6.0 10.5 0.63 0.009 18 April 7.0 14.0 0.66 0.013 34 May 9.5 19.0 0.76 0.006 43 June 7.3 17.1 0.79 0.002 11 July 5.8 12.8 0.67 0.004 8 August 5.2 10.4 0.71 0.002 12 September 6.1 12.7 0.87 0.000 8 October 6.7 14.8 0.84 0.003 12 November 8.5 16.1 0.82 0.002 16 December 9.9 16.6 0.81 0.002 4 Annual Average 7.2 14.1 0.7 0.004 16
Loading (kg/d) 1233 2406 125 N/A N/A Removal Efficiency1 (%) 96% 94% 86% N/A N/A
ECA Requirements2, 3
Effluent Objective2, 4 AAC: 15 mg/L AAC: 15 mg/L MAC: 0.9 mg/L MAC: 0 mg/L MGMD: 150
CFU/100 mL
Effluent Limit2, 4 AAC: 25 mg/L AAC: 25 mg/L MAC: 1 mg/L MAC: 0.02 mg/L MGMD: 200 CFU/100 mL
Average Waste Loading Limit2 5475 kg/d 5475 kg/d 219 kg/d N/A N/A
1 cBOD = 0.8 * BOD assumed for removal efficiency calculatons 2 Referenced from ECA No. 8261‐99EP4S, issued on October 28, 2015. 3 The ECA effluent objective and limit for pH is 6.5 to 8.5 and 6.0 to 9.5 respectively, inclusive, at all times. Effluent pH in 2017 was within the required objective and limit. 4 AAC refers to Annual Average Concentration, MAC refers to Monthly Average Concentration, and MGMD revers to Montly Geometric Mean Density
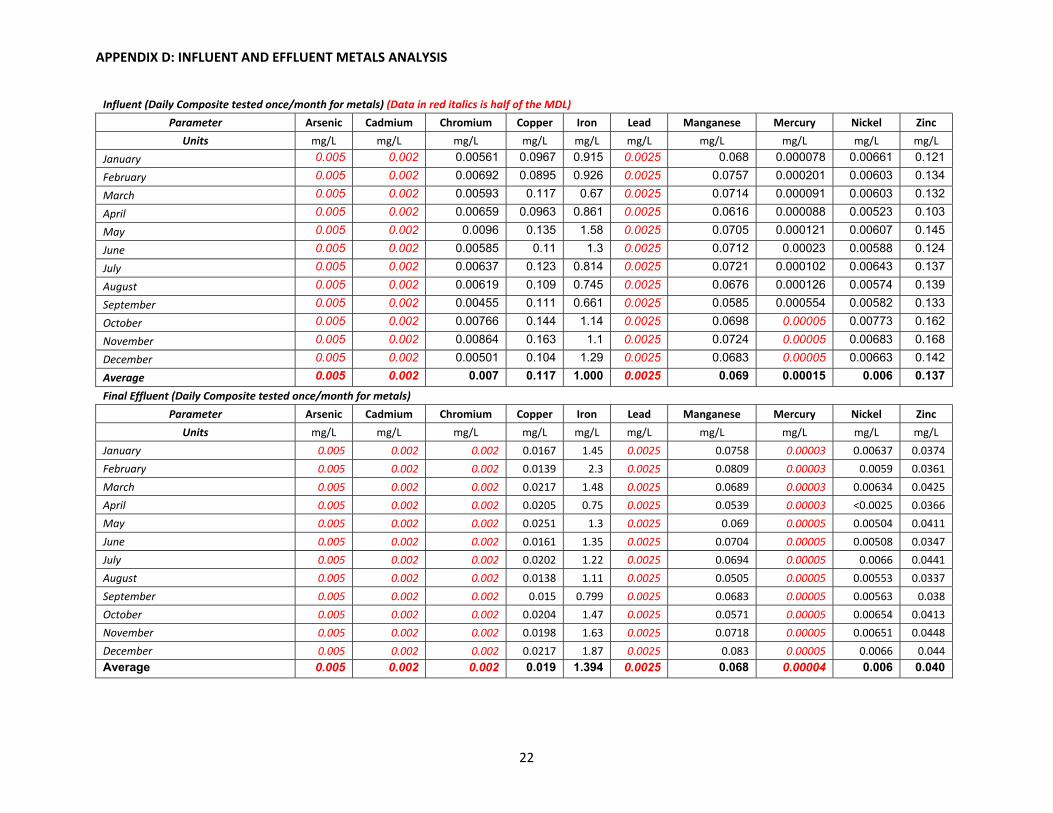
Influent and Final effluent concentrations of ten select heavy metals have been included in Appendix D. Any discharge into City sewers must meet the sewer use By‐law limits. Final effluent concentrations are presented to assess the treatment plant's removal capacity.
4
CITY OF TORONTO WASTEWATER TREATMENT PLANT ANNUAL REPORTS
HIGHLAND CREEK WASTEWATER TREATMENT PLANT 2017 ANNUAL REPORT
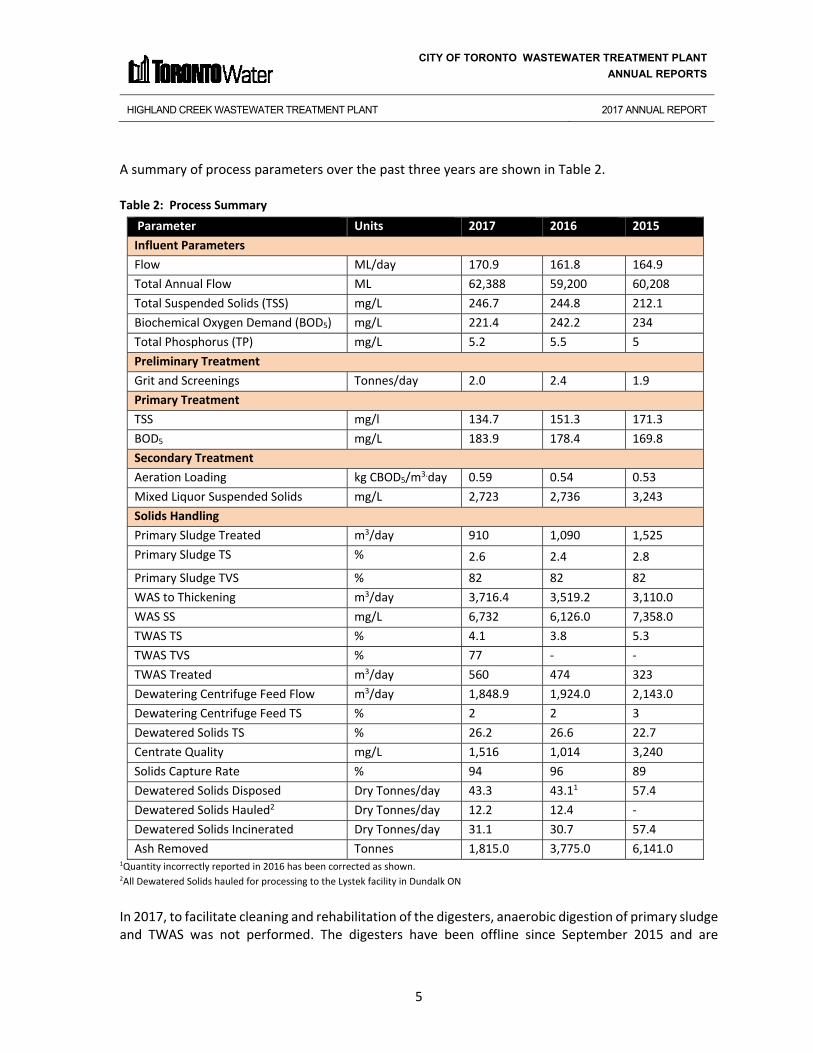
A summary of process parameters over the past three years are shown in Table 2.
Table 2: Process Summary Parameter Units 2017 2016 2015 Influent Parameters Flow ML/day 170.9 161.8 164.9 Total Annual Flow ML 62,388 59,200 60,208 Total Suspended Solids (TSS) mg/L 246.7 244.8 212.1 Biochemical Oxygen Demand (BOD5) mg/L 221.4 242.2 234 Total Phosphorus (TP) mg/L 5.2 5.5 5 Preliminary Treatment Grit and Screenings Tonnes/day 2.0 2.4 1.9 Primary Treatment TSS mg/l 134.7 151.3 171.3 BOD5 mg/L 183.9 178.4 169.8 Secondary Treatment Aeration Loading kg CBOD5/m3.day 0.59 0.54 0.53 Mixed Liquor Suspended Solids mg/L 2,723 2,736 3,243 Solids Handling Primary Sludge Treated m3/day 910 1,090 1,525 Primary Sludge TS % 2.6 2.4 2.8 Primary Sludge TVS % 82 82 82 WAS to Thickening m3/day 3,716.4 3,519.2 3,110.0 WAS SS mg/L 6,732 6,126.0 7,358.0 TWAS TS % 4.1 3.8 5.3 TWAS TVS % 77 ‐ ‐
TWAS Treated m3/day 560 474 323 Dewatering Centrifuge Feed Flow m3/day 1,848.9 1,924.0 2,143.0 Dewatering Centrifuge Feed TS % 2 2 3 Dewatered Solids TS % 26.2 26.6 22.7 Centrate Quality mg/L 1,516 1,014 3,240 Solids Capture Rate % 94 96 89 Dewatered Solids Disposed Dry Tonnes/day 43.3 43.11 57.4 Dewatered Solids Hauled2 Dry Tonnes/day 12.2 12.4 ‐
Dewatered Solids Incinerated Dry Tonnes/day 31.1 30.7 57.4 Ash Removed Tonnes 1,815.0 3,775.0 6,141.0
1Quantity incorrectly reported in 2016 has been corrected as shown. 2All Dewatered Solids hauled for processing to the Lystek facility in Dundalk ON
In 2017, to facilitate cleaning and rehabilitation of the digesters, anaerobic digestion of primary sludge and TWAS was not performed. The digesters have been offline since September 2015 and are
5

CITY OF TORONTO WASTEWATER TREATMENT PLANT ANNUAL REPORTS
HIGHLAND CREEK WASTEWATER TREATMENT PLANT 2017 ANNUAL REPORT
expected to be back in service in 2019. In 2017, the Highland Creek Treatment Plant encountered no abnormal operating problems, and continued to produce a high quality effluent which surpassed requirements of the effluent objectives as described in condition 6 of the plant's ECA. This was achieved through continuous improvement in operations and maintenance of treatment processes, and infrastructure delivery. The plant also met Federal Government effluent monitoring requirements for un‐ionized ammonia and acute toxicity.
3.2. Biosolids Management
In 2017, the daily average inflow to the Highland Creek Treatment Plant was 170.9 ML/day. The flow projections for 2018 do not exceed the plant rated capacity of 219 ML/day and are expected to generate a sludge volume that will be +/‐ 5% of the given volume for 2017.
During 2017, the sludge feed flow to the dewatering centrifuges averaged 1,849 m3/day which resulted in 43.3 dry tonnes of dewatered solids being generated per day.
3.3. Chemical Usage
Several chemicals are used during the treatment process at the plant. Table 3 outlines the chemical consumption for the current and previous year based on 1000ML of water treated in the facility for the past three years.
Table 3: Chemical Usage Summary 2017 2017 2016 2016 2015 2015
Process Chemical Usage (/1000ML
Unit Cost Usage (/1000ML
Unit Cost Usage (/1000ML
Unit Cost
treated) treated) treated) Phosphorus Ferrous 9.54 $800/ 11.30 $800/ 14.48 $815/ Removal Chloride as Fe tonnes tonne Fe tonnes tonne Fe tonnes tonne Fe
Disinfection Sodium Hypochlorite
52.14 m3 $157/m3 37.47 m3 $129/ m3 21.45 m3 $128/ m3
Dechlorination Sodium Bisulphite
15.79 m3 $282/ m3 7.31 m3 $303/ m3 2.78 m3 $299/ m3
Biosolids Dewatering and WAS
Polymer 7.93 tonnes
$2390/ tonne
6.83 tonnes
$2390/ tonne
3.69 tonnes
$4237/ tonne
Thickening
There was a 47% increase in consumption of Sodium Hypochlorite from 2016. This is due to an increase of usage for RAS chlorination to control filamentous bulking. In addition the plant increased its chlorine dose to maintain consistent E.coli levels during months when the effluent suspended solids concentration was approaching the objective level. The corresponding increase in the Sodium Bisulphite dosage was required to adequately provide dechlorination to maintain the effluent total chlorine residual limit. Usage of all other chemicals has been similar year over year.
6
CITY OF TORONTO WASTEWATER TREATMENT PLANT ANNUAL REPORTS
HIGHLAND CREEK WASTEWATER TREATMENT PLANT 2017 ANNUAL REPORT
3.4. Bypasses, Overflows and Spills
3.4.1. Bypasses
There was one bypass event in 2017. Leakage at one of the bypass gates in the South East plant allowed approximately 1% of the average daily flow to bypass secondary treatment. The total volume of the bypass flow was estimated to be 0.468 ML and did combine with the rest of the plant’s fully treated effluent which was disinfected and dechlorinated before being discharge to the lake. . The bypass produced no reduction in total effluent quality over the duration of the event.
3.4.2. Overflows
There were no overflow events at the Highland Creek Treatment Plant in 2017. An overflow is defined as a discharge to the environment from the plant at a location other than the plant outfall downstream of the final effluent sampling station.
3.4.3. Spills
There were two spills reported to the MOECC in 2017. The first spill event was on January 5th when approximately 25 litres of RAS overflowed and required remediation. The second spill was on February 21st when approximately 50‐75 litres of treated effluent water leaked onto the paved road and catch basin and was pumped back into the treatment process. In both instances, the spills were contained, remediated, and reported to the Spill Action Centre of the MOECC.
3.5. Complaints
The Highland Creek Treatment Plant received two complaints related to odour. The complaints were logged on March 18th and June 28th. For additional information, please refer to Section 7.6 – MOECC/MOL Correspondence.
3.6 Effluent Quality Assurance or Control Measures
Analytical tests to monitor required parameters are performed by the Toronto Water Laboratory which is accredited to ISO/IEC 17025 by Canadian Association for Laboratory Accreditation Inc. Plant operation and performance is monitored by licensed plant technicians as well as by the facility management team. Standard Operation Procedures, emergency plans, equipment preventative and predictive maintenance, and a network of support staff, help ensure a rapid and effective response to issues, and maintain the high quality of the effluent and biosolids.
7
CITY OF TORONTO WASTEWATER TREATMENT PLANT ANNUAL REPORTS
HIGHLAND CREEK WASTEWATER TREATMENT PLANT 2017 ANNUAL REPORT
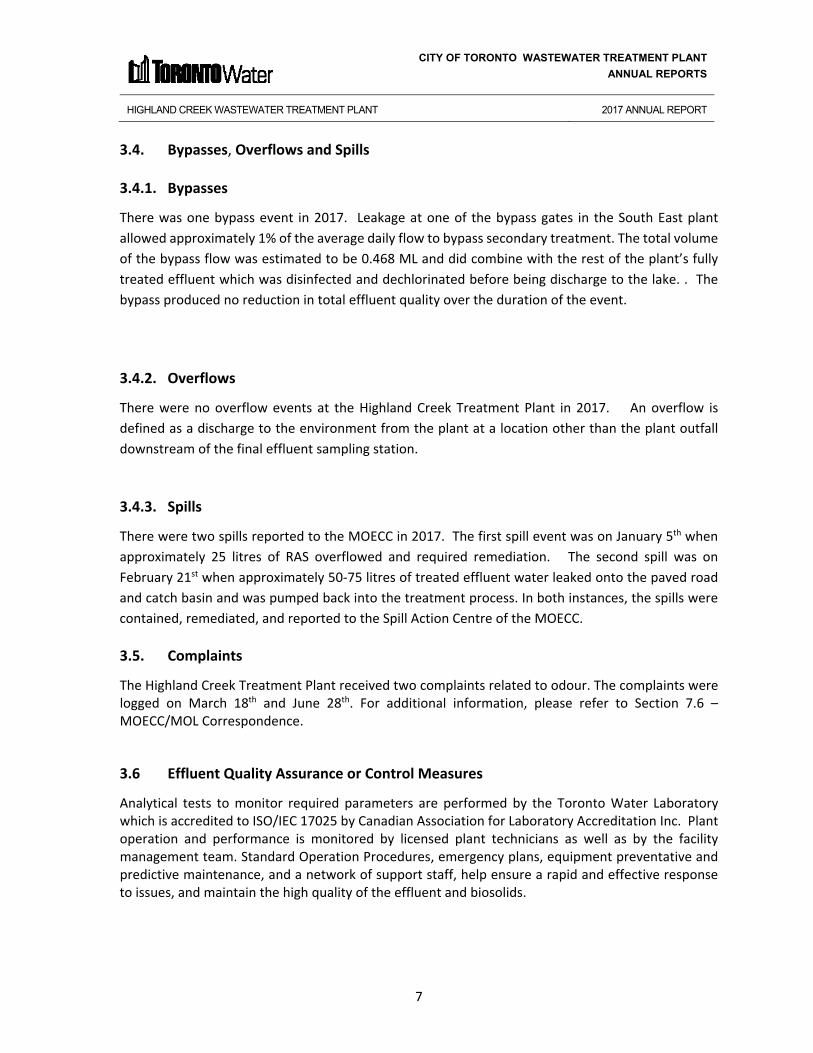
4. CAPITAL PROJECTS
Under Toronto Water’s capital program, the Highland Creek Treatment Plant commenced or continued with the capital works projects and studies listed in Table 4: Capital Projects4.
Table 4: Capital Projects
Project Name Project Description Project Stage (Dec 31, 2017)
Biosolids Treatment Unit New dewatering centrifuges and refurbishment of multiple hearth furnaces
Construction
Headworks and Odour Control New Headworks building with screening and grit removal. New odour control for liquids treatment process
Construction
Process Control Building Extension to administration building with office and meeting space and upgrades to existing
Construction
RAS Pumping, Aeration and Phosphorus Removal
New chemical dosing facility for phosphorous removal and aeration upgrades to South East plant
Design
Electrical Condition Assessment Project #6 Electrical upgrades including new MCC and RPUs to the North/South West plant
Construction
PLC Platform Migration Site wide upgrades to various Programmable Logic Controllers
Construction
Firm Capacity, Liquid Train Upgrades and Process Roadmap
Undertake various process upgrades to maintain firm capacity and process roadmap to assess future requirements and technologies.
Design
Tunnel Concrete Inspection & Repairs Site wide concrete repairs and ongoing inspection services
Construction
Digester Cleaning and Rehabilitation Rehabilitation of four digesters, including new waste gas burners
Construction
Disinfection and Electrical Upgrades Upgrades to disinfection and dechlorination chemical dosing systems and various electrical upgrades.
Design
Fluidized Bed Incinerator New fluidized bed incineration facility Design
Communication System Upgrade Upgrades to site wide communication system
Study
8

CITY OF TORONTO WASTEWATER TREATMENT PLANT ANNUAL REPORTS
HIGHLAND CREEK WASTEWATER TREATMENT PLANT 2017 ANNUAL REPORT
5. MAINTENANCE
Staff from the Highland Creek Treatment Plant performed a variety of preventative, predictive and reactive maintenance on a diverse spectrum of equipment. Equipment availability and reliability ensures operational requirements are achieved.
The calibration and maintenance records of flow meters, automatic samplers and on‐line analysers for regulated parameters was completed in 2017, and found to be within acceptable limits. A summary of effluent monitoring equipment calibration and maintenance performed in 2017 is included in Table 5.
Table 5: Summary of Regulated Parameters Monitoring Equipment Calibration and Maintenance Calibration and/or Maintenance Record Completion Date
Primary Influent Flow Meter Phase 1 Calibration Jan 4, Sept 9, 2017
Primary Influent Flow Meter Phase 4 Calibration Feb 12, Dec 18, 2017
Primary Influent Flow Meter Old 1‐4 Calibration Apr 29, Dec 16, 2017
Primary Influent Flow Meter Old 5‐8 Calibration Apr 29, Dec 16, 2017
Final Effluent pH and Temperature Meter Calibration Oct 20, 2017
HACH DR3900 Spectrophotometer Calibration June 17, 2017
Influent Auto Sampler Calibration and Preventative Maintenance every 3 months
Mar 20, Jun 15, Sept 15, Dec 20, 2017
Final Effluent Auto Sampler Calibration and Preventative Maintenance every 3 months
Jan 26, Mar 22, Jun 15, Dec 28, 2017
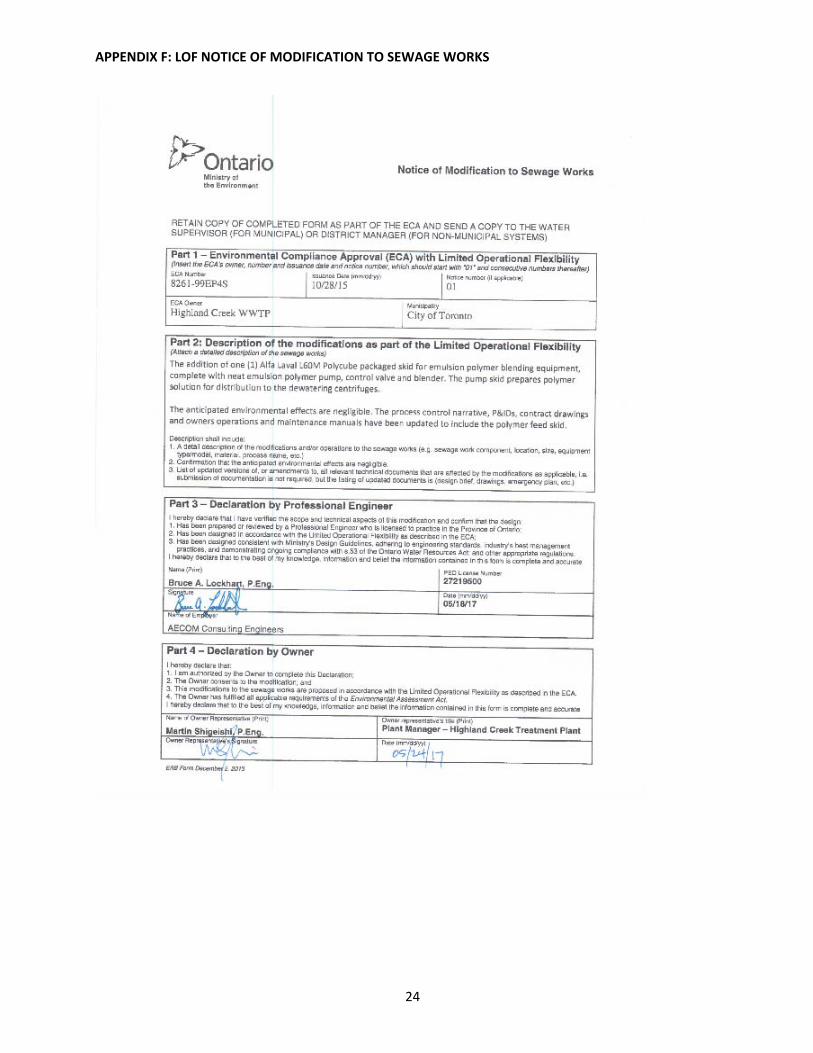
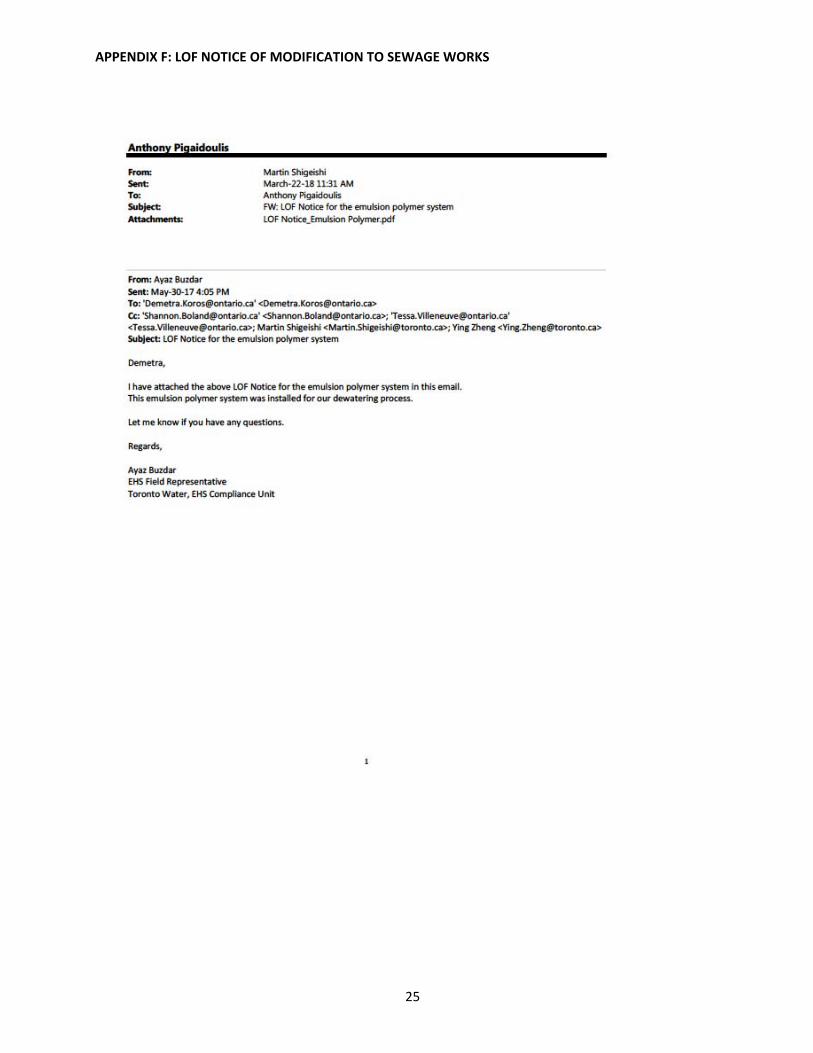
Under condition 10(6) (j) of the ECA, related to Limited Operability Flexibility, one Notice of Modification to Sewage Works for the installation of a emulsion polymer chemical system was submitted on May 30, 2017 to the Water Supervisor of the MOECC. A copy of the notice can be found in Appendix E.
The following is a summary, by Work Area, of significant maintenance activities completed in 2017; these are maintenance activities as per Conditions 10(6) (c) of the ECA.
5.1. Solids Handling (Work Area 1)
Work Area 1 encompasses the solids treatment portion of the plant including sludge digestion, dewatering, and incineration. The following major maintenance was completed in 2017 in this Work Area: Overhauled 2 Ash slurry pumps for Incinerator #1 and one pump for Incinerator #2 Repaired 2 Ash slurry hoppers and level controllers and isolation valves Overhauled Incinerator #1 and Incinerator #2 quencher/scrubber Replaced sludge grinder Replaced sections of ash slurry piping and check valves
9

CITY OF TORONTO WASTEWATER TREATMENT PLANT ANNUAL REPORTS
HIGHLAND CREEK WASTEWATER TREATMENT PLANT 2017 ANNUAL REPORT
Removed Incinerator #2 clinkers and broken refractory Removed refractory from Incinerator #2 broken rabble arms Repaired centrifuge feed lines Tuned burners on Incinerator #1 and Incinerator #2 Continuous SCADA upgrades for incinerators, sludge feed, and polymer mixing system Rebuilt one polymer feed pump and polymer neat pump
5.2. Liquids Handling (Work Area 2)
Work Area 2 encompasses the liquid treatment portion of the plant including grit and screening removal, primary clarification, aeration and secondary clarification, TWAS, phosphorous removal, effluent disinfection and dechlorination. The following major maintenance was completed in 2017 for Work Area 2:
Structural repairs to Primary Tanks 5, 6, 7, 8, 9, 10, 11 and 12 Structural repairs to Final Tank 5, 6, 7, 10, 13, 14 and 16 Various primary and final tank sludge and scum collector repairs Structural and diffuser repairs to Grit Channels 1, 2, 3 and 4 Repairs to Bar Screens 1, 2, 3 and 5 Repairs to all Turblex blowers Rebuild of Ferrous Chloride pumps and Sodium Hypochlorite pumps Raw sludge, Return Activated Sludge and scum pump repairs
o Thickening Centrifuges 1 and 6 overhauled o Rebuild of TWAS transfer pumps and polymer dosing pumps
5.3. Plant Services 1 (Work Area 3)
Work Area 3 encompasses various plant support services such as effluent water pumping, instrument air system, buildings and grounds maintenance and building HVAC systems. The following maintenance was completed in 2017 for Work Area 3:
Plant roadway lighting upgrades Forklifts, Scissor lift and Overhead Cranes annual inspections Maintained and repaired unlicensed vehicles (personnel vehicles for plant use only) Disposed of environmental wastes, fluorescent bulbs and batteries Repaired various potholes on all plant roadways Continuous improvement of tunnel and outside building lighting Replaced sump pumps in various locations Inspection and repairs, as required, for all Back Flow Preventers Preventative maintenance on Emergency generators (Headhouse & Solids Disposal Building) Repaired and replaced heating valves and piping in various location Repaired and replaced heating booster pumps in various locations Replaced corroded effluent water piping and valves in various locations
10

CITY OF TORONTO WASTEWATER TREATMENT PLANT ANNUAL REPORTS
HIGHLAND CREEK WASTEWATER TREATMENT PLANT 2017 ANNUAL REPORT
Repaired and replaced heating coils Maintained monthly inspections on fire extinguishers Maintained monthly inspections on elevators Preventive maintenance and repairs on plant HVAC systems Coordinate all landscaping, grounds keeping and snow removal Coordinate with Toronto Security all repairs, replacement and upgrades to cameras, doors, gates
and locks Install new scum collector on #10 Primary Clarifier Coordinate maintenance and repairs on licensed vehicles
5.4. Plant Services 2 (Work Area 4)
Work Area 4 encompasses various plant support services such as the digester gas system, boilers, process ventilation, odour control systems and plant fire protection. The following maintenance was completed in 2017 for Work Area 4:
Serviced 5 boilers and inspected all control systems Optimized operations of 4 boiler hot water feed pumps Monthly maintenance and servicing of all 7 ozone generators Monthly testing and service of all plant gas monitoring systems Tested and serviced all plant fire hydrants as needed Replaced 2 hot water pumps in the plant Rebuilt or serviced 6 hot water pumps Overhauled primary tanks #5, #6, #7, and #8 Overhauled final tanks #5, #6, #7, #10, #13, #14, and #16 Serviced and maintained 2 biofilters Rebuilt 2 RAS pumps in South East plant (complete with new impellers) Serviced heating system piping, coils and glycol system Various plant upgrade projects Installed new scum collector on #10 Primary Clarifier
6. UTILITIES
A summary of monthly utility consumption for the previous three years at Highland Creek Treatment Plant is provided in Figure 1. Table 6 below summarizes the total cost and average unit cost for water, hydro, and natural gas. Total annual consumption of potable water, hydro, and natural gas was 2,642 m3, 30.6M kWh, and 6.6M m3, respectively.
11

CITY OF TORONTO WASTEWATER TREATMENT PLANT ANNUAL REPORTS
HIGHLAND CREEK WASTEWATER TREATMENT PLANT 2017 ANNUAL REPORT
Figure 1: Monthly Utility Consumption (Water, Hydro, Natural Gas)
Table 6: Average Unit and Total Utility Cost Utility 2017 2016 2015
Water Unit Cost ($/m3) 3.81 3.63 2.48
Water Total Cost ($/year) 10,074 6,991 7,734
Hydro Unit Cost ($/kWh) 0.12 0.14 0.13
Hydro Total Cost ($/year) 3.69M 4.66M 4.45M
Natural Gas Unit Cost ($/m3) 0.22 0.21 0.21
Natural Gas Total Cost ($/year) 1.42M 1.53M 2.27M
12
CITY OF TORONTO WASTEWATER TREATMENT PLANT ANNUAL REPORTS
HIGHLAND CREEK WASTEWATER TREATMENT PLANT 2017 ANNUAL REPORT
7. ADMINISTRATION
7.1. Operations and Maintenance Costs
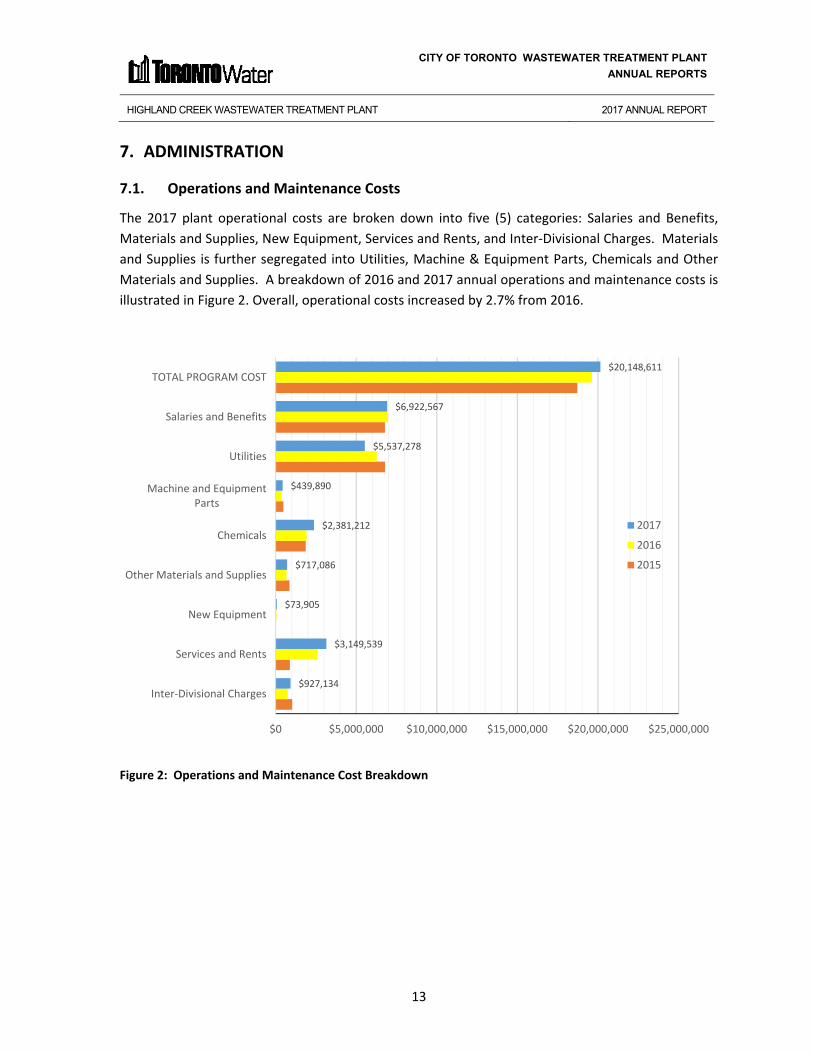
The 2017 plant operational costs are broken down into five (5) categories: Salaries and Benefits, Materials and Supplies, New Equipment, Services and Rents, and Inter‐Divisional Charges. Materials and Supplies is further segregated into Utilities, Machine & Equipment Parts, Chemicals and Other Materials and Supplies. A breakdown of 2016 and 2017 annual operations and maintenance costs is illustrated in Figure 2. Overall, operational costs increased by 2.7% from 2016.
TOTAL PROGRAM COST
Salaries and Benefits
Utilities
Machine and Equipment Parts
Chemicals
Other Materials and Supplies
New Equipment
Services and Rents
Inter‐Divisional Charges $927,134
$3,149,539
$73,905
$717,086
$2,381,212
$439,890
$5,537,278
$6,922,567
$20,148,611
2017
2016
2015
$0 $5,000,000 $10,000,000 $15,000,000 $20,000,000 $25,000,000
Figure 2: Operations and Maintenance Cost Breakdown
13
CITY OF TORONTO WASTEWATER TREATMENT PLANT ANNUAL REPORTS
HIGHLAND CREEK WASTEWATER TREATMENT PLANT 2017 ANNUAL REPORT
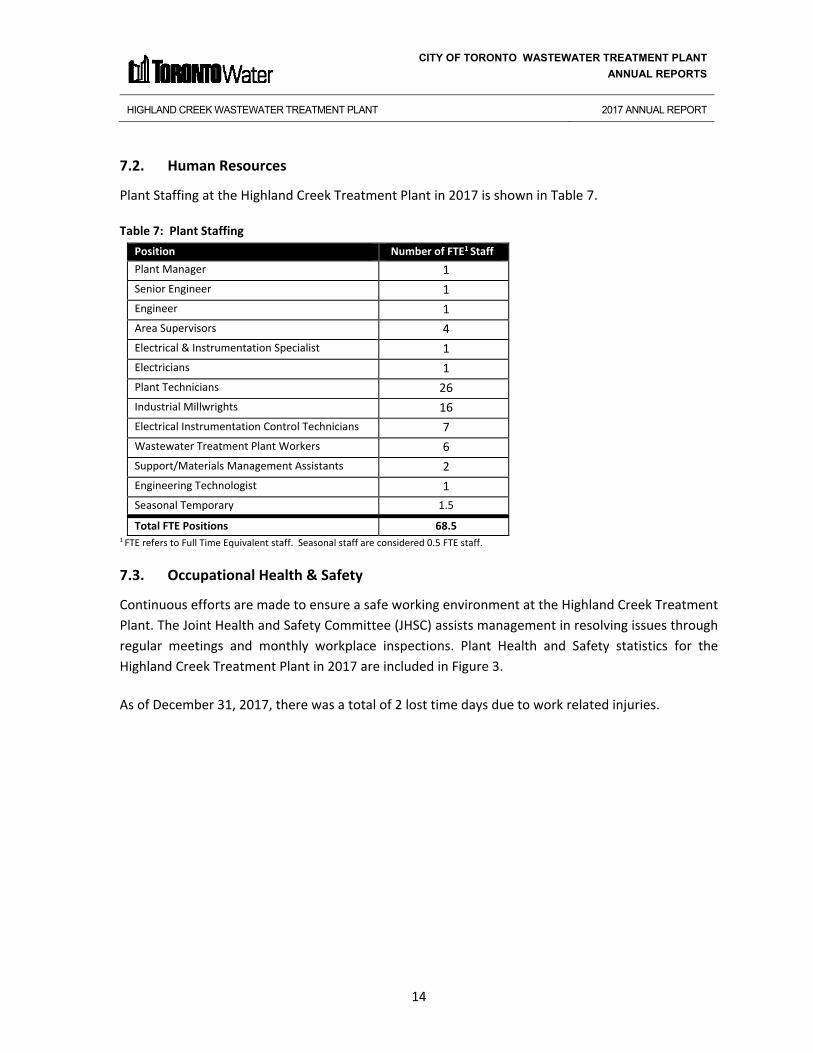
7.2. Human Resources
Plant Staffing at the Highland Creek Treatment Plant in 2017 is shown in Table 7.
Table 7: Plant Staffing Position Number of FTE1 Staff Plant Manager 1 Senior Engineer 1 Engineer 1 Area Supervisors 4 Electrical & Instrumentation Specialist 1 Electricians 1 Plant Technicians 26 Industrial Millwrights 16 Electrical Instrumentation Control Technicians 7 Wastewater Treatment Plant Workers 6 Support/Materials Management Assistants 2 Engineering Technologist 1 Seasonal Temporary 1.5
Total FTE Positions 68.5 1 FTE refers to Full Time Equivalent staff. Seasonal staff are considered 0.5 FTE staff.
7.3. Occupational Health & Safety
Continuous efforts are made to ensure a safe working environment at the Highland Creek Treatment Plant. The Joint Health and Safety Committee (JHSC) assists management in resolving issues through regular meetings and monthly workplace inspections. Plant Health and Safety statistics for the Highland Creek Treatment Plant in 2017 are included in Figure 3.
As of December 31, 2017, there was a total of 2 lost time days due to work related injuries.
14

CITY OF TORONTO WASTEWATER TREATMENT PLANT ANNUAL REPORTS
HIGHLAND CREEK WASTEWATER TREATMENT PLANT 2017 ANNUAL REPORT
2017 2016 2015 Lost Time 2 5 2 Medical Aid 2 1 0 Non Reportable Injuries 0 5 3 Recurrence 0 1 0
0
1
2
3
4
5
6
7
8
9
10
11
12
13
Number
of O
ccurren
ces
Figure 3: Highland Creek Health & Safety Injury Summary
7.4. Staff Training and Development
The Strategic Planning and Workforce Development unit of Toronto Water facilitates a comprehensive training programs that expands the abilities of the staff, resulting in better service to the public.
Training attended by Highland Creek Treatment Plant operations and skilled trades staff in 2017 includes the list of courses shown below. Some of these courses were eligible for Continuing Education Units (CEU’s) from the Ontario Environmental Training Consortium (OETC). Additional training related to the start‐up and commissioning of new equipment/systems as installed as part of the capital program was provided as required.
a) Technical and Health and Safety Training:
15
CITY OF TORONTO WASTEWATER TREATMENT PLANT ANNUAL REPORTS
HIGHLAND CREEK WASTEWATER TREATMENT PLANT 2017 ANNUAL REPORT
2015 Ontario Electrical Safety Code (26th Edition) New And Amended Requirements General Level 1
2015 Ontario Electrical Safety Code (26th Edition) New And Amended Requirements General Level 2
Air Purifying Respirators (2017) Arc Flash for Non‐Qualified Persons Centrifugal and Positive Displacement Pump Operation Confined Space Awareness ½ Day (2016‐2018) Industrial Maintenance Technician (ITM)M Certification Machinery Installation Using Laser Based Measurements Wastewater Plant Technician Process Training Wastewater Treatment Certification Program Level 3 & 4
b) Other Training: Human Rights in the Workplace Leadership skills for Non‐Managers Preparing To Move Into Supervision The Business of Environmental Compliance WMS AVANTIS Workshop Tailgate – Distracted Driving Tailgate – TW Emergency Plan Tailgate – Hazard Identification and Reporting Tailgate – WHMIS 2015: New chemical Safety Information System
16

‐
CITY OF TORONTO WASTEWATER TREATMENT PLANT ANNUAL REPORTS
HIGHLAND CREEK WASTEWATER TREATMENT PLANT 2017 ANNUAL REPORT
7.5. Utility Operator Certification
Toronto Water has incorporated the requirement of a Class I operating licence for all skilled trade job profiles at Wastewater Treatment facilities. As part of this initiative, general operational/process training was delivered in order to prepare staff for the certification examination. Table 8 summarizes the status of operator certification at the Highland Creek Treatment Plant in 2017.
Table 8: Wastewater Treatment Certificates Class Level Licensed Class IV 21 Class III 0 Class II 6 Class I 10 O.I.T. 17
Total 54
7.6. MOECC/MOL Correspondence
There were no orders issued by the Ministry of the Environment and Climate Change (MOECC) or the Ministry of Labour (MOL).
A report was submitted to the MOECC for two odour complaints; no noise complaints were received at the plant in 2017. Table 9 summarizes the additional correspondence submitted to the MOECC for the Highland Creek Treatment Plant.
Table 9: Correspondence submitted to the MOECC
Date Type Description
March 18th Communication regarding an odour compliant
The plant was checked and all odour control equipment was found to be operating normally. No further remedial action took place.
June 28th Communication regarding an odour compliant
The plant was checked and all odour control equipment was found to be operating normally. No further remedial action took place.
Consent Letters N/A N/A N/A
Notice of Start up N/A N/A N/A
MOE Inspection No Inspection
17


APPENDIX A – Plant Schematic


18
APPENDIX B: INFLUENT AND EFFLUENT 2017 PERFORMANCE CHARTS


APPENDIX B – Influent and Effluent 2017
Performance Charts


APPENDIX B: INFLUENT AND EFFLUENT 2017 PERFORMANCE CHARTS
19
APPENDIX B: INFLUENT AND EFFLUENT 2017 PERFORMANCE CHARTS
20

APPENDIX C – Historical Performance Data


APPENDIX C: HISTORICAL PERFORMANCE DATA
Influent Parameters Units 2017 2016 2015 2014 2013 2012 2011 2010 2009 2008 2007 Flow ML/day 170.9 161.8 164.9 170.6 169.3 171.1 171.9 166.4 184.7 181.2 169.5 Total Annual Flow ML 62,388 59200 60208 62242 61804 62453 62753 60720 67398 66328 61868 Total Suspended Solids (TSS) mg/L 246.7 244.8 212.1 247.6 232.3 268.1 238 312.8 295.3 265 252.5 Biological Oxygen Demand (BOD) mg/L 221.4 242.2 234 232.1 205.9 206.7 185.3 246.1 205.6 140.1 156.3 Total Phosphorus (TP) mg/L 5.2 5.2 5 4.9 4.4 4.8 4.7 5.6 5.4 5.6 4.8 Primary Treatment TSS mg/l 134.7 151 171 339 232.1 332.6 244.4 209.3 175.7 271.6 432.5 cBOD5 mg/L 183.9 178 170 180 129.8 155 143.5 124 87.4 101.5 141 Secondary Treatment
Aeration Loading kg CBOD5/m3.day 0.59 0.54 0.53 0.58 0.65 0.66 0.46 0.3 0.3 0.35 0.45
Mixed Liquor Suspended Solids mg/L 2,723 2736 3243 3296 2380 1577 2747 2431 2372 2432 2926 Final Effluent TSS mg/l 14.1 14.6 17.4 20.2 22.8 21 14.6 12.4 15.8 14.7 15.6 cBOD5 mg/L 7.20 6.7 6.2 5.9 8.8 9.1 6.4 5.2 6.3 5.2 5.2 TP mg/L 0.7 0.7 0.7 0.6 0.6 0.7 0.5 0.5 0.6 0.6 0.7 Escherichia Coli (E. Coli) CFU/100 mL 16 53.2 40.2 10.4 34.9 15.5 6.4 3.9 16.7 7.6 9 pH 6.7 6.5 6.5 6.5 6.2 6.4 6.9 6.6 6.6 7.1 8 Total Chlorine Residual mg/L 0.004 0.007 0.006 SBS (P) SBS (P) SBS (P) SBS (P) SBS (P) ‐ ‐ ‐
TP Loading Rate kg/day 219 117 115 100 104 116 83.5 85 105 110 119 Solids Handling Primary Sludge Treated m3/day 910 1090 1525 2150 2900 2944 4100 3553 3900 5100 5460 Primary Sludge Total Solids (TS) % 2.55 2.4 2.8 2.6 2.2 2.2 3.2 2.4 2.4 2.7 2.4 Primary Sludge TVS % 81.83 81.9 81.6 77.9 73.5 78.9 60.8 66.5 72.5 76 66 WAS to Thickening m3/day 3,716 3519 3110 2254 ‐ ‐ ‐ ‐ ‐ ‐ ‐
Thickened WAS (TWAS) TS % 4.12 3.83 5.3 5.7 ‐ ‐ ‐ ‐ ‐ ‐ ‐
TWAS Treated m3/day 474 323 1236 ‐ ‐ ‐ ‐ ‐ ‐ ‐
WAS to Co‐settling m3/day ‐ ‐ ‐ ‐ 6600 6875 5893 6905 7250 10960 12700 WAS SS mg/L 6,732 6126 7358 7300 4500 3262 4148 3491 3700 3780 5966 Dewatering Centrifuge Feed Flow m3/day 1,849 1924 2143 2065 1966 1906 1873 1913 1818 2008 2046 Dewatering Centrifuge Feed TS % 2.48 2.3 3 2 1.7 1.5 1.6 1.6 1.6 1.7 1.6 Dewatered Biosolids incinerated Dry tonnes/day 31.1 45.1 57.4 38.5 29.2 23.1 28.1 28.9 27.5 33.2 28.7 Dewatered Biosolids TS % 26.2 26.6 22.8 25 25.8 26.5 26.4 26.5 27.1 27.3 25.6 Ash Removed tonnes 1815 3775 6141 3300 2100 ‐ ‐ ‐ ‐ ‐ ‐
21


APPENDIX D – Influent and Effluent
Metal Concentrations

APPENDIX D: INFLUENT AND EFFLUENT METALS ANALYSIS
Influent (Daily Composite tested once/month for metals) (Data in red italics is half of the MDL) Parameter Arsenic Cadmium Chromium Copper Iron Lead Manganese Mercury Nickel Zinc
Units mg/L mg/L mg/L mg/L mg/L mg/L mg/L mg/L mg/L mg/L January 0.005 0.002 0.00561 0.0967 0.915 0.0025 0.068 0.000078 0.00661 0.121 February 0.005 0.002 0.00692 0.0895 0.926 0.0025 0.0757 0.000201 0.00603 0.134 March 0.005 0.002 0.00593 0.117 0.67 0.0025 0.0714 0.000091 0.00603 0.132 April 0.005 0.002 0.00659 0.0963 0.861 0.0025 0.0616 0.000088 0.00523 0.103 May 0.005 0.002 0.0096 0.135 1.58 0.0025 0.0705 0.000121 0.00607 0.145 June 0.005 0.002 0.00585 0.11 1.3 0.0025 0.0712 0.00023 0.00588 0.124 July 0.005 0.002 0.00637 0.123 0.814 0.0025 0.0721 0.000102 0.00643 0.137 August 0.005 0.002 0.00619 0.109 0.745 0.0025 0.0676 0.000126 0.00574 0.139 September 0.005 0.002 0.00455 0.111 0.661 0.0025 0.0585 0.000554 0.00582 0.133 October 0.005 0.002 0.00766 0.144 1.14 0.0025 0.0698 0.00005 0.00773 0.162 November 0.005 0.002 0.00864 0.163 1.1 0.0025 0.0724 0.00005 0.00683 0.168 December 0.005 0.002 0.00501 0.104 1.29 0.0025 0.0683 0.00005 0.00663 0.142 Average 0.005 0.002 0.007 0.117 1.000 0.0025 0.069 0.00015 0.006 0.137 Final Effluent (Daily Composite tested once/month for metals)
Parameter Arsenic Cadmium Chromium Copper Iron Lead Manganese Mercury Nickel Zinc Units mg/L mg/L mg/L mg/L mg/L mg/L mg/L mg/L mg/L mg/L
January 0.005 0.002 0.002 0.0167 1.45 0.0025 0.0758 0.00003 0.00637 0.0374 February 0.005 0.002 0.002 0.0139 2.3 0.0025 0.0809 0.00003 0.0059 0.0361 March 0.005 0.002 0.002 0.0217 1.48 0.0025 0.0689 0.00003 0.00634 0.0425 April 0.005 0.002 0.002 0.0205 0.75 0.0025 0.0539 0.00003 <0.0025 0.0366 May 0.005 0.002 0.002 0.0251 1.3 0.0025 0.069 0.00005 0.00504 0.0411 June 0.005 0.002 0.002 0.0161 1.35 0.0025 0.0704 0.00005 0.00508 0.0347 July 0.005 0.002 0.002 0.0202 1.22 0.0025 0.0694 0.00005 0.0066 0.0441 August 0.005 0.002 0.002 0.0138 1.11 0.0025 0.0505 0.00005 0.00553 0.0337 September 0.005 0.002 0.002 0.015 0.799 0.0025 0.0683 0.00005 0.00563 0.038 October 0.005 0.002 0.002 0.0204 1.47 0.0025 0.0571 0.00005 0.00654 0.0413 November 0.005 0.002 0.002 0.0198 1.63 0.0025 0.0718 0.00005 0.00651 0.0448 December 0.005 0.002 0.002 0.0217 1.87 0.0025 0.083 0.00005 0.0066 0.044 Average 0.005 0.002 0.002 0.019 1.394 0.0025 0.068 0.00004 0.006 0.040
22


APPENDIX E – Dewatered Sludge Metal Analyses


APPENDIX E: DEWATERED SLUDGE METAL ANALYSES
Dewatered Sludge Metal Analysis Parameter Arsenic Cadmium Cobalt Chromium Copper Mercury Molybdenum Nickel Lead Selenium Zinc Units mg/kg mg/kg mg/kg mg/kg mg/kg mg/kg mg/kg mg/kg mg/kg mg/kg mg/kg June 2.48 0.13 2.51 38.0 407 0.255 6.27 12.4 10.6 2.03 343 July 2.30 0.16 2.25 37.9 408 0.383 6.72 11.3 9.0 2.28 370 October 1.84 0.18 1.60 28.5 439 0.211 6.45 11.9 9.2 1.89 306 December 1.81 0.15 1.63 40.0 411 0.299 5.33 13.4 9.0 1.59 370 Average 2.1 0.15 2.00 36.1 416 0.29 6.19 12.2 9.5 1.95 347
All values are expressed in terms of mg metal / kg sludge dry weight
23

APPENDIX F – LOF Notice of Modification to Sewage
Works

APPENDIX F: LOF NOTICE OF MODIFICATION TO SEWAGE WORKS
24
APPENDIX F: LOF NOTICE OF MODIFICATION TO SEWAGE WORKS
25


![CirculatingTumorCellsPredictSurvivalBenefitfromTreatmentin ......CTC), resulting in a median OS of 17.2 months [95% confidenceinterval(95%CI),14.2-21.0months].Theaverage length of](https://static.fdocuments.net/doc/165x107/607d41918893d034651e5395/circulatingtumorcellspredictsurvivalbenefitfromtreatmentin-ctc-resulting.jpg)


