Higher Education Research and Development Survey …€¦ · · 2017-11-30Higher Education...
21
Higher Education Research and Development Survey, Fiscal Year 2016 Ronda Britt Project Officer Research and Development Statistics Program (703) 292-7765 Technical Notes Survey Overview Purpose. The Higher Education Research and Development (HERD) Survey is the primary source of information on separately accounted for R&D expenditures within higher education institutions in the United States and outlying areas. Data collection authority. The information is solicited under the authority of the National Science Foundation Act of 1950, as amended, and the America COMPETES Reauthorization Act of 2010. The Office of Management and Budget (OMB) control number is 3145-0100 with an expiration date of 30 September 2019. Survey contractor. ICF. Survey sponsor. The HERD Survey is sponsored by the National Center for Science and Engineering Statistics (NCSES) within the National Science Foundation. Key Survey Information Frequency. Annual. Initial survey year. In 2010, the HERD Survey replaced a previous annual collection, the Survey of Research and Development Expenditures at Universities and Colleges (Academic R&D Expenditures Survey), which was conducted from FY 1972 through FY 2009. Reference period. FY 2016. Response unit. Establishment. Sample or census. Census. Population size. A total of 902 research-performing academic institutions. Sample size. The survey was a census of all known eligible universities and colleges. Survey Design Target population. The FY 2016 HERD Survey target population consisted of public and private nonprofit postsecondary institutions in the United States, Guam, Puerto Rico, and the U.S. Virgin Islands that granted a bachelor’s degree or higher in any field; expended at least $150,000 in separately accounted for R&D in FY 2016; and were geographically separate campuses headed by a president, chancellor, or equivalent. A list of all accredited, degree-granting institutions in the United States (the Higher Education Directory was purchased from the Higher Education Publication (HEP). More information about HEP and their sources can be found at https://www.hepinc.com/about/.
Transcript of Higher Education Research and Development Survey …€¦ · · 2017-11-30Higher Education...

Higher Education Research and Development Survey, Fiscal Year 2016
Ronda Britt Project Officer Research and Development Statistics Program (703) 292-7765
Technical Notes
Survey Overview Purpose. The Higher Education Research and Development (HERD) Survey is the primary source of information on separately accounted for R&D expenditures within higher education institutions in the United States and outlying areas.
Data collection authority. The information is solicited under the authority of the National Science Foundation Act of 1950, as amended, and the America COMPETES Reauthorization Act of 2010. The Office of Management and Budget (OMB) control number is 3145-0100 with an expiration date of 30 September 2019.
Survey contractor. ICF.
Survey sponsor. The HERD Survey is sponsored by the National Center for Science and Engineering Statistics (NCSES) within the National Science Foundation.
Key Survey Information Frequency. Annual.
Initial survey year. In 2010, the HERD Survey replaced a previous annual collection, the Survey of Research and Development Expenditures at Universities and Colleges (Academic R&D Expenditures Survey), which was conducted from FY 1972 through FY 2009.
Reference period. FY 2016.
Response unit. Establishment.
Sample or census. Census.
Population size. A total of 902 research-performing academic institutions.
Sample size. The survey was a census of all known eligible universities and colleges.
Survey Design Target population. The FY 2016 HERD Survey target population consisted of public and private nonprofit postsecondary institutions in the United States, Guam, Puerto Rico, and the U.S. Virgin Islands that granted a bachelor’s degree or higher in any field; expended at least $150,000 in separately accounted for R&D in FY 2016; and were geographically separate campuses headed by a president, chancellor, or equivalent. A list of all accredited, degree-granting institutions in the United States (the Higher Education Directory was purchased from the Higher Education Publication (HEP). More information about HEP and their sources can be found at https://www.hepinc.com/about/.

The survey population was reviewed before data collection began to ensure that each institutional classification was accurate. Characteristics of the schools were reviewed before and during the survey to determine whether changes had occurred (e.g., name; highest degree granted; school openings, closings, or mergers). Table A-1 shows all institution name changes between the FY 2015 and FY 2016 surveys.
After data collection closed, institutions were reviewed to verify that only those reporting at least $150,000 in separately accounted for R&D were included in the population. Of the 929 institutions surveyed, 27 completed the survey but reported total R&D expenditures of less than $150,000. These institutions were excluded from the population, and their data are not included in the FY 2016 survey totals. The total and federally financed R&D expenditures for these 27 institutions are listed in table A-2.
Sample frame. The frame for the FY 2016 HERD Survey included (1) all institutions considered in scope for the FY 2015 survey, (2) institutions that granted a bachelor’s degree or higher and reported greater than $0 for research on the Integrated Postsecondary Education Data System (IPEDS) 2014 Finance Survey, (3) all U.S. service institutions that granted a bachelor’s degree or higher and were not already part of the HERD Survey population, and (4) institutions that granted graduate degrees but did not report to IPEDS and were not already part of the HERD Survey population. The information in the Higher Education Directory was used to locate institutions meeting the conditions listed in (3) and (4). When FY 2015 R&D expenditures were not known, institutions in the frame were sent a brief questionnaire asking whether the institution had R&D expenditures during FY 2015 and whether those expenditures were less than $150,000, were $150,000 to $999,999, or were $1 million or more.
The population review screener was sent to 282 institutions. A total of 40 institutions were added to the survey population during the population review. Two other institutions were added when representatives of university systems contacted data collection staff about campuses that newly qualified for the survey. During data collection, 38 institutions were removed from the population after they indicated that their R&D expenditures were less than $150,000 for FY 2016 or that their institution had merged with another surveyed university or college. After accounting for these additions and subtractions, the number of academic institutions in the final population increased from 899 in FY 2015 to 902 in FY 2016 (table A-3).
Sample design. The FY 1997 survey was the last one conducted as a sample survey. Since FY 1998, the survey has been a census of all known eligible universities and colleges.
Data Collection and Processing Methods Data collection. The FY 2016 survey questionnaires were sent by e-mail in November 2016. Respondents could choose to submit a questionnaire downloaded from the Web or use a Web-based data collection system to respond to the survey. Every effort was made to maintain close contact with respondents in order to preserve both the consistency and continuity of the resulting data. Questionnaires were carefully examined for completeness upon receipt. Survey data reports were then prepared for each institution; these showed comparisons between the current and 2 prior years of data and noted any substantive disparities. Respondents were sent personalized e-mail messages asking them to provide any necessary revisions before the final processing and tabulation of data. These e-mail messages included a link to the HERD Survey Web-based collection system, allowing respondents to view and correct their data online.
Respondents were asked to explain significant differences between current-year reporting and established patterns of reporting verified for prior years. They were encouraged to correct prior-year data if necessary. When respondents updated or amended figures from past years, NCSES made corresponding

changes to trend data in the 2016 data tables and to the underlying microdata. For accurate historical data, use only the most recently released data tables.
Mode. Respondents could choose to submit a questionnaire downloaded from the Web, or use the Web-based data collection system to respond to the survey. Two institutions submitted data using the downloaded questionnaire.
Response rates. By the survey’s closing date in July 2017, forms had been received from 876 universities and colleges out of a population of 902, a response rate of 97.1%. Responses were received from 98.1% of all doctorate-granting institutions. The R&D expenditures reported by these doctoral institutions constituted 98.4% of the estimated national R&D expenditures for FY 2016. Table A-4 displays a detailed breakdown of response rates by survey form and highest degree granted, and table A-5 displays a breakdown of response rates for each survey question.
Data editing. The HERD Survey was subject to very little editing. Respondents were contacted and asked to resolve possible self-reporting issues themselves. Questionnaires were carefully examined by survey staff upon receipt. Reviews focused on unexplained missing data and explanations provided for changes in reporting patterns. If additional explanations or data revisions were needed, respondents were sent personalized e-mail messages asking them to provide any necessary revisions before the final processing and tabulation of data.
Imputation. Missing values were imputed based on the previous year’s data and the reported data of peer institutions in the current cycle. For the 21 institutions that had not responded by the closing date of the survey and had been included in the FY 2015 HERD Survey population, R&D expenditures were imputed by applying inflator and deflator factors to the prior year’s key totals. The key totals for FY 2016 included total R&D expenditures, federal R&D expenditures, expenditures received as a subrecipient from higher education sources, expenditures received as a subrecipient from non-higher education sources, expenditures passed through to higher education entities, and expenditures passed through to non-higher education entities. Imputation factors were ratios derived from the 2-year-trend data of responding institutions with similar characteristics, including highest degree granted, type of institutional control (public or private), and level of total R&D expenditures. Other values that were not identified as key totals were imputed by applying ratios from the previous year’s data.
For 5 institutions that were new to the survey population, no past-year data were available. For these institutions, total R&D expenditures were assumed to be $150,000 or $1 million, depending on the institution’s response to the population review screener. Other values were then imputed as a proportion of total R&D expenditures based on the data of institutions with similar characteristics. Data for partial nonresponse were imputed using similar techniques.
Tables A-6 through A-19 present imputed amounts for each applicable survey variable. The dollar amount imputed is displayed, along with the percentage it represents of the national estimate for universities and colleges in a particular field. The imputed total R&D was $75 million, or 0.1%, of the $72.0 billion in total R&D expenditures (table A-6).
Several surveyed institutions have responded intermittently in past years. For years in which no response was received, data have been imputed as previously described. Although the imputation algorithm accurately reflects national trends, it cannot account for specific trends at individual institutions. For this reason, a re-imputation of institutional data for prior years is also performed. For each institution, previously imputed values from the HERD Survey (FYs 2010–15) were recomputed to ensure that the imputed data are consistent with reporting patterns from the FY 2016 survey. These procedures result in

much more consistent reporting trends for individual institutions but have little effect on aggregate figures reflecting national totals. In the data tables, the letter i is used to identify imputed data.
R&D expenditures from unspecified federal agencies (Question 10) and capitalization thresholds for software and equipment (Question 13) were not imputed. Response summaries for these questions can be found in tables A-20 through A-21.
Weighting. Survey data were not weighted.
Variance estimation. No variance estimation techniques were used.
Survey Quality Measures Sampling error. Because the FY 2016 survey was distributed to all institutions in the universe, there was no sampling error.
Coverage error. Coverage error of large research institutions is minimal because of comprehensive lists. These institutions are easily identified using the NCSES Survey of Federal Science and Engineering Support to Universities, Colleges, and Nonprofit Institutions. However, institutions with smaller amounts of R&D expenditures have been more difficult to identify because they often do not receive federal funding for science and engineering (S&E) R&D.
As part of the expanded HERD Survey collection, a special effort was undertaken in 2010 to screen 1,715 4-year and higher postsecondary institutions that were not currently included in the survey to identify additional institutions meeting the $150,000 threshold. These institutions were given detailed instructions regarding what to include as R&D expenditures and were asked to respond to Question 1, total R&D expenditures by source of funds, of the HERD Survey. This short form survey achieved a 64.4% response rate and identified 187 additional institutions that met the $150,000 threshold. The total R&D expenditures reported by these institutions in FY 2010 was $249 million, or 0.42% of the $61.2 billion reported by FY 2010 HERD Survey respondents. More details on this effort are included in the methodology report and technical notes for the FY 2010 survey. NCSES continues to annually screen all 4-year and higher institutions reporting non-zero amounts of research expenses to IPEDS to determine whether new institutions qualify for inclusion in the survey.
Nonresponse error. Twenty-six universities and colleges did not respond in FY 2016, out of a total of 902 eligible institutions, for a nonresponse rate of 2.9%. Table A-4 displays a detailed breakdown of response rates by survey population and highest degree granted.
The item nonresponse rates varied from zero for Question 1, total R&D expenditures by source of funds, to 7.8% for Question 6, R&D expenditures by type of R&D (basic research, applied research and experimental development). No question had a nonresponse rate of 10% or higher. Table A-5 displays a breakdown of response rates for each question in each of the two surveys. Tables A-6 through A-19 present imputed amounts for each applicable survey variable.
Measurement error. The most likely source of measurement error is institutional records containing categories different from those on the survey. For example, institutions were asked to report all R&D expenditures by field. The NCSES-designed fields do not always translate to an institution’s departmental structure, and adjustments must be made by the institution in order to complete the survey. Fields were also revised for the FY 2016 survey. The revised fields better reflect the R&D currently being conducted at universities and colleges and make HERD survey fields more consistent with other NCSES surveys as well as the National Center for Education Statistics Classification of Instructional

Programs (CIP) codes, but not all institutions were able to convert to the new taxonomy for FY 2016 (See Technical Notes, Appendix A: Changes to Fields of R&D for additional information on the 2016 field changes).
Another source of error is the survey’s category of institutionally financed research. The survey requests that institutions report discretionary internal funds used for research. NCSES discovered through debriefings conducted at the conclusion of the FY 2010 survey that there were varying definitions of what should be included on the HERD Survey as institutionally funded research. Some institutions were including all expenditures from separate accounts designated for research; others were including only internal R&D projects that are competitively awarded and have detailed budgets. A workshop was held in summer 2012 to discuss these differences in definitional interpretations. Based on the findings from the workshop, the FY 2012 survey was modified to clarify that all expenditures designated for research can be included in this category. This includes expenditures for organized research and expenditures of other funds designated for research but not categorized as organized research. A checklist question (Question 1.1) was also added to encourage inclusion of all eligible expenditures and to determine the full extent of the variation in reporting across institutions. This question has been in the survey since FY 2012. An analysis of Question 1.1 responses from FY 2016 indicated that the majority of institutions that reported some institutionally funded R&D were including funds that would not be considered organized research (e.g., 77% included startup funds, bridge funding, or seed funding, and 79% included other departmental funds designated for research). However, many institutions reported that they still could not report institutionally funded research that was not organized research because those funds were not separately accounted for. Therefore, survey totals are missing expenditures for R&D that come from multipurpose accounts, and as such, they represent an undercount of the total amount of internal discretionary funding institutions make available to conduct R&D.
The reporting of unrecovered indirect costs is another known source of error. The survey requests that the total amount of indirect costs associated with a research grant or contract be calculated and reported, including costs that were not reimbursed by the external funding source. The unrecovered indirect cost is calculated by multiplying the institution’s negotiated indirect cost rate by the corresponding base and then subtracting the actual indirect cost recovery, preferably on a project-by-project basis. In FY 2016, 6.0% of respondents reported that these data were unavailable.
It should also be noted that because institutions were asked to include funds passed through to higher education institutions as well as subrecipient funding from higher education institutions, there is double-counting included in national and group totals. For example, Institution A’s survey included the $2 million passed through to Institution B, and Institution B’s survey also included that $2 million in subrecipient funding that it received from Institution A. Overall, institutions reported $3.1 billion in expenditures from subrecipient funding received from other universities in FY 2016 and $3.1 billion in funds passed through to higher education subrecipients in FY 2016.
Data Comparability (Changes) Annual data are available for FYs 1972–2016. When the review for consistency between each year’s data and submissions in prior years reveals discrepancies, it is sometimes necessary to modify prior years’ data. This is especially likely to affect trends for certain institutions that fail to report every year, because current-year data are used to impute prior-year data. For accurate historical data, use only the most recently released data tables. Individuals wishing to analyze trends other than those in the most recent data tables are encouraged to contact the Project Officer for more information about comparability of data over time.

Changes in survey coverage and population. Before FY 2010, the population included only institutions with R&D expenditures and degree programs in S&E fields. Institutions that performed R&D in only non-S&E fields were excluded from the population. Although not a change in the coverage or population, each campus headed by a campus-level president, chancellor, or equivalent began completing a separate survey in 2010 rather than combining its response with the other campuses in a university system. As a result of this step, the overall number of academic institutions in the population increased from 711 in FY 2009 to 742 in FY 2010.
To compare HERD Survey data across university systems by aggregating member campuses, table 6 shows all institutions in the FY 2016 population, including short form survey institutions, by state, institutional control, and system.
Universities and colleges can merge or separate, possibly resulting in large changes in data from previous years. For FY 2015 The Indiana University School of Medicine (IUSM) reporting line was changed from the Chancellor of the Indiana University-Purdue University, Indianapolis (IUPUI) campus to the President of Indiana University. As such, the research expenditures for IUSM are now included in the Indiana University-Bloomington figures, resulting in an increase in total R&D expenditures of approximately $280 million for this campus. IUPUI total R&D expenditures decreased for $324 million in FY 2014 to $56 million in FY 2015. In September 2015, Yeshiva University relinquished control of the Albert Einstein College of Medicine to the Montefiore Health System. As a result, FY 2016 data for Yeshiva University included only two months (July–August 2015) of R&D expenditures from the college of medicine. Albert Einstein College of Medicine reported separately for their entire FY 2016 (January 2016–December 2016). As a result of this change, FY 2016 research expenditures for Yeshiva University decreased by $260 million.
Changes in questionnaire. Tables include data from the Academic R&D Expenditures Survey (FYs 1972–2009) and the HERD Survey (FYs 2010–16). Analysts should be cautious when examining trend data. Although many variables are similar across the two surveys, because of clarification of which funds are to be included in the definition of R&D and the inclusion of non-S&E expenditures, exact comparisons may be misleading. In prior years, the Academic R&D Expenditures Survey collected expenditures for S&E and non-S&E fields separately. Institutions were not always able to provide non-S&E expenditures, and those data were not imputed previously. Also, revisions to the instructions on what types of activities are included as R&D in 2010 may have influenced reported values to varying degrees, depending on the numbers of clinical trials and training grants at a particular institution.
• For the FY 2012 data collection, NCSES modified the survey instructions to clarify what types of institutionally funded activities should be included in reported data. The instructions explained that all expenditures for R&D from an institution’s current operating funds that are separately accounted for should be reported. This includes expenditures separately budgeted for organized research and expenditures of other funds designated for research but not categorized as organized research. The instructions also specified that funds from an institution’s 501(c)3 foundation should be reported under institutionally financed research.
• For the FY 2013 collection, the instructions were revised to clarify that funds from foreign and U.S. universities and colleges should be reported under All other sources (Question 1, row f). The instructions also specified that gifts designated by donors for research should be included in Question 1, row f.

Several changes were made to the FY 2016 questionnaire:
• The question regarding the number of postdocs paid from R&D expenditures (Question 16 on FY 2015 questionnaire) was removed from the survey.
• The question asking about foreign funding of R&D (Question 2) was expanded to ask for sources of foreign-funding. The question now asks for R&D expenditures funded by foreign governments, businesses, nonprofit organizations, and higher education (see definition of Expenditures funded by foreign sources below for additional information).
• For FY 2016 there were revisions to the fields of R&D included in Questions 9, 11, and 14 of the survey. The revised fields better reflected the R&D currently being conducted at universities and colleges and make the HERD survey fields more consistent with those used by other NCSES surveys, as well as CIP codes. Additional information about this change can be found in Appendix A.
Changes in reporting procedures or classification. • In order to reduce the burden for institutions with minimal amounts of R&D expenditures,
NCSES introduced a shorter version of the HERD Survey beginning with the FY 2012 collection. The short form included only a few core questions. For the FY 2016 cycle, the short form included 262 institutions that reported R&D expenditures between $150,000 and $1 million during FY 2015. The remainder of the institutions (640) were included in the full version of the survey.
• Short form survey data for FY 2012-16 appear only in those tables that specify in their title that the data presented include the short form version of the survey. Data from the short form survey population are included in the year totals prior to FY 2012, aggregated under “all other surveyed institutions.” The total FY 2016 R&D expenditures reported by institutions in the short form survey population ($138 million) represent 0.2% of the expenditures reported by all institutions ($72.0 billion).
Definitions • Clinical trials. Research studies designed to answer specific questions about the effects of
drugs, vaccines, medical devices, tests, treatments, and other therapies for patients. Clinical trials are used to determine safety and effectiveness. Includes Phase II, and Phase III clinical trials with human patients, but excludes Phase IV clinical trials.
• Contracts. Legal commitments in which a good or service was provided by the reporting institution and benefited the sponsor. The sponsor specified the deliverables and gained the rights to the results. Federal agency. Any agency of the United States government. Expenditures are reported by six specific agency funding sources (the Department of Agriculture; Department of Defense; Department of Energy; Department of Health and Human Services, including the National Institutes of Health; National Aeronautics and Space Administration; and National Science Foundation). Any expenditures funded by other federal agencies were reported under Other. The names of agencies included in the Other category are also requested.
• Fields of R&D. A list of the 40 fields of study reported on can be found on the survey questionnaire. In the data tables, the fields are grouped into 10 major areas: computer and

information sciences, engineering, geosciences, atmospheric sciences and ocean sciences, life sciences, mathematics and statistics, physical sciences, psychology, social sciences, other sciences, and non-science and engineering.
• Fiscal year. Institution's financial year.
• Foreign sources:
Foreign government. All levels of foreign government, including national, regional, municipality, or other local government.
Business. Foreign for-profit organizations. Projects sponsored by a U.S. location of a foreign company were not considered foreign. Funds from a company’s nonprofit foundation were not reported here; they were reported under Nonprofit organizations.
Nonprofit organizations. Foreign nonprofit foundations and organizations, except higher education institutions. Funds from foreign universities were reported under Higher education.
Higher education. Foreign colleges and universities and units owned, operated, and controlled by such institutions.
All other sources. International governmental organizations located in the United States, such as the United Nations, the World Bank, and the International Monetary Fund and all other entities sending funds to the United States from a location outside the United States and its territories.
• Medical schools A medical school awards MD or DO degrees. Expenditures from projects assigned to the medical school or to research centers that were organizationally part of the medical school were included.
• Pass-through entity. Organizations which pass through grant or contract funds to subrecipient organizations. Vendor relationships are not included.
• Principal investigators (PIs) and all other R&D personnel. A PI is designated by the institution to direct the R&D project or program and be responsible for the scientific and technical direction of the project. All other R&D personnel includes other employees and students paid from R&D accounts.
• Research and development (R&D). R&D is creative and systematic work undertaken in order to increase the stock of knowledge—including knowledge of humankind, culture, and society—and to devise new applications of available knowledge. R&D covers three activities—basic research, applied research, and experimental development. R&D does not include public service or outreach programs, curriculum development (unless included as part of an overall research project), or non-research training grants. R&D as measured on this survey does not include capital projects (i.e., construction or renovation of research facilities).
• R&D expenditures. Expenditures from the institution’s current operating funds that were separately accounted for. For the purposes of the survey, R&D included expenditures for organized research as defined by 2 CFR 220 Part 200 Appendix III and expenditures from funds designated for research. Expenditures came from internal or external funding and

included recovered and unrecovered indirect costs. Funds passed through to subrecipient organizations were also included. R&D was excluded if it was conducted by university faculty or staff at outside institutions that was not accounted for in an institution’s financial records.
• Sources of funds:
U.S. federal government. Any agency of the U.S. government. Federal funds that were passed through to the reporting institution from another institution were included.
State and local government. Any state, county, municipality, or other local government entity in the United States, including state health agencies. State funds that supported R&D at agricultural and other experiment stations were included. Public institutions reported state appropriations restricted for R&D activities in this category.
Business. Domestic or foreign for-profit organizations. Funds from a company’s nonprofit foundation were not reported here; they were reported under Nonprofit organizations.
Nonprofit organizations. Domestic or foreign nonprofit foundations and organizations, except universities and colleges. Funds from the reporting institution’s 501(c)3 foundation were reported under Institutional funds. Funds from other universities and colleges were reported under All other sources.
Institutional funds. Includes institutionally financed research (all R&D funded by the institution from accounts that are only used for research), cost sharing (committed), and unrecovered indirect costs (the portion of indirect costs associated with a sponsored project that was not reimbursed by the sponsor in accordance with the institution’s negotiated indirect cost rate).
All other sources. Sources not reported in other categories, such as funds from foreign governments, foreign or U.S. universities, and gifts designated by the donors for research.
• Subrecipient. The subrecipient for an award carries out the work but receives the funds from a pass-through entity rather than directly from the original funding source. Subrecipients tend to be the coauthors of publications, writers of technical reports discussing findings, inventors, and similar. Vendor relationships are not included.
• Type of cost. R&D expenditures are reported in the following categories:
Salaries, wages, and fringe benefits. Included compensation for all R&D personnel whether full time or part time, temporary or permanent, including salaries, wages, and fringe benefits paid from institution funds and from external support.
Software purchases, noncapitalized and capitalized. Included payments for all software, both purchases of software packages and license fees for systems.
Capitalized equipment. Included payments for movable equipment exceeding the institution’s capitalization threshold, including ancillary costs such as delivery and setup.
Pass-throughs to other organizations. See the definition above for Expenditures passed through to recipients.

Other direct costs. Other costs that did not fit into one of the above categories, including (but not limited to) travel, tuition waivers, services such as consulting, computer usage fees, and supplies.
Indirect costs. Includes both recovered and unrecovered indirect costs.
• Type of R&D. R&D expenditures are reported in the following categories:
Basic research. Experimental or theoretical work undertaken primarily to acquire new knowledge of the underlying foundations of phenomena and observable facts, without any particular application or use in view.
Applied research. Original investigation undertaken in order to acquire new knowledge. It is directed primarily towards a specific, practical aim or objective.
Experimental development. Systematic work, drawing on knowledge gained from research and practical experience and producing additional knowledge, which is directed to producing new products or processes or to improving existing products or processes.

Appendix A: Changes to Fields of R&D
For the FY 2016 Higher Education Research and Development (HERD) Survey, the fields of research and development were revised to improve the comparability of R&D field details across surveys from the National Center for Science and Engineering Statistics (NCSES) within the National Science Foundation. NCSES manages several institutional surveys. Each survey was developed independently with varying needs for field-level detail. As a result, there were minor differences in the field categories used across surveys. The revisions made in the FY 2016 cycle were the result of a multiyear review process. As part of this process, NCSES also updated categories that were outdated (e.g., the distinction between biological and medical sciences) or inconsistent with the Department of Education’s Classification of Instructional Programs (CIP) codes, which are used by many institutions and other surveys to organize discipline-level data.
The revised fields better reflect the R&D currently conducted at universities and colleges and make HERD survey fields more consistent with those used by other NCSES surveys, as well as with CIP codes. The new fields appeared on Questions 9, 11, and 14 of the FY 2016 HERD survey. The changes to the fields of R&D on the survey included the following:
• The fields were presented in alphabetical order.
• The names of some fields were revised.
• New disciplines were added as illustrative examples.
• Some disciplines were reclassified under different fields.
• Four new reporting fields were added.
1. Industrial and manufacturing engineering
2. Natural resources and conservation
3. Materials science
4. Anthropology
NCSES informed universities and colleges about the changes to the R&D fields in the summer of 2016, before the launch of the FY 2016 survey. Several documents detailing the changes were provided to respondents. The appendix table lists all fields of R&D included on the FY 2016 survey. If a field name changed substantially, that change is noted (e.g., “geosciences, atmospheric sciences, and ocean sciences” was previously called “environmental sciences”). Listed under each field are the illustrative examples of the disciplines included in that field. We have also noted the disciplines that have been reclassified under another field. Detailed crosswalks of FY 2015 fields to FY 2016 fields or FY 2016 fields to CIP codes are also available on request.
The changes to the R&D fields also resulted in several changes to how field-level data were presented in the FY 2016 tables:
• New field names are used on all applicable tables.

• The fields new to the FY 2016 survey are included in the data tables that report expenditures in specific fields. For years prior to FY 2016, the new fields are reported as “na” (na = not applicable).
• Expenditures in the field of mathematics and statistics are now listed separately from computer and information sciences on all tables. In the past, these fields had been combined on some data tables.
• The table that ranked institutions by expenditures in agricultural sciences (table 39 in FY 2015) now ranks institutions by the total expenditures in agricultural sciences and natural resources and conservation (table 43). This revision facilitates comparisons across years. In the past, the disciplines within natural resources and conservation were all considered to be part of agricultural sciences.

Appendix Table: Higher Education Research and Development Survey FY 2016 Fields of R&D and Changes from FY 2015
HERD 2016 fields and example disciplines Changes from FY 2015 HERD Survey A. Computer and information sciences
Artificial intelligence Computer and information technology administration and management Computer science Computer software and media applications Computer systems analysis Computer systems networking and telecommunications Data processing Information sciences, studies Information technology
Disciplines removed from this field: • Management information systems moved to Non-S&E
fields, Business management and Business administration.
B. Engineering 1. Aerospace, aeronautical, and astronautical engineering Aerodynamics Aerospace engineering Space technology
2. Bioengineering and biomedical engineering Biological and biosystems engineering Biomaterials engineering Biomedical technology Medical engineering
3. Chemical Engineering Biochemical engineering Chemical and biomolecular engineering Engineering chemistry Paper science Petroleum refining process Polymer, plastics engineering
Disciplines removed from this field: • Petroleum engineering moved to Other engineering. • Wood science moved to Life sciences, Agricultural
sciences.
4. Civil engineering Architectural engineering Construction engineering Engineering management, administration Environmental, environmental health engineering Geotechnical and geoenvironmental engineering Sanitary engineering Structural engineering Surveying engineering Transportation and highway engineering Water resources engineering
Disciplines removed from this field: • Architecture moved to Non-S&E fields, Other non-
S&E fields.

HERD 2016 fields and example disciplines Changes from FY 2015 HERD Survey 5. Electrical, electronic, and communications engineering Communications engineering Computer engineering Computer hardware engineering Computer software engineering Electrical and electronics engineering Laser and optical engineering Power Telecommunications engineering
6. Industrial and Manufacturing Engineering NEW FIELD Industrial engineering Manufacturing engineering Operations research Systems engineering
Disciplines added to this field: • Industrial, manufacturing and systems engineering
moved from Other engineering. • Operations research moved from Mathematics and
statistics. 7. Mechanical engineering Electromechanical engineering Mechatronics, robotics, and automation engineering
Disciplines removed from this field: • Engineering mechanics moved to Other engineering.
8. Metallurgical and materials engineering Ceramic sciences and engineering Geophysical, geological engineering Materials engineering Metallurgical engineering Mining and mineral engineering Textile sciences and engineering Welding
Disciplines removed from this field: • Materials science moved to the new field of Materials
science under Physical sciences.
9. Other engineering Agricultural engineering Engineering design Engineering mechanics, physics, and science Forest engineering Nanotechnology Naval architecture and marine engineering Nuclear engineering Ocean engineering Petroleum engineering Other engineering fields that cannot be classified using the fields listed above
Disciplines removed from this field: • Industrial, manufacturing and systems engineering
moved to Industrial and manufacturing engineering.
Disciplines added to this field: • Engineering mechanics, physics, and science moved
from Mechanical engineering. • Petroleum engineering moved from Chemical
engineering.

HERD 2016 fields and example disciplines Changes from FY 2015 HERD Survey C. Geosciences, atmospheric sciences, and ocean sciences (previously called Environmental sciences)
1. Atmospheric Science and Meteorology Aeronomy Atmospheric chemistry and climatology Atmospheric physics and dynamics Extraterrestrial atmospheres Meteorology Solar Weather modification
2. Geological and earth sciences Earth and planetary sciences Geochemistry Geodesy and gravity Geology Geomagnetism Geophysics and seismology Hydrology and water resources Minerology and petrology Paleomagnetism Paleontology Physical geography Stratigraphy and sedimentation Surveying
Disciplines removed from this field: • Cartography moved to Social sciences, Other social
sciences.
3. Ocean sciences and marine sciences Biological oceanography Geological oceanography Marine biology Marine oceanography Marine sciences Oceanography, chemical and physical
4. Other geosciences, atmospheric sciences, and ocean sciences Other fields that cannot be classified using the fields listed above.

HERD 2016 fields and example disciplines Changes from FY 2015 HERD Survey D. Life sciences
1. Agricultural sciences Agricultural business and management Agricultural chemistry Agricultural economics Agricultural engineering—report in Engineering Agricultural production operations Animal sciences Applied horticulture and horticultural business services Aquaculture Food science and technology International agriculture Plant sciences Soil sciences Wood science
Disciplines removed from this field: • Conservation moved to Natural resources and
conservation. • Fishing and fisheries sciences and management
moved to Natural resources and conservation. • Forestry moved to Natural resources and
conservation. • Renewable natural resources moved to Natural
resources and conservation. • Landscape architecture moved to Non S&E fields,
Other non-S&E fields. • All veterinary disciplines moved to Health sciences.
Disciplines added to this field: • Agricultural economics moved from Social sciences,
Economics. • Wood science moved from Engineering, Chemical
engineering. 2. Biological and biomedical sciences (previously Biological sciences) Allergies and immunology Biochemistry, biophysics, and molecular biology Biogeography Biology and biomedical sciences, general Biomathematics, bioinformatics, and computational biology Biotechnology Botany and plant biology Cell, cellular biology, and anatomical sciences Epidemiology, ecology and population biology Genetics Microbiological sciences and immunology Molecular medicine Neurobiology and neuroscience Pharmacology and toxicology Physiology, pathology and related sciences Zoology, animal biology
Disciplines removed from this field: • Foods and nutrition studies moved to Non-S&E fields,
Other non-S&E fields. • Nutritional sciences (renamed Dietetics and clinical
nutrition services) moved to Health sciences. • Physical anthropology moved to Social sciences,
Anthropology. • All veterinary disciplines moved to Health sciences.
Disciplines added to this fields: • Neurobiology and neuroscience moved from Health
sciences.
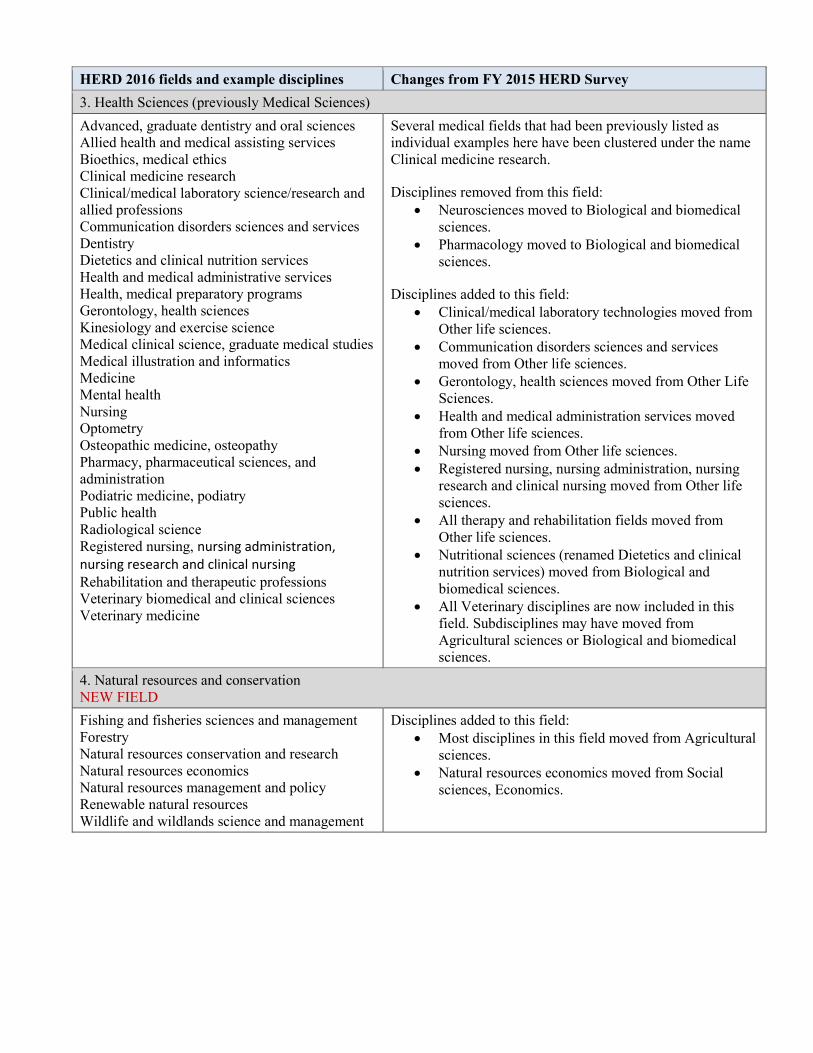
HERD 2016 fields and example disciplines Changes from FY 2015 HERD Survey 3. Health Sciences (previously Medical Sciences) Advanced, graduate dentistry and oral sciences Allied health and medical assisting services Bioethics, medical ethics Clinical medicine research Clinical/medical laboratory science/research and allied professions Communication disorders sciences and services Dentistry Dietetics and clinical nutrition services Health and medical administrative services Health, medical preparatory programs Gerontology, health sciences Kinesiology and exercise science Medical clinical science, graduate medical studies Medical illustration and informatics Medicine Mental health Nursing Optometry Osteopathic medicine, osteopathy Pharmacy, pharmaceutical sciences, and administration Podiatric medicine, podiatry Public health Radiological science Registered nursing, nursing administration, nursing research and clinical nursing Rehabilitation and therapeutic professions Veterinary biomedical and clinical sciences Veterinary medicine
Several medical fields that had been previously listed as individual examples here have been clustered under the name Clinical medicine research.
Disciplines removed from this field: • Neurosciences moved to Biological and biomedical
sciences. • Pharmacology moved to Biological and biomedical
sciences.
Disciplines added to this field: • Clinical/medical laboratory technologies moved from
Other life sciences. • Communication disorders sciences and services
moved from Other life sciences. • Gerontology, health sciences moved from Other Life
Sciences. • Health and medical administration services moved
from Other life sciences. • Nursing moved from Other life sciences. • Registered nursing, nursing administration, nursing
research and clinical nursing moved from Other life sciences.
• All therapy and rehabilitation fields moved from Other life sciences.
• Nutritional sciences (renamed Dietetics and clinical nutrition services) moved from Biological and biomedical sciences.
• All Veterinary disciplines are now included in this field. Subdisciplines may have moved from Agricultural sciences or Biological and biomedical sciences.
4. Natural resources and conservation NEW FIELD Fishing and fisheries sciences and management Forestry Natural resources conservation and research Natural resources economics Natural resources management and policy Renewable natural resources Wildlife and wildlands science and management
Disciplines added to this field: • Most disciplines in this field moved from Agricultural
sciences. • Natural resources economics moved from Social
sciences, Economics.

HERD 2016 fields and example disciplines Changes from FY 2015 HERD Survey 5. Other life sciences Other life sciences that cannot be classified using the fields listed above
Disciplines removed from this field: • Clinical/medical laboratory technologies moved to
Health sciences. • Communication disorders sciences and services
moved to Health sciences. • Gerontology, health sciences moved to Health
sciences. • Health and medical administration services moved to
Health sciences. • Nursing moved to Health sciences. • Registered nursing, nursing administration, nursing
research and clinical nursing moved to Health sciences.
• All therapy and rehabilitation fields moved to Health sciences.
E. Mathematics and statistics Applied mathematics Mathematics Statistics
Disciplines removed from this field: • Operations research moved to Engineering, Industrial
and manufacturing engineering. F. Physical sciences
1. Astronomy and astrophysics Astronomy Astrophysics Planetary astronomy and science
2. Chemistry (except Biochemistry—report in Biological and Biomedical Sciences) Analytical chemistry Chemical physics Environmental chemistry Forensic chemistry Inorganic chemistry Organic chemistry Organo-metallic chemistry Physical chemistry Polymer chemistry Theoretical chemistry
Disciplines removed from this field: • Pharmaceutical chemistry moved to Life sciences,
Health sciences.
Disciplines added to this field: • Chemical physics moved from Physics.
3. Materials science NEW FIELD Materials chemistry Materials science
Disciplines added to this field: • Materials science moved from Engineering,
Metallurgical and materials engineering.

HERD 2016 fields and example disciplines Changes from FY 2015 HERD Survey 4. Physics Acoustics Atomic, molecular physics Condensed matter and materials physics Elementary particle physics Mathematical physics Nuclear physics Optics, optical sciences Plasma, high-temperature physics Theoretical physics
Disciplines removed from this field: • Chemical physics moved to Chemistry.
5. Other physical sciences Other physical sciences that cannot be classified using the fields listed above
G. Psychology Clinical psychology Counseling and applied psychology Human development Research and experimental psychology
Disciplines removed from this field: • Animal behavior, part of Zoology, moved to Life
sciences, Biological and biomedical Sciences. • Art therapy, part of Rehabilitation and therapeutic
professions, moved to Life sciences, Health sciences H. Social sciences
1. Anthropology NEW FIELD Cultural anthropology Medical anthropology Physical and biological anthropology
Disciplines added to this field: • Cultural anthropology moved from Sociology,
demography and population studies. • Physical and biological anthropology moved from
Life sciences, Biological and biomedical Sciences. 2. Economics Applied economics Business development Development economics and international development Econometrics and quantitative economics Industrial economics International economics Labor economics Managerial economics Public finance and fiscal policy
Disciplines removed from the field: • Agricultural economics moved to Life Sciences,
Agricultural sciences. • Resource economics moved to Life Sciences, Natural
resources and conservation.
3. Political science and government Comparative government Government Legal systems Political economy Political science Political theory
Disciplines removed from this field: • International relations and affairs moved to Other
Social Sciences. • Public policy analysis moved to Other social sciences. • Public administration has moved to Non-S&E fields,
Other non-S&E fields. • Regional studies moved to Other social sciences.

HERD 2016 fields and example disciplines Changes from FY 2015 HERD Survey 4. Sociology, demography, and population studies Comparative and historical sociology Complex organizations Cultural and social structure Demography and population studies Group interactions Rural sociology Social problems and welfare theory Sociology
Disciplines removed from the field: • All subdisciplines of anthropology moved to
Anthropology.
5. Other social sciences Archeology Area, ethnic, cultural, gender, and group studies Cartography Criminal science and corrections Criminology Geography Gerontology, social sciences International relations and national security studies Linguistics Public policy analysis Regional studies Urban studies, affairs
Disciplines added to this field: • Cartography moved from Geosciences, atmospheric
sciences, and ocean sciences; Geological and earth Science.
• International relations and affairs moved from Political science and government.
• Public policy analysis moved from Political science and government.
• Regional studies moved from Political science and government.
Disciplines removed from this field: • History of science moved to Non-S&E fields,
Humanities. • City, urban, community and regional planning moved
to Non-S&E fields, Other non-S&E fields. • Community services, part of City, urban, community
and regional planning, moved to Non-S&E fields, Other non-S&E fields.
• Urban and regional planning, part of City, urban, community and regional planning, moved to Non-S&E fields, Other non-S&E fields.
I. Other sciences The questionnaire notes to use this category for R&D that involves at least one S&E field (rows A–H) if it is impossible to report multidisciplinary or interdisciplinary R&D expenditures in specific fields.
J. Non-S&E fields 1. Business management and business administration (previously Business and management) Business administration Business management Business, managerial economics Management information systems and services Marketing management and research
Disciplines added to this field: • Management information systems moved from
Computer and information sciences.
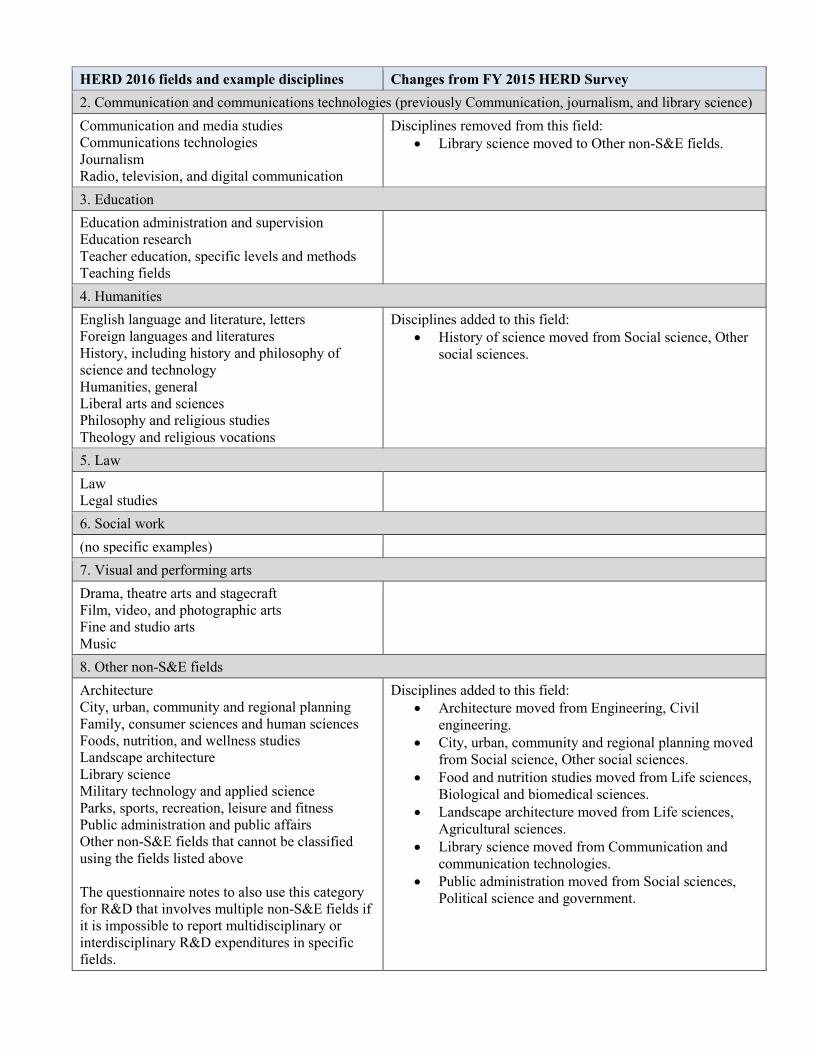
HERD 2016 fields and example disciplines Changes from FY 2015 HERD Survey 2. Communication and communications technologies (previously Communication, journalism, and library science) Communication and media studies Communications technologies Journalism Radio, television, and digital communication
Disciplines removed from this field: • Library science moved to Other non-S&E fields.
3. Education Education administration and supervision Education research Teacher education, specific levels and methods Teaching fields
4. Humanities English language and literature, letters Foreign languages and literatures History, including history and philosophy of science and technology Humanities, general Liberal arts and sciences Philosophy and religious studies Theology and religious vocations
Disciplines added to this field: • History of science moved from Social science, Other
social sciences.
5. Law Law Legal studies
6. Social work (no specific examples) 7. Visual and performing arts Drama, theatre arts and stagecraft Film, video, and photographic arts Fine and studio arts Music
8. Other non-S&E fields Architecture City, urban, community and regional planning Family, consumer sciences and human sciences Foods, nutrition, and wellness studies Landscape architecture Library science Military technology and applied science Parks, sports, recreation, leisure and fitness Public administration and public affairs Other non-S&E fields that cannot be classified using the fields listed above The questionnaire notes to also use this category for R&D that involves multiple non-S&E fields if it is impossible to report multidisciplinary or interdisciplinary R&D expenditures in specific fields.
Disciplines added to this field: • Architecture moved from Engineering, Civil
engineering. • City, urban, community and regional planning moved
from Social science, Other social sciences. • Food and nutrition studies moved from Life sciences,
Biological and biomedical sciences. • Landscape architecture moved from Life sciences,
Agricultural sciences. • Library science moved from Communication and
communication technologies. • Public administration moved from Social sciences,
Political science and government.