Corporation for Public Broadcasting Appropriation Request and
Upload
lora-copelandCategory
view
214download
0
Higher Education Policy Commission
Budget Hearing with the Department of AdministrationFY 2005 Budget Appropriation Request
October 3, 2003
Budget Request and AnalysisFiscal Year 2004-2005
Presentation to House Finance CommitteeJanuary 26, 2004
2
Table of ContentsHouse Finance Budget Hearing
Higher Ed. Adult Part-Time Student Grant Program 19
Promise Scholarship Program 20
West Virginia Higher Education Fund 21-22
WVNET Revenues and Expenditures 23
Commission Office Revenue and Expenditures 24Tuition and Fees 25-32
Other Pending Issues 33-34
Bond Issue 35
Summary of Estimated Deferred Maintenance 36Funding for Institutions & CC Components 37
Follow-up Discussion 38
Public Institutions of Higher Education 3Private Institutions of Higher Education 4Summary Mission Statement 5Report Card Summary of Progress 6Higher Education Performance Measures 7Full-Time Equivalent Enrollment Report 8HEPC Unity Budget Request 9Requested Reclassifications to Budget 10-11Analysis of Governor's Budget 12-13Negative Impact of Budget Reduction 14Mid-Year Reduction for FY 2004 15History of Appropriations 16Higher Education Grant Program Request 17-18
3
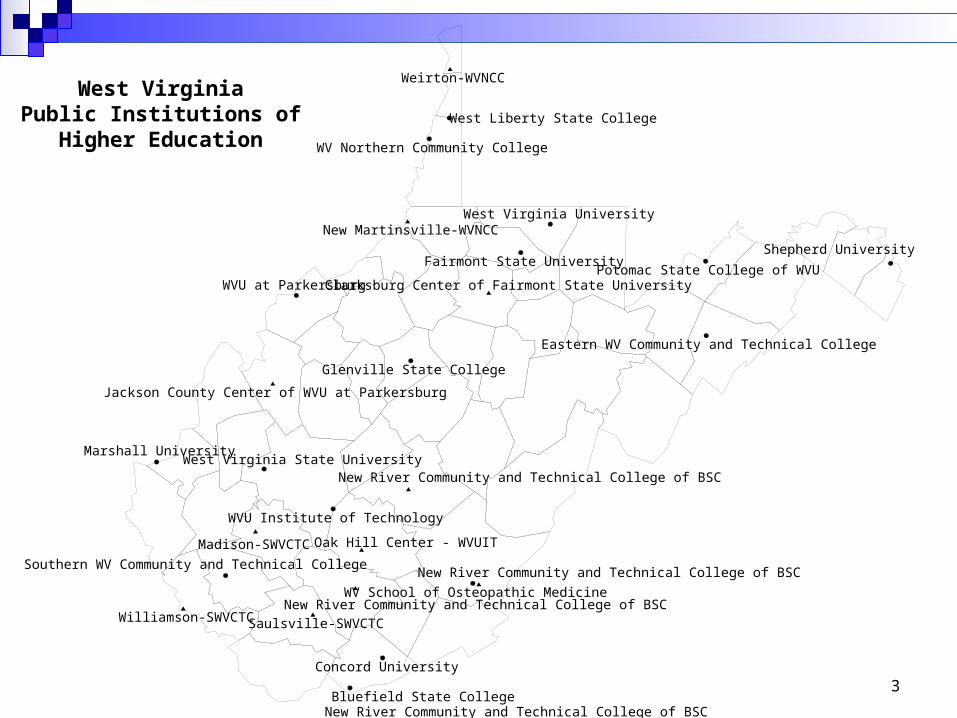
West VirginiaPublic Institutions of
Higher Education
New River Community and Technical College of BSC
Clarksburg Center of Fairmont State University
Jackson County Center of WVU at Parkersburg
New River Community and Technical College of BSC
New River Community and Technical College of BSC
Madison-SWVCTC
New Martinsville-WVNCC
Oak Hill Center - WVUIT
Saulsville-SWVCTC
Weirton-WVNCC
Williamson-SWVCTC
Concord University
Bluefield State CollegeNew River Community and Technical College of BSC
Fairmont State University
Glenville State College
Marshall UniversityWest Virginia State University
Potomac State College of WVU
WV School of Osteopathic Medicine
WVU Institute of Technology
Southern WV Community and Technical College
Eastern WV Community and Technical College
West Virginia University
WVU at Parkersburg
Shepherd University
West Liberty State College
WV Northern Community College

4
West VirginiaPrivate Institutionsof Higher Education
Mountain State University
Bethany College
Appalachian Bible College
West Virginia Wesleyan College
The University of Charleston
Davis & Elkins College
Ohio Valley CollegeAlderson-Broaddus College
Salem International University
Wheeling Jesuit University
Huntington Jr. College of Business
5
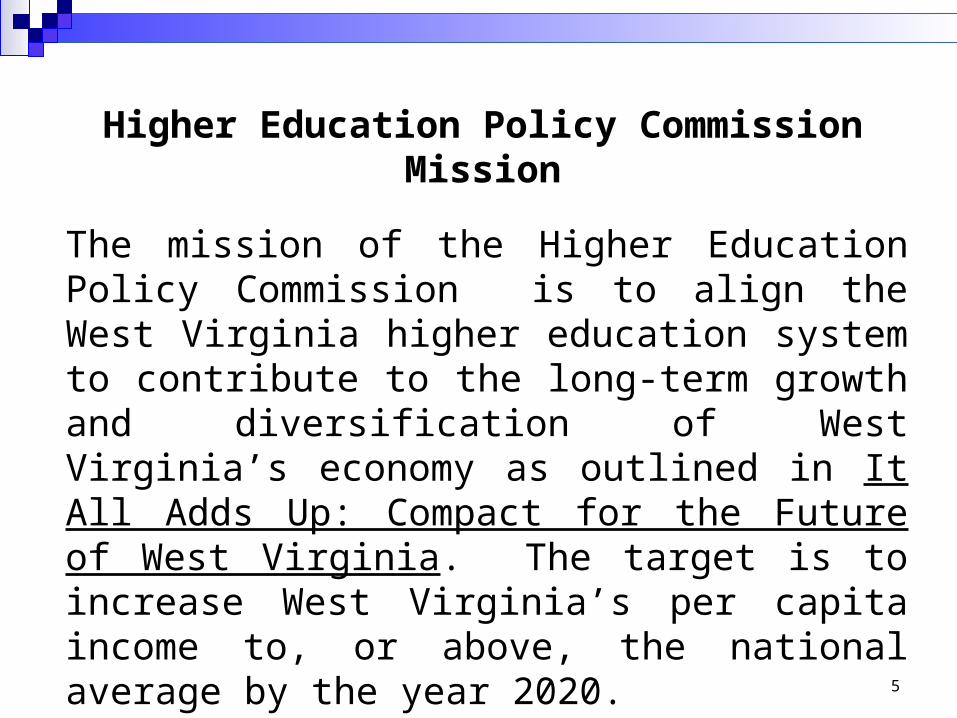
The mission of the Higher Education Policy Commission is to align the West Virginia higher education system to contribute to the long-term growth and diversification of West Virginia’s economy as outlined in It All Adds Up: Compact for the Future of West Virginia. The target is to increase West Virginia’s per capita income to, or above, the national average by the year 2020.
Higher Education Policy Commission Mission
6
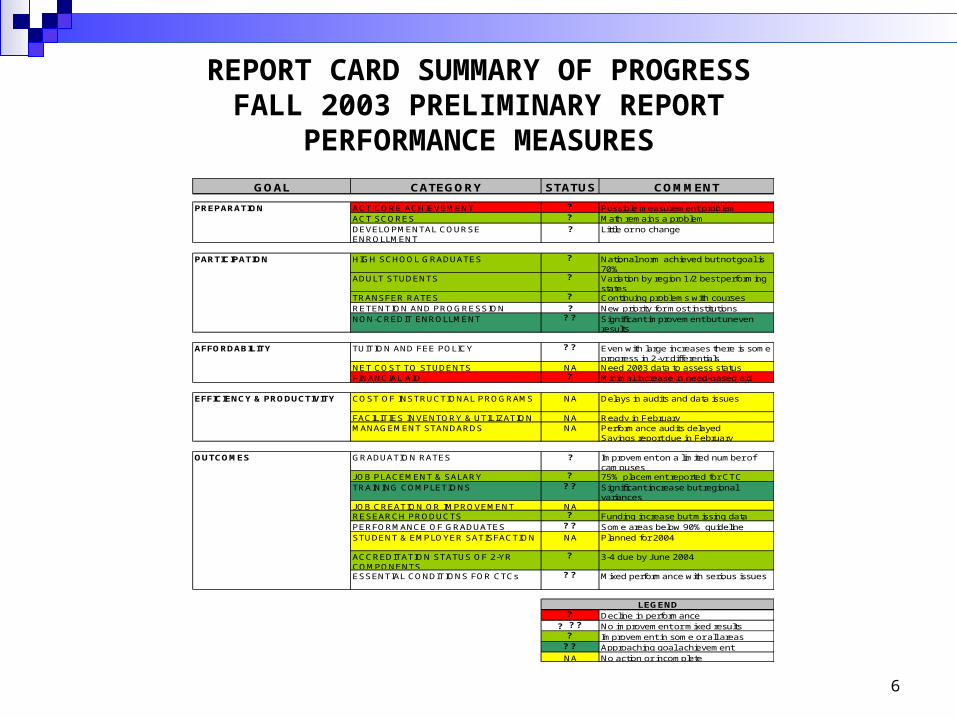
GOAL CATEGORY STATUS COMMENT
PREPARATION ACT CORE ACHIEVEMENT ? Possible measurement problemACT SCORES ? Math remains a problemDEVELOPMENTAL COURSE ENROLLMENT
? Little or no change
PARTICIPATION HIGH SCHOOL GRADUATES ? National norm achieved but not goal is 70%
ADULT STUDENTS ? Variation by region 1/2 best performing states
TRANSFER RATES ? Continuing problems with courses RETENTION AND PROGRESSION ? New priority for most institutionsNON-CREDIT ENROLLMENT ? ? Significant improvement but uneven
results
AFFORDABILITY TUITION AND FEE POLICY ? ? Even with large increases there is some progress in 2-yr differentials
NET COST TO STUDENTS NA Need 2003 data to assess statusFINANCIAL AID ? Minimal increase in need-based aid
EFFICIENCY & PRODUCTIVITY COST OF INSTRUCTIONAL PROGRAMS NA Delays in audits and data issues
FACILITIES INVENTORY & UTILIZATION NA Ready in FebruaryMANAGEMENT STANDARDS NA Performance audits delayed
Savings report due in February
OUTCOMES GRADUATION RATES ? Improvement on a limited number of campuses
JOB PLACEMENT & SALARY ? 75% placement reported for CTC TRAINING COMPLETIONS ? ? Significant increase but regional
variancesJOB CREATION OR IMPROVEMENT NARESEARCH PRODUCTS ? Funding increase but missing dataPERFORMANCE OF GRADUATES ? ? Some areas below 90% guidelineSTUDENT & EMPLOYER SATISFACTION NA Planned for 2004
ACCREDITATION STATUS OF 2-YR COMPONENTS
? 3-4 due by June 2004
ESSENTIAL CONDITIONS FOR CTCs ? ? Mixed performance with serious issues
? Decline in performance? ? ? No improvement or mixed results? Improvement in some or all areas? ? Approaching goal achievementNA No action or incomplete
LEGEND
REPORT CARD SUMMARY OF PROGRESSFALL 2003 PRELIMINARY REPORT
PERFORMANCE MEASURES
7
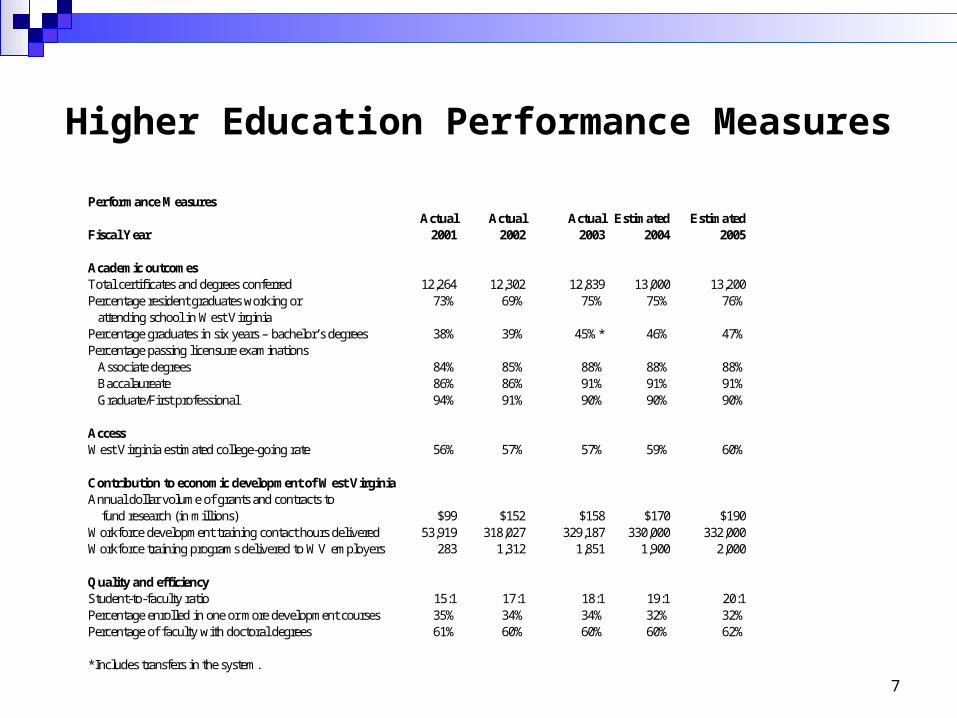
Higher Education Performance Measures
Performance Measures Actual Actual Actual Estimated Estimated Fiscal Year 2001 2002 2003 2004 2005 Academic outcomes Total certificates and degrees conferred 12,264 12,302 12,839 13,000 13,200 Percentage resident graduates working or 73% 69% 75% 75% 76% attending school in West Virginia Percentage graduates in six years – bachelor’s degrees 38% 39% 45%* 46% 47% Percentage passing licensure examinations Associate degrees 84% 85% 88% 88% 88% Baccalaureate 86% 86% 91% 91% 91% Graduate/First professional 94% 91% 90% 90% 90% Access West Virginia estimated college-going rate 56% 57% 57% 59% 60% Contribution to economic development of West Virginia Annual dollar volume of grants and contracts to fund research (in millions) $99 $152 $158 $170 $190 Workforce development training contact hours delivered 53,919 318,027 329,187 330,000 332,000 Workforce training programs delivered to WV employers 283 1,312 1,851 1,900 2,000 Quality and efficiency Student-to-faculty ratio 15:1 17:1 18:1 19:1 20:1 Percentage enrolled in one or more development courses 35% 34% 34% 32% 32% Percentage of faculty with doctoral degrees 61% 60% 60% 60% 62% *Includes transfers in the system.
8
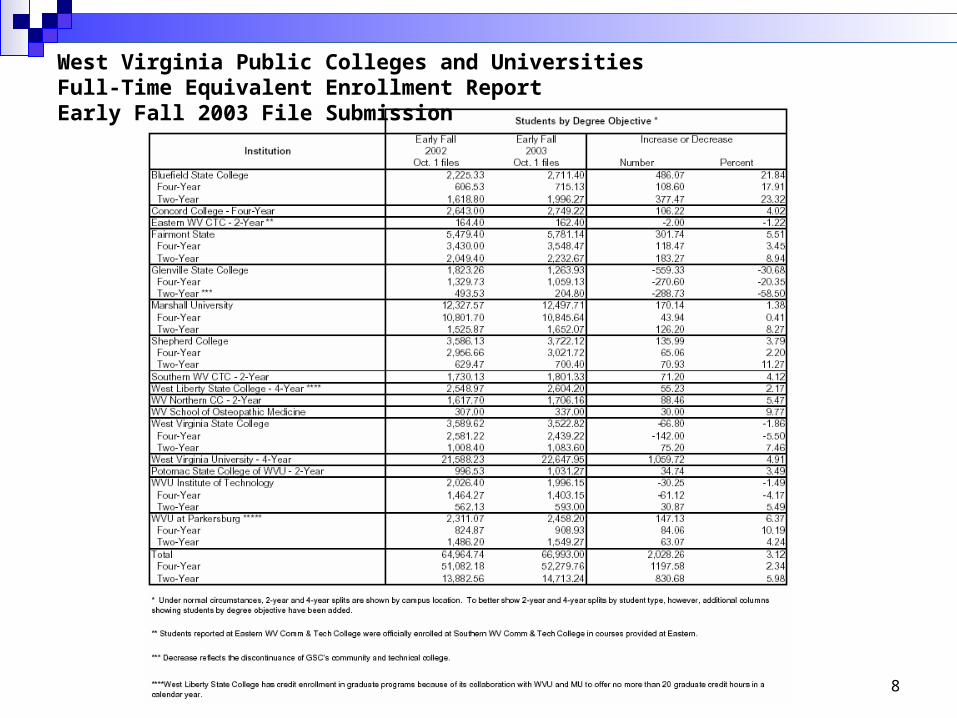
West Virginia Public Colleges and UniversitiesFull-Time Equivalent Enrollment ReportEarly Fall 2003 File Submission
9
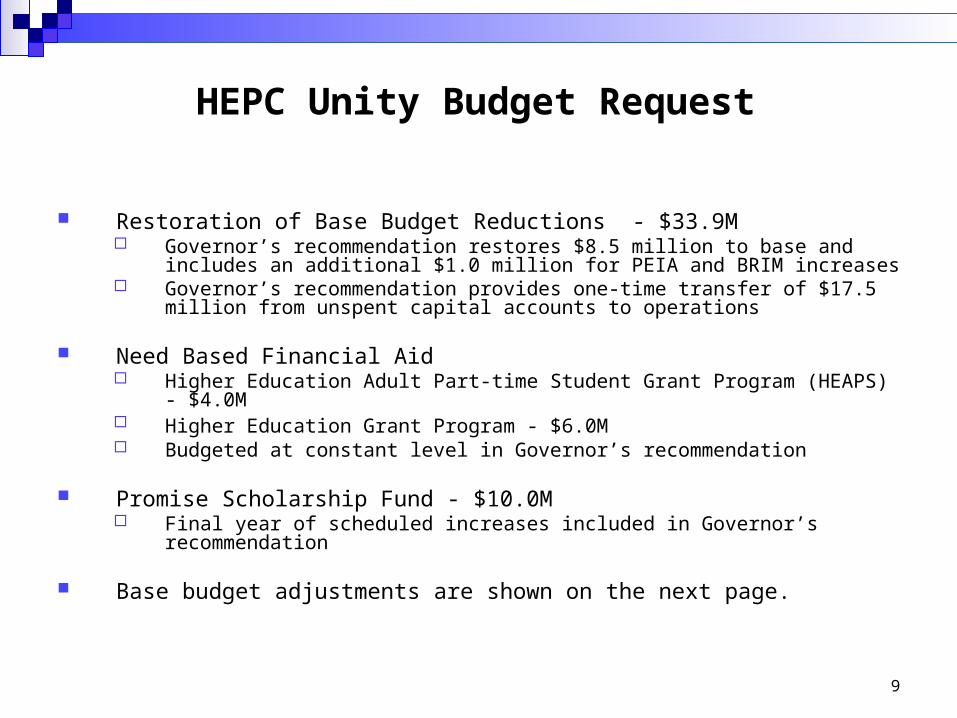
HEPC Unity Budget Request
Restoration of Base Budget Reductions - $33.9M Governor’s recommendation restores $8.5 million to base and includes an additional
$1.0 million for PEIA and BRIM increases Governor’s recommendation provides one-time transfer of $17.5 million from
unspent capital accounts to operations
Need Based Financial Aid Higher Education Adult Part-time Student Grant Program (HEAPS) - $4.0M Higher Education Grant Program - $6.0M Budgeted at constant level in Governor’s recommendation
Promise Scholarship Fund - $10.0M Final year of scheduled increases included in Governor’s recommendation
Base budget adjustments are shown on the next page.
10
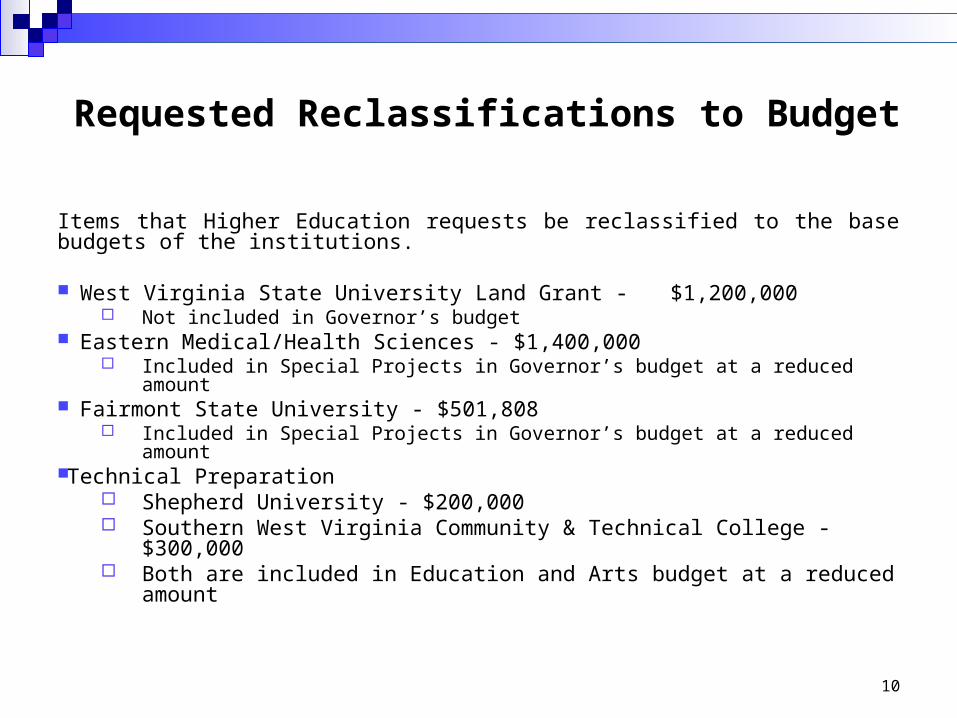
Requested Reclassifications to Budget
Items that Higher Education requests be reclassified to the base budgets of the institutions.
West Virginia State University Land Grant - $1,200,000 Not included in Governor’s budget
Eastern Medical/Health Sciences - $1,400,000 Included in Special Projects in Governor’s budget at a reduced amount
Fairmont State University - $501,808 Included in Special Projects in Governor’s budget at a reduced amount
Technical Preparation Shepherd University - $200,000 Southern West Virginia Community & Technical College - $300,000 Both are included in Education and Arts budget at a reduced amount
11
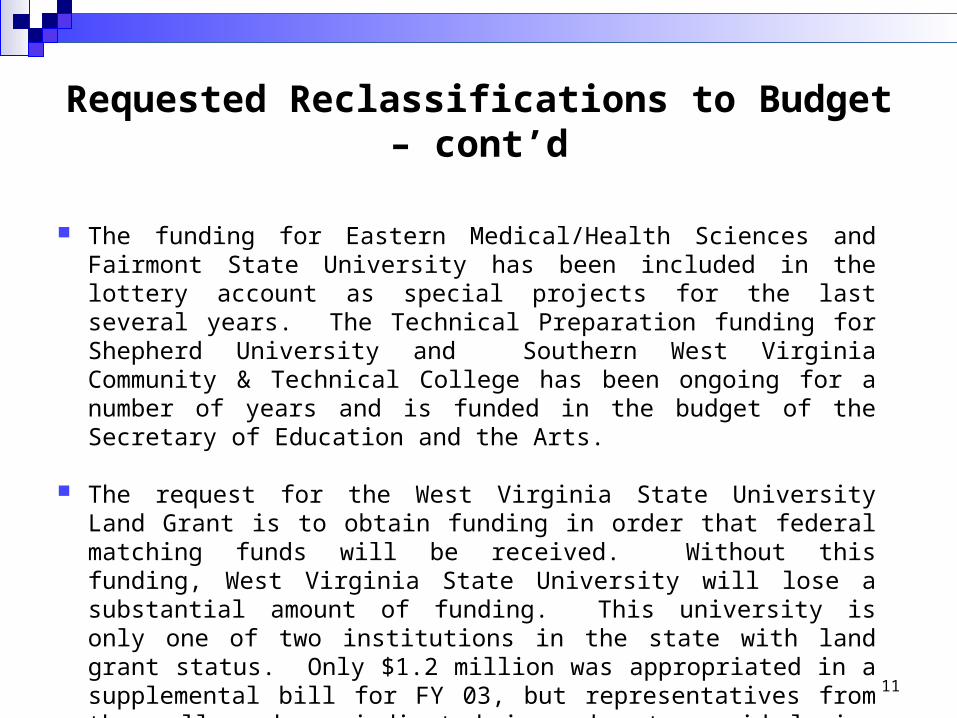
Requested Reclassifications to Budget – cont’d
The funding for Eastern Medical/Health Sciences and Fairmont State University has been included in the lottery account as special projects for the last several years. The Technical Preparation funding for Shepherd University and Southern West Virginia Community & Technical College has been ongoing for a number of years and is funded in the budget of the Secretary of Education and the Arts.
The request for the West Virginia State University Land Grant is to obtain funding in order that federal matching funds will be received. Without this funding, West Virginia State University will lose a substantial amount of funding. This university is only one of two institutions in the state with land grant status. Only $1.2 million was appropriated in a supplemental bill for FY 03, but representatives from the college have indicated in order to avoid losing federal matching dollars that state funds of $1.5 million is needed. This is not included in the Governor’s budget for FY 2005.
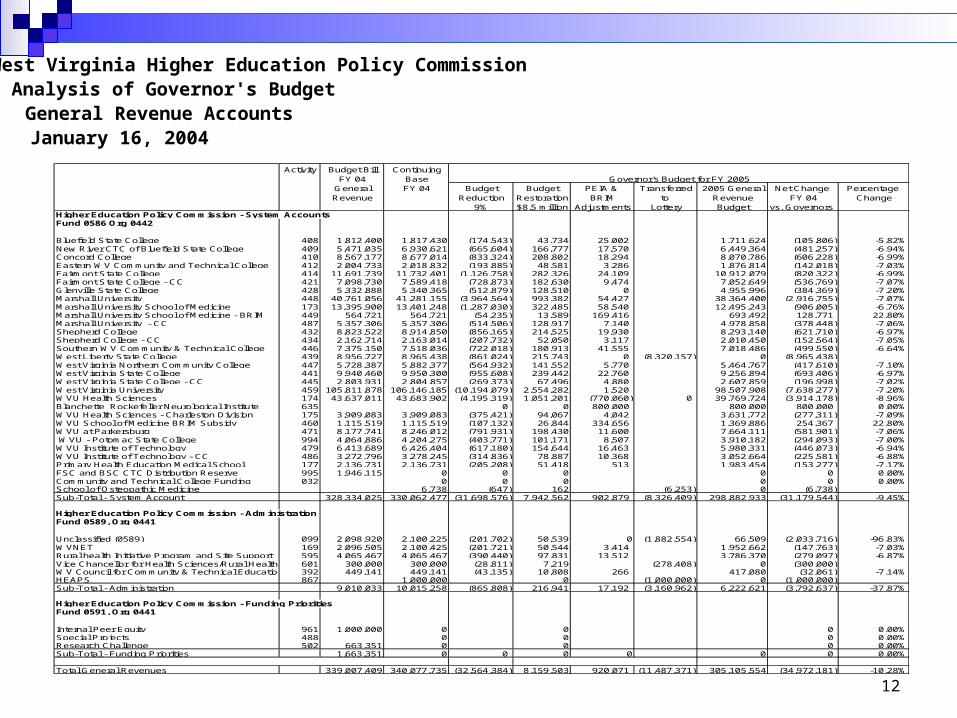
12
Activity Budget Bill Continuing FY 04 Base
General FY 04 Budget Budget PEIA & Transferred 2005 General Net Change Percentage Revenue Reduction Restoration BRIM to Revenue FY 04 Change
9% $8.5 million Adjustments Lottery Budget vs. GovernorsHigher Education Policy Commission - System AccountsFund 0586 Org 0442
Bluefield State College 408 1,812,400 1,817,430 (174,543) 43,734 25,002 1,711,624 (105,806) -5.82%New River CTC of Bluefield State College 409 5,471,035 6,930,621 (665,604) 166,777 17,570 6,449,364 (481,257) -6.94%Concord College 410 8,567,177 8,677,014 (833,324) 208,802 18,294 8,070,786 (606,228) -6.99%Eastern WV Community and Technical College 412 2,004,733 2,018,832 (193,885) 48,581 3,286 1,876,814 (142,018) -7.03%Fairmont State College 414 11,691,739 11,732,401 (1,126,758) 282,326 24,109 10,912,079 (820,322) -6.99%Fairmont State College - CC 421 7,098,730 7,589,418 (728,873) 182,630 9,474 7,052,649 (536,769) -7.07%Glenville State College 428 5,332,888 5,340,365 (512,879) 128,510 0 4,955,996 (384,369) -7.20%Marshall University 448 40,761,056 41,281,155 (3,964,564) 993,382 54,427 38,364,400 (2,916,755) -7.07%Marshall University School of Medicine 173 13,395,900 13,401,248 (1,287,030) 322,485 58,540 12,495,243 (906,005) -6.76%Marshall University School of Medicine - BRIM 449 564,721 564,721 (54,235) 13,589 169,416 693,492 128,771 22.80%Marshall University - CC 487 5,357,306 5,357,306 (514,506) 128,917 7,140 4,978,858 (378,448) -7.06%Shepherd College 432 8,823,522 8,914,850 (856,165) 214,525 19,930 8,293,140 (621,710) -6.97%Shepherd College - CC 434 2,162,714 2,163,014 (207,732) 52,050 3,117 2,010,450 (152,564) -7.05%Southern WV Community & Technical College 446 7,375,150 7,518,036 (722,018) 180,913 41,555 7,018,486 (499,550) -6.64%West Liberty State College 439 8,956,727 8,965,438 (861,024) 215,743 0 (8,320,157) 0 (8,965,438) West Virginia Northern Community College 447 5,728,387 5,882,377 (564,932) 141,552 5,770 5,464,767 (417,610) -7.10%West Virginia State College 441 9,940,460 9,950,300 (955,608) 239,442 22,760 9,256,894 (693,406) -6.97%West Virginia State College - CC 445 2,803,931 2,804,857 (269,373) 67,496 4,880 2,607,859 (196,998) -7.02%West Virginia University 459 105,811,878 106,146,185 (10,194,079) 2,554,282 1,520 98,507,908 (7,638,277) -7.20%WVU Health Sciences 174 43,637,011 43,683,902 (4,195,319) 1,051,201 (770,060) 0 39,769,724 (3,914,178) -8.96%Blanchette Rockefeller Neurological Institute 635 0 0 800,000 800,000 800,000 0.00%WVU Health Sciences - Charleston Division 175 3,909,083 3,909,083 (375,421) 94,067 4,042 3,631,772 (277,311) -7.09%WVU School of Medicine BRIM Subsidy 460 1,115,519 1,115,519 (107,132) 26,844 334,656 1,369,886 254,367 22.80%WVU at Parkersburg 471 8,177,741 8,246,012 (791,931) 198,430 11,600 7,664,111 (581,901) -7.06% WVU - Potomac State College 994 4,064,886 4,204,275 (403,771) 101,171 8,507 3,910,182 (294,093) -7.00%WVU Institute of Technology 479 6,413,689 6,426,404 (617,180) 154,644 16,463 5,980,331 (446,073) -6.94%WVU Institute of Technology - CC 486 3,272,796 3,278,245 (314,836) 78,887 10,368 3,052,664 (225,581) -6.88%Primary Health Education Medical School 177 2,136,731 2,136,731 (205,208) 51,418 513 1,983,454 (153,277) -7.17%FSC and BSC CTC Distribution Reserve 995 1,946,115 0 0 0 0 0 0.00%Community and Technical College Funding 032 0 0 0 0 0 0.00%School of Osteopathic Medicine 6,738 (647) 162 (6,253) 0 (6,738) Sub-Total - System Account 328,334,025 330,062,477 (31,698,576) 7,942,562 902,879 (8,326,409) 298,882,933 (31,179,544) -9.45%
Higher Education Policy Commission - Administration Fund 0589, Org 0441
Unclassified (0589) 099 2,098,920 2,100,225 (201,702) 50,539 0 (1,882,554) 66,509 (2,033,716) -96.83%WVNET 169 2,096,505 2,100,425 (201,721) 50,544 3,414 1,952,662 (147,763) -7.03%Rural health Initiative Program and Site Support 595 4,065,467 4,065,467 (390,440) 97,831 13,512 3,786,370 (279,097) -6.87%Vice Chancellor for Health Sciences/Rural Health 601 300,000 300,000 (28,811) 7,219 (278,408) 0 (300,000) WV Council for Community & Technical Education 392 449,141 449,141 (43,135) 10,808 266 417,080 (32,061) -7.14%HEAPS 867 1,000,000 0 (1,000,000) 0 (1,000,000) Sub-Total - Administration 9,010,033 10,015,258 (865,808) 216,941 17,192 (3,160,962) 6,222,621 (3,792,637) -37.87%
Higher Education Policy Commission - Funding Priorities Fund 0591, Org 0441
Internal Peer Equity 961 1,000,000 0 0 0 0.00%Special Projects 488 0 0 0 0.00%Research Challenge 502 663,351 0 0 0 0.00%Sub-Total - Funding Priorities 1,663,351 0 0 0 0 0 0 0.00%
Total General Revenues 339,007,409 340,077,735 (32,564,384) 8,159,503 920,071 (11,487,371) 305,105,554 (34,972,181) -10.28%
Governor's Budget for FY 2005
West Virginia Higher Education Policy CommissionAnalysis of Governor's BudgetGeneral Revenue AccountsJanuary 16, 2004
13
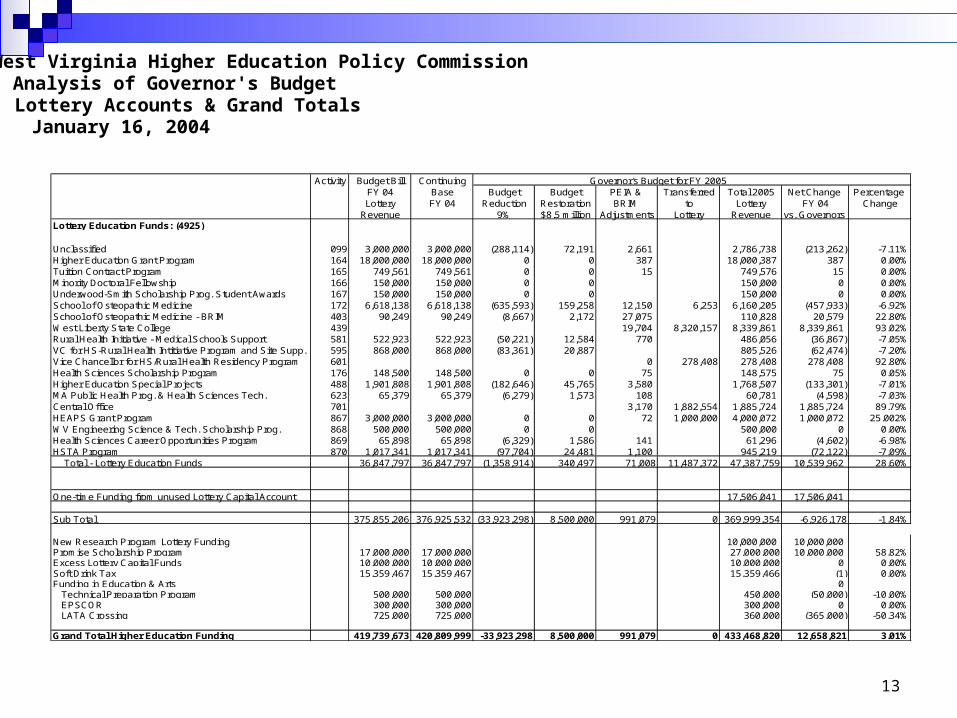
Activity Budget Bill ContinuingFY 04 Base Budget Budget PEIA & Transferred Total 2005 Net Change Percentage Lottery FY 04 Reduction Restoration BRIM to Lottery FY 04 Change
Revenue 9% $8.5 million Adjustments Lottery Revenue vs. GovernorsLottery Education Funds: (4925) Unclassified 099 3,000,000 3,000,000 (288,114) 72,191 2,661 2,786,738 (213,262) -7.11%Higher Education Grant Program 164 18,000,000 18,000,000 0 0 387 18,000,387 387 0.00%Tuition Contract Program 165 749,561 749,561 0 0 15 749,576 15 0.00%Minority Doctoral Fellowship 166 150,000 150,000 0 0 150,000 0 0.00%Underwood-Smith Scholarship Prog. Student Awards 167 150,000 150,000 0 0 150,000 0 0.00%School of Osteopathic Medicine 172 6,618,138 6,618,138 (635,593) 159,258 12,150 6,253 6,160,205 (457,933) -6.92%School of Osteopathic Medicine - BRIM 403 90,249 90,249 (8,667) 2,172 27,075 110,828 20,579 22.80%West Liberty State College 439 19,704 8,320,157 8,339,861 8,339,861 93.02%Rural Health Initiative - Medical Schools Support 581 522,923 522,923 (50,221) 12,584 770 486,056 (36,867) -7.05%VC for HS-Rural Health Intitiative Program and Site Supp. 595 868,000 868,000 (83,361) 20,887 805,526 (62,474) -7.20%Vice Chancellor for HS/Rural Health Residency Program 601 0 278,408 278,408 278,408 92.80%Health Sciences Scholarship Program 176 148,500 148,500 0 0 75 148,575 75 0.05%Higher Education Special Projects 488 1,901,808 1,901,808 (182,646) 45,765 3,580 1,768,507 (133,301) -7.01%MA Public Health Prog. & Health Sciences Tech. 623 65,379 65,379 (6,279) 1,573 108 60,781 (4,598) -7.03%Central Office 701 3,170 1,882,554 1,885,724 1,885,724 89.79%HEAPS Grant Program 867 3,000,000 3,000,000 0 0 72 1,000,000 4,000,072 1,000,072 25.002%WV Engineering Science & Tech. Scholarship Prog. 868 500,000 500,000 0 0 500,000 0 0.00%Health Sciences Career Opportunities Program 869 65,898 65,898 (6,329) 1,586 141 61,296 (4,602) -6.98%HSTA Program 870 1,017,341 1,017,341 (97,704) 24,481 1,100 945,219 (72,122) -7.09% Total - Lottery Education Funds 36,847,797 36,847,797 (1,358,914) 340,497 71,008 11,487,372 47,387,759 10,539,962 28.60%
One-time Funding from unused Lottery Capital Account 17,506,041 17,506,041
Sub Total 375,855,206 376,925,532 (33,923,298) 8,500,000 991,079 0 369,999,354 -6,926,178 -1.84%
New Research Program Lottery Funding 10,000,000 10,000,000Promise Scholarship Program 17,000,000 17,000,000 27,000,000 10,000,000 58.82%Excess Lottery Capital Funds 10,000,000 10,000,000 10,000,000 0 0.00%Soft Drink Tax 15,359,467 15,359,467 15,359,466 (1) 0.00%Funding in Education & Arts 0 Technical Preparation Program 500,000 500,000 450,000 (50,000) -10.00% EPSCOR 300,000 300,000 300,000 0 0.00% LATA Crossing 725,000 725,000 360,000 (365,000) -50.34%
Grand Total Higher Education Funding 419,739,673 420,809,999 -33,923,298 8,500,000 991,079 0 433,468,820 12,658,821 3.01%
Governor's Budget for FY 2005
West Virginia Higher Education Policy CommissionAnalysis of Governor's BudgetLottery Accounts & Grand TotalsJanuary 16, 2004
14
Loss of key faculty and staff members due to the lack of salary increases and competitive pay issues.
Further reduction of full-time faculty members and expanded use of part-time adjuncts and graduate assistants.
Inability to offer adequate course offerings potentially resulting in a delay in graduation for students.
Increased class sizes with a potential impact on the quality of the learning experience. Larger than normal increases in tuition rates resulting in potential access issues for need based
resident students. Reduced ability of the institutions to meet work-force development and adult education outreach
goals. Inability of the institutions to meet the objectives for higher education that were laid out in SB
653 and SB 703, i.e., workforce preparation, general educational attainment, and economic development goals.
Negative long-term impact on the economic development goals that were to be supported by Higher Education.
Potential Negative Impacts of the Budget Reduction

15
Community Undergrad & Medical Rural Grants &College Graduate Schools Health Scholarships Other Total
Bluefield $98,079 $25,444 $123,523Concord $121,478 $121,478Eastern $28,264 $28,264Fairmont $106,252 $164,254 $270,505Glenville $0 $74,765 $74,765Marshall $75,002 $586,088 $195,524 $15,598 $872,212Shepherd $30,282 $124,808 $155,090Southern $105,953 $105,953West Liberty $125,516 $125,516WV Northern $83,753 $83,753WV State $39,268 $139,304 $178,572WVU $1,507,691 $681,919 $45,665 $2,235,275WVUP $115,444 $115,444Potomac WVU $58,860 $58,860WVUIT $45,895 $89,970 $135,865WVSOM $94 $0 $94 Subtotal - Institutions $787,052 $2,959,319 $877,537 $61,263 $0 $0 $4,685,170
Commission Office $29,376 $49,691 $79,067WVNET $29,406 $29,406Special Projects $2,450 $2,450Rural Health $392 $392
Grand Total Higher Education $787,052 $2,959,319 $877,537 $91,031 $0 $81,547 $4,796,485
West Virginia Higher Education Policy CommissionMid-Year Budget Reduction for FY 2004Applied Across the BoardNon-Permanent Budget Adjustment
16
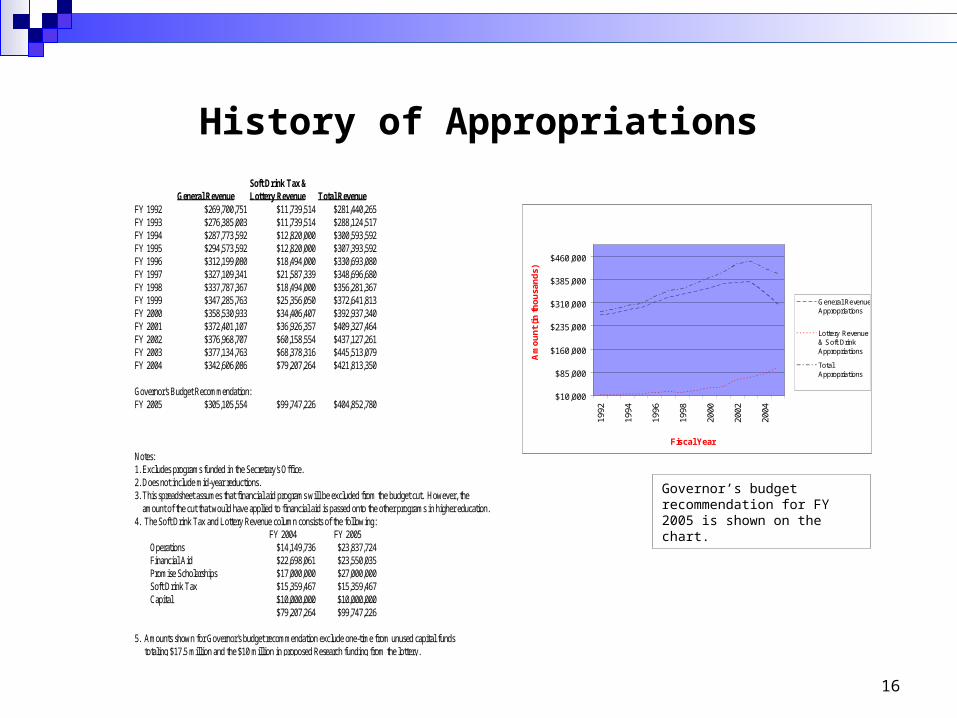
History of Appropriations
$10,000
$85,000
$160,000
$235,000
$310,000
$385,000
$460,000
1992
1994
1996
1998
2000
2002
2004
Fiscal Year
Am
ou
nt (
in th
ou
san
ds)
General RevenueAppropriations
Lottery Revenue& Soft DrinkAppropriations
TotalAppropriations
Governor’s budget recommendation for FY 2005 is shown on the chart.
Soft Drink Tax &General Revenue Lottery Revenue Total Revenue
FY 1992 $269,700,751 $11,739,514 $281,440,265FY 1993 $276,385,003 $11,739,514 $288,124,517FY 1994 $287,773,592 $12,820,000 $300,593,592FY 1995 $294,573,592 $12,820,000 $307,393,592FY 1996 $312,199,080 $18,494,000 $330,693,080FY 1997 $327,109,341 $21,587,339 $348,696,680FY 1998 $337,787,367 $18,494,000 $356,281,367FY 1999 $347,285,763 $25,356,050 $372,641,813FY 2000 $358,530,933 $34,406,407 $392,937,340FY 2001 $372,401,107 $36,926,357 $409,327,464FY 2002 $376,968,707 $60,158,554 $437,127,261FY 2003 $377,134,763 $68,378,316 $445,513,079FY 2004 $342,606,086 $79,207,264 $421,813,350
Governor's Budget Recommendation:FY 2005 $305,105,554 $99,747,226 $404,852,780
Notes:1. Excludes programs funded in the Secretary's Office.2. Does not include mid-year reductions.3. This spreadsheet assumes that financial aid programs will be excluded from the budget cut. However, the amount of the cut that would have applied to financial aid is passed onto the other programs in higher education.4. The Soft Drink Tax and Lottery Revenue column consists of the following:
FY 2004 FY 2005 Operations $14,149,736 $23,837,724 Financial Aid $22,698,061 $23,550,035 Promise Scholarships $17,000,000 $27,000,000 Soft Drink Tax $15,359,467 $15,359,467 Capital $10,000,000 $10,000,000
$79,207,264 $99,747,226
5. Amounts shown for Governor's budget recommendation exclude one-time from unused capital funds totaling $17.5 million and the $10 million in proposed Research funding from the lottery.
17
Higher Education Grant Program Budget Request
The West Virginia Higher Education Grant Program currently receives a state appropriation from lottery funds of $18,000,000 which is supplemented by an allocation from HERF fees (paid by public college and university students) of $1,800,000 and a federal matching grant of approximately $1,000,000. It is estimated that this will provide assistance to approximately 11,800 West Virginia students who will meet established standards of financial need and academic preparation in Fiscal Year 2003-04. Some 637 fully qualified students have not currently been assisted due to funding limitations.
Fiscal Year 2002-2003 was the first year since the mid 1990’s that the Grant Program did not receive a funding increase. Level funding combined with larger awards resulting primarily from tuition and fee increases caused the number of recipients to decline for this year. An increase of $6,000,000 is requested for Fiscal Year 2004-2005 with the funds to be used as follows:
An additional $1.7 million is needed to cover eligible students who are on the most recent award cycle waiting list at 70% of tuition and fee increases or cost adjustments.
An additional $2.3 million is needed to fund the fee increases for the Grant Program since its base funding level became $18 million in FY 2002. For fiscal year 2004, the four year institutions increased fees by approximately 9%, the two year component community colleges increased fees by approximately 4.5%, and the freestanding community colleges went to 0% with the roll backs in tuition. No final decision has been made yet, in regard to the projected FY 2005 tuition increases.
The remaining $2.0 million of the requested increase would be used for the thirteen newly eligible accredited proprietary institutions and is based on anticipated growth. This represents a change from last year because the proprietary institutions only became eligible with the passage of SB 646 during the last Regular Legislative Session.
18
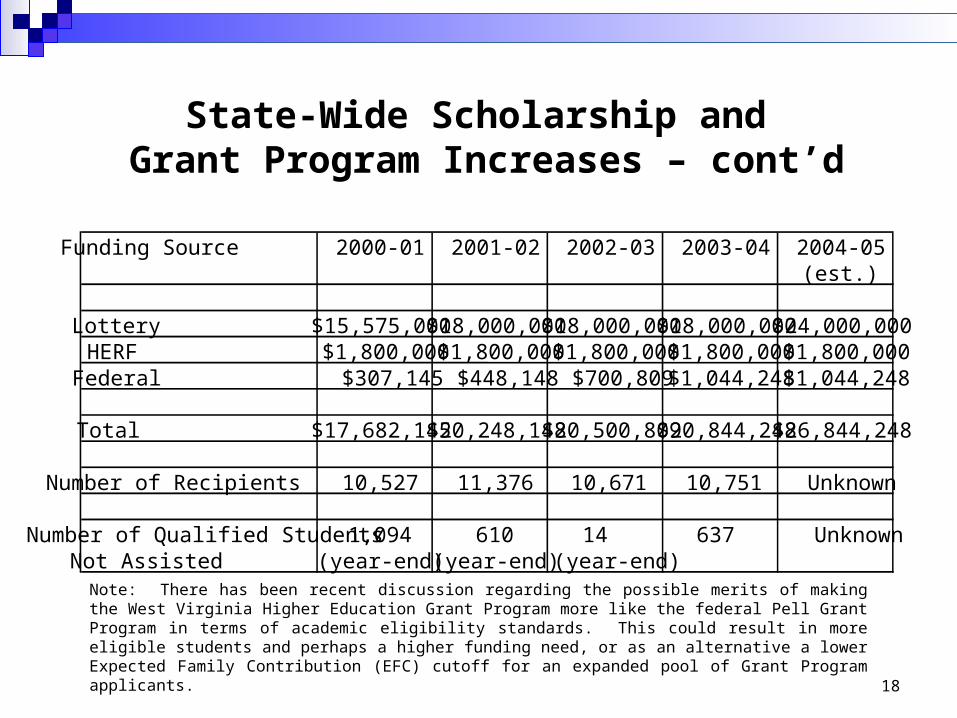
State-Wide Scholarship and Grant Program Increases – cont’d
Note: There has been recent discussion regarding the possible merits of making the West Virginia Higher Education Grant Program more like the federal Pell Grant Program in terms of academic eligibility standards. This could result in more eligible students and perhaps a higher funding need, or as an alternative a lower Expected Family Contribution (EFC) cutoff for an expanded pool of Grant Program applicants.
Funding Source 2000-01 2001-02 2002-03 2003-04 2004-05 (est.)
Lottery $15,575,000 $18,000,000 $18,000,000 $18,000,000 $24,000,000HERF $1,800,000 $1,800,000 $1,800,000 $1,800,000 $1,800,000Federal $307,145 $448,148 $700,809 $1,044,248 $1,044,248 Total $17,682,145 $20,248,148 $20,500,809 $20,844,248 $26,844,248
Number of Recipients 10,527 11,376 10,671 10,751 Unknown
Number of Qualified Students 1,094 610 14 637 Unknown Not Assisted (year-end) (year-end) (year-end)
19
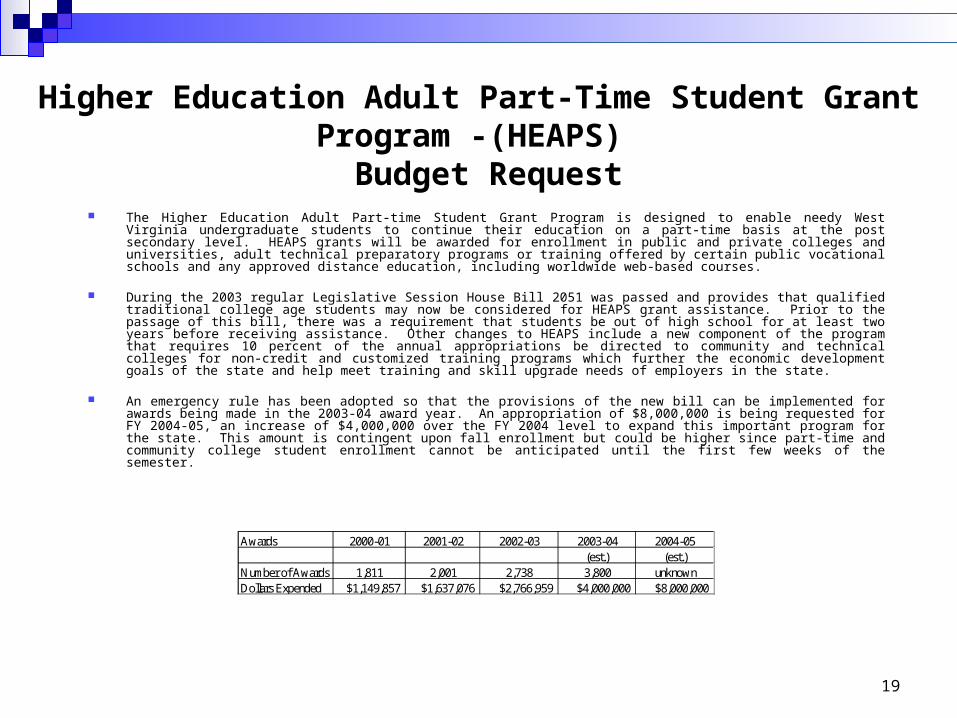
Higher Education Adult Part-Time Student Grant Program -(HEAPS)
Budget Request The Higher Education Adult Part-time Student Grant Program is designed to enable needy West Virginia undergraduate
students to continue their education on a part-time basis at the post secondary level. HEAPS grants will be awarded for enrollment in public and private colleges and universities, adult technical preparatory programs or training offered by certain public vocational schools and any approved distance education, including worldwide web-based courses.
During the 2003 regular Legislative Session House Bill 2051 was passed and provides that qualified traditional college age students may now be considered for HEAPS grant assistance. Prior to the passage of this bill, there was a requirement that students be out of high school for at least two years before receiving assistance. Other changes to HEAPS include a new component of the program that requires 10 percent of the annual appropriations be directed to community and technical colleges for non-credit and customized training programs which further the economic development goals of the state and help meet training and skill upgrade needs of employers in the state.
An emergency rule has been adopted so that the provisions of the new bill can be implemented for awards being made in the 2003-04 award year. An appropriation of $8,000,000 is being requested for FY 2004-05, an increase of $4,000,000 over the FY 2004 level to expand this important program for the state. This amount is contingent upon fall enrollment but could be higher since part-time and community college student enrollment cannot be anticipated until the first few weeks of the semester.
Awards 2000-01 2001-02 2002-03 2003-04 2004-05 (est.) (est.)
Number of Awards 1,811 2,001 2,738 3,800 unknownDollars Expended $1,149,857 $1,637,076 $2,766,959 $4,000,000 $8,000,000
20
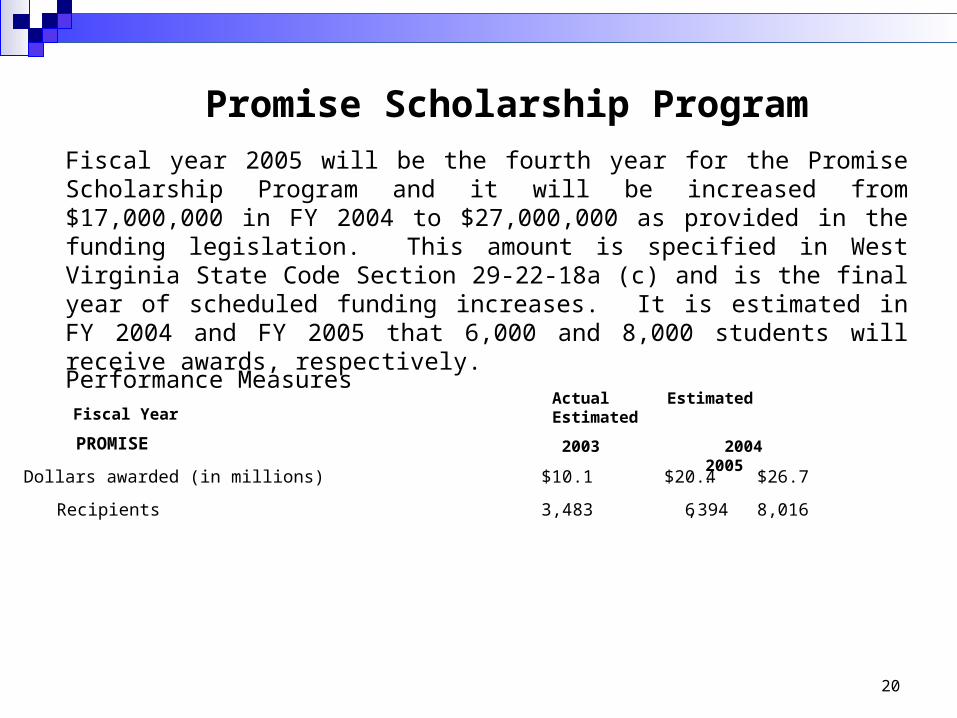
Fiscal year 2005 will be the fourth year for the Promise Scholarship Program and it will be increased from $17,000,000 in FY 2004 to $27,000,000 as provided in the funding legislation. This amount is specified in West Virginia State Code Section 29-22-18a (c) and is the final year of scheduled funding increases. It is estimated in FY 2004 and FY 2005 that 6,000 and 8,000 students will receive awards, respectively.
Promise Scholarship Program
PROMISE
Dollars awarded (in millions) $10.1 $20.4 . $26.7
Recipients 3,483 6,394 8,016
Actual Estimated Estimated
2003 2004 2005Fiscal Year
Performance Measures
21
West Virginia Higher Education Fund Combined Financial Statement Summary
For Fiscal Years 2002 and 2003
Total Revenues FY 02
Tuition19%
Contracts & Grants21%
Other Revenues
8%
Auxiliary Revenue
10%State
Appropria - tions42%
Total Revenues FY03
Tuition
22%
Contracts &
Grants
23%
Other
Rev enues
2%
Auxiliary
Rev enue
12%
State
Appropria -
tions
41%
Total Expenses FY03
Staff Costs63%
Depreciation7%
Supplies & Other21%
Other Expenses
4%
Financial Aid5%
Total Expenses for FY 02
Staff Costs62%
Depreciation6%
Financial Aid6%
Other Expenses
6%
Supplies & Other20%
22
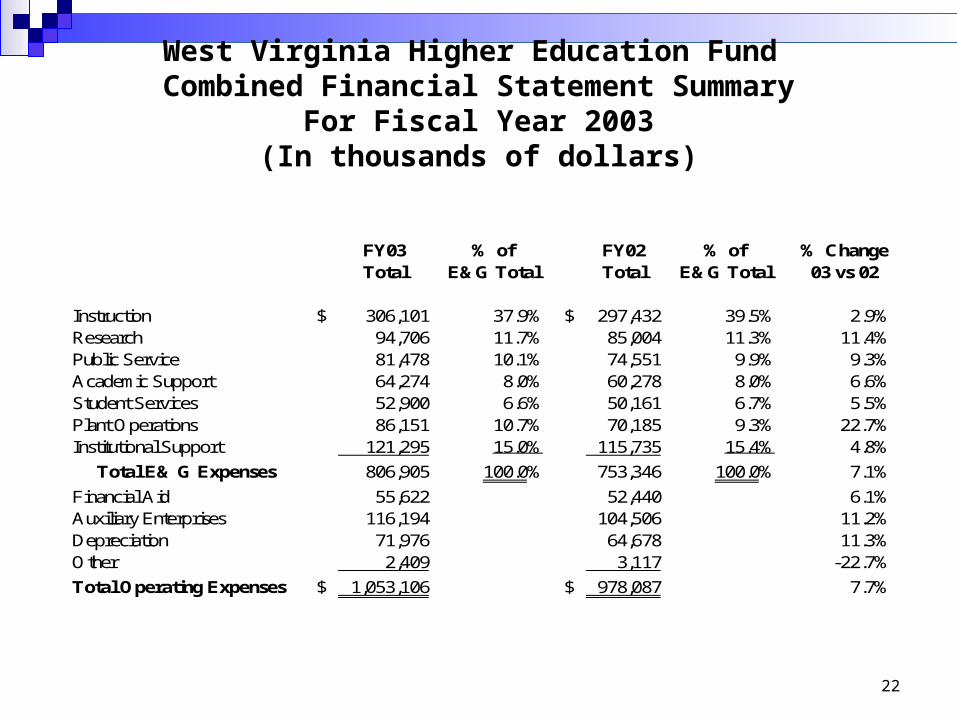
West Virginia Higher Education Fund Combined Financial Statement Summary
For Fiscal Year 2003(In thousands of dollars)
FY03 % of FY02 % of % ChangeTotal E&G Total Total E&G Total 03 vs 02
Instruction $ 306,101 37.9% $ 297,432 39.5% 2.9%Research 94,706 11.7% 85,004 11.3% 11.4%Public Service 81,478 10.1% 74,551 9.9% 9.3%Academic Support 64,274 8.0% 60,278 8.0% 6.6%Student Services 52,900 6.6% 50,161 6.7% 5.5%Plant Operations 86,151 10.7% 70,185 9.3% 22.7%Institutional Support 121,295 15.0% 115,735 15.4% 4.8%
Total E& G Expenses 806,905 100.0% 753,346 100.0% 7.1%
Financial Aid 55,622 52,440 6.1%Auxiliary Enterprises 116,194 104,506 11.2%Depreciation 71,976 64,678 11.3%Other 2,409 3,117 -22.7%
Total Operating Expenses $ 1,053,106 $ 978,087 7.7%
23
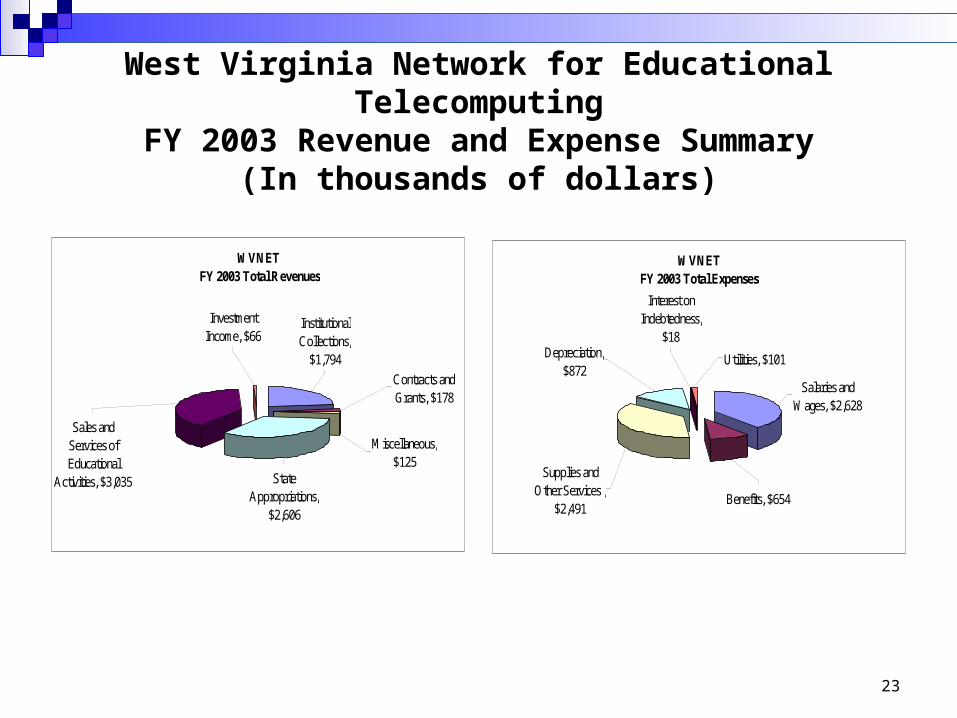
West Virginia Network for Educational TelecomputingFY 2003 Revenue and Expense Summary
(In thousands of dollars)
WVNET FY 2003 Total Revenues
Sales and Services of Educational
Activities, $3,035
Investment Income, $66
Institutional Collections,
$1,794
Contracts and Grants, $178
State Appropriations,
$2,606
Miscellaneous, $125
WVNET FY 2003 Total Expenses
Benefits, $654
Salaries and Wages, $2,628
Utilities, $101
Interest on Indebtedness,
$18Depreciation,
$872
Supplies and Other Services ,
$2,491
24
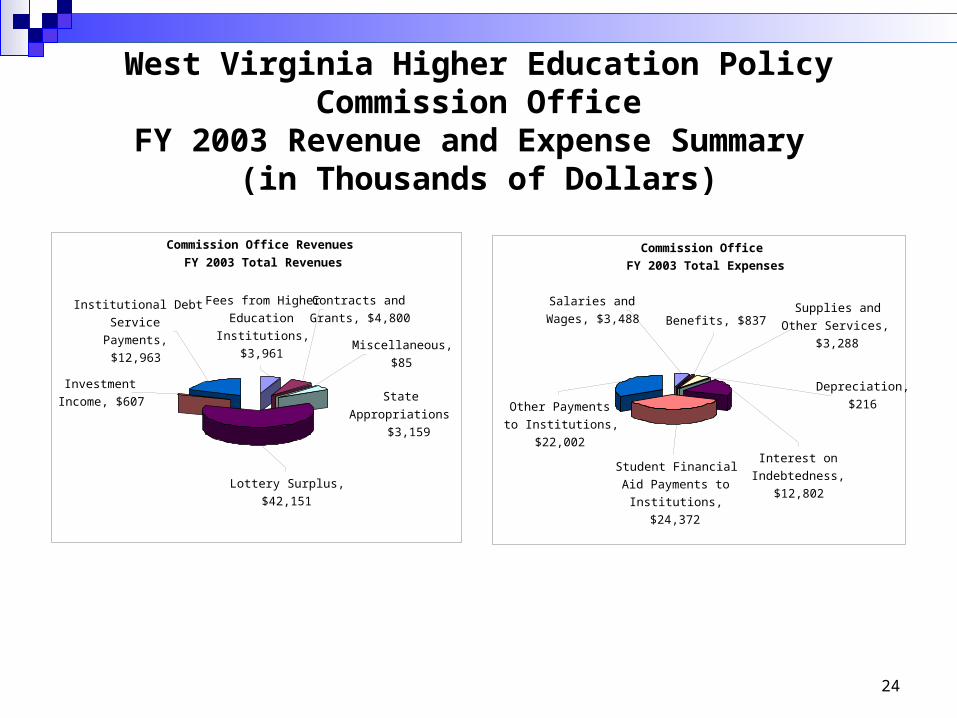
West Virginia Higher Education Policy Commission OfficeFY 2003 Revenue and Expense Summary
(in Thousands of Dollars)
Commission Office Revenues
FY 2003 Total Revenues
Contracts and
Grants, $4,800
Fees from Higher
Education
Institutions,
$3,961Miscellaneous,
$85
State
Appropriations
$3,159
Institutional Debt
Service
Payments,
$12,963
Investment
Income, $607
Lottery Surplus,
$42,151
Commission Office
FY 2003 Total Expenses
Other Payments
to Institutions,
$22,002Interest on
Indebtedness,
$12,802
Student Financial
Aid Payments to
Institutions,
$24,372
Salaries and
Wages, $3,488
Depreciation,
$216
Benefits, $837Supplies and
Other Services,
$3,288
25
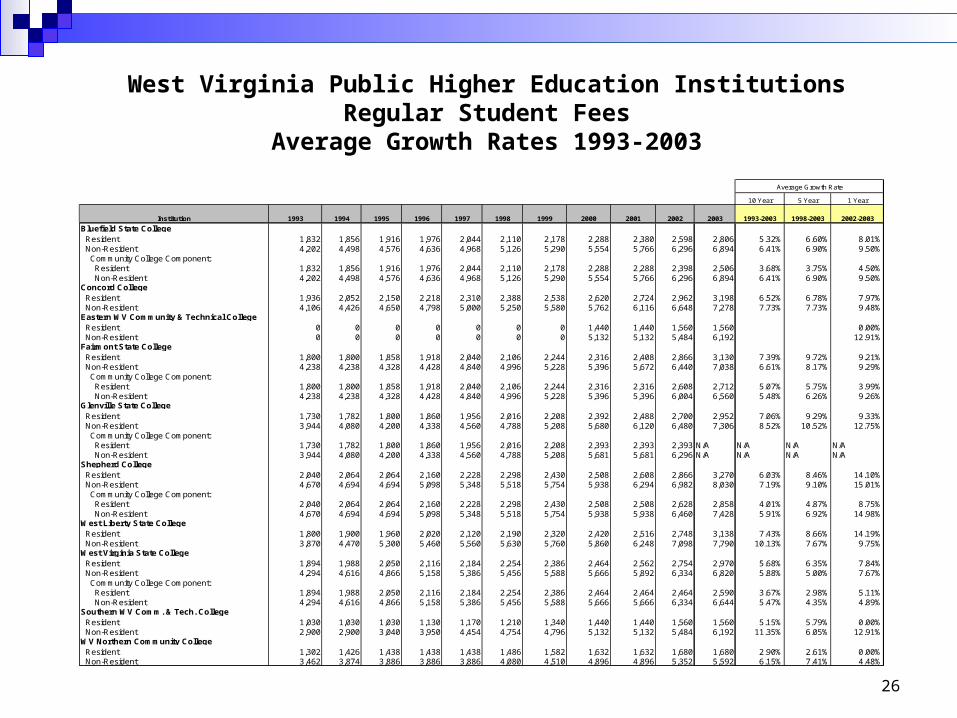
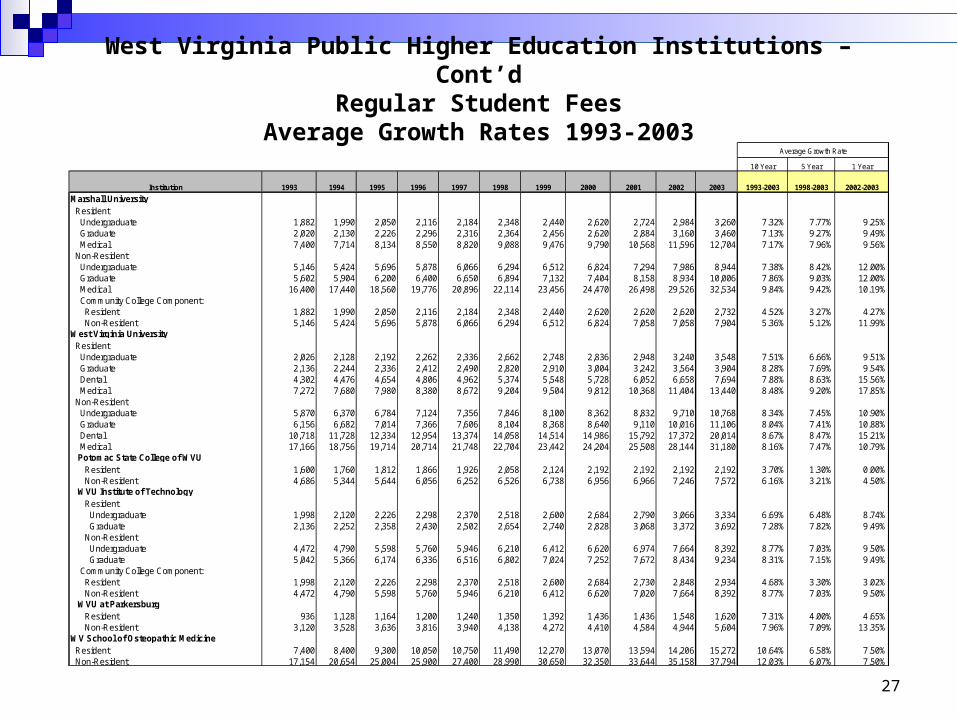
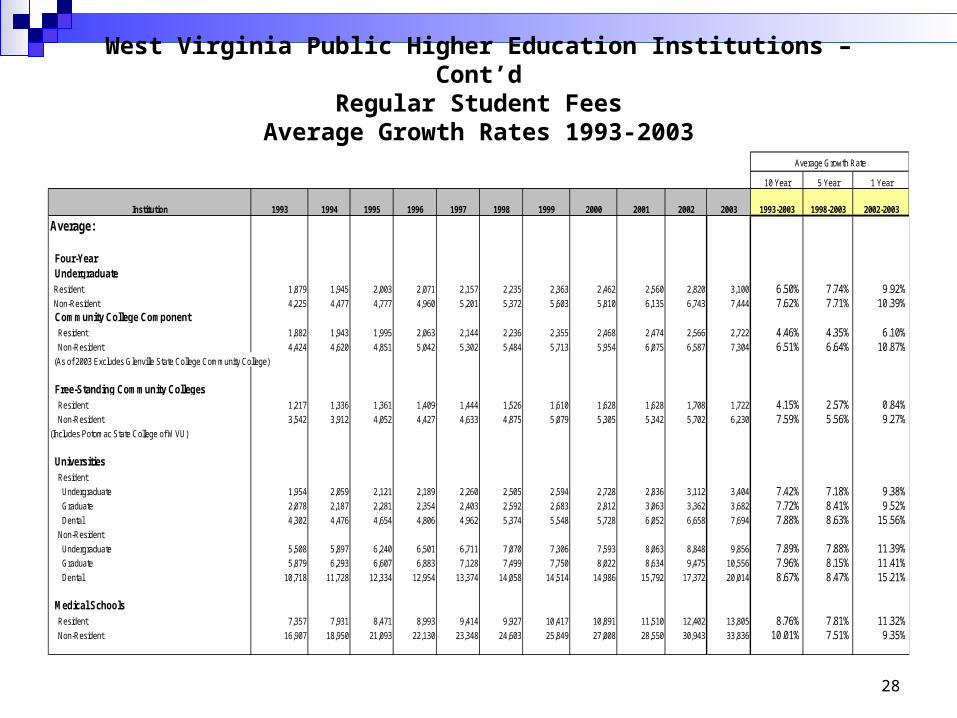
Due to budgetary issues, the tuition increases for the Fall of 2002 and 2003 have averaged over 9% at the four-year campuses. For the ten year period of 1993-2003, tuition increases averaged 6.50% for in-state resident students at the state colleges and 7.42% for the universities. Similar larger than normal tuition increases would be required for the Fall of 2005 if the proposed budget reductions are implemented. Tuition and fees rose 14.1% in the fall of 2003 for all national four-year public institutions according to data from the College Board. Tuition at four-year colleges in West Virginia remains well below the national median at 66.0%. Tuition and fees as a percentage of family income are comparable to national averages at the four-year level
Tuition and fees at WV free-standing community colleges was relatively unchanged in 2003. Tuition and fees rose 13.8% in the fall of 2003 for all national two-year public institutions according to data from the College Board. Tuition at WV two-year free-standing colleges was 90.4% of the national median. Tuition and fees as a percentage of family income remain above the national averages at the community college level. While progress has been made on lowering the differences in component community college rates, there is still room for improvement in minimizing these differences.
Due to the low per capita income of West Virginia residents, these tuition increases may have an impact on college participation rates. Improved funding will allow the institutions to maintain access and affordability for the residents of the state, a key for improved state economic conditions.
As a result of the required larger than normal tuition increases as described above, it is also a priority of the Policy Commission that funding for need-based financial aid also be increased to provide continued opportunities for WV residents to attend the higher education institutions. In addition, legislative changes revising the eligibility for the Higher Education Adult Part-time Student Grant Program (HEAPS) and the Higher Education State Grant Program will also require additional funding in order to meet the legislative intent of these changes.
Tuition and Fees
26
West Virginia Public Higher Education Institutions
Regular Student FeesAverage Growth Rates 1993-2003
Average Growth Rate
10 Year 5 Year 1 Year
Institution 1993 1994 1995 1996 1997 1998 1999 2000 2001 2002 2003 1993-2003 1998-2003 2002-2003
Bluefield State College Resident 1,832 1,856 1,916 1,976 2,044 2,110 2,178 2,288 2,380 2,598 2,806 5.32% 6.60% 8.01% Non-Resident 4,202 4,498 4,576 4,636 4,968 5,126 5,290 5,554 5,766 6,296 6,894 6.41% 6.90% 9.50% Community College Component: Resident 1,832 1,856 1,916 1,976 2,044 2,110 2,178 2,288 2,288 2,398 2,506 3.68% 3.75% 4.50% Non-Resident 4,202 4,498 4,576 4,636 4,968 5,126 5,290 5,554 5,766 6,296 6,894 6.41% 6.90% 9.50%Concord College Resident 1,936 2,052 2,150 2,218 2,310 2,388 2,538 2,620 2,724 2,962 3,198 6.52% 6.78% 7.97% Non-Resident 4,106 4,426 4,650 4,798 5,000 5,250 5,580 5,762 6,116 6,648 7,278 7.73% 7.73% 9.48%Eastern WV Community & Technical College Resident 0 0 0 0 0 0 0 1,440 1,440 1,560 1,560 0.00% Non-Resident 0 0 0 0 0 0 0 5,132 5,132 5,484 6,192 12.91%Fairmont State College Resident 1,800 1,800 1,858 1,918 2,040 2,106 2,244 2,316 2,408 2,866 3,130 7.39% 9.72% 9.21% Non-Resident 4,238 4,238 4,328 4,428 4,840 4,996 5,228 5,396 5,672 6,440 7,038 6.61% 8.17% 9.29% Community College Component: Resident 1,800 1,800 1,858 1,918 2,040 2,106 2,244 2,316 2,316 2,608 2,712 5.07% 5.75% 3.99% Non-Resident 4,238 4,238 4,328 4,428 4,840 4,996 5,228 5,396 5,396 6,004 6,560 5.48% 6.26% 9.26%Glenville State College Resident 1,730 1,782 1,800 1,860 1,956 2,016 2,208 2,392 2,488 2,700 2,952 7.06% 9.29% 9.33% Non-Resident 3,944 4,080 4,200 4,338 4,560 4,788 5,208 5,680 6,120 6,480 7,306 8.52% 10.52% 12.75% Community College Component: Resident 1,730 1,782 1,800 1,860 1,956 2,016 2,208 2,393 2,393 2,393 N/A N/A N/A N/A Non-Resident 3,944 4,080 4,200 4,338 4,560 4,788 5,208 5,681 5,681 6,296 N/A N/A N/A N/AShepherd College Resident 2,040 2,064 2,064 2,160 2,228 2,298 2,430 2,508 2,608 2,866 3,270 6.03% 8.46% 14.10% Non-Resident 4,670 4,694 4,694 5,098 5,348 5,518 5,754 5,938 6,294 6,982 8,030 7.19% 9.10% 15.01% Community College Component: Resident 2,040 2,064 2,064 2,160 2,228 2,298 2,430 2,508 2,508 2,628 2,858 4.01% 4.87% 8.75% Non-Resident 4,670 4,694 4,694 5,098 5,348 5,518 5,754 5,938 5,938 6,460 7,428 5.91% 6.92% 14.98%West Liberty State College Resident 1,800 1,900 1,960 2,020 2,120 2,190 2,320 2,420 2,516 2,748 3,138 7.43% 8.66% 14.19% Non-Resident 3,870 4,470 5,300 5,460 5,560 5,630 5,760 5,860 6,248 7,098 7,790 10.13% 7.67% 9.75%West Virginia State College Resident 1,894 1,988 2,050 2,116 2,184 2,254 2,386 2,464 2,562 2,754 2,970 5.68% 6.35% 7.84% Non-Resident 4,294 4,616 4,866 5,158 5,386 5,456 5,588 5,666 5,892 6,334 6,820 5.88% 5.00% 7.67% Community College Component: Resident 1,894 1,988 2,050 2,116 2,184 2,254 2,386 2,464 2,464 2,464 2,590 3.67% 2.98% 5.11% Non-Resident 4,294 4,616 4,866 5,158 5,386 5,456 5,588 5,666 5,666 6,334 6,644 5.47% 4.35% 4.89%Southern WV Comm. & Tech. College Resident 1,030 1,030 1,030 1,130 1,170 1,210 1,340 1,440 1,440 1,560 1,560 5.15% 5.79% 0.00% Non-Resident 2,900 2,900 3,040 3,950 4,454 4,754 4,796 5,132 5,132 5,484 6,192 11.35% 6.05% 12.91%WV Northern Community College Resident 1,302 1,426 1,438 1,438 1,438 1,486 1,582 1,632 1,632 1,680 1,680 2.90% 2.61% 0.00% Non-Resident 3,462 3,874 3,886 3,886 3,886 4,080 4,510 4,896 4,896 5,352 5,592 6.15% 7.41% 4.48%
27
West Virginia Public Higher Education Institutions – Cont’dRegular Student Fees
Average Growth Rates 1993-2003 Average Growth Rate
10 Year 5 Year 1 Year
Institution 1993 1994 1995 1996 1997 1998 1999 2000 2001 2002 2003 1993-2003 1998-2003 2002-2003
Marshall University Resident Undergraduate 1,882 1,990 2,050 2,116 2,184 2,348 2,440 2,620 2,724 2,984 3,260 7.32% 7.77% 9.25% Graduate 2,020 2,130 2,226 2,296 2,316 2,364 2,456 2,620 2,884 3,160 3,460 7.13% 9.27% 9.49% Medical 7,400 7,714 8,134 8,550 8,820 9,088 9,476 9,790 10,568 11,596 12,704 7.17% 7.96% 9.56% Non-Resident Undergraduate 5,146 5,424 5,696 5,878 6,066 6,294 6,512 6,824 7,294 7,986 8,944 7.38% 8.42% 12.00% Graduate 5,602 5,904 6,200 6,400 6,650 6,894 7,132 7,404 8,158 8,934 10,006 7.86% 9.03% 12.00% Medical 16,400 17,440 18,560 19,776 20,896 22,114 23,456 24,470 26,498 29,526 32,534 9.84% 9.42% 10.19% Community College Component: Resident 1,882 1,990 2,050 2,116 2,184 2,348 2,440 2,620 2,620 2,620 2,732 4.52% 3.27% 4.27% Non-Resident 5,146 5,424 5,696 5,878 6,066 6,294 6,512 6,824 7,058 7,058 7,904 5.36% 5.12% 11.99%West Virginia University Resident Undergraduate 2,026 2,128 2,192 2,262 2,336 2,662 2,748 2,836 2,948 3,240 3,548 7.51% 6.66% 9.51% Graduate 2,136 2,244 2,336 2,412 2,490 2,820 2,910 3,004 3,242 3,564 3,904 8.28% 7.69% 9.54% Dental 4,302 4,476 4,654 4,806 4,962 5,374 5,548 5,728 6,052 6,658 7,694 7.88% 8.63% 15.56% Medical 7,272 7,680 7,980 8,380 8,672 9,204 9,504 9,812 10,368 11,404 13,440 8.48% 9.20% 17.85% Non-Resident Undergraduate 5,870 6,370 6,784 7,124 7,356 7,846 8,100 8,362 8,832 9,710 10,768 8.34% 7.45% 10.90% Graduate 6,156 6,682 7,014 7,366 7,606 8,104 8,368 8,640 9,110 10,016 11,106 8.04% 7.41% 10.88% Dental 10,718 11,728 12,334 12,954 13,374 14,058 14,514 14,986 15,792 17,372 20,014 8.67% 8.47% 15.21% Medical 17,166 18,756 19,714 20,714 21,748 22,704 23,442 24,204 25,508 28,144 31,180 8.16% 7.47% 10.79% Potomac State College of WVU Resident 1,600 1,760 1,812 1,866 1,926 2,058 2,124 2,192 2,192 2,192 2,192 3.70% 1.30% 0.00% Non-Resident 4,686 5,344 5,644 6,056 6,252 6,526 6,738 6,956 6,966 7,246 7,572 6.16% 3.21% 4.50% WVU Institute of Technology Resident Undergraduate 1,998 2,120 2,226 2,298 2,370 2,518 2,600 2,684 2,790 3,066 3,334 6.69% 6.48% 8.74% Graduate 2,136 2,252 2,358 2,430 2,502 2,654 2,740 2,828 3,068 3,372 3,692 7.28% 7.82% 9.49% Non-Resident Undergraduate 4,472 4,790 5,598 5,760 5,946 6,210 6,412 6,620 6,974 7,664 8,392 8.77% 7.03% 9.50% Graduate 5,042 5,366 6,174 6,336 6,516 6,802 7,024 7,252 7,672 8,434 9,234 8.31% 7.15% 9.49% Community College Component: Resident 1,998 2,120 2,226 2,298 2,370 2,518 2,600 2,684 2,730 2,848 2,934 4.68% 3.30% 3.02% Non-Resident 4,472 4,790 5,598 5,760 5,946 6,210 6,412 6,620 7,020 7,664 8,392 8.77% 7.03% 9.50% WVU at Parkersburg Resident 936 1,128 1,164 1,200 1,240 1,350 1,392 1,436 1,436 1,548 1,620 7.31% 4.00% 4.65% Non-Resident 3,120 3,528 3,636 3,816 3,940 4,138 4,272 4,410 4,584 4,944 5,604 7.96% 7.09% 13.35%WV School of Osteopathic Medicine Resident 7,400 8,400 9,300 10,050 10,750 11,490 12,270 13,070 13,594 14,206 15,272 10.64% 6.58% 7.50% Non-Resident 17,154 20,654 25,004 25,900 27,400 28,990 30,650 32,350 33,644 35,158 37,794 12.03% 6.07% 7.50%
28
West Virginia Public Higher Education Institutions – Cont’dRegular Student Fees
Average Growth Rates 1993-2003
Average Growth Rate
10 Year 5 Year 1 Year
Institution 1993 1994 1995 1996 1997 1998 1999 2000 2001 2002 2003 1993-2003 1998-2003 2002-2003
Average:
Four-Year Undergraduate Resident 1,879 1,945 2,003 2,071 2,157 2,235 2,363 2,462 2,560 2,820 3,100 6.50% 7.74% 9.92% Non-Resident 4,225 4,477 4,777 4,960 5,201 5,372 5,603 5,810 6,135 6,743 7,444 7.62% 7.71% 10.39% Community College Component Resident 1,882 1,943 1,995 2,063 2,144 2,236 2,355 2,468 2,474 2,566 2,722 4.46% 4.35% 6.10% Non-Resident 4,424 4,620 4,851 5,042 5,302 5,484 5,713 5,954 6,075 6,587 7,304 6.51% 6.64% 10.87% (As of 2003 Excludes Glenville State College Community College)
Free-Standing Community Colleges Resident 1,217 1,336 1,361 1,409 1,444 1,526 1,610 1,628 1,628 1,708 1,722 4.15% 2.57% 0.84% Non-Resident 3,542 3,912 4,052 4,427 4,633 4,875 5,079 5,305 5,342 5,702 6,230 7.59% 5.56% 9.27%(Includes Potomac State College of WVU)
Universities Resident
Undergraduate 1,954 2,059 2,121 2,189 2,260 2,505 2,594 2,728 2,836 3,112 3,404 7.42% 7.18% 9.38% Graduate 2,078 2,187 2,281 2,354 2,403 2,592 2,683 2,812 3,063 3,362 3,682 7.72% 8.41% 9.52% Dental 4,302 4,476 4,654 4,806 4,962 5,374 5,548 5,728 6,052 6,658 7,694 7.88% 8.63% 15.56% Non-Resident
Undergraduate 5,508 5,897 6,240 6,501 6,711 7,070 7,306 7,593 8,063 8,848 9,856 7.89% 7.88% 11.39% Graduate 5,879 6,293 6,607 6,883 7,128 7,499 7,750 8,022 8,634 9,475 10,556 7.96% 8.15% 11.41% Dental 10,718 11,728 12,334 12,954 13,374 14,058 14,514 14,986 15,792 17,372 20,014 8.67% 8.47% 15.21%
Medical Schools Resident 7,357 7,931 8,471 8,993 9,414 9,927 10,417 10,891 11,510 12,402 13,805 8.76% 7.81% 11.32% Non-Resident 16,907 18,950 21,093 22,130 23,348 24,603 25,849 27,008 28,550 30,943 33,836 10.01% 7.51% 9.35%
29
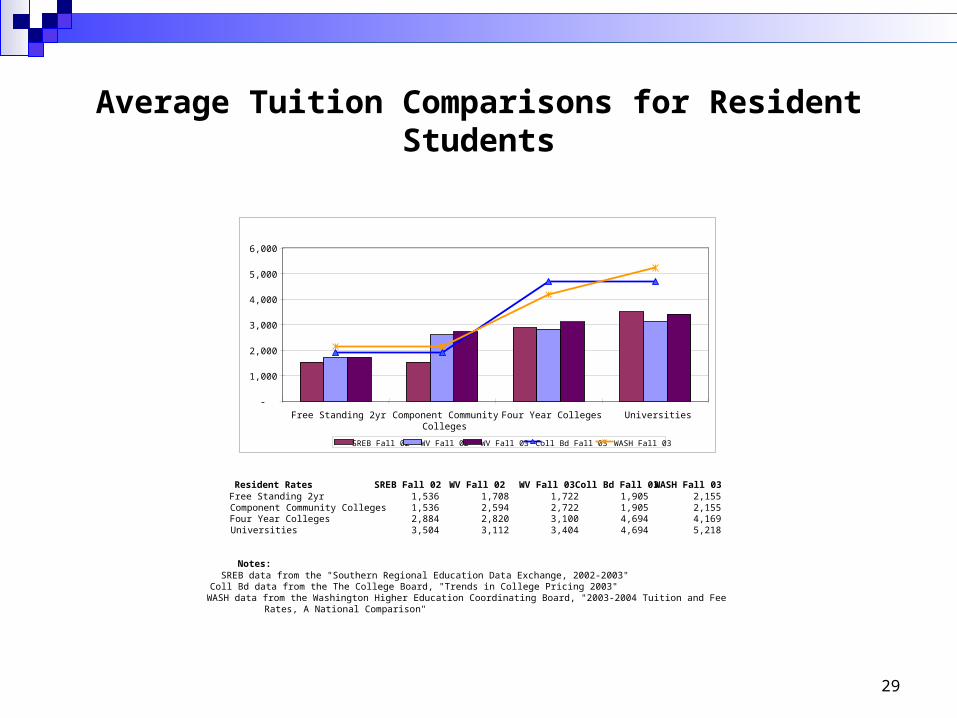
Average Tuition Comparisons for Resident Students
Resident Rates SREB Fall 02 WV Fall 02 WV Fall 03 Coll Bd Fall 03 WASH Fall 03Free Standing 2yr 1,536 1,708 1,722 1,905 2,155 Component Community Colleges 1,536 2,594 2,722 1,905 2,155 Four Year Colleges 2,884 2,820 3,100 4,694 4,169 Universities 3,504 3,112 3,404 4,694 5,218
Notes: SREB data from the "Southern Regional Education Data Exchange, 2002-2003" Coll Bd data from the The College Board, "Trends in College Pricing 2003" WASH data from the Washington Higher Education Coordinating Board, "2003-2004 Tuition and Fee Rates, A National Comparison"
-
1,000
2,000
3,000
4,000
5,000
6,000
Free Standing 2yr Component CommunityColleges
Four Year Colleges Universities
SREB Fall 02 WV Fall 02 WV Fall 03 Coll Bd Fall 03 WASH Fall 03
30
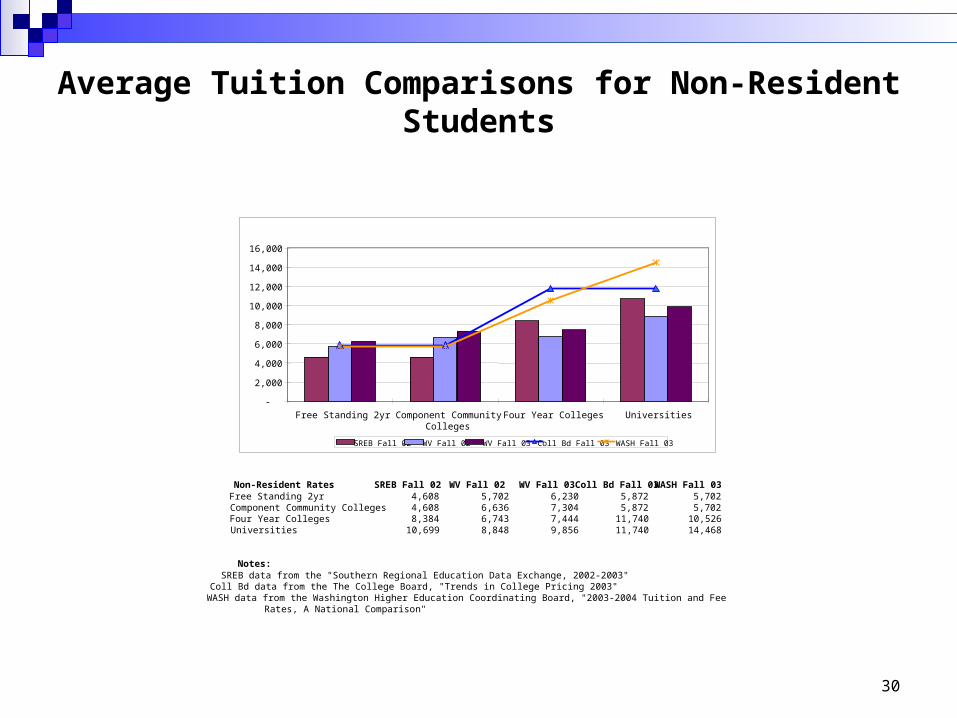
Average Tuition Comparisons for Non-Resident Students
Non-Resident Rates SREB Fall 02 WV Fall 02 WV Fall 03 Coll Bd Fall 03 WASH Fall 03Free Standing 2yr 4,608 5,702 6,230 5,872 5,702 Component Community Colleges 4,608 6,636 7,304 5,872 5,702 Four Year Colleges 8,384 6,743 7,444 11,740 10,526 Universities 10,699 8,848 9,856 11,740 14,468
Notes: SREB data from the "Southern Regional Education Data Exchange, 2002-2003" Coll Bd data from the The College Board, "Trends in College Pricing 2003" WASH data from the Washington Higher Education Coordinating Board, "2003-2004 Tuition and Fee Rates, A National Comparison"
-
2,000
4,000
6,000
8,000
10,000
12,000
14,000
16,000
Free Standing 2yr Component CommunityColleges
Four Year Colleges Universities
SREB Fall 02 WV Fall 02 WV Fall 03 Coll Bd Fall 03 WASH Fall 03
31
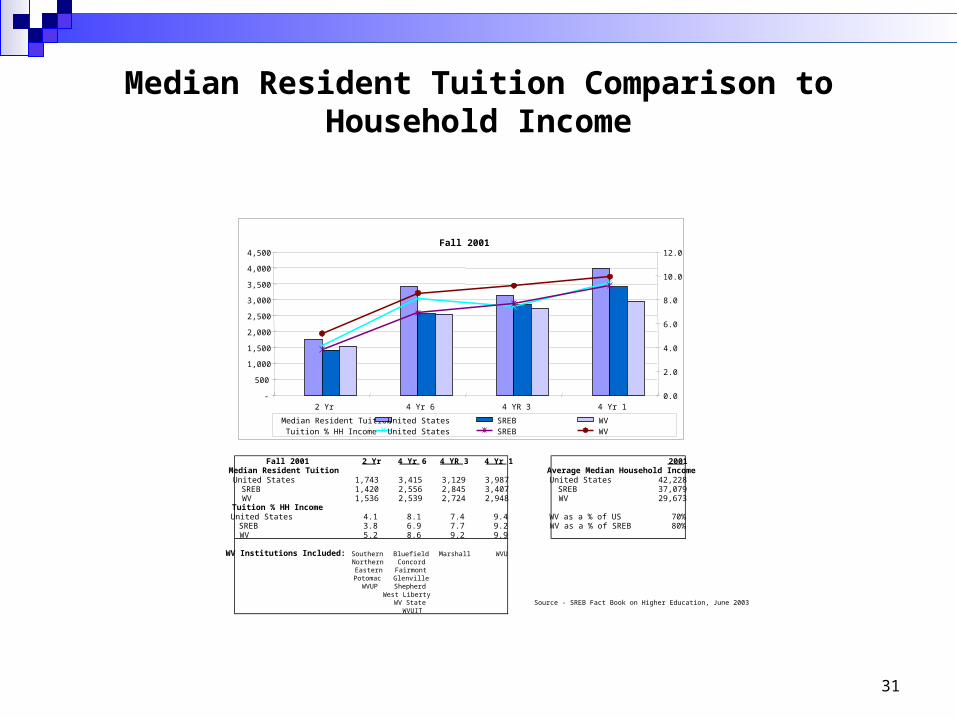
Median Resident Tuition Comparison to Household Income
Fall 2001 2 Yr 4 Yr 6 4 YR 3 4 Yr 1 2001Median Resident Tuition Average Median Household IncomeUnited States 1,743 3,415 3,129 3,987 United States 42,228 SREB 1,420 2,556 2,845 3,407 SREB 37,079 WV 1,536 2,539 2,724 2,948 WV 29,673
Tuition % HH IncomeUnited States 4.1 8.1 7.4 9.4 WV as a % of US 70%SREB 3.8 6.9 7.7 9.2 WV as a % of SREB 80%WV 5.2 8.6 9.2 9.9
WV Institutions Included: Southern Bluefield Marshall WVUNorthern ConcordEastern Fairmont
Potomac GlenvilleWVUP Shepherd
West LibertyWV State Source - SREB Fact Book on Higher Education, June 2003
WVUIT
Fall 2001
-
500
1,000
1,500
2,000
2,500
3,000
3,500
4,000
4,500
2 Yr 4 Yr 6 4 YR 3 4 Yr 10.0
2.0
4.0
6.0
8.0
10.0
12.0
Median Resident Tuition United States SREB WVTuition % HH Income United States SREB WV
32
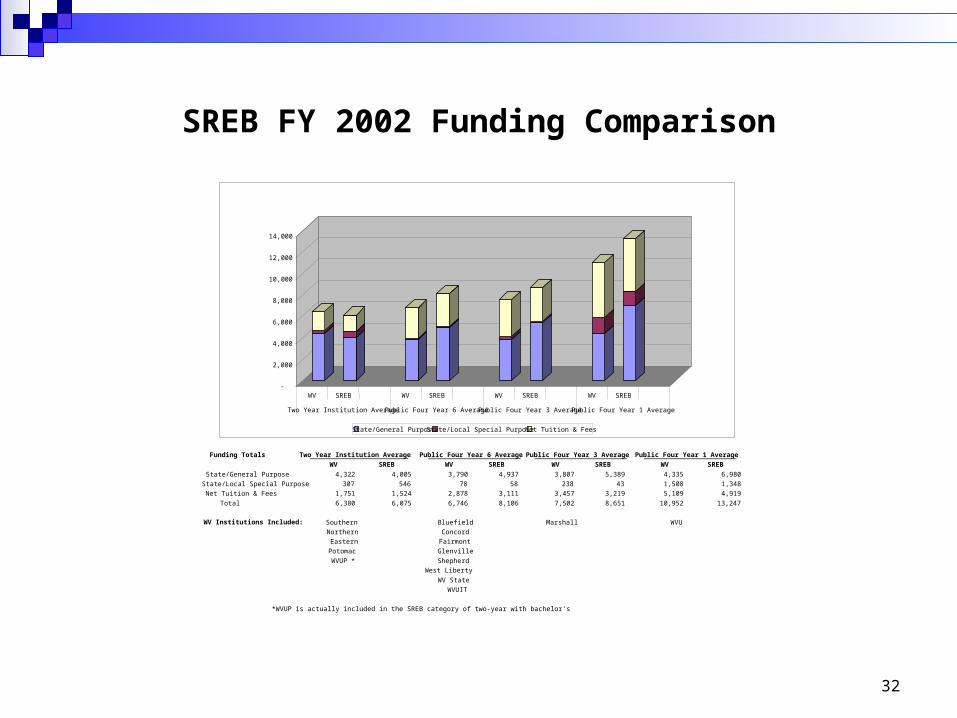
SREB FY 2002 Funding Comparison
Funding Totals Two Year Institution Average Public Four Year 6 Average Public Four Year 3 Average Public Four Year 1 Average
WV SREB WV SREB WV SREB WV SREB
State/General Purpose 4,322 4,005 3,790 4,937 3,807 5,389 4,335 6,980
State/Local Special Purpose 307 546 78 58 238 43 1,508 1,348
Net Tuition & Fees 1,751 1,524 2,878 3,111 3,457 3,219 5,109 4,919
Total 6,380 6,075 6,746 8,106 7,502 8,651 10,952 13,247
WV Institutions Included: Southern Bluefield Marshall WVU
Northern Concord
Eastern Fairmont
Potomac Glenville
WVUP * Shepherd
West Liberty
WV State
WVUIT
*WVUP is actually included in the SREB category of two-year with bachelor's
-
2,000
4,000
6,000
8,000
10,000
12,000
14,000
WV SREB WV SREB WV SREB WV SREB
Two Year Institution Average Public Four Year 6 Average Public Four Year 3 Average Public Four Year 1 Average
State/General Purpose State/Local Special Purpose Net Tuition & Fees
33
Other Pending Issues
Support is needed for implementing last year’s operational efficiency changes that were enacted in HB 2224. While Auditor Gainer and his staff have been extremely helpful in implementing these changes, resistance to change in other areas of state government has made the implementation of a portion of these legislatively mandated changes difficult this year.
The Governor has submitted a new bill this year to address efficiencies and flexibility within higher education. Recommendations included by the Governor address the areas of procurement, processing of financial transactions, revenue collection and expenditures, and human resource matters.
34
Other Pending Issues – cont’d
Support is also requested for our on-going request to simplify the state accounts required for tuition and fees. The Governor has submitted legislation on this matter which would greatly reduce the number of state accounts required to segregate tuition and fee collections, and would significantly streamline the business operations of the institutions.
In addition to the tuition and fee simplification, legislation has been requested that would provide for a pilot program for the establishment of per credit hour tuition and fees at up to three institutions to be approved by the Policy Commission.
35
Bond Issue
Higher Education would like to move forward with a new bond program to fund critical capital projects and deferred maintenance at the institutions, with funding for the bonds to come from the revenues appropriated in the Higher Education Improvement Fund. A listing of projects was last approved by the Policy Commission in June 2003. Due to changing circumstances, a small number of potential changes to the project list have been identified but a final recommendation has not yet been developed pending further discussion. Your support of this new bond issue for these crucial improvement projects will be greatly appreciated.
Recently the Policy Commission refinanced the 1992 System Debt which will result in savings for both the former college system and university system to be realized over the remaining nine year term of the bonds.
36
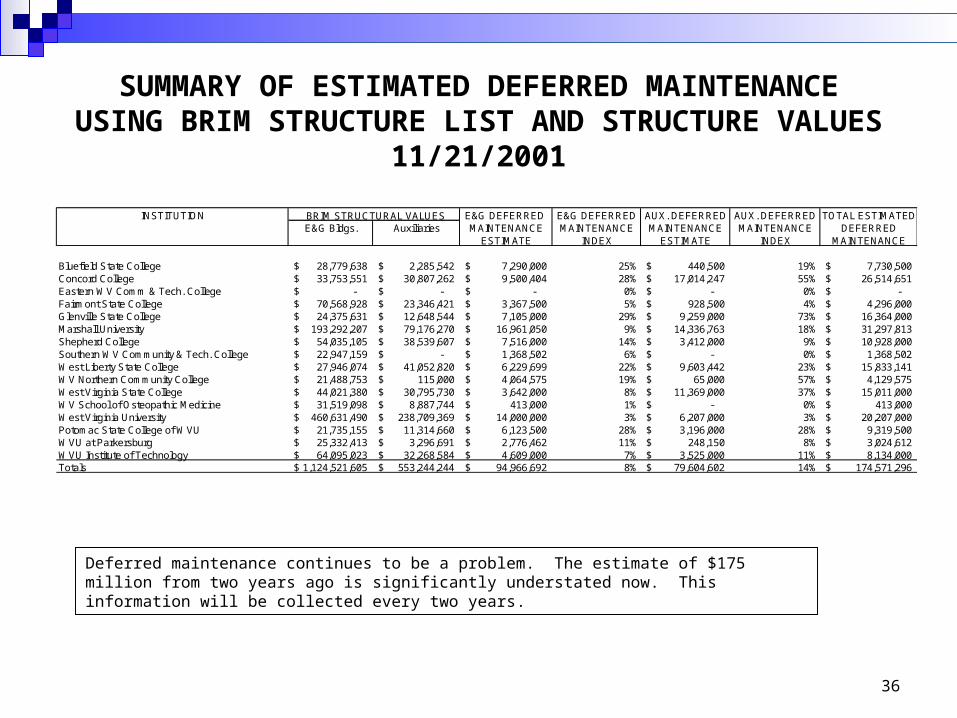
SUMMARY OF ESTIMATED DEFERRED MAINTENANCEUSING BRIM STRUCTURE LIST AND STRUCTURE VALUES
11/21/2001
INSTITUTION BRIM STRUCTURAL VALUES E&G DEFERRED E&G DEFERRED AUX. DEFERRED AUX. DEFERRED TOTAL ESTIMATEDE&G Bldgs. Auxiliaries MAINTENANCE MAINTENANCE MAINTENANCE MAINTENANCE DEFERRED
ESTIMATE INDEX ESTIMATE INDEX MAINTENANCE
Bluefield State College 28,779,638$ 2,285,542$ 7,290,000$ 25% 440,500$ 19% 7,730,500$ Concord College 33,753,551$ 30,807,262$ 9,500,404$ 28% 17,014,247$ 55% 26,514,651$ Eastern WV Comm & Tech. College -$ -$ -$ 0% -$ 0% -$ Fairmont State College 70,568,928$ 23,346,421$ 3,367,500$ 5% 928,500$ 4% 4,296,000$ Glenville State College 24,375,631$ 12,648,544$ 7,105,000$ 29% 9,259,000$ 73% 16,364,000$ Marshall University 193,292,207$ 79,176,270$ 16,961,050$ 9% 14,336,763$ 18% 31,297,813$ Shepherd College 54,035,105$ 38,539,607$ 7,516,000$ 14% 3,412,000$ 9% 10,928,000$ Southern WV Community & Tech. College 22,947,159$ -$ 1,368,502$ 6% -$ 0% 1,368,502$ West Liberty State College 27,946,074$ 41,052,820$ 6,229,699$ 22% 9,603,442$ 23% 15,833,141$ WV Northern Community College 21,488,753$ 115,000$ 4,064,575$ 19% 65,000$ 57% 4,129,575$ West Virginia State College 44,021,380$ 30,795,730$ 3,642,000$ 8% 11,369,000$ 37% 15,011,000$ WV School of Osteopathic Medicine 31,519,098$ 8,887,744$ 413,000$ 1% -$ 0% 413,000$ West Virginia University 460,631,490$ 238,709,369$ 14,000,000$ 3% 6,207,000$ 3% 20,207,000$ Potomac State College of WVU 21,735,155$ 11,314,660$ 6,123,500$ 28% 3,196,000$ 28% 9,319,500$ WVU at Parkersburg 25,332,413$ 3,296,691$ 2,776,462$ 11% 248,150$ 8% 3,024,612$ WVU Institute of Technology 64,095,023$ 32,268,584$ 4,609,000$ 7% 3,525,000$ 11% 8,134,000$ Totals 1,124,521,605$ 553,244,244$ 94,966,692$ 8% 79,604,602$ 14% 174,571,296$
Deferred maintenance continues to be a problem. The estimate of $175 million from two years ago is significantly understated now. This information will be collected every two years.
37
Funding for Institutions & Community College Components
The funding for the four year and community college components is being reviewed to see if a funding reallocation is necessary among the components. The original establishment of base budget appropriation allocations between the four-
year and community college components was based upon 1999 total enrollment data. Since that time, enrollment data has shifted significantly, and a more appropriate
allocation should exclude non-resident FTE enrollment. During FY 2003, significant progress has been made on developing an allocation model
for services that are provided between the component institutions, however more refinement of this process is required.
Pending policy issues include: Should appropriations between component entities be revised periodically based upon
enrollment changes? Should FTE enrollment be funded at a different level for component community college
students as compared to students enrolled in four-year programs? To what degree should cost allocation amounts and methodologies be allowed to vary based
upon individual institutional differences?

38
Follow-up Discussion