Higher Education ‘Market’ in Portugal: a diagnosis · Marquês de Marialva, 8, 7000-809 Évora,...
25
CEFAGE-UE, Universidade de Évora, Palácio do Vimioso, Lg. Marquês de Marialva, 8, 7000-809 Évora, Portugal Telf: +351 266 706 581 - E-mail: [email protected] - Web: www.cefage.uevora.pt CEFAGE-UE Working Paper 2011/13 Higher Education ‘Market’ in Portugal: a diagnosis Conceição Rego 1, António Caleiro 2 1 Departamento de Economia & CEFAGE-UE, Universidade de Évora 2 Departamento de Economia & CEFAGE-UE, Universidade de Évora
Transcript of Higher Education ‘Market’ in Portugal: a diagnosis · Marquês de Marialva, 8, 7000-809 Évora,...

CEFAGE-UE, Universidade de Évora, Palácio do Vimioso, Lg. Marquês de Marialva, 8, 7000-809 Évora, Portugal Telf: +351 266 706 581 - E-mail: [email protected] - Web: www.cefage.uevora.pt
CEFAGE-UE Working Paper2011/13
Higher Education ‘Market’ in Portugal: a diagnosis
Conceição Rego 1, António Caleiro 2
1 Departamento de Economia & CEFAGE-UE, Universidade de Évora
2 Departamento de Economia & CEFAGE-UE, Universidade de Évora

Conceição Rego ([email protected])
António Caleiro ([email protected])
Departamento de Economia & CEFAGE‐UE Universidade de Évora
Higher Education ‘Market’ in Portugal: a diagnosis
April 18, 2011
Abstract
The higher education system in Portugal, in recent decades, experienced profound
structural changes, including a substantial increase in the number of higher education
institutions, scattered throughout the country, with a growing number of students
and teachers. The subject of this study is to examine the characteristics of current
supply and demand within the higher education subsystem, in Portugal. The
methodological approach includes two steps: first, making a characterization of key
variables that shape demand and supply of higher education in Portugal and, second,
using spatial econometric analysis, particularly multidimensional scaling, in order to
estimate the location of universities.
Keywords: Higher education, Multidimensional scaling, Spatial location.
JEL classification: C14, I23, R12, R53 .

2
1.Introduction
An old saying that "a picture is worth a thousand words" seems appropriate to begin
with. In an episode reported by Graça Machel (during her speech at the University of
Évora, in 2008, on the occasion of conferring the degree of Honoris Causa Doctor).
Graça Machel had recently visited the village where she was born in Mozambique,
with the purpose of reviewing her childhood friends. Without surprise she found they
had all stayed in the village and kept the pace and the traditional lifestyle of women in
African villages, as had happened with their mothers. Graça Machel concluded, in this
regard, that the main factor that made the difference between her own life and the
lives of her childhood friends was the education to which she had access, contrary to
what happened to her friends.
Access to education and, in particular, higher education, is a factor which determines
not only the success of individuals but also the development level of countries and
regions. Economic theory says, and the empirical evidence shows, that those
countries where the population, in particular the active part, display a higher level of
education, productivity and income are higher than in regions where education levels
are lower (Chevalier et al., 2004; OECD, 1997, 1998).Therefore, among other reasons,
it is important for us to understand how is Portugal currently doing in terms of the
'market' in higher education.
One of the most decisive social phenomena in Portugal during the last decades,
concerns related precisely the amendment of the higher education system. In the
mid‐70, higher education in Portugal was concentrated only in major cities (Lisbon,
Coimbra and Oporto) and was attended by only a small portion of the population, the
economic and social elite, that could access knowledge and training. As a matter of
fact, the overwhelming majority of the population was excluded from most of the
education system and of the higher education subsystem in particular. In the early
70's, 25% of its population was illiterate and only 17% had only four years of schooling.

3
Improving the level of schooling of the population ~had already been a goal during the
last years of the ‘Estado Novo’, under the guidance of the Minister of Education Veiga
Simão, and was reflected later in the priorities of the Portuguese society after April 25,
1974. In the particular case of higher education, in the last 30 years, Portugal i)
increased the number of students and institutions, ii) has diversified the available
training to new areas, iii) there was a territorial expansion within the country and iv)
the organizational model for this subsystem has become more complex, including
universities and polytechnics which throughout the country, can be either public or
private. In the late twentieth century, taking into account demography, supply is
excessive when confronted with candidates seeking admission in higher education.
Currently, higher education is attended by over 370 000 students who fall by nearly
one hundred and fifty institutions, public and private, located throughout the country
and representing 17% of Portuguese students.
The importance of higher education institutions (HEI’s) located in cities of small /
medium size can be assessed in many ways, in income, in the transmission of
knowledge or even in the changing routines and habits of urban culture and sport as
several studies have shown abundantly (Goldstein & Renault, 2004; OECD, 1999).
Admitting different net benefits for the territory associated with the presence of
HEI’s, we intend to diagnose in this study the current characteristics of supply and
demand within the subsystem of higher education in Portugal, paying particular
attention to its location in space. Our fundamental concern is trying to ascertain
whether the HEI’s, located in different parts of the territory, are instruments of
territorial cohesion within national boundaries, or conversely, contribute to magnify
the disparities that exist between coastal and inner‐land areas of the country. The
methodological approach shall include two steps: first, we shall proceed to a
characterization of key variables that shape demand and supply of higher education in
Portugal and, secondly, we shall use spatial econometric analysis in order to verify
how far apart universities are.

4
Following this initial section the paper will include a section where literature
concerning current goals of HEI’s as well as their territorial consequences will be
summarily reviewed. Afterwards we will proceed to characterize the 'market' for
higher education, assessing supply and demand. In the empirical part, we will, then,
discuss the spatial approach, and in particular the (possible) displacements of demand
towards the sites where supply is located. The paper ends with some final thoughts
and some possible paths for future research.
2. Literature Review
As we have stated previously, the presence of HEI’s in the territory results in various
effects, abundantly treated in the literature (one can highlight, among others, the
OECD studies, mainly through the Programme on Institutional Management in Higher
Education (IMHE), or Goddard (1997, 1998, 2001), Bleaney et.al. (1992), Brown and
Hearney (1997)). Major contributions were recently summarized in eight different
functions (Drucker and Goldstein, 2007: 22) or outputs. Universities may give rise to
impacts at the level of economic development: i) knowledge creation, ii) creation of
human capital, iii) transfer of existing knowledge; iv) technological innovation; v)
capital investment; vi) regional leadership, vii) infrastructure of knowledge production
and viii) impact on local and regional environment.
Effects produced by HEI’s result from their legal obligations, which are inter‐related
objectives (or missions), to continue along this segment of education. "Higher
education aims at the qualification of high‐level training of the Portuguese, the
production and dissemination of knowledge, as well as the cultural, artistic,
technological and scientific expertise of its students, an international reference
framework", determines number 1 of article 2 (Mission of Higher Education) of the
Regime Jurídico do Ensino Superior (Law No. 62/2007 of September 10). In this sense,
we realize that Portuguese legislation explicitly confers higher education the mission
to improve the qualifications of individuals and, correspondingly, to promote the

5
dissemination in society of knowledge generated by the HEI’s. In this task, in
particular, graduates become 'agents' with increased responsibilities.
Portuguese HEIs, as well as their European counterparts, based on statements from
the Sorbonne and Bologna, dated 1988, are committed to building a European
knowledge, based on a European system of higher education. In this scenario, the
HEIs themselves are privileged instruments that, by being located in the territories,
induce mechanisms of economic growth and social cohesion, as stipulated by the
Lisbon Strategy.
The Europe of Knowledge (COM, 2003) is based on four key factors that are
interconnected: production of knowledge mainly through research, its transmission
through education and training, dissemination through information technologies and
communication and use of technological innovation. HEIs are institutions of
excellence crossing the factors of research, education and innovation, which are both
the 'core' of knowledge society. Moreover, according to the Lisbon Strategy, the
European Commission considers that the HEI’s has assumed a particular responsibility
in the field of employment and social cohesion, in that it serves to enhance the
general level of education in Europe and, correspondingly, in conditions of
employment and unemployment protection (in these areas, in particular, the effect of
the University of Evora has been proved empirically in Rego & Caleiro (2003, 2009 and
2010).
To achieve the goal of improving territorial cohesion, one of the contributions due to
HEI's is their ability to attract / retain students. In addition, it is essential that young
graduates can find work in local markets, which obviously depends on the activities
installed in the various territories. The specific literature on this topic (for example,
Beeson and Montgomery, 1993; DeGaudemard, 1996, Brown and Heaney, 1997;
Goddard, 1998; OECD, 1999) argues that it is through the performance of the
education function and the provision of graduates for the local labor market that

6
regional territorial effects of the HEI’S are more significant. The influence of these
institutions can be felt, on the one hand, by increasing employment and the
availability of opportunities to obtain higher wages for young graduates and, on the
other hand, by increasing the average level of knowledge of human capital, HEI’S may
promote increased local productivity growth.
3. Higher education market: a diagnosis approach
3.a) The ‘Supply’ of Higher Education
Table 1: Number of higher education institutions operating in Portugal
Table 2: Number of places available in higher education institutions in Portugal
1995/96 2008/09University 18 18Polytechnic 31 28Total 49 46University 42 41Polytechnic 57 58Total 99 99
Total 148 145
Private
Public
1995/96 2008/09University 20817 27013Polytechnic 13489 24068Total 34306 51081University 26161 24750Polytechnic 11125 13614Total 37286 38364
Total 71592 89445
Public
Private
Source: GPEARI.
As mentioned above, the higher education system in Portugal is complex and is
generally organized around either public or private institutions, university and
polytechnic that are located throughout the country. The provision of higher
education in Portugal consists in around one hundred and forty‐five institutions (Table
1), mostly private (68%), polytechnic schools being more numerous (59%) than
universities. However, from the point of view of the number of places available (Table
2), we found that most of them (57%) come from public higher education, the division
of availability between the university and polytechnic being almost even. Among the
private HEI’s, the majority of places (64%) is concentrated in universities. The data
above shows that the average size of institutions, measured by the average number of
places by institution, is higher in the case of public higher education (about 1110.5

7
places per establishment) when compared to the private subsystem (about 387.5
places per institution).
Figure 1: Evolution of the ratio of pupils per teacher in higher education in Portugal
Table 3: Number of teachers in higher education in Portugal
0
5
10
15
20
25
1981
1993
1994
1995
1996
1997
1998
2001
2002
2003
2004
2005
2006
2007
2008
1991 1995/96 2001 2008
Public University 12153 14 455 14 466
Polytechnic 3934 9 841 10 262
Total 14123 16087 24 296 24 728
Private University
7 518 6 519
Polytechnic 3 926 4 133
Total 2509
11 444 10 652
Total 16632
35 740 35 380
Source: [Figure 1: Pordata; Table 3: ICS (1999) and GPEARI]
The characteristics of the supply of higher education in Portugal can also be checked
in terms of one of the variables most crucial to their quality: the teachers involved and
the consequent number of students per teacher. From 1990 till today, we find that the
total number of teachers involved in higher education more than doubled (Table 3),
concerning now more than 35 000 individuals. This increase was more significant
within the of public education segment, which also concentrates the largest share of
the total. However, it is interesting to note (Figure 1) that the average number of
students per teacher, currently remains almost at the same level as the one recorded
in the early 80’s, just before the major change observed in this sub‐system.
Table 4: Evolution of supply (places available) by area of training, on higher education in Portugal
Source: GPEARI.
Area of training 2000-01 2008-09 Δ %
Education 9 656 3 709 -61,59
Arts and humanitHEI’s 8 374 9 677 15,56
Social sciences, business and law 27 973 29 335 4,87
Sciences, Mathematics and Computing 7 687 6 895 -10,30
Engineering, Manufacturing and Construction
16 260 16 526 1,64
Agriculture 1 920 1 274 -33,65
Health and Social Protection 7 634 15 010 96,62
Services 4 626 7 019 51,73
TOTAL 84 130 89 445 6,32

8
Currently, the training offered in higher education, in terms of the number of places
available for training area, focuses particularly on the field of social sciences,
engineering and health (Table 4). Throughout the period, it should be noted the
existence of significant changes in the structure of educational provision in higher
education, particularly arising from increasing supply in health, in parallel with the
decrease in agriculture and education. These amendments reflect the marked
response of HEIs to the needs of society, particularly the characteristics of the labor
market.
Given the particular the objectives of our study, the location of these institutions is
quite relevant. The geographic distribution of places available in HEI’s according to
their location in various Portuguese NUTS II (Table 5) shows the highest concentration
in the regions of Lisbon and the North. Furthermore, it is still relevant to note that
since the 1990s till today the prevalence of the Lisbon region was reduced, in favour of
the Center, the North and the Algarve. In order to display the territorial location of
HEI’s in our country one of the concerns of this 'exercise' relates to the existence (or
not) of an equilibrium between locations in the inner‐land and on the coast. For this
purpose, we distinguish 'artificially' coastal and inner‐land regions (Table 6). By
'coastline' we mean the area (NUTS III) which stretches from the Peninsula of Setúbal
to Viana do Castelo. All the rest of the mainland is classified as inner‐land.
Table 5: Evolution of available places in higher education
in Portugal, NUTS II
Table 6: Evolution of available places in higher
education in Portugal, for large geographic areas

9
N. (%) N. (%)North 22490 31,41 30348 33,93Center 12366 17,27 17941 20,06Lisbon 30361 42,41 32699 36,56Alentejo 3520 4,92 3901 4,36Algarve 1865 2,61 3145 3,52Azores 555 0,78 653 0,73Madeira 435 0,61 758 0,85Total 71592 89445
1995/96 2008/09 1995/96 2008/09Public 8985 13808Private 3075 3796Total 12060 17604Public 24506 36035Private 34036 34395Total 58542 70430Public 820 1238Private 170 173Total 990 1411
Total 71592 89445
Coast
Islands
Interior
Source: GPEARI.
When proceeding as describe above, we find a strong dominance of higher education
provision concentrated on the coast (about 79% of places available in the academic
year 2008/09). Public and private sectors behave, according to this criterion, very
differently: while in the inner‐land the places predominate in the public sub‐system
(78%), on the coast the distribution between public and private is quite even (the
public system only holds 51% of supply). Naturally, these features can only be linked
to how the population is distributed throughout the country, particularly the young
population in the age group entering higher education, but also the working
population, as we also know that this part of the population is mainly settled in
coastal regions north of the Peninsula of Setúbal.
3.b) The 'demand' for higher education
In the academic year 2008/09 tertiary education in Portugal had attained about
373000 students, which represents a value 4.5 times higher than the one recorded in
the late '70s and means 17% of the global set of Portuguese students (figure 2). This
reflects the strong change that higher education registered in the past 30 years, rising
to reach a wider pool of students, within which differences in terms of economic,
social and geographic origin started to emerge.
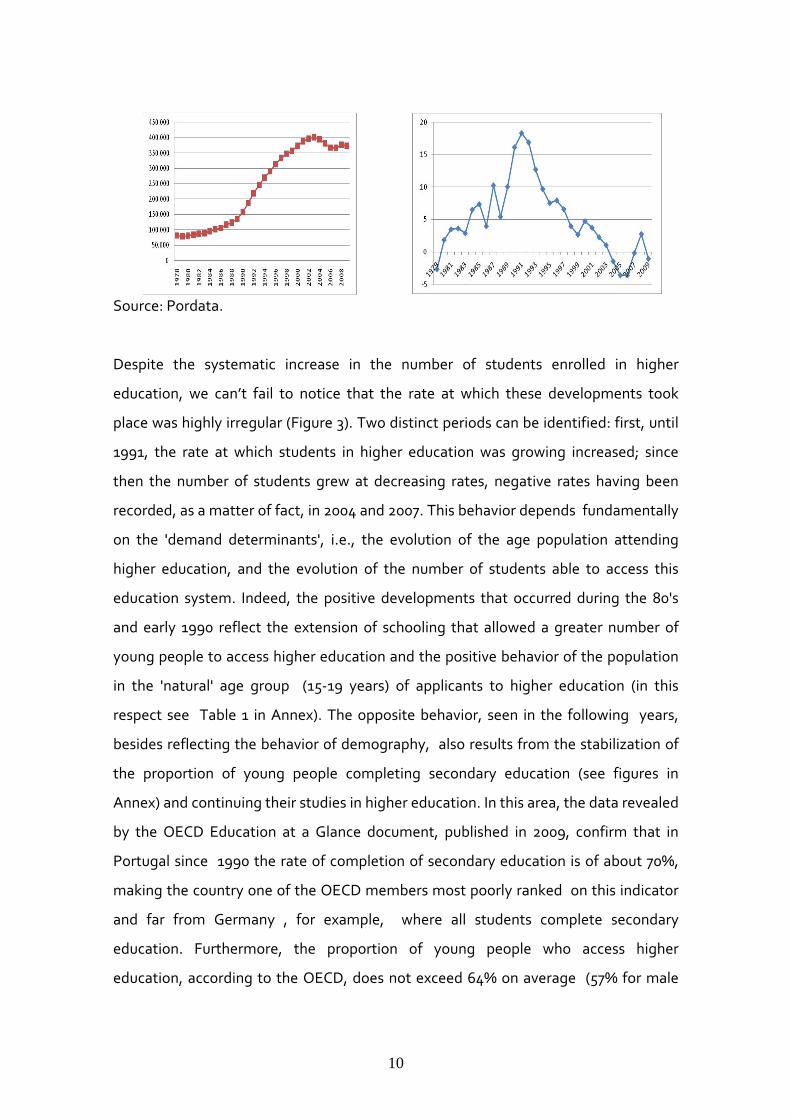
Figure 2: Number of students enrolled in higher education in Portugal
Figure 3: Evolution of the rate of growth in the number of students enrolled in higher education in Portugal
10
Source: Pordata.
Despite the systematic increase in the number of students enrolled in higher
education, we can’t fail to notice that the rate at which these developments took
place was highly irregular (Figure 3). Two distinct periods can be identified: first, until
1991, the rate at which students in higher education was growing increased; since
then the number of students grew at decreasing rates, negative rates having been
recorded, as a matter of fact, in 2004 and 2007. This behavior depends fundamentally
on the 'demand determinants', i.e., the evolution of the age population attending
higher education, and the evolution of the number of students able to access this
education system. Indeed, the positive developments that occurred during the 80's
and early 1990 reflect the extension of schooling that allowed a greater number of
young people to access higher education and the positive behavior of the population
in the 'natural' age group (15‐19 years) of applicants to higher education (in this
respect see Table 1 in Annex). The opposite behavior, seen in the following years,
besides reflecting the behavior of demography, also results from the stabilization of
the proportion of young people completing secondary education (see figures in
Annex) and continuing their studies in higher education. In this area, the data revealed
by the OECD Education at a Glance document, published in 2009, confirm that in
Portugal since 1990 the rate of completion of secondary education is of about 70%,
making the country one of the OECD members most poorly ranked on this indicator
and far from Germany , for example, where all students complete secondary
education. Furthermore, the proportion of young people who access higher
education, according to the OECD, does not exceed 64% on average (57% for male

11
and 72% for female). This factor has been, obviously, conditioning demand in higher
education.
Students who enrolled in higher education in Portugal do it mainly in public
institutions (Figure 4), whose evolution follow and reflect the behavior of students in
higher education. The private higher education institutions experienced a more
significant momentum during 1990, when this subsystem swiftly adapted to the
changing demand.
Figure 4: Evolution of students in higher education in Portugal, for public and private subsystem
Figure 5: Regional structure for students enrolled in higher education in Portugal in 2008/2009 academic
year
0
50000
100000
150000
200000
250000
300000
350000
400000
450000
1990
1991
1992
1993
1994
1995
1996
1997
1998
1999
2000
2001
2002
2003
2004
2005
2006
2007
2008
2009
Public Private Total
Source: Figure 4: Pordata; Figure 5: GPEARI.
Carrying on with the analysis in order to verify the geographic location of the
Portuguese higher education students, we have found (Figure 5) that, as recorded
with 'supply' the majority of students enrolled is concentrated in the Lisbon area and
soon , in the north (this behavior is identical to the variable on the first students
enrolled in higher education).
3.c) The higher education market
Before proceeding to data analysis, we propose a simple comparison between some
of the key variables to characterize the 'market' for higher education. Thus, by

12
comparing (figure 6), at NUTS II level, the places available (variable supply) with
students placed in the 1st year for the first time (variable demand), we conclude that,
with the exception of the North (where supply exceeds demand), there is a balance
between supply and demand in the 'market' for higher education. This is somehow
natural if we assume that demand moves freely to locations where it is known to be
available supply.
Figure 6: Comparison of some structural variables for the behavior of the 'market' for higher
education in Portugal
Legend: A: VacancHEI’s available for NUTS II (% of national total) B: Students placed for the 1st time in 1st year by NUTS II (% of national total) C: Residents in the age group of 15‐19 years, by NUTS II in 2008 (% of national total)
Source: GPEARI
In this study we intend to address the issue of the location of higher education, in
terms of territories and of the 'balance' in the whole country. In our comparison we
added the proportion of population in the age group to which candidates to
‘traditional’ higher education belong. Comparing the three variables in the analysis we
noticed the existence of two regions where the 'divergence' between the variable on
population and the variables on higher education is more manifest: the highest
proportion of population can be found in the North and in Lisbon the variables on
higher education exceed the population of the age group to which the candidates to
higher education belong. At first glance, and assuming that throughout the country,
i.e. for all NUTS II considered, the proportion of young people seeking higher
education does not display significant differences, we would be led to conclude from

13
figure 6, that, except for the Center, all other NUTS II and particularly the North, there
is a demand that apparently is attracted to the Lisbon region. However, a more careful
analysis of the data, which will be done in the next section, allows us to verify that it is
not the case.
For the time being, let us stick to establishing two hypothetical scenarios for the
determination of a (possible) equilibrium in the 'market' for higher education: first, we
consider that distance does not matter, in other words that for the applicants to
higher education distance between residence and the location of the HEI chosen for
their higher education is absolutely irrelevant at the moment of decision, and second,
we try to test the opposite hypothesis, i.e., only the distance matters in the decision,
meaning that candidates to higher education select schools located closest to the
residence of the household.
In the first case, assuming that candidates to higher education have no "sensitivity" to
distance, what matters is whether the number of places available in the various HEI’S
located on the national territory is sufficient to welcome all who those who apply. For
example, from data available through GPEARI we found that in 2009, as far as public
higher education is concerned, there were approximately 52,552 applications (first
choice) but only 45,295 students were placed. This imbalance in the "component" of
public higher education market opens the way for a private supply response to fill this
gap. In this reasoning we assume that all students interested in attending higher
education are trying to find a place in the public sub‐system, which is obviously not
true. Factors of various natures, such as proximity or economic and financial
availability, may lead students to look for a more pragmatic approach in order to
ensure entry into a higher education institution, which makes that only a few students
apply for private establishments as first choice.
Figure 7: Comparison between the proportions of population in age group 15‐19 years with the students enrolled in 1st year, for the 1st time, by NUTS III

14
Source: INE and GEAPRI.
The opposite case which we intend to verify concerns the hypothesis of distance be
the determining variable in the selection process of the school. In this case, we chose
to use as a geographic reference unit NUTS III. We conducted our comparison, within
the various NUTS III, between the proportion of individuals in the age group of 15‐19
years [weighted by the rate of further education to higher education (64%)] with the
proportion of students enrolled in higher education, in the 1st year for the first time in
institutions located in those territories. ur intention, here, is to verify the existence (or
not) of a balance between supply and demand in the various NUTS III (see figure 7).
Despite the fact that this analysis is still at a rough stage (particularly in that we use
the age group 17‐19 years, where he can truly leave the candidates to higher
education, unlike what we consider to use the group 15 ‐ 19 years) it already allows us
to confirm the ability of major universities in Lisbon, Porto and Coimbra to attract
students from other regions. In addition, we also found, without surprise, that where
the Universities of Évora (Alentejo Central NUTS), Beira Interior (Cova da Beira NUTS)
and Minho (Cávado NUTS) holds the attraction of students from other regions to
these regions.

15
In this approach we limited ourselves to consider as 'decisive' the demand for higher
education that comes from young people insecondary schools. However, higher
education today is being sought (and attended) by growing proportion of students in
working age, employees in general, who already have some professional experience,
and who go back to the first degree of higher education as a way to improve their
training and skills with the purpose of upgrading their professional qualification and
get progression in their careers.
4. The perspective of the multidimensional scaling analysis
4.1. Methodological considerations
Multidimensional scaling (MS) is a technique that allows performing the inverse
operation when determining the distance between points represented as coordinates
in a figure, such as a map (Kruskal & Wish, 1978; Cox & Cox, 1994; Borg & Groenen,
2005).
For example, it is obviously easy to calculate the distances between the municipalities
head towns, measured in terms of kilometers needed to travel from one place to
another. It is also possible to estimate, although results are more questionable, for
example, the distance in time that is needed to travel those routes. To put it simple,
what multidimensional scaling does is the inverse operation, i.e. to determine a
graphical representation (usually in two dimensions) that plausibly has generated
those distances, given that these may be different in nature, as the above examples
show. Thus, when the structure underlying the data generation process is complex,
MS thus provides a useful figure representation of data, insofar as, for example, allows
viewing, in the first place, how far/dissimilar are the "objects" and, secondly, to verify
which of them are similar, despite being relatively far apart, according to some
concept of distance (e.g., geographic).

16
In the application that follows the districts of mainland Portugal and the autonomous
regions of Azores and Madeira will be considered as the territorial unit. In general, the
first phase of MS consists on obtaining the di/similarity data, which is built on a
particular concept of distance (e.g. Euclidean) between "objects". Using this
information on di/similarity, in a second phase a solution (configuration) is obtained,
which is the location of objects in the space of a few dimensions (usually two or at
most three), where the distances between points in space are as close as possible as
the di/similarities between data.
4.2. Application of the methodology
Taking into account our objectives, we considered the data corresponding to the
national appliance to public higher education (in 2009) in terms of home versus
placement (for districts and autonomous regions) of the students that have applied to
the numerous public universities in Portugal.
Given the obvious differences in the population levels of the 20 geographical units in
question, we considered the data regarding the percentage of students (by
geographical unit of provenience).1 Figure 8 shows these rates.
Figure 8: The placement rates for the place of origin.
1 The data source is the Direcção Geral do Ensino Superior.

17
Figure 8 shows a pattern that clearly points to a preponderance of the district of origin
itself. Thus, retention rates ‐ visible in the main diagonal of Figure 8 ‐ show that only
the districts of Guarda, Santarém and Setúbal, most particularly the first one ‐ have
not displayed the highest rate of student placement in the district itself. Coimbra and
Lisbon are quite remarkable in this respect, with retention rates of about 79% while
attracting many students from multiple geographical origins.
The pattern shown in Figure 8 suggests that geographical distance is of crucial
importance. If true, one should try to understand the extent to which districts and
autonomous regions are distant in terms of student placement in public HEI’s. The
distances between the placement rates2 obtained by applying multidimensional
scaling are shown in Figure 9.3
2 The calculation of distances was based on a freely available add‐in for Excel http://www.cse.csiro.au/poptools/index.htm, while the methodology was applied using a Matlab routine. The multidimensional scaling technique could have been applied using the macro OOs Statistics (David Hitchcock) for the free OpenOffice program, available at http://sourceforge.net/project/showfiles.php?group_id=87718&package_id=106652, or the routine for the program R free, available at http://www.r‐project.org/ (see, for example, http://www.statmethods.net/advstats/mds.html) or yet). The use of this technique to the level of another free program, PSPSS, style SPSS, it is also possible (see http://www.gnu.org/software/pspp/). 3 It should be noted that the need for a convergence in the 'objective function' led to a decrease in the critical level of convergence.

18
Figure 9: The results of multidimensional scaling
In these results major universities, including Coimbra, Lisbon and Oporto, stand out ,
each of them in a particular way, by being located at the edge of in distinct quadrants.
5. Concluding remarks
This paper aimed at understanding the behavior of the higher education 'market'
education in Portugal. In it we have confirmed that HEI’s are scattered throughout the
territory, despite the pre‐eminence of the 'coastline', which concentrates the majority
of the population and of the economic activity. Consequently it is also the region
where the supply of higher education is concentrated.
In general, institutions located in the different regions examined here exert significant
attraction and influence on candidates living in the same region.
In examining the relationship between supply and demand for higher education, we
found that big universities such as those of Lisbon, Coimbra and Oporto exert
considerable attraction not only on young people living there but also on those living

19
elsewhere in the country. Likewise, more recently founded university centers, located
in medium‐sized cities such as Braga, Covilhã, and Évora, show some ability to attract
young students.
In summary, we found that, first, higher education students in Portugal are not
indifferent to distance when choosing the place to attend higher education and,
second, large and medium sized university centers also exert some attraction on
students from other locations. This is an expected outcome of the 'unbalances'
between supply and demand for higher education throughout the country.
References
BEESON, R.J.; & MONTGOMERY, E. (1993), “The effect of college and universities on
local labour markets”, Review of Economics & Statistics, 75 (4), 735‐761
BLEANEY, M.; BINKS, M.; GREENWAY, D.; REED, G.; & WHYNES, D. (1992), “What
does university add to its local economy?”, Applied Economics, 24, 305‐311.
BORG, Ingwer; e GROENEN, Patrick J.F. (2005), Modern Multidimensional Scaling:
Theory and Applications, 2.ª edição, New York: Springer.
BROWN R. H.; HEANEY, M.T. (1997), “A note on measuring the economic impact of
institutions of higher education”, Research in Higher Education, 38 (2), 229‐240.
CALEIRO, António (2010), "Como se pode distinguir Évora do resto do Alentejo?: Uma
abordagem de estatística espacial", MPRA Paper 22057, University Library of Munich,
(http://mpra.ub.uni‐muenchen.de/22057/1/MPRA_paper_22057.pdf)

20
CHEVALIER, Arnaud; HARMON, Colm P.; WALKER, Ian & ZHU, Yu (2004), " Does
Education Raise Productivity, or Just Reflect it?", The Economic Journal, 114 (499),
November, 499‐517.
CHRISTOPHERSON, Susan; CLARK, Jennifer (2010), “Limits to ‘The learning region’:
what university‐centered economic development can (and cannot) do to create
knowledge‐based regional economHEI’s”, Local Economy, 25 (2), March, 120‐130.
COM (2003), “The role of the universities’s in the Europe of knowledge”,
COMMUNICATION FROM THE COMMISSION, COMMISSION OF THE EUROPEAN
COMMUNITHEI’S, COM (2003) 58 final, Brussels, 05.02.2003.
COX, Trevor F.; & COX, Michael A.A. (1994), Multidimensional Scaling, London:
Chapman & Hall.
De GAUDEMAR, J.P. (1996), “The higher education institutions as a regional actor:
some introductory thoughts”, Centre for Educational Research and Innovation –
Thirteenth General Conference IMHE Member Institutions, Sept., Paris, OCDE.
DRUCKER, J.; GODSTEIN, H. (2007), “Assessing the regional economic development
impacts of universitHEI’s: a review of current approaches”, International Regional
Science Review, 30 (1), January, 20‐46.
GODDARD, J. (1997), “Managing the university regional interface“, Higher Education
Management, 9(3), 7‐27.
GODDARD, J. (1998), “Contribuition au développement national et regional“,
UNESCO, Conférence mondiale sur l’enseignement supérieur, Paris.

21
GODDARD, J.; & CHATTERTON, P. (2001), “The response of HEIs to regional needs“,
Congresso Universidades y Desarrollo Territorial en la sociedad del conocimiento,
Barcelona, 12‐14 Novembro.
H. GOLDSTEIN, H; & RENAULT, C. (2004), “Contributions of Universities to Regional
Economic Development: A Quasi‐Experimental Approach,” Regional Studies, 38,.733‐
746.
GUERREIRO, Gertrudes; & CALEIRO, António (2005), “Quão Distantes Estão as
Regiões Portuguesas? Uma aplicação de escalonamento multidimensional”, Revista
Portuguesa de Estudos Regionais, 8, 1.º Quadrimestre, 47‐59.
KRUSKAL, Joseph B.; e WISH, Myron (1978), Multidimensional Scaling, Newberry Park
CA: Sage.
LUNDVALL, B.A.; e JOHNSON, B. (1994), “The learning economy”, Journal of Industry
StudHEI’s, I (2), 23‐42.
MAILLAT, D.; & KÉBIR, L. (1998), “Learning region, milieu innovateur et
apprentissages collectives”, in Le Paradigme de Milieu Innovateur dans l’économie
spatial contemporaine, Paris, GREMI.
OECD (1999), Les établissements d’énseignement supérieur face aux bésoins
régionaux, Paris, OCDE.
OECD (1998), L’investissement dans le capital human, une comparaison international,
Centre pour la Recherche et l’Innovation dans l’Enseignement, Paris, OECD.
OECD (1997), Éducation et équité dans les pays de l’OCDE, Paris, OECD.

22
REGO, Conceição & Caleiro, António (2003), "Impactes das Instituições de Ensino
Superior no Território: Estudo do caso da Universidade de Évora," Economics Working
Papers 2_2003, University of Évora, Department of Economics (Portugal)
(http://www.decon.uevora.pt/content/download/5837/26010/file/2003_02.pdf)
REGO, Conceição; & CALEIRO, António (2009), “Acerca dos impactes da Universidade
de Évora no seu meio envolvente”, Anales de Economia Aplicada, XXIII, Economía
Urbana, Regional y Local, 1‐11/.
REGO, Conceição; & CALEIRO, António (2010), “On the spatial diffusion of knowledge
by universitHEI’s located in small and medium sized towns”, iBusiness, 2 (2), June.
Documents and statistics on higher education:
• Docentes no ensino superior 2001 a 2008, disponível em
http://www.gpeari.mctes.pt/?idc=172&idt=154, acedido em 10 de Abril de 2010.
• ICS (1999), A situação social em Portugal 1960‐1999, Org: António Barreto, Lisboa, ICS.
• OCDE (2009), Education at a Glance, Paris, OCDE.
• http://www.pordata.pt/azap_runtime/, acedido entre 7 e 19 de Maio de 2010.
• Vagas e inscritos no ensino superior [2000‐2001 a 2008‐2009], disponível em
http://www.gpeari.mctes.pt/?idc=47&idi=455228, acedido em 10 de Abril de 2010.
1. Annexes
Table 1

23
Evolution of Resident Population in Portugal
2008 2001 1991 1981 1971Total 10622412,50 10292999 9967878 9851325 86437550 - 4 years 532802 537913,50 549105 778592 783325,505 - 9 years 555874 530491,50 638885,50 861849 854957,5010 - 14 years 537245,50 572012,50 772777,50 853320 826379,5015 - 19 years 578997,50 670634,50 853446,50 863463,50 756722
Evolution of the growth rate of resident population in Portugal
2008/01 2001/1991 1991/1981 1981/1971
Total 3,20 3,26 1,18
13,9 0 - 4 years -0,95 -2,04 -29,47 -0,60 5 - 9 years 4,78 -16,97 -25,87 0,81 10 - 14 years -6,08 -25,98 -9,44 3,26 15 - 19 years -13,66 -21,42 -1,16 14,11
Source: INE; own calculations.
Source: OECD, 2009; Legend:

24
Source: OECD, 2009.
Source: OECD, 2009