
High-throughput proteomic analysis of FFPE tissue samples ... · 77 Chen Chen: [email protected]...
42
Zhu, Guo, Weiss, et al. Proteomics of FFPE samples for tumor stratification Page 1 / 42 High-throughput proteomic analysis of FFPE tissue samples facilitates tumor stratification 1 2 Yi Zhu 1,2,3 *,Tobias Weiss 4 *, Qiushi Zhang 1,2 , Rui Sun 1,2 , Bo Wang 5 , Zhicheng Wu 1,2 , Qing 3 Zhong 6,7 , Xiao Yi 1,2 , Huanhuan Gao 1,2 , Xue Cai 1,2 , Guan Ruan 1,2 , Tiansheng Zhu 1,2 , Chao Xu 4 8 , Sai Lou 9 , Xiaoyan Yu 10 , Ludovic Gillet 3 , Peter Blattmann 3 , Karim Saba 11 , Christian D. 5 Fankhauser 11 , Michael B. Schmid 11 , Dorothea Rutishauser 6 , Jelena Ljubicic 6 , Ailsa 6 Christiansen 6 , Christine Fritz 6 , Niels J. Rupp 6 , Cedric Poyet 11 , Elisabeth Rushing 12 , Michael 7 Weller 4 , Patrick Roth 4 , Eugenia Haralambieva 6 , Silvia Hofer 13 , Chen Chen 14 , Wolfram 8 Jochum 15 , Xiaofei Gao 1,2 , Xiaodong Teng 5 , Lirong Chen 10 , Peter J. Wild 6,16# , Ruedi 9 Aebersold 3,17# , Tiannan Guo 1,2,3 # 10 11 1, Key Laboratory of Structural Biology of Zhejiang Province, School of Life Sciences, Westlake 12 University, 18 Shilongshan Road, Hangzhou 310024, Zhejiang Province, China 13 2, Institute of Basic Medical Sciences, Westlake Institute for Advanced Study, 18 Shilongshan Road, 14 Hangzhou 310024, Zhejiang Province, China 15 3, Department of Biology, Institute of Molecular Systems Biology, ETH Zurich, Switzerland 16 4, Department of Neurology and Brain Tumor Center, University Hospital Zurich, University of 17 Zurich, Switzerland 18 5, Department of Pathology, The First Affiliated Hospital of College of Medicine, Zhejiang 19 University, Hangzhou, China 20 6, Department of Pathology and Molecular Pathology, University Hospital Zurich, University of 21 Zurich, Zurich, Switzerland 22 7, Children's Medical Research Institute, University of Sydney, Sydney, New South Wales, 23 Australia 24 8, College of Mathematics and Informatics, Digital Fujian Institute of Big Data Security 25 Technology, Fujian Normal University, Fuzhou, China 26 9, Phase I Clinical Research Center, Zhejiang Provincial People's Hospital, Hangzhou, Zhejiang, 27 China 28 10, Department of Pathology, The Second Affiliated Hospital of College of Medicine, Zhejiang 29 University, Hangzhou, China 30 . CC-BY-NC-ND 4.0 International license certified by peer review) is the author/funder. It is made available under a The copyright holder for this preprint (which was not this version posted June 11, 2019. . https://doi.org/10.1101/667394 doi: bioRxiv preprint
Transcript of High-throughput proteomic analysis of FFPE tissue samples ... · 77 Chen Chen: [email protected]...
Zhu,Guo,Weiss,etal.ProteomicsofFFPEsamplesfortumorstratificationPage1/42
High-throughput proteomic analysis of FFPE tissue samples facilitates tumor stratification 1
2
Yi Zhu 1,2,3*,Tobias Weiss 4*, Qiushi Zhang 1,2, Rui Sun 1,2, Bo Wang 5, Zhicheng Wu 1,2, Qing 3
Zhong 6,7, Xiao Yi 1,2 , Huanhuan Gao 1,2, Xue Cai 1,2, Guan Ruan 1,2, Tiansheng Zhu 1,2, Chao Xu 4 8, Sai Lou 9, Xiaoyan Yu 10, Ludovic Gillet 3, Peter Blattmann 3, Karim Saba 11, Christian D. 5
Fankhauser 11, Michael B. Schmid 11, Dorothea Rutishauser 6, Jelena Ljubicic 6, Ailsa 6
Christiansen 6, Christine Fritz 6, Niels J. Rupp 6, Cedric Poyet 11, Elisabeth Rushing 12, Michael 7
Weller 4, Patrick Roth 4, Eugenia Haralambieva 6, Silvia Hofer 13, Chen Chen 14, Wolfram 8
Jochum 15, Xiaofei Gao 1,2, Xiaodong Teng 5, Lirong Chen 10, Peter J. Wild 6,16#, Ruedi 9
Aebersold 3,17# , Tiannan Guo 1,2,3 # 10
11
1, Key Laboratory of Structural Biology of Zhejiang Province, School of Life Sciences, Westlake 12 University, 18 Shilongshan Road, Hangzhou 310024, Zhejiang Province, China 13
2, Institute of Basic Medical Sciences, Westlake Institute for Advanced Study, 18 Shilongshan Road, 14 Hangzhou 310024, Zhejiang Province, China 15 3, Department of Biology, Institute of Molecular Systems Biology, ETH Zurich, Switzerland 16
4, Department of Neurology and Brain Tumor Center, University Hospital Zurich, University of 17
Zurich, Switzerland 18
5, Department of Pathology, The First Affiliated Hospital of College of Medicine, Zhejiang 19
University, Hangzhou, China 20
6, Department of Pathology and Molecular Pathology, University Hospital Zurich, University of 21
Zurich, Zurich, Switzerland 22
7, Children's Medical Research Institute, University of Sydney, Sydney, New South Wales, 23
Australia 24
8, College of Mathematics and Informatics, Digital Fujian Institute of Big Data Security 25
Technology, Fujian Normal University, Fuzhou, China 26
9, Phase I Clinical Research Center, Zhejiang Provincial People's Hospital, Hangzhou, Zhejiang, 27
China 28
10, Department of Pathology, The Second Affiliated Hospital of College of Medicine, Zhejiang 29
University, Hangzhou, China 30
.CC-BY-NC-ND 4.0 International licensecertified by peer review) is the author/funder. It is made available under aThe copyright holder for this preprint (which was notthis version posted June 11, 2019. . https://doi.org/10.1101/667394doi: bioRxiv preprint

Zhu,Guo,Weiss,etal.ProteomicsofFFPEsamplesfortumorstratificationPage2/42
11, Department of Urology, University Hospital Zurich, University of Zurich, Zurich, 31
Switzerland 32
12, Department of Neuropathology, University Hospital Zurich, University of Zurich, Zurich, 33
Switzerland 34
13, Division of Medical Oncology, Lucerne Cantonal Hospital and Cancer Center, 6000 Lucerne, 35
Switzerland 36
14, Sciex, Shanghai, China 37
15, Institute of Pathology, Cantonal Hospital St. Gallen, St. Gallen, Switzerland 38
16, Dr. Senckenberg Institute of Pathology, University Hospital Frankfurt, Frankfurt am Main, 39
Germany 40
17, Faculty of Science, University of Zurich, Zurich, Switzerland 41
* Equal contribution 42
# Correspondence 43
44
Emails: 45
Yi Zhu: [email protected] 46
Tobias Weiss: [email protected] 47
Qiushi Zhang: [email protected] 48
Rui Sun: [email protected] 49
Bo Wang: [email protected] 50
Zhicheng Wu: [email protected] 51
Qing Zhong: [email protected] 52
Xiao Yi: [email protected] 53
Huanhuan Gao: [email protected] 54
Xue Cai: [email protected] 55
Guan Ruan: [email protected] 56
Tiansheng Zhu: [email protected] 57
Chao Xu: [email protected] 58
Sai Lou: [email protected] 59
Xiaoyan Yu: [email protected] 60
Ludovic Gillet: [email protected] 61
.CC-BY-NC-ND 4.0 International licensecertified by peer review) is the author/funder. It is made available under aThe copyright holder for this preprint (which was notthis version posted June 11, 2019. . https://doi.org/10.1101/667394doi: bioRxiv preprint

Zhu,Guo,Weiss,etal.ProteomicsofFFPEsamplesfortumorstratificationPage3/42
Peter Blattmann: [email protected] 62
Karim Saba: [email protected] 63
Christian D. Fankhauser: [email protected] 64
Michael B. Schmid: [email protected] 65
Dorothea Rutishauser: [email protected] 66
Jelena Ljubicic: [email protected] 67
Ailsa Christiansen: [email protected] 68
Christine Fritz: [email protected] 69
Niels J. Rupp: [email protected] 70
Cedric Poyet: [email protected] 71
Elisabeth Rushing: [email protected] 72
Michael Weller: [email protected] 73
Patrick Roth: [email protected] 74
Eugenia Haralambieva: [email protected] 75
Silvia Hofer: [email protected] 76
Chen Chen: [email protected] 77
Wolfram Jochum: [email protected] 78
Xiaofei Gao: [email protected] 79
Xiaodong Teng: [email protected] 80
Lirong Chen: [email protected] 81
Peter J. Wild: [email protected] 82
Ruedi Aebersold: [email protected] 83
Tiannan Guo: [email protected] 84 85
86
.CC-BY-NC-ND 4.0 International licensecertified by peer review) is the author/funder. It is made available under aThe copyright holder for this preprint (which was notthis version posted June 11, 2019. . https://doi.org/10.1101/667394doi: bioRxiv preprint
Zhu,Guo,Weiss,etal.ProteomicsofFFPEsamplesfortumorstratificationPage4/42
Abstract 87
Formalin-fixed, paraffin-embedded (FFPE), biobanked tissue samples offer an invaluable 88
resource for clinical and biomarker research. Here we developed a pressure cycling technology 89
(PCT)-SWATH mass spectrometry workflow to analyze FFPE tissue proteomes and applied it to 90
the stratification of prostate cancer (PCa) and diffuse large B-cell lymphoma (DLBCL) samples. 91
We show that the proteome patterns of FFPE PCa tissue samples and their analogous fresh 92
frozen (FF) counterparts have a high degree of similarity and we confirmed multiple proteins 93
consistently regulated in PCa tissues in an independent sample cohort. We further demonstrate 94
temporal stability of proteome patterns from FFPE samples that were stored between one to 15 95
years in a biobank and show a high degree of the proteome pattern similarity between two types 96
histological region of small FFPE samples, i.e. punched tissue biopsies and thin tissue sections of 97
micrometer thickness, despite the existence of certain degree of biological variations. Applying 98
the method to two independent DLBCL cohorts we identified myeloperoxidase (MPO), a 99
peroxidase enzyme, as a novel prognostic marker. In summary, this study presents a robust 100
proteomic method to analyze bulk and biopsy FFPE tissues and reports the first systematic 101
comparison of proteome maps generated from FFPE and FF samples. Our data demonstrate the 102
practicality and superiority of FFPE over FF samples for proteome in biomarker discovery. 103
Promising biomarker candidates for PCa and DLBCL have been discovered. 104
105
.CC-BY-NC-ND 4.0 International licensecertified by peer review) is the author/funder. It is made available under aThe copyright holder for this preprint (which was notthis version posted June 11, 2019. . https://doi.org/10.1101/667394doi: bioRxiv preprint

Zhu,Guo,Weiss,etal.ProteomicsofFFPEsamplesfortumorstratificationPage5/42
Introduction 106
Quantitative molecular profiling of phenotypically well annotated clinical sample cohorts 107
using genomic, transcriptomic or metabolomic techniques, followed by the statistical association 108
of molecular and phenotypic data has been a powerful approach for the development of 109
biomarkers, guiding classification, stratification and therapy, particularly with regard to cancer 110
patients 1,2. With the increasing robustness, accuracy and throughput of molecular profiling 111
techniques, the need for large, well-annotated sample cohorts has been accentuated over the last 112
few years. 113
The history of FFPE samples dates back to 1893 3. Most human tissue specimens 114
archived in hospitals for diagnostic purposes are FFPE blocks which have been shown to be 115
stable over time and are usually associated with rich clinical and phenotypic data, including 116
histology, diagnosis, treatment history and response, and outcome. For fresh or rapidly frozen 117
tissue samples such meta data are less frequently available and concerns about molecular 118
stability over time have been raised 4,5. FFPE samples have been globally used for DNA, RNA, 119
protein and morphological measurements, and preanalytical factors affecting each type of 120
measurement have been identified 6. Besides, various techniques and evaluation studies have 121
been reported for genomic 7,8, transcriptomic 9,10, proteomic and protein 11-14 from FFPE samples. 122
The preparation of FFPE samples depends on the exposure of the tissue to a range of 123
chemical reactions and conditions. During fixation, formaldehyde reacts with proteins or 124
peptides to form unstable methylol adducts (specified by a C-O bond) which further partially 125
dehydrate to yield active intermediate Schiff bases. These intermediate products subsequently 126
react with basic and aromatic amino acids to form stable and irreversible methylene bridge cross-127
links (specified by a C-N bond) 14,15, thus modifying the sample proteins. Protein analysis of 128
FFPE tissues using antibodies started in 1991 with the development of the heat-induced antigen 129
retrieval (HIAR) technique for immunohistochemistry (IHC) 16. HIAR is based on the notion that 130
heating may unmask epitopes by hydrolysis of methylene cross-links, thus enhancing 131
immunoreactivity. Consequently, the measurement of specific proteins by HIAR has become 132
widely used for diagnostic and prognostic biomarker testing, particularly in cancers 17. To extend 133
the analysis of proteins to a proteomic scale, a number of different methods have been used to 134
retrieve proteins from FFPE samples for mass spectrometric analysis 12,18-24. They include high 135
pressure 23 or pressure cycling technology 24 and the available methods have been recently 136
.CC-BY-NC-ND 4.0 International licensecertified by peer review) is the author/funder. It is made available under aThe copyright holder for this preprint (which was notthis version posted June 11, 2019. . https://doi.org/10.1101/667394doi: bioRxiv preprint

Zhu,Guo,Weiss,etal.ProteomicsofFFPEsamplesfortumorstratificationPage6/42
reviewed 13,14. These studies have shown that FFPE samples can, in principle, be analyzed by 137
mass spectrometry based proteomic methods. However, the proteome maps of FFPE tissues and 138
their analogue FF tissues from clinical cohorts and their respective stability over time have not 139
been rigorously assessed. The concern remains that FFPE samples may harbor greater variation 140
in protein quality than FF samples due to formalin-induced chemical modifications 25. 141
Multiple factors might have contributed to these limitations. First, the generation of 142
clinically meaningful results requires the consistent analysis of sizable sample cohorts. Second, 143
reproducible sample preparation and mass spectrometric analysis that are essential for clinical 144
studies have been difficult to achieve. Few if any published studies on FFPE proteomic analyses 145
have ever attempted to repeat analysis on clinical specimens of a cohort due to the complexity 146
and high cost of the adopted proteomics techniques 26-28. Third, the ability to analyze a 147
histological region of small FFPE samples remains challenging. Most published studies analyzed 148
tissue micrometer sections with each tissue containing multiple histological types 26,29,30. Laser 149
capture microdissection has been used to analyze multiple regions of a tissue section; however, 150
experimental complexities preclude application to large-scale analysis. Targeted needle punches 151
from a FFPE tissue block represent a reasonable compromise; however, efficient extraction of 152
proteins from such a small needle biopsy and further proteolytic digestion of the proteins into 153
peptides for mass spectrometric analysis has not been reported yet. Finally, although methods are 154
available to analyze proteins from human and animal FFPE samples 12, concerns remain whether 155
the thus extracted proteins reliably reflect their actual abundance pattern in the fresh frozen 156
counterpart and ultimately, fresh samples 25. 157
In this report we re-visited and optimized the acidic and alkaline hydrolysis procedures 158
developed in 1947 31 which are compatible with a detergent-free protocol to recover proteins 159
from small (0.5×0.5×3mm) FFPE tissue punches in a form that is directly compatible with in 160
solution digestion within an hour. The thus treated tissue samples can be directly processed by 161
the PCT method to generate mass spectrometry-ready peptide samples within a few hours 32-35. 162
We further investigated whether the thus acquired FFPE proteome map is comparable to its 163
counterpart FF proteome map in prostate tissue samples by applying this workflow to identify 164
promising diagnostic protein biomarkers for PCa patients. We found that the two types of 165
patterns were highly similar and identified strongly overlapping sets of proteins that showed 166
different levels of expression in benign and tumor tissue. Subsequently, the effect of factors such 167
.CC-BY-NC-ND 4.0 International licensecertified by peer review) is the author/funder. It is made available under aThe copyright holder for this preprint (which was notthis version posted June 11, 2019. . https://doi.org/10.1101/667394doi: bioRxiv preprint

Zhu,Guo,Weiss,etal.ProteomicsofFFPEsamplesfortumorstratificationPage7/42
as storage time and FFPE tissue forms to the proteome was further evaluated. There is no 168
significant difference among FFPE proteome patterns with different storage time, while tissue 169
sections were separated from punched tissue biopsies based on principal component analysis 170
(PCA). 171
Further, a panel of 12 proteins showing great potential for PCa diagnosis was 172
characterized in an independent Chinese prostate cohort and was validated in the Swiss cohort in 173
this study as well as in other two recently reported PCa studies 36,37 . As a second application, the 174
FFPE PCT-SWATH workflow was employed to identify prognostic biomarkers for DLBCL 175
patients, employing the relevant archived FFPE tissues. MPO was identified as a promising 176
novel prognostic candidate for DLBCL. 177
.CC-BY-NC-ND 4.0 International licensecertified by peer review) is the author/funder. It is made available under aThe copyright holder for this preprint (which was notthis version posted June 11, 2019. . https://doi.org/10.1101/667394doi: bioRxiv preprint
Zhu,Guo,Weiss,etal.ProteomicsofFFPEsamplesfortumorstratificationPage8/42
Results 178
Establishment of a FFPE PCT-SWATH workflow 179
We integrated a workflow for the generation of proteome map from FFPE tissue samples 180
in a robust and high-throughput manner. In addition, we showed that the proteome map derived 181
from FFPE samples correlate well with corresponding maps generated from their analogous FF 182
samples, and that the same biomarker panel can be identified from both sample types, even if the 183
samples have been stored for 4-8 years in their respective format. The de-crosslinking of FFPE 184
tissue is based on acidic and alkaline hydrolysis which was developed in 1947 31, 38 but has not 185
been reported in proteomics research applications yet. Here we integrated the classical de-186
crosslinking method with PCT-assisted protein extraction and digestion, and SWATH-MS 32,39 187
method to establish a detergent free FFPE PCT-SWATH workflow. To achieve the desired 188
overall performance profile, protocols for the chemical extraction of proteins from FFPE tissue, 189
liquid chromatography (LC), SWATH-MS, and data analysis were optimized and integrated. 190
Chemical extraction of proteins from FFPE tissue punches. A detergent-free and fast 191
hydrolysis protocol for preparing MS-ready peptides from FFPE tissue punch samples 192
mimicking needle biopsies (width < 1mm, length ~2-3mm; dry mass weight about 300~400µg) 193
(Fig. 1a) was optimized. The method consists of i) an acidic hydrolysis step (0.1% formic acid) 194
to achieve C-O hydrolysis of protein methylol products (Fig. 1b), ii) a step of heat and base 195
induced hydrolysis to reverse the C-N methylene crosslinks (Fig. 1b, 1c) and iii) extraction and 196
digestion of proteins from the thus pre-treated punches by PCT (Fig. 1c). The FFPE tissue 197
biopsies used for the protocol establishment were from a sample pool of 48 replicate tissue 198
biopsies extracted from a resected prostate of the ProCOC cohort 40,41. We optimized the acidic 199
and alkaline hydrolysis steps by varying the respective treatment times. Acidic hydrolysis was 200
achieved concurrent with the complete rehydration of FFPE tissue punches by replacing water 201
with 0.1% formic acid. Preliminary UV-spectroscopy results showed that the release of methylol 202
groups began saturated in 30 min. As to the alkaline hydrolysis, the effects of the different tested 203
conditions were evaluated by determining the peptide yield as well as the number and type of 204
peptides and proteins identified from each sample by SWATH-MS (Fig. 1d and Fig. 1e). At this 205
step, 30 min boiling of the FFPE punch with 0.1 M Tris-HCl (pH 10.0) at 95°C led to the highest 206
peptide yield with the greatest number of identified peptides. As shown in Fig. 1f, we generated 207
on average of about 60 µg peptide mass per milligram FFPE tissue sample (dry mass with wax). 208
.CC-BY-NC-ND 4.0 International licensecertified by peer review) is the author/funder. It is made available under aThe copyright holder for this preprint (which was notthis version posted June 11, 2019. . https://doi.org/10.1101/667394doi: bioRxiv preprint

Zhu,Guo,Weiss,etal.ProteomicsofFFPEsamplesfortumorstratificationPage9/42
The yield was comparable to our previous investigations of fresh frozen tissues (wet tissue) 209 32,33,42,43. 210
Figure 1 211
212 Figure 1. FFPE PCT-SWATH protocol and performance. (a) Prostate FFPE tissue in a punch. (b) Acid, 213 base and heat treatment to reverse crosslinks. (c) Schematic protocol of FFPE PCT-SWATH. (d) Peptide yield 214 per milligram FFPE tissue with different Tris-HCl (pH 10.0) boiling time. (e) Number of peptides identified by 215 the peptides prepared with different Tris-HCl boiling time. (f) Yield of peptides from 48 prostate tissue 216 samples. 217 218
Optimization of LC and SWATH-MS. We assessed the combined effects of LC gradient 219
length (30 min, 45 min and 60 min) and SWATH window configuration (eight configurations, 220
.CC-BY-NC-ND 4.0 International licensecertified by peer review) is the author/funder. It is made available under aThe copyright holder for this preprint (which was notthis version posted June 11, 2019. . https://doi.org/10.1101/667394doi: bioRxiv preprint

Zhu,Guo,Weiss,etal.ProteomicsofFFPEsamplesfortumorstratificationPage10/42
ranging from 20 to 93 variable windows) on sample throughput, proteome depth and 221
reproducibility. Each window scheme assessed was based on equal segmentation of precursor 222
ion signals over the entire mass range. The peptides used for the optimization of LC and 223
SWATH settings were randomly selected from 9 peptide samples obtained from FFPE tissues 224
processed with the 30 min alkaline hydrolysis protocol described above (Fig. 1e). Altogether, we 225
compared 24 LC-SWATH conditions in duplicate (Supplementary Fig. 1a-1c). The results 226
showed that 48 variable SWATH windows achieved the highest number of peptide and protein 227
identifications. We observed a trade-off between the gradient length and proteome coverage. The 228
30 min LC gradient resulted in a 19% lower number of peptide identifications and 8% fewer 229
protein identifications, compared to the 60 min LC gradient (Supplementary Fig. 1b and 230
Supplementary Fig. 1c). 231
232
Comparison of FFPE and FF tissue proteome maps 233
To investigate whether the obtained FFPE proteome maps were comparable to their FF 234
counterparts, we performed proteomic analyses of corresponding FFPE and FF counterpart tissue 235
samples of 24 PCa patients with radical prostatectomy from the ProCOC cohort 40,41. Sections of 236
tissue samples from the same resected prostates have been stored for four to eight years in the 237
form of FFPE or FF, respectively, prior to proteomic analysis (Fig. 2a, Supplementary Table 1). 238
Only the index tumor with the highest Gleason score and the largest diameter was selected for 239
analysis. For non-tumorous tissue, benign prostatic tissue with minimal stromal component was 240
chosen. 241
With respect to FFPE tissues, three replicate punches were processed via the FFPE PCT-242
SWATH workflow for each sample and combined for PCT-SWATH analysis. The size of each 243
tissue biopsy was around 0.6×0.6×3mm, weighing approximately 300µg including wax. In total, 244
approximately 900µg of dry mass weight was available per FFPE sample. For the FF cohort, one 245
tissue punch of approximately 1mm3 size and wet weight of about 800µg per sample was 246
processed by PCT-SWATH. Altogether, 48 FFPE tissue samples (benign and tumor) were 247
processed into peptide samples that were analyzed by SWATH-MS in technical duplicates. Fig. 248
1f shows that the samples produced on average about 60µg injection-ready peptide mass per 249
milligram of tissue sample. The yield is consistent with previous reports for FF tissues 32,33,42. 250
The CV values of peptide yield were 49% and 65% for benign and tumorous tissues respectively, 251
.CC-BY-NC-ND 4.0 International licensecertified by peer review) is the author/funder. It is made available under aThe copyright holder for this preprint (which was notthis version posted June 11, 2019. . https://doi.org/10.1101/667394doi: bioRxiv preprint

Zhu,Guo,Weiss,etal.ProteomicsofFFPEsamplesfortumorstratificationPage11/42
slightly higher than the corresponding figures reported previously for FF tissues 33,42. The 252
difference in peptide yield is likely caused by inaccurate estimation of FFPE tissue weight due to 253
variable wax content and the heterogeneity of human prostate tissues. 254
The setting of 30 min LC integrated with 48 variable SWATH windows was adopted for 255
protein measurement to compare FFPE and FF tissue proteome maps in this study. Two technical 256
replicates for each tissue digest were analyzed using SWATH-MS, referred to in the following as 257
PCF dataset. The resulting SWATH-MS data from all 96 FFPE and FF samples were compared 258
by their total ion current and the number and type of peptides as well as proteins that could be 259
identified and quantified. 260
We first compared the raw ion intensity signals over chromatographic time (total ion 261
chromatogram, TIC) at both the MS1 and MS2 levels. We found that the TIC, normalized for 262
total injected peptide mass, was on average 15% higher for FF than for FFPE samples 263
(Supplementary Fig. 2). The observed small discrepancy of normalized MS1 intensity values is 264
likely due to incomplete acidic and alkaline hydrolysis of cross-links, resulting in the generation 265
of partially hydrolyzed methylene bridges, which contribute to the absorbance in the range from 266
260-280nm on the spectroscopy. The modification by formalin could also lead to ion suppression. 267
The root cause for lower specific TIC was not further investigated because the effect was minor 268
and the contour of the TIC for FF and FFPE samples were very similar, suggesting that 269
comparable peptide populations were generated from both sample types (Supplementary Fig. 2). 270
Next, we used the SWATH-MS fragment ion maps to compare the number and type of 271
peptides and proteins that could be identified from FF and FFPE samples, and their respective 272
quantities. We used the OpenSWATH 44 software tool and a spectral library built from prostate 273
tissue, consisting of 70,981 peptide precursors from 6,686 SwissProt proteins, to search the 274
acquired fragment ion maps. Altogether, we obtained quantitative data for 3,030 SwissProt 275
proteins inferred from 18,129 proteotypic peptides. The median technical CV analyses were 14.9% 276
and 17.5% for FF and FFPE samples, respectively. Overall median CV was 16.2% (Fig. 2b, 277
Supplementary Fig. 3). We further compared the overall proteomic variation for different tissue 278
types including benign and tumorous FFPE versus FF samples, and found no significant 279
discrepancy (Supplementary Fig. 4). We then compared the peptide precursors and proteins 280
detected in each paired FFPE and FF sample (Supplementary Fig. 5) and found that peptides as 281
well as proteins were consistently quantified in both tissue types with relatively high Pearson 282
.CC-BY-NC-ND 4.0 International licensecertified by peer review) is the author/funder. It is made available under aThe copyright holder for this preprint (which was notthis version posted June 11, 2019. . https://doi.org/10.1101/667394doi: bioRxiv preprint

Zhu,Guo,Weiss,etal.ProteomicsofFFPEsamplesfortumorstratificationPage12/42
correlation. The overall correlation between FFPE and FF samples reached a Pearson correlation 283
of 0.91 (Fig. 2c) with a median normalization of the data based on protein abundance. With 284
unsupervised clustering, the proteome map from FFPE samples was mixed with FF samples 285
(Supplementary Fig. 6a), further supporting the notion that the data generated from FFPE 286
samples are comparable with those of FF samples. Curated MS signals by the viewer function of 287
the DIA-expert software for a representative peptide which was quantified across all 224 288
SWATH runs are shown in Supplementary Fig. 6b. We further compared the raw signals, 289
quantity of peptide precursors and proteins in samples stored for different periods of time and 290
observed no significant impact of storage time (Supplementary Fig. 7). 291
Overall the data show that a highly consistent and significant fraction of the whole 292
proteome, consisting of 3,030 SwissProt proteins, could be reproducibly identified from 293
equivalent FF and FFPE samples, even after 8 years storage. Furthermore, the quantitative 294
information generated from matched FFPE and FF sample pairs were comparable. 295
296
Figure 2 297
.CC-BY-NC-ND 4.0 International licensecertified by peer review) is the author/funder. It is made available under aThe copyright holder for this preprint (which was notthis version posted June 11, 2019. . https://doi.org/10.1101/667394doi: bioRxiv preprint

Zhu,Guo,Weiss,etal.ProteomicsofFFPEsamplesfortumorstratificationPage13/42
298
.CC-BY-NC-ND 4.0 International licensecertified by peer review) is the author/funder. It is made available under aThe copyright holder for this preprint (which was notthis version posted June 11, 2019. . https://doi.org/10.1101/667394doi: bioRxiv preprint
Zhu,Guo,Weiss,etal.ProteomicsofFFPEsamplesfortumorstratificationPage14/42
Figure 2. Comparison of FF and FFPE tissues in a patient cohort. (a) Benign and tumorous samples were 299 punched from prostate tissue stored since resection as FF and FFPE. The hematoxylin & eosin staining of FF 300 and FFPE tissue from Patient No. 2 in the ProCOC cohort is shown here. AL, anterior left; AR, anterior right, 301 PL, posterior left; PR, posterior right. (b) Overall technical CV of FFPE and FF samples at peptide level. (c) 302 Comparison of median protein abundance in FF (x-axis) versus FFPE (y-axis) samples. Each dot denotes one 303 protein identified in this sample cohort. Volcano plots show proteins with significant abundance difference 304 between tumor and benign tissue in FFPE (d) and FF (e) samples from the PCF data set. Proteins showing an 305 abundance difference of fold change (FC) ≥2 and with P value ≤ 0.05 between groups were considered 306 significant. Boxplots and Kaplan-Meier plots show expression of AGR2 (f) and POSTN (g) in benign and 307 tumorous FF and FFPE samples. (h) TMAs of FFPE samples matching those analyzed by mass spectrometry 308 were constructed and stained with an antibody against POSTN. The intensity of stromal POSTN 309 immunoreactivity was scored semi-quantitatively by assigning four scores (0, 1+, 2+ ,3+) to each sample. 310 Graphs depict examples of stromal staining. Diameter of each tissue core was 0.6mm. (i) Comparison of 311 POSTN expression as measured by immunohistochemistry, and the results from PCT-SWATH in FF and 312 FFPE samples. Statistically significant differences between groups were calculated using two-sided Student t 313 test. (j) Kaplan–Meier biochemical recurrence-free survival plots of prostatectomy patients stratified by 314 stromal POSTN immunoreactivity in PCa. (k) POSTN staining of a TMA. 315 316
Systematic evaluation of the effect of FFPE tissue storage format and duration on 317
proteome maps 318
We next evaluated the robustness of proteome maps obtained from FFPE tissue stored in 319
different formats and for different periods of time. We procured FFPE tissue samples from three 320
BPH patients from China (termed as ‘PCZC’ cohort). For each patient, we collected both tissue 321
sections (5 µm thickness) and punched tissue biopsies (1×1×0.5 mm). For each sample format 322
we analyzed three biological replicates. The samples had been archived for different periods of 323
time, specifically for 1 year, 5 years, 10 years and 15 years, respectively. Altogether, 72 tissue 324
samples were processed, and 72 SWATH files were acquired with a 90 min LC gradient in a 325
TripleTOF 5600+ mass spectrometer coupled to an Eksigent micro-flow system. 326
We reproducibly quantified 3,040 SwissProt proteins in both tissue punches and sections 327
in this data set. By comparing the protein abundance distribution of these common proteins, we 328
found that the proteome maps of the two FFPE formats showed a high degree of similarity, with 329
a Pearson correlation coefficient of 0.95 (Fig. 3a). The mean Pearson correlation coefficient of 330
all 72 samples among their own biological replicates was 0.858, showing that the samples were 331
.CC-BY-NC-ND 4.0 International licensecertified by peer review) is the author/funder. It is made available under aThe copyright holder for this preprint (which was notthis version posted June 11, 2019. . https://doi.org/10.1101/667394doi: bioRxiv preprint
Zhu,Guo,Weiss,etal.ProteomicsofFFPEsamplesfortumorstratificationPage15/42
of high similarity at the whole proteome level (Fig. 3b). Unsupervised cluster analysis of all 332
3,040 proteins also showed consistent distribution of protein abundance among all 72 samples 333
(Fig. 3c). We further grouped the 72 samples into eight groups according to sample format and 334
storage time, and investigated the biological variation of nine samples (three patients, each with 335
three biological replicates) in each group. The average CV slightly varied between tissue 336
micrometer sections and punches across the time span of 15 years (Fig. 3d). Further, tissue 337
micrometer sections were found to be different from punches (Fig. 3e), probably due to that fact 338
that tissue micrometer sections cover more diverse tissue regions and therefore contain higher 339
degree of the spatial heterogeneity 43. However, these differences only affected a small portion of 340
proteins. The duration of FFPE storage did not impact on our proteomic measurement, further 341
reinforcing the stability of FFPE proteome and the robustness of our protocol (Fig. 3f). 342
343
Figure 3 344
.CC-BY-NC-ND 4.0 International licensecertified by peer review) is the author/funder. It is made available under aThe copyright holder for this preprint (which was notthis version posted June 11, 2019. . https://doi.org/10.1101/667394doi: bioRxiv preprint

Zhu,Guo,Weiss,etal.ProteomicsofFFPEsamplesfortumorstratificationPage16/42
345 346 Figure 3. Evaluation of FFPE tissue storage forms and duration. (a) Pearson correlation of protein 347 abundance between FFPE micrometer sections and punches. (b) Average Pearson correlation coefficient of all 348 72 samples among three biological replicates. The ‘pairwise.complete.obs’ method was employed to calculate 349 the COR value to avoid the influence of NA. (c) The protein abundance distribution of all 3,040 SwissProt 350 proteins across all 72 samples with different tissue types and storage time. (d) CV plots for each sample type 351 (section/punch) with different storage time (1 yr, 5 yrs, 10 yrs and 15 yrs). (e) PCA analysis of the effect of 352 tissue types. (f) PCA analysis of the effect of storage time. 353 354
Identification of a subset of proteins with comparable abundance patterns in prostate 355
FFPE and FF punches 356
.CC-BY-NC-ND 4.0 International licensecertified by peer review) is the author/funder. It is made available under aThe copyright holder for this preprint (which was notthis version posted June 11, 2019. . https://doi.org/10.1101/667394doi: bioRxiv preprint

Zhu,Guo,Weiss,etal.ProteomicsofFFPEsamplesfortumorstratificationPage17/42
Next, we asked whether proteins distinguishing benign and tumorous prostate tissue 357
could be consistently detected in both FFPE and FF samples. We observed differential 358
expression of multiple proteins between benign and tumorous tissues in both FFPE and FF 359
samples in the PCF cohort. 360
We first determined proteins that were significantly differentially regulated between the 361
FF tumor and benign samples. We computed the median fold-change of tumor-to-benign tissue 362
samples and the P values for each protein in the 24 patients for FF tissue samples. By setting a 363
fold-change (FC) cutoff of 2 and a P value cutoff at 0.05, only three proteins were significantly 364
up-regulated in tumor compared to benign tissue. These were Q15063 (POSTN), O95994 (AGR2) 365
and Q9BUD6 (SPON2). Remarkably, these three proteins are all promising biomarker 366
candidates. POSTN is an extracellular matrix protein involved in cell development and adhesion. 367
We have previously reported its upregulation in high grade and advanced stage PCa patients 45, 368
which is consistent with an independent report of its positive prognostic value in PCa46, and with 369
a study of its positive correlation with the aggressiveness of PCa 47. AGR2 is a secreted 370
adenocarcinoma-associated antigen. The mRNA level of AGR2 was found higher in cancerous 371
tissue in 42 paired PCa samples, but it was not associated with survival in the cohort 48. In 372
addition, the protein expression level of AGR2 was found increased in cancerous tissue in 31 out 373
of 58 PCa cases by IHC immunolabeling 48, a result that was consistent with two independent 374
cohorts 49. In this study, the expression of AGR2 was found to be about four times higher in 375
tumor compared to benign tissue and, remarkably, it’s abundance level positively correlated with 376
survival (P = 0.008). SPON2 is a secreted extracellular matrix protein. In a previous study, it was 377
detected as an abundant protein in serum samples of 286 PCa patients compared to 68 healthy 378
controls 50. In particular, it was found with significantly higher expression levels in PCa patients 379
with a Gleason score of 7-8 and in PCa patients with metastases 50,51. In our FF data set, SPON2 380
was found to be expressed 2-4 times higher in malignant compared to corresponding benign 381
tissue samples. 382
We then analyzed the SWATH data acquired for FFPE samples in the same way and 383
found 24 proteins with significantly different abundance between tumor and benign groups. The 384
results from the FFPE cohort recapitulated the pattern of the three proteins with increased tumor 385
abundance identified in the FF cohort. The consistency of the detected changes for these 386
proteins is remarkable given the intra-tumor heterogeneity, expected differences between the 387
.CC-BY-NC-ND 4.0 International licensecertified by peer review) is the author/funder. It is made available under aThe copyright holder for this preprint (which was notthis version posted June 11, 2019. . https://doi.org/10.1101/667394doi: bioRxiv preprint
Zhu,Guo,Weiss,etal.ProteomicsofFFPEsamplesfortumorstratificationPage18/42
FFPE and FF proteomes and the fact that the FFPE and FF samples were from different regions 388
of the tumors. In addition to these three proteins, a further eight proteins were detected at 389
increased abundance in FFPE tumor compared to benign tissue and thirteen proteins were 390
detected at lower abundance in the tumor vs. benign samples (Fig. 1d). 391
To verify whether the findings from our SWATH data set of ProCOC 40 patients are 392
consistent with IHC reports, we analyzed a tissue microarray from 18 patients which were also 393
part of the cohort analyzed by PCT-SWATH. Representative staining images of POSTN are 394
shown in Fig. 2h. We scored the staining patterns into four grades (0, 1+, 2+, and 3+), and 395
compared the results with the SWATH signals of the corresponding FF and FFPE samples. We 396
analyzed the statistical significance by pair-wise comparison of groups using Students’ t-test, and 397
single factor ANOVA (Fig. 2i, Supplementary Table 2). We did not observe any significant 398
difference between the data from FF samples and from FFPE at the level of the mass 399
spectrometry data. Remarkably, the ANOVA analyses revealed significant correlation between 400
IHC and both FF (P value 3.3×10⁻⁶) and FFPE (P value 6.7×10⁻⁵) SWATH data. Taken together, 401
via the IHC results an orthogonal technique confirmed the similarity of POSTN abundance 402
patterns of POSTN detected in FFPE and FF samples by mass spectrometry. Nevertheless, the 403
difference among the IHC groups 0, 1+ and 2+ appeared mostly insignificant at the SWATH 404
level. The prognostic role of POSTN was further confirmed in the survival analysis based on the 405
TMA data (Fig. 2j). In an independent Swiss TMA cohort, we also observed significantly higher 406
abundance of POSTN (P value < 0.001 by Fisher’s exact test, Fig. 2k) in tumor vs, benign tissue. 407
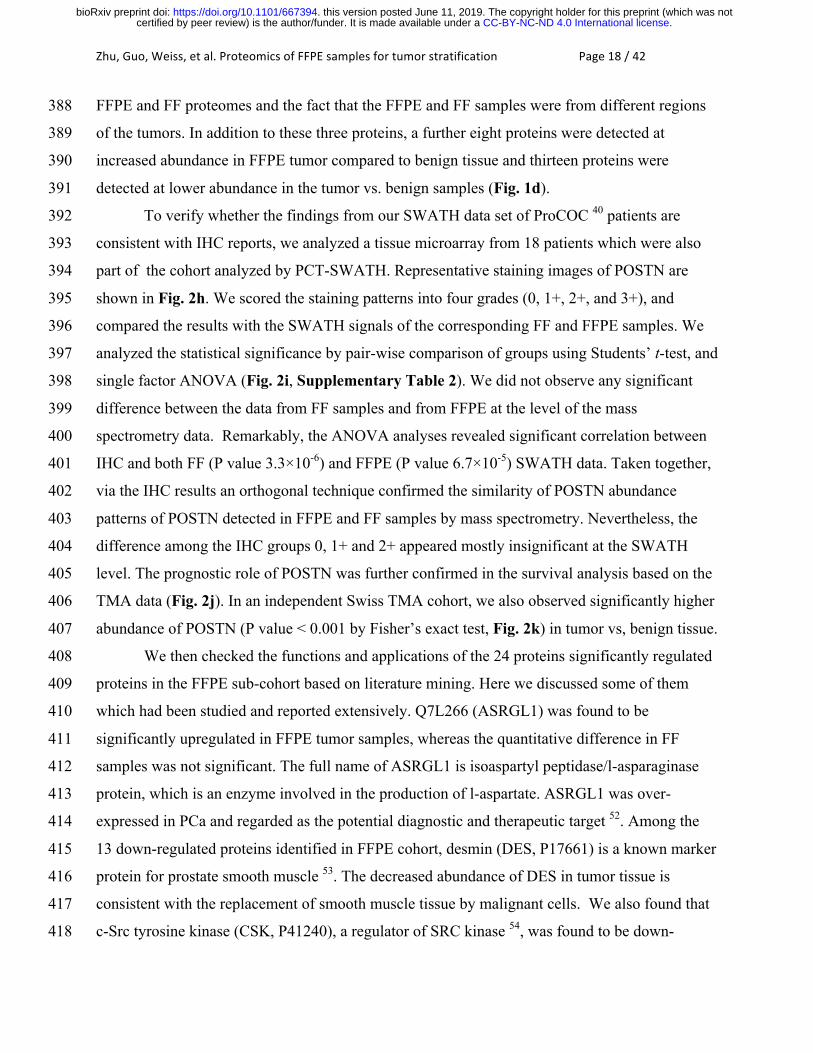
We then checked the functions and applications of the 24 proteins significantly regulated 408
proteins in the FFPE sub-cohort based on literature mining. Here we discussed some of them 409
which had been studied and reported extensively. Q7L266 (ASRGL1) was found to be 410
significantly upregulated in FFPE tumor samples, whereas the quantitative difference in FF 411
samples was not significant. The full name of ASRGL1 is isoaspartyl peptidase/l-asparaginase 412
protein, which is an enzyme involved in the production of l-aspartate. ASRGL1 was over-413
expressed in PCa and regarded as the potential diagnostic and therapeutic target 52. Among the 414
13 down-regulated proteins identified in FFPE cohort, desmin (DES, P17661) is a known marker 415
protein for prostate smooth muscle 53. The decreased abundance of DES in tumor tissue is 416
consistent with the replacement of smooth muscle tissue by malignant cells. We also found that 417
c-Src tyrosine kinase (CSK, P41240), a regulator of SRC kinase 54, was found to be down-418
.CC-BY-NC-ND 4.0 International licensecertified by peer review) is the author/funder. It is made available under aThe copyright holder for this preprint (which was notthis version posted June 11, 2019. . https://doi.org/10.1101/667394doi: bioRxiv preprint

Zhu,Guo,Weiss,etal.ProteomicsofFFPEsamplesfortumorstratificationPage19/42
regulated in tumor tissue. With respect to decorin (DCN, P07585), a proteoglycan in the tumor 419
microenvironment, our data for the first time report its down-regulation in association with PCa 420
prognosis. This observation is in line with a previous mouse-based functional study reporting 421
that DCN specifically inhibits EGFR and AR phosphorylation, leading to suppressed AR nuclear 422
translocation and inhibition of PSA production 55. While most protein changes were detected in 423
both tissue types, the FFPE samples exposed the protein regulation with better statistical power 424
(Fig. 2). POSTN was detected to be significantly upregulated in both FF and FFPE tumor 425
samples in this cohort. CSK and DCN were only significant in the FFPE cohort, indicating the 426
FFPE proteomes analyzed by our method are more robust. 427
Furthermore, by integrating the seven proteins (POSTN, AGR2, SPON2, ASRGL1, DES, 428
CSK, and DCN) discussed above, we achieved an AUC of 0.983 for FF samples and 0.977 for 429
FFPE samples, respectively (Fig. 4a) for the separation of tumor and benign tissue. Our data 430
again demonstrated the consistency of FFPE and FF proteome maps acquired by the PCT-431
SWATH workflow and the ability to identify differentially abundant proteins from either sample 432
type. Further, the data shows that the observed abundance differences were attenuated in in FF 433
samples compared to their FFPE counterparts. This could be due to gradual protein degradation 434
during long-term storage in the frozen state. 435
436
Figure 4 437
.CC-BY-NC-ND 4.0 International licensecertified by peer review) is the author/funder. It is made available under aThe copyright holder for this preprint (which was notthis version posted June 11, 2019. . https://doi.org/10.1101/667394doi: bioRxiv preprint
Zhu,Guo,Weiss,etal.ProteomicsofFFPEsamplesfortumorstratificationPage20/42
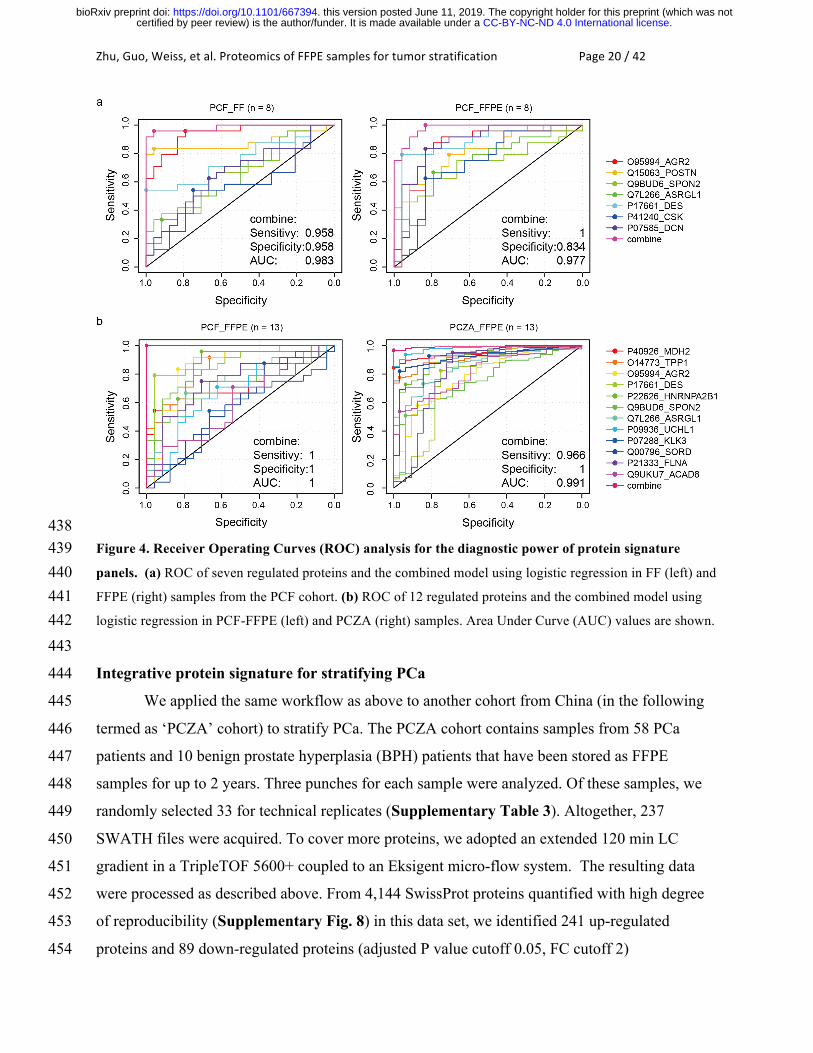
438 Figure 4. Receiver Operating Curves (ROC) analysis for the diagnostic power of protein signature 439 panels. (a) ROC of seven regulated proteins and the combined model using logistic regression in FF (left) and 440 FFPE (right) samples from the PCF cohort. (b) ROC of 12 regulated proteins and the combined model using 441 logistic regression in PCF-FFPE (left) and PCZA (right) samples. Area Under Curve (AUC) values are shown. 442 443
Integrative protein signature for stratifying PCa 444
We applied the same workflow as above to another cohort from China (in the following 445
termed as ‘PCZA’ cohort) to stratify PCa. The PCZA cohort contains samples from 58 PCa 446
patients and 10 benign prostate hyperplasia (BPH) patients that have been stored as FFPE 447
samples for up to 2 years. Three punches for each sample were analyzed. Of these samples, we 448
randomly selected 33 for technical replicates (Supplementary Table 3). Altogether, 237 449
SWATH files were acquired. To cover more proteins, we adopted an extended 120 min LC 450
gradient in a TripleTOF 5600+ coupled to an Eksigent micro-flow system. The resulting data 451
were processed as described above. From 4,144 SwissProt proteins quantified with high degree 452
of reproducibility (Supplementary Fig. 8) in this data set, we identified 241 up-regulated 453
proteins and 89 down-regulated proteins (adjusted P value cutoff 0.05, FC cutoff 2) 454
.CC-BY-NC-ND 4.0 International licensecertified by peer review) is the author/funder. It is made available under aThe copyright holder for this preprint (which was notthis version posted June 11, 2019. . https://doi.org/10.1101/667394doi: bioRxiv preprint

Zhu,Guo,Weiss,etal.ProteomicsofFFPEsamplesfortumorstratificationPage21/42
(Supplementary Table 3, Supplementary Fig. 8). We performed ingenuity pathway analysis 455
(IPA) 56 of these significantly regulated proteins between PCa and BPH groups and found that 456
five top upstream regulator pathways were enriched from these proteins (Supplementary Table 457
4). MYCN, MYC, TCR regulator pathways were activated while sirolimus and 5-fluorouracil 458
regulator pathways were inhibited (Supplementary Table 4). 16 cellular networks were 459
enriched from these proteins via IPA analysis (Supplementary Table 4). 460
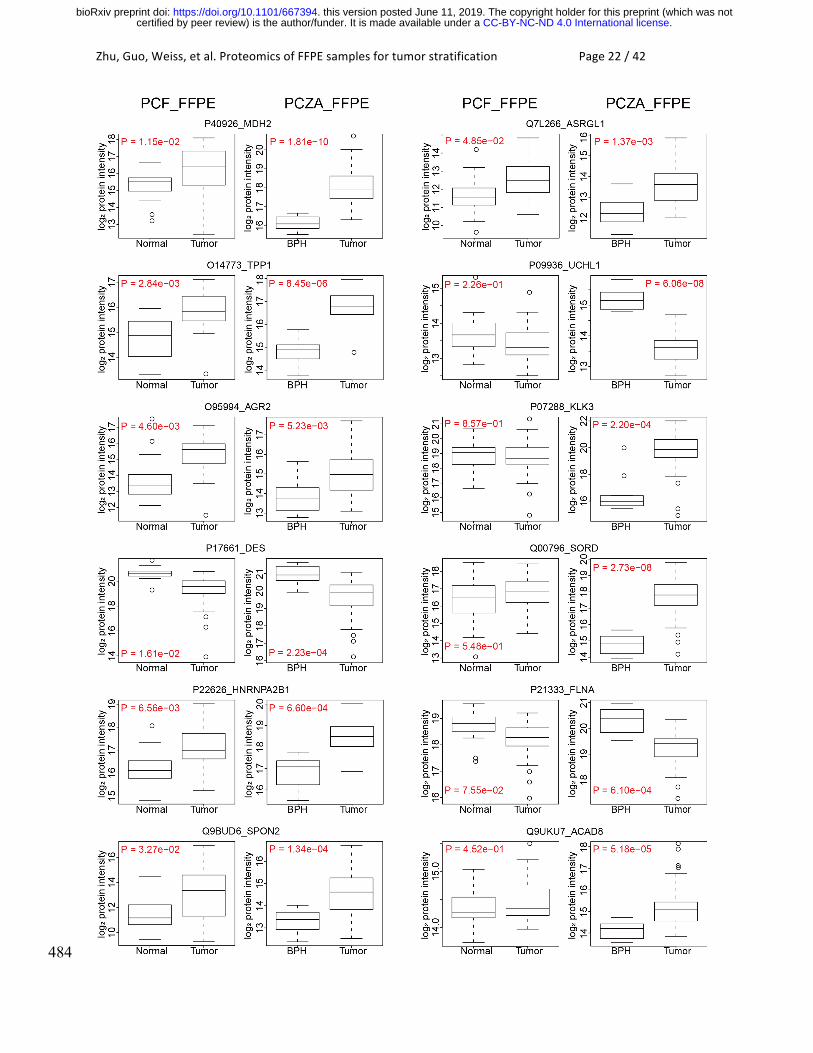
PCZA and PCF datasets shared seven common regulated proteins in prostate tumor 461
tissues, which are O14773 (TPP1), O95994 (AGR2), P22626 (HNRNPA2B1), P40926 (MDH2), 462
Q9BUD6 (SPON2), P17661 (DES), Q7L266 (ASRGL1), as shown in Fig. 4b. Besides, other 463
significantly regulated proteins, including P07288 (KLK3), Q00796 (SORD), P21333 (FLNA), 464
P09936 (UCHL1), and Q9UKU7 (ACAD8), were also identified to show diverse functions by 465
IPA analysis (Fig. 4b, Supplementary Table 4). These proteins were enriched in nine networks 466
by IPA analysis, as shown in Supplementary Fig. 9. The relative abundance of these proteins in 467
both cohorts was calculated and the regulation pattern of them in two cohorts was consistent with 468
each other, as was shown in Fig. 5. The regulation of these proteins between tumor and benign 469
tissues was much more significant in PCZA cohort as was demonstrated by P values. PCZA 470
consists two groups of 58 PCa patients and 10 BPH patients, while PCF contains the 471
tumor/benign pair of tissue from 24 PCa patients. 3,030 proteins were quantified from PCF 472
cohort by the 30 min LC plus 48-variable-window scheme from 224 Swath files in Zurich, while 473
4,144 proteins were quantified in PCZA cohort by the 120 min LC plus 48-variable-window 474
scheme from 237 Swath files in Hangzhou, both using AB Sciex TripleTOF 5600+. The two 475
cohorts shared 2846 proteins in common, accounting for 93.9% of the PCF whole proteome. 476
Then we calculated the Pearson correlation of PCF and PCZA FFPE tumor proteomes with the r 477
value 0.514, reflecting the existence of certain degree of biological variations between the Swiss 478
and Chinese cohorts (Supplementary Fig. 8). By loosening the threshold for significantly 479
regulated proteins in PCF cohort, more proteins would be distinguished out to be deregulated 480
between tumor and benign conditions, as was shown in Fig. 5. 481
482
Figure 5 483
.CC-BY-NC-ND 4.0 International licensecertified by peer review) is the author/funder. It is made available under aThe copyright holder for this preprint (which was notthis version posted June 11, 2019. . https://doi.org/10.1101/667394doi: bioRxiv preprint
Zhu,Guo,Weiss,etal.ProteomicsofFFPEsamplesfortumorstratificationPage22/42
484
.CC-BY-NC-ND 4.0 International licensecertified by peer review) is the author/funder. It is made available under aThe copyright holder for this preprint (which was notthis version posted June 11, 2019. . https://doi.org/10.1101/667394doi: bioRxiv preprint

Zhu,Guo,Weiss,etal.ProteomicsofFFPEsamplesfortumorstratificationPage23/42
Figure 5. Relative abundance of the twelve proteins in paired normal and tumor prostate samples in 485 PCF cohort and BPH/tumor samples in PCZA cohort, respectively. FLNA, UCHL1, and DES were 486 downregulated in tumor tissues, while others were upregulated. 487 488
KLK3 is the prostate-specific antigen (PSA), a serum marker for PCa. Sorbitol 489
dehydrogenase (SORD) converts sorbitol to fructose. SORD is part of the polyol pathway that 490
plays an important role in sperm motility. SORD is regulated by androgens in the human prostate, 491
and reported to be positively associated with Gleason scoring and serum PSA concentrations 57. 492
Our data show that both KLK3 and SORD were significantly overexpressed in PCa tissues. Both 493
Filamin-A(FLNA) and -B (FLNB) were proposed as protein panel signatures for diagnosis of 494
PCa 58,59. FLNA was found to be downregulated in PCa tissues. UCHL1 is a ubiquitin-protein 495
hydrolase involved in the processing of ubiquitin precursors. Our data show significant 496
suppression of UCHL1 in tumor tissues, in agreement with a previous report, further 497
consolidating its value in PCa biology60. 498
Tripeptidyl-peptidase 1 (TPP1) was found to be upregulated. TPP1 is a primary protector 499
of telomere DNA and has been reported to be an effective anticancer target for about 90% of 500
human tumors that are telomerase-positive 61. Heterogeneous nuclear ribonucleoproteins 501
(HNRNPs) associate with nascent pre-mRNAs, and package them into HNRNP particles in a 502
sequence-dependent way. HNRNP particles serve to condense and stabilize the transcripts and 503
minimize tangling and knotting. The splicing factor HNRNPA1 has been reported to contribute 504
to enzalutamide resistance by promoting AR-V7 62. In this study, HNRNPA2B1 was found to be 505
a novel upregulated protein probably modulating splicing in PCa cells. Malate dehydrogenase 2 506
(MDH2) was also up-regulated in prostate tumor tissues in both PCF and PCZA cohort in this 507
study. MDH2 is a mitochondrial enzyme that catalyzes the NAD/NADH-dependent, reversible 508
oxidation of malate to oxaloacetate. Interestingly, a very recent report on integrative proteomics 509
in PCa uncovers two metabolic shifts in the citric acid cycle (TCA cycle) during PCa 510
development and progression, among which MDH2 is a component. Increased MDH2 511
expression in PCa correlated with an increase in mRNA levels, and it is further upregulated in 512
CRPC samples 36. Together, these data suggest that development of MDH2 inhibition could be of 513
great benefit against progressed PCa. Besides, ACAD8, the acyl-CoA dehydrogenase family 514
member 8, was detected to be upregulated in tumor tissues in this study. It has been reported to 515
be a potential prognosis biomarker indicating the outcome of prostate tumors 63. 516
.CC-BY-NC-ND 4.0 International licensecertified by peer review) is the author/funder. It is made available under aThe copyright holder for this preprint (which was notthis version posted June 11, 2019. . https://doi.org/10.1101/667394doi: bioRxiv preprint
Zhu,Guo,Weiss,etal.ProteomicsofFFPEsamplesfortumorstratificationPage24/42
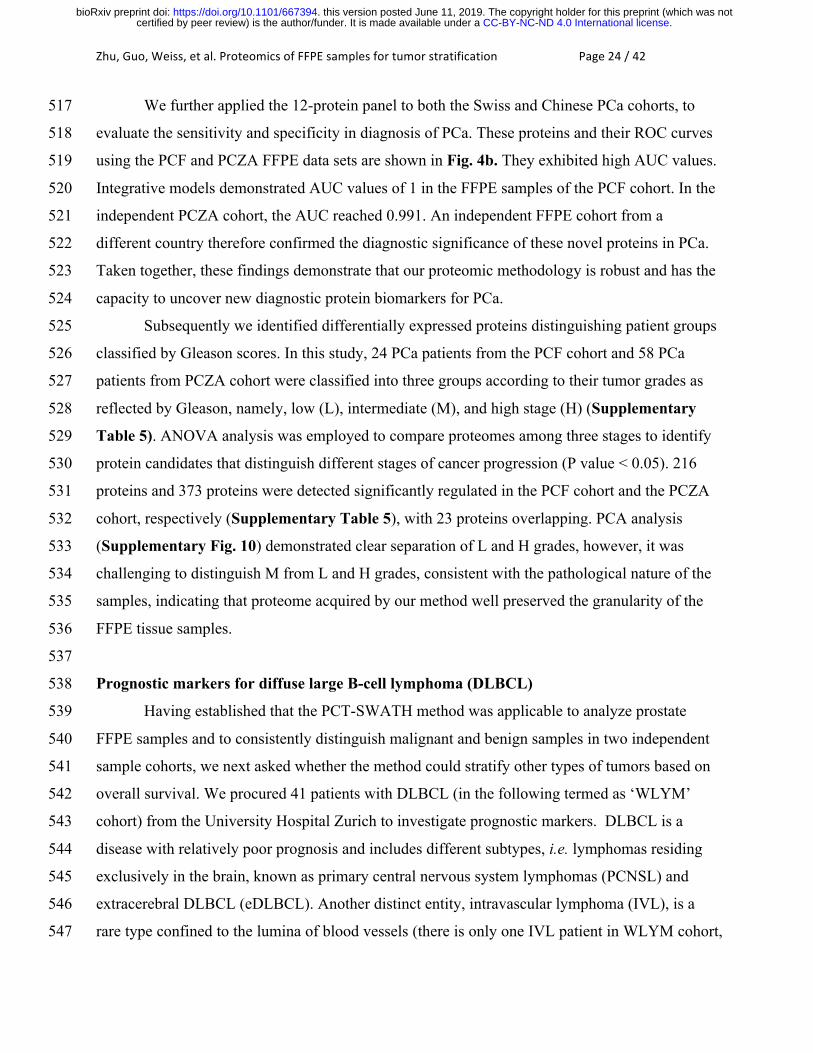
We further applied the 12-protein panel to both the Swiss and Chinese PCa cohorts, to 517
evaluate the sensitivity and specificity in diagnosis of PCa. These proteins and their ROC curves 518
using the PCF and PCZA FFPE data sets are shown in Fig. 4b. They exhibited high AUC values. 519
Integrative models demonstrated AUC values of 1 in the FFPE samples of the PCF cohort. In the 520
independent PCZA cohort, the AUC reached 0.991. An independent FFPE cohort from a 521
different country therefore confirmed the diagnostic significance of these novel proteins in PCa. 522
Taken together, these findings demonstrate that our proteomic methodology is robust and has the 523
capacity to uncover new diagnostic protein biomarkers for PCa. 524
Subsequently we identified differentially expressed proteins distinguishing patient groups 525
classified by Gleason scores. In this study, 24 PCa patients from the PCF cohort and 58 PCa 526
patients from PCZA cohort were classified into three groups according to their tumor grades as 527
reflected by Gleason, namely, low (L), intermediate (M), and high stage (H) (Supplementary 528
Table 5). ANOVA analysis was employed to compare proteomes among three stages to identify 529
protein candidates that distinguish different stages of cancer progression (P value < 0.05). 216 530
proteins and 373 proteins were detected significantly regulated in the PCF cohort and the PCZA 531
cohort, respectively (Supplementary Table 5), with 23 proteins overlapping. PCA analysis 532
(Supplementary Fig. 10) demonstrated clear separation of L and H grades, however, it was 533
challenging to distinguish M from L and H grades, consistent with the pathological nature of the 534
samples, indicating that proteome acquired by our method well preserved the granularity of the 535
FFPE tissue samples. 536
537
Prognostic markers for diffuse large B-cell lymphoma (DLBCL) 538
Having established that the PCT-SWATH method was applicable to analyze prostate 539
FFPE samples and to consistently distinguish malignant and benign samples in two independent 540
sample cohorts, we next asked whether the method could stratify other types of tumors based on 541
overall survival. We procured 41 patients with DLBCL (in the following termed as ‘WLYM’ 542
cohort) from the University Hospital Zurich to investigate prognostic markers. DLBCL is a 543
disease with relatively poor prognosis and includes different subtypes, i.e. lymphomas residing 544
exclusively in the brain, known as primary central nervous system lymphomas (PCNSL) and 545
extracerebral DLBCL (eDLBCL). Another distinct entity, intravascular lymphoma (IVL), is a 546
rare type confined to the lumina of blood vessels (there is only one IVL patient in WLYM cohort, 547
.CC-BY-NC-ND 4.0 International licensecertified by peer review) is the author/funder. It is made available under aThe copyright holder for this preprint (which was notthis version posted June 11, 2019. . https://doi.org/10.1101/667394doi: bioRxiv preprint
Zhu,Guo,Weiss,etal.ProteomicsofFFPEsamplesfortumorstratificationPage25/42
Supplementary Fig. 11). About 70% cases of eDLBCL are curable, however, the median 548
survival of patients with PCNSL is only about 30 months in contemporary clinical trials 64. 549
To identify prognostic proteins for DLBCL, two to three FFPE punches were analyzed 550
for each of the 41 DLBCL tumors (Supplementary Table 6, Supplementary Fig. 11, 12). 551
Altogether, we acquired 113 SWATH maps using a 60 min LC gradient, and a TripleTOF 6600 552
mass spectrometer. We quantified 5,769 SwissProt proteins in all samples (Supplementary 553
Table 6). The technical reproducibility for a representative sample is shown in Supplementary 554
Fig. 11d. 91 proteins were detected to be significantly up-regulated and 6 proteins were detected 555
to be down-regulated in the PCNSL tumors compared to eDLBCL tumors (Supplementary Fig. 556
11e, Supplementary Table 6). Of these, 20 proteins were suspected to be contaminants from 557
brain tissue based on their brain tissue expression annotation in the DAVID database and the 558
human protein atlas (Supplementary Table 6) 65. 17 proteins were further selected from the 559
remaining 77 proteins according to their applications in biomarker and drug target studies as 560
revealed by IPA analysis 56 (Supplementary Table 6). Their relative abundance of these 561
proteins in both eDLBCL and PCNSL groups is shown in Supplementary Fig. 13. 562
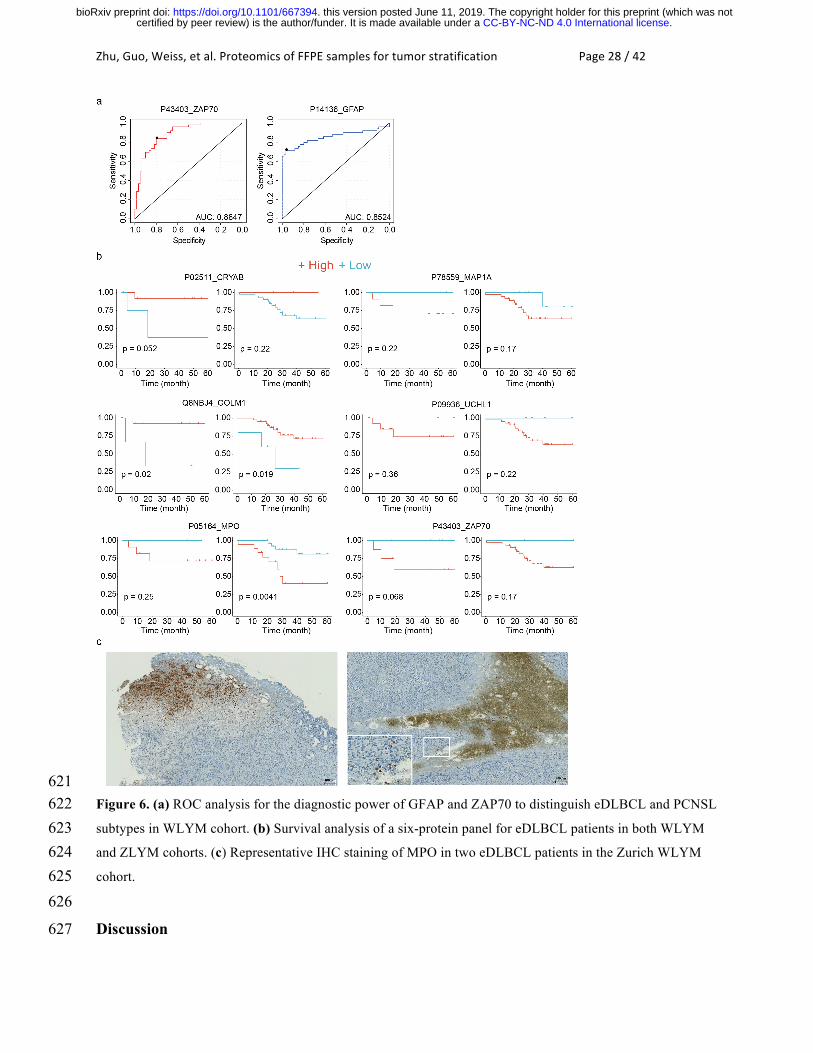
ROC analyses based on these seventeen proteins in both eDLBCL and PCNSL patient 563
samples from WLYM cohort were performed. Two proteins including glial fibrillary acidic 564
protein (P14136, GFAP) and zeta chain of T cell receptor associated protein kinase 70 (P43403, 565
ZAP70) exhibited high AUC values (Fig. 6a) to differentiate eDLBCL and PCNSL subtypes of 566
DLBCL. GFAP is a class-III intermediate filament and a cell-specific marker that distinguishes 567
astrocytes from other glial cells during the development of the central nervous system. We found 568
that GFAP is a novel upregulated marker in PCNSL. ZAP70 is a tyrosine kinase that is essential 569
for initiation of T cell antigen receptor signaling. ZAP70 deficiency is associated with 570
Immunodeficiency 48 that is a form of severe immunodeficiency characterized by a selective 571
absence of CD8+ T-cells 66. Here we found that ZAP70 was upregulated in the eDLBCL subtype 572
compared with PCNSL, indicating the role of ZAP70 in immunological processes during the 573
progress of the disease. 574
To further investigate the prognostic value of the proteins identified above, we procured a 575
second cohort of 52 eDLBCL patients from China (in the following termed as ‘ZLYM’ cohort), 576
and performed FFPE PCT-SWATH analysis using a TripleTOF 5600+ coupled to an Eksigent 577
micro-flow LC system (Supplementary Table 7). Two biological replicates were analyzed for 578
.CC-BY-NC-ND 4.0 International licensecertified by peer review) is the author/funder. It is made available under aThe copyright holder for this preprint (which was notthis version posted June 11, 2019. . https://doi.org/10.1101/667394doi: bioRxiv preprint

Zhu,Guo,Weiss,etal.ProteomicsofFFPEsamplesfortumorstratificationPage26/42
each patient. Here we quantified 6,266 proteotypic SwissProt proteins in 52 micro-sectioned 579
tissue samples from these DLBCL patients in technical duplicate. 16 out of 17 proteins identified 580
in the WLYM cohort described above were also identified in the ZLYM cohort. Survival 581
analysis of the 16 proteins in both groups of eDLBCL patients (WLYM and ZLYM) was further 582
performed through Kaplan-Meier plot. The result showed that besides ZAP70, five additional 583
proteins namely crystallin alpha B (P02511, CRYAB), Golgi membrane protein 1 (Q8NBJ4, 584
GOLM1), myeloperoxidase (P05164, MPO), microtubule associated protein 1A (P78559, 585
MAP1A) and ubiquitin C-terminal hydrolase L1 (P09936, UCHL1), were found to show 586
consistent trend in predicting the survival outcome in both WLYM and ZLYM eDLBCL patient 587
cohorts, although the P values in most cases are not very significant due to the small size of the 588
cohorts that were available for this rare disease (Fig. 6b). CRYAB has the function of preventing 589
aggregation of various proteins under a wide range of stress conditions. GOLM1 is highly 590
expressed in colon, prostate, trachea and stomach. Our study identified them as novel biomarkers 591
for eDLBCL patients. 592
MPO is a lysosomal protein known as expressed in azurophilic granules (primary 593
lysosomes) of normal myelomonocytic cells which is released into the extracellular space during 594
degranulation. MPO functions as part of the host defense system of polymorphonuclear 595
leukocytes. It is responsible for microbicidal activity against a wide range of organisms. MPO 596
has been reported to be related to myeloperoxidase deficiency (MPOD) that is characterized by 597
decreased myeloperoxidase activity in neutrophils and monocytes that results in disseminated 598
candidiasis 67. MAP1 is a structural protein involved in the filamentous cross-bridging between 599
microtubules and other skeletal elements. MAP1A/B are neuron specific microtubules 68. 600
MAP1S has been reported to interact with mitochondrion-associated leucine-rich PPR-motif 601
containing protein (LRPPRC) that interacts with the mitophagy initiator and Parkinson disease-602
related protein Parkin 69. UCHL1 gene mutations are involved in Parkinson disease 5 (PARK5) 603
that is characterized by a complex neurodegenerative disorder with manifestations ranging from 604
typical Parkinson disease to dementia with Lewy bodies 70. As discussed above, UCHL1 is also a 605
tumor suppressor in a broad range of cancers including PCa. eDLBCL patients with lower 606
expression level of MPO, MAP1, UCHL1 and ZAP70 were found to have higher survival rate in 607
this study. 608
.CC-BY-NC-ND 4.0 International licensecertified by peer review) is the author/funder. It is made available under aThe copyright holder for this preprint (which was notthis version posted June 11, 2019. . https://doi.org/10.1101/667394doi: bioRxiv preprint

Zhu,Guo,Weiss,etal.ProteomicsofFFPEsamplesfortumorstratificationPage27/42
Higher expression of MPO in eDLBCL patients was associated with worse survival, as 609
was shown in Kaplan-Meier plot (Fig. 6b). IHC staining of MPO in DLBCL tumors from two 610
patients in WLYM cohort confirmed the presence of MPO-positive regions (Fig. 6c). Detection 611
of increased abundance of MPO in eDLBCL group compared to the PCNSL group might 612
indicate the presence of coagulative necrosis with penetration of MPO+ granulocytes in the 613
aggressive subset of DLBCLs 71. Taken together, the data suggest that MPO is a robust 614
prognostic marker for DLBCL patients. This also supports the robustness of this proteomic 615
methodology, even if independent sample cohorts are studied in different laboratories and 616
instruments. The data from punches from the WLYM cohort matched well with the sectioned 617
samples from the ZLYM cohort. 618
619
Figure 6 620
.CC-BY-NC-ND 4.0 International licensecertified by peer review) is the author/funder. It is made available under aThe copyright holder for this preprint (which was notthis version posted June 11, 2019. . https://doi.org/10.1101/667394doi: bioRxiv preprint
Zhu,Guo,Weiss,etal.ProteomicsofFFPEsamplesfortumorstratificationPage28/42
621 Figure 6. (a) ROC analysis for the diagnostic power of GFAP and ZAP70 to distinguish eDLBCL and PCNSL 622 subtypes in WLYM cohort. (b) Survival analysis of a six-protein panel for eDLBCL patients in both WLYM 623 and ZLYM cohorts. (c) Representative IHC staining of MPO in two eDLBCL patients in the Zurich WLYM 624 cohort. 625 626
Discussion 627
.CC-BY-NC-ND 4.0 International licensecertified by peer review) is the author/funder. It is made available under aThe copyright holder for this preprint (which was notthis version posted June 11, 2019. . https://doi.org/10.1101/667394doi: bioRxiv preprint
Zhu,Guo,Weiss,etal.ProteomicsofFFPEsamplesfortumorstratificationPage29/42
Most archived tissues in pathology collections exist as FFPE samples, representing a rich 628
resource for clinical research. Over the past decade, MS-based shotgun proteomics has been used 629
to analyze proteins from FFPE samples 12-14,18-24,72. However, the concern remains that FFPE 630
samples may harbor greater variation in protein quality than FF samples due to formalin-induced 631
chemical modifications 25. Ostasiewicz et al. performed a comparison of FFPE and FF mouse 632
liver tissues and found similar protein pattern12. However, this was not confirmed in human 633
tissues. Recently, Piehowski, et al. analyzed 60 FFPE ovarian cancer samples with the storage 634
from 7 to 32 years using TMT 10-plex isobaric labelling method coupled with shotgun 635
proteomics approach and reported no significant proteome expression difference in terms of age 636
and storage time 30. This is an informative study investigating the clinical value of FFPE samples, 637
however, the practicality, robustness and reproducibility of FFPE proteomics, in terms of sample 638
preparation and LC-MS analyses, has not been rigorously established. Procurement of a suitable 639
cohort sample for rigorous comparison of FFPE and FF samples is critical for validating the 640
practicality. 641
In this study, based on the ProCOC cohort 40 which allowed access to prostate tissue 642
samples from adjacent sections of the same resected tissue was stored in both FFPE and FF 643
format with the storage over 4 to 8 years, we performed rigorous proteomic comparison between 644
them. PCT-SWATH analysis of 224 PCa FFPE and FF samples facilitated a rigorous comparison 645
in a clinical scenario in this study. Regarding to the storage factors that might affect the whole 646
proteome, comparison of proteome maps of FFPE samples stored for 8 years and for 4 years did 647
not show significant pattern differences (Supplementary Fig. 6). A further overall investigation 648
of FFPE sample proteome maps storing from 1 year to 15 years in an independent cohort (PCZC) 649
did not show significant pattern differences either (Fig. 3). Besides, proteome maps from two 650
types of FFPE tissue forms (sections vs. punches) are generally similar, however, they could be 651
separated from each other by PCA analysis (Fig. 3). 652
Since proteins in FFPE tissue are extensively and substantially modified by formalin 14,73, 653
one would not expect complete recovery of the entire proteome, and quantitatively identical 654
recovery of every peptide in various samples. Previous studies have investigated this issue in 655
depth 74,75,76. Indeed, we observed a slight global difference in TIC between comparable FFPE 656
and FF proteomes (Supplementary Fig. 2). However, we also show that these differences do not 657
distort the proteome patterns to a degree that would preclude their use for tissue classification, 658
.CC-BY-NC-ND 4.0 International licensecertified by peer review) is the author/funder. It is made available under aThe copyright holder for this preprint (which was notthis version posted June 11, 2019. . https://doi.org/10.1101/667394doi: bioRxiv preprint
Zhu,Guo,Weiss,etal.ProteomicsofFFPEsamplesfortumorstratificationPage30/42
suggesting that the slight differences observed between FF and FFPE tissue samples are smaller 659
or comparable to other preanalytical factors 77. This observation is significant because frequently, 660
longitudinal sample collections that are invaluable for biomarker discovery are stored in FFPE 661
format. Remarkably, despite a number of potential confounding factors, we successfully 662
identified the same protein biomarker candidates from matching FFPE and FF samples in the 663
ProCOC cohort 40, even though the FFPE and FF samples were actually from different, albeit 664
consistently scored sections in these prostate samples. To the best of our knowledge 12-14,18-24,72, 665
this is the first study in which the proteome of FFPE and FF has been rigorously compared in a 666
clinical scenario. 667
Regardless of the variable formalin fixation processes of tissue specimens, reproducible 668
sample preparation and LC-MS analysis are essential for clinical studies. Due to the complexity 669
(dozens to hundreds of fractions for a single sample) and high cost of the lengthy shotgun 670
proteomic workflow (hundreds to thousands of MS analyses for a single cohort), few published 671
studies on FFPE/FF proteomic analyses have ever attempted to repeat analysis on clinical 672
specimens of a cohort 26. A rapid and robust methodology for quantitatively measuring 673
proteomes of FFPE tissue specimens at low-cost and in a high-throughput manner are in great 674
need. 675
In this study, we identified a panel of twelve-protein biomarker candidates including 676
KLK3, SORD, AGR2, SPON2, MDH2, ACAD8, TPP1, DES, HNRNPA2B1, ASRGL1, UCHL1 677
and FLNA as differentially abundant between tumor and benign tissues from two independent 678
PCa cohorts, PCF and PCZA (Fig. 5). With this panel, the malignant tissue can be separated 679
from benign prostate tissue with an AUC higher than 0.9 in both PCF and PCZA sample cohorts 680
(Fig. 4b). To evaluate the quantitative PCa proteome maps generated in this study, as well as to 681
investigate the biological differences among different PCa cohorts from different countries, we 682
compared our PCF and PCZA proteomes with the two representative PCa proteomes generated 683
by Iglesias-Gato et al 37, and Latonen et al 36, respectively. 3030 proteins were quantified from 684
PCF cohort, and 4,144 proteins from PCZA cohort in this study. Iglesias-Gato et al used the 685
Super-SILAC labeling plus multi-fractionation integrated with shotgun MS method, to profile 686
proteotypes of 28 prostate tumors (Gleason score 6–9) FFPE samples and neighboring 687
nonmalignant FFPE tissue in eight cases (sections of 10µm thickness and 25 mm2 area), and 688
quantified 1,216 proteins from over 9000 protein identifications 37. Latonen et al reported high-689
.CC-BY-NC-ND 4.0 International licensecertified by peer review) is the author/funder. It is made available under aThe copyright holder for this preprint (which was notthis version posted June 11, 2019. . https://doi.org/10.1101/667394doi: bioRxiv preprint
Zhu,Guo,Weiss,etal.ProteomicsofFFPEsamplesfortumorstratificationPage31/42
throughput SWATH-MS proteotyping of fresh clinical tissue samples (five 5 µm slices for each 690
sample) of 10 BPH patients, 17 untreated PCa patients and 11 CRPC. In PCa vs BPH, they 691
quantified 3,394 proteins, which is comparable with our results regarding to quantified protein 692
number. Moreover, ACO2 and MDH2, two components in TCA cycle during PCa development 693
and progression were identified 36. In our study, the overexpression of MDH2 in PCa tissues in 694
both PCF and PCZA cohort was characterized, which was consistent with Latonen’s report. 695
Venn diagram showed that PCF, PCZA and Latonen cohorts shared 2,277 common proteins in 696
total, representing 67% of the Latonen proteome, as was shown in Supplementary Fig. 14 and 697
Supplementary Table 8. PCF, PCZA and Iglesias-Gato cohorts shared 700 proteins in total, 698
representing 57% of the quantified proteome by Iglesias-Gato. Besides, in Iglesias-Gato cohort, 699
five proteins from our 12-protein panel were found to be significantly regulated, which were 700
MDH2, TPP1, UCHL1, FLNA, and ACAD8. In Latonen cohort, six proteins, MDH2, TPP1, 701
AGR2, DES, HNRNPA2B1, and ACAD8 were found to be significantly regulated. Detailed 702
information of protein regulation of the twelve-protein biomarker candidates was shown in 703
Supplementary Table 8. The four cohorts revealed common proteins biomarkers and showed 704
good consistence although there were biological differences. Taken together, the presented data 705
not only demonstrate the practicality of using FFPE samples for robust PCa biomarker discovery, 706
more importantly, it also identified a panel of protein biomarker candidates for PCa diagnosis, 707
among which MDH2, TPP1 and ACAD8 were most significant regardless of tissue formats 708
(fresh or FFPE, punch or micrometer section) and patient populations. The overlap of the four 709
proteomes confirmed the technical reliability, robustness and transferability of our FFPE PCT-710
SWATH pipeline among different studies, cohorts and laboratories from another point of view. 711
The hereinabove studied PCa cohort offers a rational model to benchmark the similarity 712
of FFPE and FF proteome due to the availability of both types of tissue samples from adjacent 713
regions with relatively high degree of homogeneity. However, PCa patients generally exhibit 714
positive prognosis after prostatectomy. To further explore the generic applicability of the method 715
and to explore the feasibility of identifying prognostic markers in another clinical setting, we 716
analyzed 113 FFPE samples from a cohort of 41 Swiss DLBCL patients from Zurich with up to 717
125-month follow-up. We further validated the methodology and findings using the 718
independently established FFPE PCT-SWATH platform in China, which comprised 52 Chinese 719
DLBCL patients with up to 100-month follow-up. Importantly, data from the two cohorts 720
.CC-BY-NC-ND 4.0 International licensecertified by peer review) is the author/funder. It is made available under aThe copyright holder for this preprint (which was notthis version posted June 11, 2019. . https://doi.org/10.1101/667394doi: bioRxiv preprint

Zhu,Guo,Weiss,etal.ProteomicsofFFPEsamplesfortumorstratificationPage32/42
confirmed MPO as a promising survival marker (Fig. 6). The discovery of MPO as a potential 721
prognostic marker for DLBCL is also supported by the finding that circulating monocytes and 722
neutrophils are reported to be independent prognostic factor for DLBCL 78. Myeloid cells are 723
presumably MPO-positive and found to suppress T-cell responses. It also indicates the presence 724
of coagulative necrosis. 725
In conclusion, we demonstrated that FFPE tissue cohorts effectively facilitate biomarker 726
discovery compared to its FF counterpart via the optimized FFPE PCT-SWATH proteomics 727
analysis. We also reported novel promising protein biomarkers for PCa and DLBCLs. This study 728
indicates that historical FFPE tissue samples from biobanks have great potential in biomarker 729
discovery. 730
731
.CC-BY-NC-ND 4.0 International licensecertified by peer review) is the author/funder. It is made available under aThe copyright holder for this preprint (which was notthis version posted June 11, 2019. . https://doi.org/10.1101/667394doi: bioRxiv preprint

Zhu,Guo,Weiss,etal.ProteomicsofFFPEsamplesfortumorstratificationPage33/42
Materials and Methods 732
733
Prostate tissue Specimens 734
Both FF and FFPE tissues from Zurich were kindly provided by P.J.W. in the form of 735
punches from the Department of Pathology and Molecular Pathology, University Hospital Zurich. 736
Samples were collected within the ProCOC study 40, a prospective ongoing biobanking trial led 737
by PJW and CP. The size of a single FF tissue biopsy was about 1mm3 (diameter 1 mm; length 738
1-2 mm; wet weight was about 800 µg). The size of a single FFPE punch is about 0.5×0.5×3mm; 739
and the dry mass weighed about 300 µg including wax (Fig. 1a). The Cantonal Ethics 740
Committee Zurich (KEK-ZH) has approved all procedures involving human material, and each 741
PCa patient has signed an informed consent form (KEK-ZH-No. 2008-0040). Patients were 742
followed on a regular basis, every three months during the first year and afterwards at least 743
annually or on an individual basis depending on the disease course. A PSA value of 0.1 ng/ml or 744
higher was defined as biochemical recurrence 79. 745
Prostate FFPE samples from China (PCZA cohort) were procured in the Second 746
Affiliated Hospital of College of Medicine, Zhejiang University with approval from the hospital 747
ethics committee. The size of a single FFPE punch of PCZA cohort is about 1×1×5mm; and the 748
dry mass weighed about 1-1.5 mg including wax. Three punches were collected from each tissue 749
sample. 750
Prostate FFPE samples from China (PCZC cohort) were procured in the First Affiliated 751
Hospital of College of Medicine, Zhejiang University with approval from the hospital ethics 752
committee. The cohort contained two forms of archived FFPE samples that are micrometer 753
sections (5µm thickness) and tissue biopsy punches (1×1×0.5mm). Three biological replicates 754
were collected for each sample. The samples have been archived for a variety of timespans of 1 755
year, 5 years, 10 years to 15 years. 756
The PCa study here was also approved by ethics committee of Westlake University. 757
758
Lymphoma Specimens 759
FFPE tissues from 41 patients with PCNSL, eDLBCL and IVL who had signed an 760
informed consent and had been treated at the University Hospital Zurich between 2005 and 2014 761
were collected. Studies were approved by the Institutional Review Board (KEK-StV-Nr.19/08). 762
.CC-BY-NC-ND 4.0 International licensecertified by peer review) is the author/funder. It is made available under aThe copyright holder for this preprint (which was notthis version posted June 11, 2019. . https://doi.org/10.1101/667394doi: bioRxiv preprint

Zhu,Guo,Weiss,etal.ProteomicsofFFPEsamplesfortumorstratificationPage34/42
FFPE punches (each FFPE punch measuring about 0.5×0.6×3mm) were produced in the 763
Department of Pathology, University Hospital Zurich. Two to three punches were collected from 764
each tissue sample. 765
An independent cohort of 52 DLBCL patients was procured from the First Affiliated 766
Hospital of College of Medicine, Zhejiang University with approval from the hospital ethics 767
committee. Five sections with thickness of 10µm were collected for each tissue sample. 768
The DLBCL study here was also approved by ethics committee of Westlake University. 769
770
De-paraffinization, Rehydration, and Hydrolysis of FFPE tissues 771
The FFPE tissue was put into a 2 mL safe-lock Eppendorf tube, and was firstly subjected 772
to the dewaxing step by incubation with 1mL of heptane, and then gently vortexed at 800rpm for 773
10 min at 30 °C on a thermomixer (cap closed). The dewaxing was repeated once. The sample 774
was then subjected to gradient rehydration steps and gently vortexed at 800 rpm with 1ml 100%, 775
90%, 75% of ethanol, respectively, each time at 25 °C for 5 min (cap closed). At the third step, 776
each tissue sample was further incubated with 200µl 0.1% formic acid (FA) for 30 min at 30 °C 777
for rehydration and the acidic hydrolysis, by gently vortexing at 800rpm (cap closed). Lastly, the 778
tissue sample was transferred into a PCT-MicroTube (Pressure Biosciences Inc., South Easton, 779
MA), briefly washed with 100 µl of 0.1M Tris-HCl (pH 10.0, freshly prepared) to remove 780
remaining FA, and was then incubated with 15µl of fresh 0.1 M Tris-HCl (pH 10.0), boiled at 781
95 °C for 30 min, by gently vortexing at 600rpm to undergo a heat and base induced hydrolysis 782
(cap closed). 783
Once hydrolysis was finished, the PCT-MicroTube with FFPE tissue bathed in Tris-HCl 784
(pH 10.0) was immediately placed on ice for cooling, then 25 µl of lysis buffer (6 M Urea, 2 M 785
thiourea, 5 mM Na2EDTA in 100mM ammonium bicarbonate, pH 8.5) was added to the solution 786
(final pH around 8.8). Both the tissue sample and supernatant from this step were kept for 787
subsequent PCT-assisted tissue lysis and protein digestion. 788
789
PCT-assisted tissue lysis, protein extraction, and protein digestion 790
Briefly, the FFPE tissue sample was lysed with lysis buffer in a barocycler NEP2320-45k 791
(PressureBioSciences Inc.) at the PCT scheme of 30s high pressure at 45kpsi plus 10s ambient 792
pressure, oscillating for 90 cycles at 30°C. Then the extracted protein solution was reduced and 793
.CC-BY-NC-ND 4.0 International licensecertified by peer review) is the author/funder. It is made available under aThe copyright holder for this preprint (which was notthis version posted June 11, 2019. . https://doi.org/10.1101/667394doi: bioRxiv preprint
Zhu,Guo,Weiss,etal.ProteomicsofFFPEsamplesfortumorstratificationPage35/42
alkylated by incubating with 10mM tris(2-carboxyethyl)phosphine (TCEP) and 20mM 794
iodoacetamide (IAA) at 25°C for 30 min, in darkness, by gently vortexing at 800rpm in a 795
thermomixer. Afterwards, proteins were firstly digested by Lys-C (Wako; enzyme-to-substrate 796
ratio, 1:40) in the barocycler using the PCT scheme of 50s high pressure at 20kpsi plus 10s 797
ambient pressure, oscillating for 45 cycles at 30°C. Then a subsequent tryptic digestion step 798
followed (Progemga; enzyme-to-substrate ratio, 1:20) using the PCT scheme of 50s high 799
pressure at 20kpsi plus 10s ambient pressure, oscillating for 90 cycles at 30°C. Peptide samples 800
were then acidified by TFA prior to C18 desalting. The FF tissue samples were processed as 801
described previously 32 with only the change of replacing the normal microcaps with 802
micropestles 33. 803
804
SWATH mass spectrometry 805
All samples were spiked with iRT peptides (Biognosysis) 80. 0.6 µg of cleaned peptides 806
(0.3 µg per injection, in technical duplicates) were analyzed by SWATH-MS on a 5600 (Zurich 807
ProCOC cohort) or 6600 TripleTOF mass spectrometer (Zurich DLBCL cohort) connected to a 808
1D+ Nano LC system (Eksigent, Dublin, CA) 32,43. The LC gradient was mixed with buffer A (2% 809
acetonitrile and 0.1% formic acid in HPLC water) and buffer B (2% water and 0.1% formic acid 810
in acetonitrile). The analytical column was home-made (75 µm × 20 cm) using a fused silica 811
PicoTip emitter (New Objective, Woburn, MA, USA) and 3 µm 200 Å Magic C18 AQ resin 812
(Michrom BioResources, Auburn, CA). Peptide samples were separated with a linear gradient of 813
2% to 35% buffer B over 30 min (the PCF cohort) or 60 min (the WLYM cohort) LC gradient 814
time at a flow rate of 0.3 µl·min−1. Ion accumulation time for MS1 was 50 ms and 40 ms for 815
MS2 acquisition, respectively. SWATH window schemes were optimized to 48 variable 816
windows. The instrument was operated in high sensitivity mode. 817
The PCZA, PCZC and ZLYM cohorts from China were analyzed in a TripleTOF 5600+ 818
coupled to an Eksigent Nano LC 415 (with a 1-10ul/min flowmodule to switch the LC from 819
nano-flow to micro-flow). Composition of mobile phase was the same as that in Zurich lab. 820
Eksigent Analytical column (0.3 x 150 mm C18 ChromXP 3µm) and trap column (0.3 x10 mm, 821
C18 ChromXP 5µm) were used for chromatographic separation. 2µg of peptide samples were 822
separated with a linear gradient of 3% to 25% buffer B over 90 min (the PCZC and ZLYM 823
cohort) or 120 min (the PCZA cohort) LC gradient time at a flow rate of 5 µl·min-1. SWATH 824
.CC-BY-NC-ND 4.0 International licensecertified by peer review) is the author/funder. It is made available under aThe copyright holder for this preprint (which was notthis version posted June 11, 2019. . https://doi.org/10.1101/667394doi: bioRxiv preprint

Zhu,Guo,Weiss,etal.ProteomicsofFFPEsamplesfortumorstratificationPage36/42
acquisition method was the same as the method at Zurich lab except a slightly longer MS2 825
accumulation time of 60 ms. 826
827
SWATH data analysis 828
We built a SWATH assay library after analyzing unfractionated prostate tissue digests 829
prepared by the PCT method in Data Dependent Acquisition (DDA) mode on a 5600 TripleTOF 830
mass spectrometer over a gradient of 2 hours as previously described 81. SWATH data were first 831
analyzed using OpenSWATH (openms 1.10.0) 81 as described 32. Retention time extraction 832
window was 300 seconds, and m/z extraction was performed with 0.05Da tolerance. Retention 833
time was calibrated using iRT peptides. The sample for each peptide precursor that was 834
identified by OpenSWATH with the lowest m_score was treated as the reference sample for each 835
peptide precursor, and was used as input for DIA-expert analysis 836
(https://github.com/tiannanguo/dia-expert). Briefly, all b and y fragments for each identified 837
peptide precursor in the Spectrast library were re-analyzed using 838
OpenSwathChromatogramExtractor (openms 1.10.0) for all samples. A reference sample was 839
selected for each peptide precursor based on the m_score from OpenSWATH analysis described 840
above. For reference sample, peptide fragments forming good peak shape were refined in all 841
samples. Peptide precursors with less than four good peak-forming fragments were excluded. 842
Each sample, except the reference sample, in the sample set was pair-wise compared with the 843
reference sample at fragment level, and the median proportion of all fragments was used for 844
quantification of the peptide precursor in a sample. The MS2-level total ion chromatogram for 845
each SWATH window was used to normalize the peak group area. Peptide precursors that were 846
quantified in technical duplicates with a fold-change value equal or higher than two were 847
excluded. The most reliable peptide precursor from a protein, i.e. best flier peptide, was selected 848
to represent the abundance of a protein because we found that inclusion of poorly responded 849
peptide precursors negatively influenced to the quantitative accuracy, and that for high 850
abundance proteins with multiple peptides, the best flier peptide selected by the DIA-expert was 851
representative and exhibited the lowest number of missing values. All codes are provided in 852
Github. 853
854
Tissue Microarray and Immunohistochemistry 855
.CC-BY-NC-ND 4.0 International licensecertified by peer review) is the author/funder. It is made available under aThe copyright holder for this preprint (which was notthis version posted June 11, 2019. . https://doi.org/10.1101/667394doi: bioRxiv preprint

Zhu,Guo,Weiss,etal.ProteomicsofFFPEsamplesfortumorstratificationPage37/42
The Ethics Committee of the Kanton St. Gallen, Switzerland approved all procedures 856
involving human materials used in this St. Gallen TMA, and each patient signed an informed 857
consent. The construction of TMA and IHC procedures have been was described previously 43. 858
The POSTN antibody was from abcam (ab14041). The MPO antibody was from NeoMarkers / 859
Lab Vision Corporation (RB-373-A1). 860
861
Statistical analysis 862
All plots were produced with R. Violin plots were made using the R package vioplot. 863
Pearson’s correlation was used to compute the correlation coefficient. Two-tailed paired 864
Student's t-test was employed to compute probability in Volcano plots. Kaplan–Meier estimators 865
were used for RFS analysis. Point-wise 95% confidence bands were computed for the whole 866
range of time values. Differences between survival estimates were evaluated by the log-rank test. 867
868
Data deposition 869
The PCF data are deposited in PRIDE 82. Project accession: PXD004691. The PCZA data 870
are deposited in iProX (IPX0001355000). The ZLYM data are deposited in iProX 871
(IPX0001354001). All the data will be publicly released upon publication. 872
873
Acknowledgements 874
This work was supported by the SystemsX.ch project PhosphoNet PPM (to R.A. and 875
P.J.W.) and TPdF 2013/134 (to P.B.), the Swiss National Science Foundation (grant no. 3100A0-876
688 107679 to R.A.), the Foundation for Scientific Research at the University of Zurich (to 877
P.J.W.), the European Research Council (grant no. ERC-2008-AdG 233226 and ERC-2014-878
AdG670821 to R.A.) and the Westlake Startup to T.G.. T.W. acknowledges the Swiss National 879
Science Foundation (323630_164218) and the Swiss Cancer Research Foundation (MD-PhD-880
3558-06-2015). We thank Andreas Beyer for his critical input to this manuscript, and Patrick 881
Pedrioli for help in data management. We thank the Aebersold group, in particular Moritz Heusel, 882
for invaluable discussion. Members of the tissue biobank of the University Hospital Zurich are 883
thanked for excellent support in providing tissue punches, specifically Peter Schraml, Susanne 884
Dettwiler, Fabiola Prutek, and Peggy Tzscheetzsch. Andre Fritsche, Norbert Wey, Christiane 885
.CC-BY-NC-ND 4.0 International licensecertified by peer review) is the author/funder. It is made available under aThe copyright holder for this preprint (which was notthis version posted June 11, 2019. . https://doi.org/10.1101/667394doi: bioRxiv preprint
Zhu,Guo,Weiss,etal.ProteomicsofFFPEsamplesfortumorstratificationPage38/42
Mittmann, Monika Bieri, Andre Wethmar and Annette Bohnert are thanked for their technical 886
support. The study nurse Alexandra Veloudios is thanked for help with the ProCOC study. 887
888
Author contributions 889
Y.Z., T.G., T.W., P.J.W. and R.A. designed the project. Y.Z. conceived and developed 890
the hydrolysis protocol and the whole FFPE PCT-SWATH workflow. P.J.W., Q.Z., A.C., K.S., 891
D.R., J.L., C.D.F., M.B.S., C.F., N.J.R., C.P. and W.J. procured the Zurich PCa cohort. T.W., 892
E.R., M.W., P.R., E.H., and S.H. procured the Zurich DLBCL cohort. X.Y. and L.C. procured 893
the Chinese PCa cohort. S.L., B.W. and X.G. procured the Chinese DLBCL cohort. Y.Z. and 894
T.G. optimized the LC-SWATH-MS. Y.Z, T.W., R.S., X.Y., P.B., L.G., C.C., and T.G. 895
performed the PCT-SWATH analysis. Y.Z., T.G., T.W., Q.Z., Z.W., T.Z., C.X. analyzed the data. 896
Y.Z., T.G. T.W. and R.A. wrote the manuscript with inputs from all co-authors. R.A., P.J.W. and 897
T.G. supported and supervised the project. 898
899
Competing financial interests 900
R.A. holds shares of Biognosys AG, which operates in the field covered by the article. 901
The research groups of R.A. and T.G. are supported by SCIEX, which provides access to 902
prototype instrumentation, and Pressure Biosciences Inc., which provides access to advanced 903
sample preparation instrumentation. 904
.CC-BY-NC-ND 4.0 International licensecertified by peer review) is the author/funder. It is made available under aThe copyright holder for this preprint (which was notthis version posted June 11, 2019. . https://doi.org/10.1101/667394doi: bioRxiv preprint

Zhu,Guo,Weiss,etal.ProteomicsofFFPEsamplesfortumorstratificationPage39/42
References 905
1. Ritchie,M.D.,Holzinger,E.R.,Li,R.,Pendergrass,S.A.&Kim,D.Methodsofintegratingdatato906 uncovergenotype-phenotypeinteractions.NatRevGenet16,85-97(2015).907
2. Sawyers,C.L.Thecancerbiomarkerproblem.Nature452,548-552(2008).908 3. F.,B.DerFormaldehydealsHärtungsmittel.ZwissMikr.10,314-315(1893).909 4. Shabihkhani,M.,etal.Theprocurement,storage,andqualityassuranceoffrozenbloodand910
tissuebiospecimensinpathology,biorepository,andbiobanksettings.ClinBiochem47,258-266911 (2014).912
5. Chu,T.Y.,etal.Aresearch-basedtumortissuebankofgynecologiconcology:characteristicsof913 nucleicacidsextractedfromnormalandtumortissuesfromdifferentsites.IntJGynecolCancer914 12,171-176(2002).915
6. Bass,B.P.,Engel,K.B.,Greytak,S.R.&Moore,H.M.Areviewofpreanalyticalfactorsaffecting916 molecular,protein,andmorphologicalanalysisofformalin-fixed,paraffin-embedded(FFPE)917 tissue:howwelldoyouknowyourFFPEspecimen?ArchPatholLabMed138,1520-1530(2014).918
7. VanAllen,E.M.,etal.Whole-exomesequencingandclinicalinterpretationofformalin-fixed,919 paraffin-embeddedtumorsamplestoguideprecisioncancermedicine.NatMed20,682-688920 (2014).921
8. Martelotto,L.G.,etal.Whole-genomesingle-cellcopynumberprofilingfromformalin-fixed922 paraffin-embeddedsamples.NatMed23,376-385(2017).923
9. Li,P.,Conley,A.,Zhang,H.&Kim,H.L.Whole-Transcriptomeprofilingofformalin-fixed,paraffin-924 embeddedrenalcellcarcinomabyRNA-seq.BmcGenomics15(2014).925
10. vonAhlfen,S.,Missel,A.,Bendrat,K.&Schlumpberger,M.DeterminantsofRNAQualityfrom926 FFPESamples.PlosOne2(2007).927
11. Hood,B.L.,etal.Proteomicanalysisofformalin-fixedprostatecancertissue.MolCellProteomics928 4,1741-1753(2005).929
12. Ostasiewicz,P.,Zielinska,D.F.,Mann,M.&Wisniewski,J.R.Proteome,phosphoproteome,and930 N-glycoproteomearequantitativelypreservedinformalin-fixedparaffin-embeddedtissueand931 analyzablebyhigh-resolutionmassspectrometry.JProteomeRes9,3688-3700(2010).932
13. Gustafsson,O.J.R.,Arentz,G.&Hoffmann,P.Proteomicdevelopmentsintheanalysisof933 formalin-fixedtissue.Bba-ProteinsProteom1854,559-580(2015).934
14. Giusti,L.&Lucacchini,A.Proteomicstudiesofformalin-fixedparaffin-embeddedtissues.Expert935 RevProteomics10,165-177(2013).936
15. Shi,S.R.,Taylor,C.R.,Fowler,C.B.&Mason,J.T.Completesolubilizationofformalin-fixed,937 paraffin-embeddedtissuemayimproveproteomicstudies.ProteomicsClinAppl7,264-272938 (2013).939
16. Shi,S.R.,Key,M.E.&Kalra,K.L.Antigenretrievalinformalin-fixed,paraffin-embeddedtissues:940 anenhancementmethodforimmunohistochemicalstainingbasedonmicrowaveovenheating941 oftissuesections.JHistochemCytochem39,741-748(1991).942
17. Shi,S.R.,Shi,Y.&Taylor,C.R.Antigenretrievalimmunohistochemistry:reviewandfuture943 prospectsinresearchanddiagnosisovertwodecades.JHistochemCytochem59,13-32(2011).944
18. Jiang,X.,etal.Developmentofefficientproteinextractionmethodsforshotgunproteome945 analysisofformalin-fixedtissues.JProteomeRes6,1038-1047(2007).946
19. Jain,M.R.,etal.Proteomicidentificationofimmunoproteasomeaccumulationinformalin-fixed947 rodentspinalcordswithexperimentalautoimmuneencephalomyelitis.JProteomeRes11,1791-948 1803(2012).949
20. Wakabayashi,M.,etal.Phosphoproteomeanalysisofformalin-fixedandparaffin-embedded950 tissuesectionsmountedonmicroscopeslides.JProteomeRes13,915-924(2014).951
.CC-BY-NC-ND 4.0 International licensecertified by peer review) is the author/funder. It is made available under aThe copyright holder for this preprint (which was notthis version posted June 11, 2019. . https://doi.org/10.1101/667394doi: bioRxiv preprint
Zhu,Guo,Weiss,etal.ProteomicsofFFPEsamplesfortumorstratificationPage40/42
21. Shen,K.,Sun,J.,Cao,X.,Zhou,D.&Li,J.ComparisonofDifferentBuffersforProteinExtraction952 fromFormalin-FixedandParaffin-EmbeddedTissueSpecimens.PLoSOne10,e0142650(2015).953
22. Broeckx,V.,etal.ComparisonofmultipleproteinextractionbuffersforGeLC-MS/MSproteomic954 analysisofliverandcolonformalin-fixed,paraffin-embeddedtissues.MolBiosyst12,553-565955 (2016).956
23. Fu,Z.,etal.Improvedproteinextractionandproteinidentificationfromarchivalformalin-fixed957 paraffin-embeddedhumanaortas.ProteomicsClinAppl7,217-224(2013).958
24. Fowler,C.B.,O'Leary,T.J.&Mason,J.T.ImprovingtheProteomicAnalysisofArchivalTissueby959 UsingPressure-AssistedProteinExtraction:AMechanisticApproach.JProteomicsBioinform7,960 151-157(2014).961
25. Gaffney,E.F.,Riegman,P.H.,Grizzle,W.E.&Watson,P.H.Factorsthatdrivetheincreasinguseof962 FFPEtissueinbasicandtranslationalcancerresearch.Biotechnic&histochemistry:official963 publicationoftheBiologicalStainCommission93,373-386(2018).964
26. Holfeld,A.,Valdes,A.,Malmstrom,P.U.,Segersten,U.&Lind,S.B.ParallelProteomicWorkflow965 forMassSpectrometricAnalysisofTissueSamplesPreservedbyDifferentMethods.AnalChem966 90,5841-5849(2018).967
27. Hughes,C.S.,etal.QuantitativeProfilingofSingleFormalinFixedTumourSections:proteomics968 fortranslationalresearch.SciRep6,34949(2016).969
28. Quesada-Calvo,F.,etal.ComparisonoftwoFFPEpreparationmethodsusinglabel-freeshotgun970 proteomics:Applicationtotissuesofdiverticulitispatients.JProteomics112,250-261(2015).971
29. Drendel,V.,etal.ProteomeprofilingofclearcellrenalcellcarcinomainvonHippel-Lindau972 patientshighlightsupregulationofXaa-Proaminopeptidase-1,ananti-proliferativeandanti-973 migratoryexoprotease.Oncotarget8,100066-100078(2017).974
30. Piehowski,P.D.,etal.Residualtissuerepositoriesasaresourceforpopulation-basedcancer975 proteomicstudies.ClinProteomics15,26(2018).976
31. Fraenkelconrat,H.,Brandon,B.A.&Olcott,H.S.TheReactionofFormaldehydewithProteins.4.977 ParticipationofIndoleGroups-Gramicidin.JBiolChem168,99-118(1947).978
32. Guo,T.,etal.Rapidmassspectrometricconversionoftissuebiopsysamplesintopermanent979 quantitativedigitalproteomemaps.NatMed21,407-413(2015).980
33. Shao,S.,etal.ReproducibleTissueHomogenizationandProteinExtractionforQuantitative981 ProteomicsUsingMicroPestle-AssistedPressure-CyclingTechnology.JProteomeRes15,1821-982 1829(2016).983
34. Zhu,Y.&Guo,T.High-ThroughputProteomicAnalysisofFresh-FrozenBiopsyTissueSamples984 UsingPressureCyclingTechnologyCoupledwithSWATHMassSpectrometry.MethodsMolBiol985 1788,279-287(2018).986
35. Zhu,Y.,etal.IdentificationofProteinAbundanceChangesinHepatocellularCarcinomaTissues987 UsingPCT-SWATH.ProteomicsClinAppl,e1700179(2018).988
36. Latonen,L.,etal.Integrativeproteomicsinprostatecanceruncoversrobustnessagainst989 genomicandtranscriptomicaberrationsduringdiseaseprogression.NatCommun9,1176990 (2018).991
37. Iglesias-Gato,D.,etal.TheProteomeofPrimaryProstateCancer.EurUrol69,942-952(2016).992 38. Kamath,Y.K.,Hornby,S.B.,Bergeron,D.&Weigmann,H.D.EffectofPhandtheRoleofN-993
MethylolHydrolysisinFormaldehydeReleasefromDurablePressFabric.TextResJ55,766-773994 (1985).995
39. Gillet,L.C.,etal.TargeteddataextractionoftheMS/MSspectrageneratedbydata-independent996 acquisition:anewconceptforconsistentandaccurateproteomeanalysis.MolCellProteomics997 11,O111016717(2012).998
40. Umbehr,M.,etal.ProCOC:theprostatecanceroutcomescohortstudy.BMCUrol8,9(2008).999
.CC-BY-NC-ND 4.0 International licensecertified by peer review) is the author/funder. It is made available under aThe copyright holder for this preprint (which was notthis version posted June 11, 2019. . https://doi.org/10.1101/667394doi: bioRxiv preprint
Zhu,Guo,Weiss,etal.ProteomicsofFFPEsamplesfortumorstratificationPage41/42
41. Wettstein,M.S.,etal.PrognosticRoleofPreoperativeSerumLipidLevelsinPatientsUndergoing1000 RadicalProstatectomyforClinicallyLocalizedProstateCancer.Prostate77,549-556(2017).1001
42. Shao,S.,etal.Minimalsamplerequirementforhighlymultiplexedproteinquantificationincell1002 linesandtissuesbyPCT-SWATHmassspectrometry.Proteomics15,3711-3721(2015).1003
43. Guo,T.,etal.Multi-regionproteomeanalysisquantifiesspatialheterogeneityofprostatetissue1004 biomarkers.LifeSciAlliance1(2018).1005
44. Rost,H.L.,etal.OpenSWATHenablesautomated,targetedanalysisofdata-independent1006 acquisitionMSdata.NatureBiotechnology32,219-223(2014).1007
45. Tischler,V.,etal.Periostinisup-regulatedinhighgradeandhighstageprostatecancer.Bmc1008 Cancer10(2010).1009
46. Nuzzo,P.V.,etal.Prognosticvalueofstromalandepithelialperiostinexpressioninhuman1010 prostatecancer:correlationwithclinicalpathologicalfeaturesandtheriskofbiochemical1011 relapseordeath.BMCCancer12,625(2012).1012
47. Tian,Y.,etal.Overexpressionofperiostininstromapositivelyassociatedwithaggressive1013 prostatecancer.PLoSOne10,e0121502(2015).1014
48. Kristiansen,G.,etal.Expressionprofilingofmicrodissectedmatchedprostatecancersamples1015 revealsCD166/MEMDandCD24asnewprognosticmarkersforpatientsurvival.JPathol205,1016 359-376(2005).1017
49. Bu,H.,etal.Theanteriorgradient2(AGR2)geneisoverexpressedinprostatecancerandmay1018 beusefulasaurinesedimentmarkerforprostatecancerdetection.Prostate71,575-587(2011).1019
50. Lucarelli,G.,etal.Spondin-2,asecretedextracellularmatrixprotein,isanoveldiagnostic1020 biomarkerforprostatecancer.JUrol190,2271-2277(2013).1021
51. Qian,X.,etal.Spondin-2(SPON2),amoreprostate-cancer-specificdiagnosticbiomarker.PLoS1022 One7,e37225(2012).1023
52. Weidle,U.H.,etal.CellgrowthstimulationbyCRASH,anasparaginase-likeprotein1024 overexpressedinhumantumorsandmetastaticbreastcancers.AnticancerRes29,951-9631025 (2009).1026
53. Shapiro,E.,Hartanto,V.&Lepor,H.Anti-desminvs.anti-actinforquantifyingtheareadensityof1027 prostatesmoothmuscle.Prostate20,259-267(1992).1028
54. Varkaris,A.,Katsiampoura,A.D.,Araujo,J.C.,Gallick,G.E.&Corn,P.G.Srcsignalingpathwaysin1029 prostatecancer.CancerMetastasisRev33,595-606(2014).1030
55. Hu,Y.,etal.Decorinsuppressesprostatetumorgrowththroughinhibitionofepidermalgrowth1031 factorandandrogenreceptorpathways.Neoplasia11,1042-1053(2009).1032
56. Kramer,A.,Green,J.,Pollard,J.,Jr.&Tugendreich,S.CausalanalysisapproachesinIngenuity1033 PathwayAnalysis.Bioinformatics30,523-530(2014).1034
57. Szabo,Z.,etal.Sorbitoldehydrogenaseexpressionisregulatedbyandrogensinthehuman1035 prostate.OncolRep23,1233-1239(2010).1036
58. Ravipaty,S.,etal.ClinicalValidationofaSerumProteinPanel(FLNA,FLNBandKRT19)for1037 DiagnosisofProstateCancer.JMolBiomarkDiagn8(2017).1038
59. Narain,N.R.,etal.IdentificationofFilamin-Aand-Baspotentialbiomarkersforprostatecancer.1039 FutureSciOA3,FSO161(2017).1040
60. Ummanni,R.,etal.Ubiquitincarboxyl-terminalhydrolase1(UCHL1)isapotentialtumour1041 suppressorinprostatecancerandisfrequentlysilencedbypromotermethylation.MolCancer1042 10,129(2011).1043
61. Nakashima,M.,Nandakumar,J.,Sullivan,K.D.,Espinosa,J.M.&Cech,T.R.Inhibitionof1044 telomeraserecruitmentandcancercelldeath.JBiolChem288,33171-33180(2013).1045
62. Tummala,R.,Lou,W.,Gao,A.C.&Nadiminty,N.QuercetinTargetshnRNPA1toOvercome1046 EnzalutamideResistanceinProstateCancerCells.MolCancerTher16,2770-2779(2017).1047
.CC-BY-NC-ND 4.0 International licensecertified by peer review) is the author/funder. It is made available under aThe copyright holder for this preprint (which was notthis version posted June 11, 2019. . https://doi.org/10.1101/667394doi: bioRxiv preprint
Zhu,Guo,Weiss,etal.ProteomicsofFFPEsamplesfortumorstratificationPage42/42
63. Sinha,A.,etal.TheProteogenomicLandscapeofCurableProstateCancer.CancerCell35,414-1048 427e416(2019).1049
64. Korfel,A.,etal.RandomizedphaseIIIstudyofwhole-brainradiotherapyforprimaryCNS1050 lymphoma.Neurology84,1242-1248(2015).1051
65. Uhlen,M.,etal.Proteomics.Tissue-basedmapofthehumanproteome.Science347,12604191052 (2015).1053
66. Arpaia,E.,Shahar,M.,Dadi,H.,Cohen,A.&Roifman,C.M.DefectiveTcellreceptorsignaling1054 andCD8+thymicselectioninhumanslackingzap-70kinase.Cell76,947-958(1994).1055
67. Kizaki,M.,Miller,C.W.,Selsted,M.E.&Koeffler,H.P.Myeloperoxidase(MPO)genemutationin1056 hereditaryMPOdeficiency.Blood83,1935-1940(1994).1057
68. Halpain,S.&Dehmelt,L.TheMAP1familyofmicrotubule-associatedproteins.GenomeBiol7,1058 224(2006).1059
69. Xie,R.,etal.Microtubule-associatedprotein1S(MAP1S)bridgesautophagiccomponentswith1060 microtubulesandmitochondriatoaffectautophagosomalbiogenesisanddegradation.JBiol1061 Chem286,10367-10377(2011).1062
70. Liu,Y.,Fallon,L.,Lashuel,H.A.,Liu,Z.&Lansbury,P.T.,Jr.TheUCH-L1geneencodestwo1063 opposingenzymaticactivitiesthataffectalpha-synucleindegradationandParkinson'sdisease1064 susceptibility.Cell111,209-218(2002).1065
71. Song,M.K.,etal.Tumornecrosiscouldreflectadvanceddiseasestatusinpatientswithdiffuse1066 largeBcelllymphomatreatedwithR-CHOPtherapy.AnnHematol96,17-23(2017).1067
72. Wisniewski,J.R.,etal.Extensivequantitativeremodelingoftheproteomebetweennormal1068 colontissueandadenocarcinoma.MolSystBiol8,611(2012).1069
73. Ramos-Vara,J.A.&Miller,M.A.WhenTissueAntigensandAntibodiesGetAlong:Revisitingthe1070 TechnicalAspectsofImmunohistochemistry-TheRed,Brown,andBlueTechnique.VetPathol1071 51,42-87(2014).1072
74. Deeb,S.J.,etal.MachineLearning-basedClassificationofDiffuseLargeB-cellLymphoma1073 PatientsbyTheirProteinExpressionProfiles.MolCellProteomics14,2947-2960(2015).1074
75. Kennedy,J.J.,etal.OptimizedProtocolforQuantitativeMultipleReactionMonitoring-Based1075 ProteomicAnalysisofFormalin-Fixed,Paraffin-EmbeddedTissues.JProteomeRes15,2717-27281076 (2016).1077
76. Zhang,Y.,etal.Unrestrictedmodificationsearchrevealslysinemethylationasmajor1078 modificationinducedbytissueformalinfixationandparaffinembedding.Proteomics15,2568-1079 2579(2015).1080
77. AbdullahAl-Dhabi,N.,etal.ProteomicAnalysisofStage-IIBreastCancerfromFormalin-Fixed1081 Paraffin-EmbeddedTissues.BiomedResInt2016,3071013(2016).1082
78. Azzaoui,I.,etal.T-celldefectindiffuselargeB-celllymphomasinvolvesexpansionofmyeloid-1083 derivedsuppressorcells.Blood128,1081-1092(2016).1084
79. al,W.e.Prognosticroleofpreoperativeserumlipidlevelsinpatientsundergoingradical1085 prostatectomyforclinicallylocalizedprostatecancer.TheProstate.1086
80. Escher,C.,etal.UsingiRT,anormalizedretentiontimeformoretargetedmeasurementof1087 peptides.Proteomics12,1111-1121(2012).1088
81. Röst,H.L.,etal.OpenSWATHenablesautomated,targetedanalysisofdata-independent1089 acquisitionMSdata.NatBiotechnol32,219-223(2014).1090
82. Vizcaino,J.A.,etal.ProteomeXchangeprovidesgloballycoordinatedproteomicsdata1091 submissionanddissemination.NatBiotechnol32,223-226(2014).1092
1093
.CC-BY-NC-ND 4.0 International licensecertified by peer review) is the author/funder. It is made available under aThe copyright holder for this preprint (which was notthis version posted June 11, 2019. . https://doi.org/10.1101/667394doi: bioRxiv preprint


![!Chen Taijiquan 2]. chen 38](https://static.fdocuments.net/doc/165x107/5535fa5b550346640d8b4777/chen-taijiquan-2-chen-38.jpg)


