High Temperature Oxidation of HfC-Containing Chromium-Rich ...
18
HAL Id: hal-02181311 https://hal.archives-ouvertes.fr/hal-02181311 Submitted on 12 Jul 2019 HAL is a multi-disciplinary open access archive for the deposit and dissemination of sci- entific research documents, whether they are pub- lished or not. The documents may come from teaching and research institutions in France or abroad, or from public or private research centers. L’archive ouverte pluridisciplinaire HAL, est destinée au dépôt et à la diffusion de documents scientifiques de niveau recherche, publiés ou non, émanant des établissements d’enseignement et de recherche français ou étrangers, des laboratoires publics ou privés. High Temperature Oxidation of HfC-Containing Chromium-Rich Iron-Based Alloys Patrice Berthod, Elodie Conrath To cite this version: Patrice Berthod, Elodie Conrath. High Temperature Oxidation of HfC-Containing Chromium-Rich Iron-Based Alloys. Oxidation of Metals, Springer Verlag, 2014, 82 (1-2), pp.33-48. 10.1007/s11085- 014-9475-6. hal-02181311
Transcript of High Temperature Oxidation of HfC-Containing Chromium-Rich ...

HAL Id: hal-02181311https://hal.archives-ouvertes.fr/hal-02181311
Submitted on 12 Jul 2019
HAL is a multi-disciplinary open accessarchive for the deposit and dissemination of sci-entific research documents, whether they are pub-lished or not. The documents may come fromteaching and research institutions in France orabroad, or from public or private research centers.
L’archive ouverte pluridisciplinaire HAL, estdestinée au dépôt et à la diffusion de documentsscientifiques de niveau recherche, publiés ou non,émanant des établissements d’enseignement et derecherche français ou étrangers, des laboratoirespublics ou privés.
High Temperature Oxidation of HfC-ContainingChromium-Rich Iron-Based Alloys
Patrice Berthod, Elodie Conrath
To cite this version:Patrice Berthod, Elodie Conrath. High Temperature Oxidation of HfC-Containing Chromium-RichIron-Based Alloys. Oxidation of Metals, Springer Verlag, 2014, 82 (1-2), pp.33-48. �10.1007/s11085-014-9475-6�. �hal-02181311�
1
High Temperature Oxidation of HfC-containing Chromium-
rich Iron-based Alloys
Patrice Berthod and Elodie Conrath
Institut Jean Lamour (UMR CNRS 7198), Department CP2S, Faculty of Science and Technologies, Postal Box 70239, 54506 Vandoeuvre-lès-Nancy, FRANCE
[email protected], [email protected]
Abstract. Three HfC-containing iron-based alloys were successfully elaborated by foundry. The alloys, all containing 25wt.%Cr, 0.25 or 0.50wt.%C and 3.7 to 5.6wt.%Hf, are characterized by a dendritic matrix and the presence of interdendritic script-like HfC carbides. These alloys were subjected to thermogravimetry test in air at 1200°C for 46 hours. The long exposure at this high temperature did not significantly modify the characteristics of the bulk HfC carbides. In contrast the presence of hafnium led to not parabolic oxidation kinetics and fast mass gain rates, by comparison with similar Hf-free ternary alloys. The scales formed all over the samples’ surfaces were never composed exclusively of chromia and iron oxides or (iron, chromium) oxides were present in significant quantities. Some particles of hafnium oxides were also present in the external scales. A subsurface zone in which the HfC carbides were in situ replaced by hafnium oxides developed from the oxidation front. Catastrophic oxidation started in several locations and threatened to expand all around the samples beyond the stage duration. The high temperature oxidation behavior of these HfC-containing iron-based alloys appeared better than their cobalt-based homologues but worse than their nickel-based homologues, for the same conditions of oxidation test. Keywords: Iron-based alloys; HfC carbides; High temperature oxidation; Mas gain rates; Oxide scale characteristics; Internal oxidation
Post-print version of the article Oxid Met (2014) 82:33–48; DOI 10.1007/s11085-014-9475-6
INTRODUCTION
Some applications at high temperature require refractory metallic alloys for their high ductility and toughness at all temperatures. Since such materials are intrinsically easy to oxidize − especially in hot conditions of service − they must be enriched, either in bulk or in subsurface, by elements as aluminum, chromium or silicon [1]. When a good resistance against corrosion by molten substances is compulsory chromium is generally chosen since the developed chromia is often the most protective oxide layer in such conditions. Alloys rich enough in chromium for this purpose cannot contain significant quantities of aluminum and thus they cannot be strengthened by dense and fine precipitation of Ni3Al-type intermetallic particles such as the famous γ/γ’ single crystal nickel-based superalloys [2]. To resist mechanical stresses at high temperature chromium-rich alloys need to be constituted of coarse grains (achievable by foundry) and must contain particles reinforcing grain boundaries and interdendritic spaces, as well as particles or heavy atoms for the strengthening of the matrix itself. Carbides can be easily obtained in cast alloys by adding carbon and carbide-forming elements. Chromium already allows obtaining different types of chromium carbides, i.e. Cr23C6 or Cr7C3 which are the most common ones in alloys not too rich in carbon. They are for example the main reinforcing particles in cast chromium-rich nickel-based alloys used for glass-working [3]. Such carbides are unfortunately not stable enough at high temperature to insure resistance at elevated temperatures on long times. The TaC carbides show a better behavior in this field and they can be successfully obtained and exploited for the high temperature mechanical resistance in chromium-rich cobalt-based alloys. However, on the one hand such cobalt-based alloys are not very refractory since their fusion onset temperature is generally close to 1300°C and often lower, and on the other hand the initially script-like eutectic TaC carbides tend to get fragmented into aligned small and compact particles after less than 100 hours at very high temperature.

2
It was recently seen that other MC carbides – the HfC ones – appeared more resistant at high temperature against this fragmentation phenomena when obtained in chromium-rich cobalt-based alloys [4]. In parallel it was also observed in another earlier work [5] that MC carbides (the TaC ones) were successfully obtained with the script-like eutectic shape in chromium-rich iron-based alloys which appeared exceptionally refractory with fusion onset temperatures higher than 1400°C. It was thus envisaged to synthesize by foundry chromium-rich alloys containing quantities in carbon and hafnium high enough to obtain dense precipitation of HfC as main carbide phase.
This association of a very refractory Fe(Cr)-base and a strengthening HfC phase appears rather original. Indeed hafnium is generally considered for high temperature alloys as an element added with the typical amount of 1wt.%Hf or less for improving the behavior in high temperature oxidation [1, 6] . This element was rarely used for high temperature mechanical strengthening purpose. One can cite few articles in which the formation of HfC carbides was promoted for the reinforcement by these carbides of cobalt-based alloys [7], directionally solidified nickel-based alloys [8], molybdenum-based alloys [9] or tungsten-based alloys [10] alloys.
In the apparently single work dealing with the presence of HfC carbides in a chromium-rich iron-based alloy, it was found that script-like eutectic carbides are able to appear in the interdendritic spaces [11]. The purpose of this work is to synthesize again such alloys in order to test them in oxidation in air at a particularly high temperature (1200°C) for which such alloys can be destined according to their high refractoriness and to the advantageous morphologies and repartition of the very stable HfC carbides.
EXPERIMENTAL
Three Hf-containing iron-based alloys were synthesized by targeting the following compositions: 25 wt.%Cr, 0.25 or 0.50 wt.%C, and 3.7 or 5.6wt.%Hf. In parallel, to allow evidencing the influence of the previous high Hf contents on the high temperature oxidation behavior, two Hf-free ternary alloys containing the same chromium and carbon quantities were also elaborated. In each case pure elements (Alfa Aesar, purity > 99.9wt.%) were melted together in a High Frequency induction furnace (CELES). Heating, melting, solidification and solid state cooling took place inside a closed silica tube containing an inert atmosphere of pure argon (300mbars). Five compact 40g-weighing ingots were obtained and, after return to room temperature, they were cut for obtaining samples of two types: metallographic samples devoted to the examination of the as-cast microstructures, and parallelepiped samples for the thermogravimetry tests (approximate dimensions: 9 × 9 × 3 mm3). The samples for metallography examinations were embedded in a cold resin mixture (resin CY230 + hardener HY956, ESCIL) then polished. Polishing was done first by using SiC-enriched papers with grade varying from 120 to 1200. After cleaning using ultrasonic vibrations in water, the metallographic samples were finished using textile containing 1µm-alumina particles. A mirror-like state was thus obtained for all metallographic samples to allow their examination using optical and electron microscopes.
The parallelepiped samples destined to the oxidation tests in thermobalance were polished with SiC-papers (120 to 1200-grit). Their edges and corners were smoothed using 1200-grit paper. They were oxidized in a SETARAM TGA92 thermo-balance and their mass variations were recorded versus time. The applied thermal cycle, realized in dry synthetic air (80%N2 – 20%O2), was composed of a heating at +20°C/min, of an isothermal stage of 46h at 1200°C and of a cooling rate at -5°C/min. The mass gain files were plotted versus time first to see if the kinetic is parabolic or not. The mass gain per surface unit area (m) was thereafter plotted versus the square root of time to classically determine the parabolic constant kp. At a so high temperature as 1200°C, when chromia is the major oxide to develop over the samples, its volatilization by re-oxidation into gaseous CrO3 must be taken into account to do not minimize the oxidation rate when assessed by mass gain recording. The curves displaying a shape near parabolic and regular enough were then selected for attempting their analyze according to the {m × dm/dt = kp – kv × m} method [12] to specify the parabolic constant kp without underestimation and the chromia volatilization constant kv simultaneously. The curve obtained by plotting the m × dm/dt quantity versus -m (m being the mass gain per surface unit area) appears linear for values of times high enough (i.e. after the end of transient oxidation). The two kinetic constants can be then red in the equation of this straight line: chromia volatilization constant kv is the slope and the parabolic constant kp is the ordinate at the origin of this same linear part.
After the oxidation runs the thermogravimetry samples were characterized. This started by scanning the oxidized surfaces by using a simple office scanner (evaluating the possible oxide spallation occurred during cooling) and by performing X-Ray diffraction on the external oxide scales using a Philips X’Pert Pro diffractometer (identifying the natures of the external oxides present on surface). A thin gold layer was deposited all around the oxidized samples by cathodic evaporation, followed by an electrolytic layer of nickel thick enough in order to limit the loss of external

3
oxide during cutting. After cutting in two parts, embedding in cold resin mixture and polishing to obtain a mirror-like surface, the cross-sections were examined. This was done by optical microscopy (Olympus BX51 equipped with a digital camera driven by the Olympus software DP-Soft) and using a Field Emission Gun - Scanning Electron Microscope (FEG-SEM) JEOL J7600F (imaging in Back Scattered Electrons (BSE) mode and chemical analysis by Energy Dispersion Spectrometry (EDS)).
RESULTS
Chemical Compositions and Microstructure of the Studied Alloys The final chemical compositions obtained for the elaborated alloys are given in Table 1 (EDS measurements).
Globally the targeted chromium and hafnium contents are respected. Carbon being too light and present in too low quantity, it was not possible to measure its content directly. However it can be supposed that the carbon content was also well respected as one generally notes for similar alloys elaborated with the same procedure, this being confirmed in addition by seeing the carbides densities obtained.
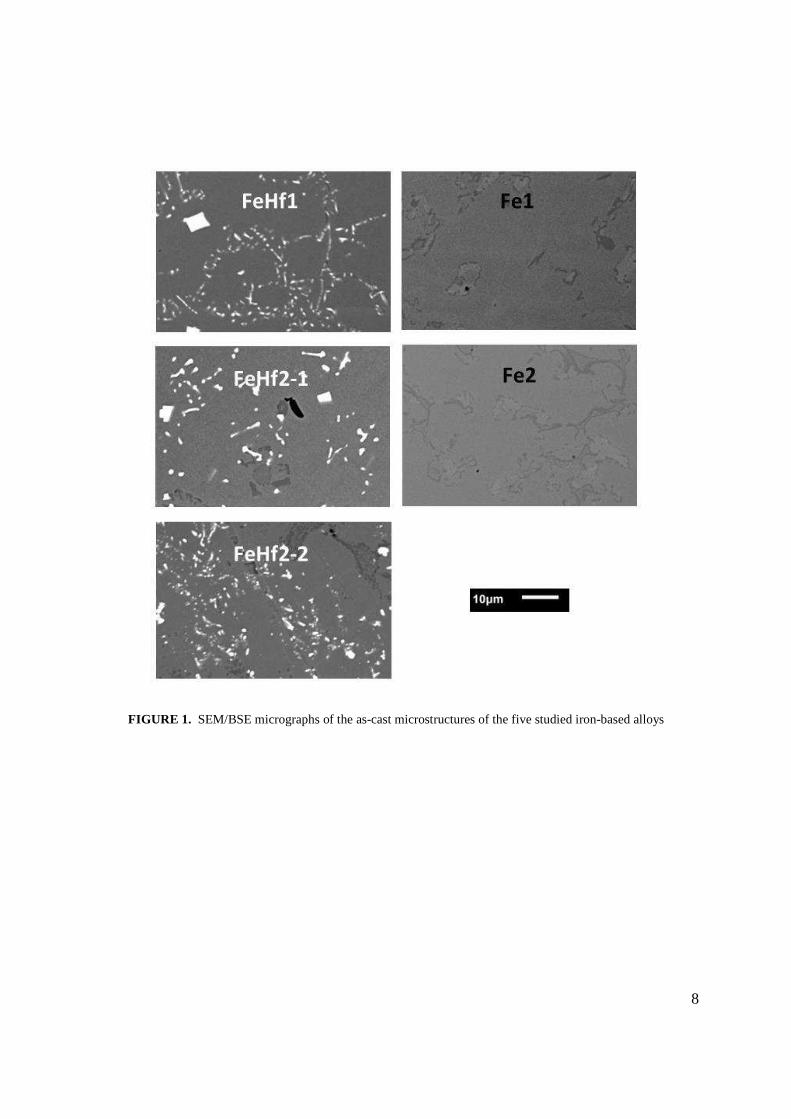
The as-cast microstructures of the obtained alloys are illustrated by SEM/BSE micrographs in Figure 1. The matrix of the three Hf-containing alloys is dendritic. The carbides are either exclusively HfC carbides in the FeHf1alloy, consequence to its atomic ration between Hf and C close to 1. The two other Hf-containing alloys (HfC2-1 and HfC2-2), in which there is more carbon than hafnium in term of atomic contents, contain both HfC carbides (white in BSE mode) and chromium carbides (darker than matrix). When present the chromium carbides constitute an eutectic compound with the matrix. This is also the case for many of the HfC carbides which are script-like shaped and mixed with matrix in the interdendritic spaces. However there are also, in the two later alloys, several blocky polygonal HfC carbides, present here and there in the microstructure. These ones seemingly precipitated in the early stage of solidification (pre-eutectic carbides), simultaneously with matrix dendrites, and maybe even before the later ones.
Mass gain kinetics
The obtained mass gain curves are plotted in Figure 2 for the two 0.25wt.%C-containing alloys (Fe1 and FeHf1) and in Figure 3 for the three 0.50wt.%C-containing ones (Fe2, FeHf2-1 and FeHf2-2 alloy). The mass gain curve of the Hf-free Fe1 alloy is globally parabolic. The FeHf1 one has the same tendency for the first three quarters of stage duration (despite som small jumps due to probable local scale detachments), but it finishes by a more linear part. The Fe2 mass gain curve is not really parabolic but rather parabolic-linear. The mass gain curve obtained for the FeHf2-1 alloy was parabolic with a fast rate at the early beginning of the isothermal stage then it rapidly becomes parabolic-linear for the main part of the stage duration. Globally the mass gain rates of these four first alloys led to final mass gains of the same order of magnitude (about 3mg/cm² for the two Hf-free alloys and about 4mg/cm² for the two Hf-containing alloys). The FeHf2-2 alloy, in contrast, oxidized about 5 times faster, with a final mass gain of almost 20mg/cm². For this one the mass gain kinetic was first parabolic but with a high rate and it finished by a mass gain acceleration.
Considering the shapes of the obtained curves it appeared that only the Fe1 one was suitable for an exploitation of the mass gain files according to the {m × dm/dt = kp – kv × m} method. Its analysis, illustrated in Figure 4(A), led to values given in the first line of Table 2. These values, tested by plotting a mathematical curve plotted in Figure 4(B) (“kp-kv”) for comparison with the experimental curve (“exp”) with which it present a good parallelism for the two curve’s ends. Thus the kp value issued from the {m × dm/dt versus -m}–plot is much better than the classical one which led to the third curve (“classic kp”) which is very different from the experimental curve. The values of kp and kv − respectively 124 × 10-12 g2 cm-4 s-1 and 244 × 10-10 g cm-2 s-1 – well correspond to what is generally obtained at such temperature when chromia cover the whole alloy surface (at least its main part) during oxidation [12, 13]. The value obtained for kp, much higher than the classically determined one (47 × 10-12 g2 cm-4 s-1), clearly evidences the importance to take into account the volatilization of chromia, the rate of which is effectively not negligible).
Only the classical determination of kp was possible for the other Hf-free alloy (Fe2) and for the first part of the FeHf1 curve. The obtained values are close to the Fe1 one. The slope of the straight line drawn through the not

4
parabolic mass gain curves obtained for the two 0.5wt.%-C Hf-containing alloys and plotted versus the square root of time, led to equivalent kp values very high, illustrating how fast these two alloys oxidized.
Surface characterization of the oxidized samples
The images obtained by scanning the oxidized sample before cutting and cross-sections preparation are displayed in Figure 5. This shows that oxide spallation during post-oxidation cooling were not severe since no really denuded zones can be seen. In contrast the irregular external face of the oxide scales let think that oxidation was not homogeneous all around the samples since thicker oxide islands obviously exist in some locations.
Concerning the natures of the oxides formed on surfaces it appears, thanks to the X-ray diffraction runs, that oxides of both Fe and Cr are present on the surfaces of all alloys: Fe2O3 and Cr2O3 well dissociated from one another, or (Fe,Cr)2O3 mixed oxide, and in some cases FeCr2O4 spinel. In the case of the Hf-containing alloys hafnium oxide (HfO2) is additionally present, in small quantities. Two examples of such XRD diffractograms are given in Figure 6 for one of the Hf-free alloys and in Figure 7 for one of the Hf-containing alloys.
Characterization of the Oxides and Subsurfaces in Cross-Sections
The constitution of the external oxide scales in several oxides is already visible on optical micrographs (without preliminary etching) as illustrated in Figure 8. The observation using the optical microscope also allowed seeing that the external oxide scale can be, either thin and constituted of a single oxide or of the superposition of two continuous oxides, or thick and multi-constituted. The observations using the FEG-SEM brought additional information as the identification of the present oxides. One can se that spinel FeCr2O4 and complex (Fe,Cr)2O4 oxides are present under a continuous layer of chromia for the FeHf1 alloy (Figure 9), that Fe2O3 and (Fe,Cr)2O3 are on the contrary present over the chromia scale for the two other Hf-containing alloys (Figure 10 and Figure 11) and that more or less small particles of HfO2 have formed in the external oxides involving Fe or Fe with Cr. The optical micrographs taken on the subsurfaces also indicated that internal oxidation may have occurred in all alloys but principally in the Hf-containing ones. Some of the white particles seen in the subsurface (FeHf1 and FeHf2-1) alloys − and even in the core of the FeHf2-2 oxidized sample − are not HfC carbides but HfO2 internal oxides.
The average thickness of the continuous oxides was measured (by avoiding the locations where very thick oxides locally formed) and is presented for all alloys as a graph in Figure 12. There is no very significant differences among the five results (by considering the standard deviation values) but there is a tendency to a thinner continuous scale for the Hf-containing alloys than for the Hf-free ones. The depth of internal oxidation (measured on optical micrographs for the reasons given above) is, in contrast, greater for the Hf-containing alloys than for the Hf-free ones (Figure 13). Furthermore the internal oxidation depth seems increasing with the Hf content in the alloy, this leading to the presence of dispersed hafnium oxides in the whole thickness of the Hf-richest alloy (FeHf2-2).
Some EDS pinpoint measurements were performed in the subsurface close to the alloy-oxide interface. They showed that the chromium content had logically decreased from the initial values but remained still high (e.g. 19, 23 and 21wt.% in the FeHf1, FeHf2-1 and FeHf2-2 alloys respectively).
Microstructures Evolutions in the Bulk
The microstructures in the bulk of the oxidized Hf-containing alloys are displayed in Figure 14, Figure 15 and Figure 16 for the FeHf1, FeHf2-1 and FeHf2-2 alloys respectively, with SEM/BSE pictures taken for two magnifications (general microstructure and local details). Globally, the comparison with the as-cast microstructures displayed in Figure 1 shows that the microstructures have not significantly evolved, notably concerning the HfC carbides. These ones are still script-like shaped and their surface fractions seem to have remained the same. One can just remind the appearance of some hafnium oxides in the bulk of the Hf-richest alloy (for the two other internal oxidation occurred only in the first 250µm from the alloy/scale interface). In contrast, as for the Hf-free alloys, the chromium carbides, less stable at high temperature, have coarsened.

5
DISCUSSION
Thus, in chromium-rich iron-based alloys too, Hf additions in sufficiently great quantities allowed the development of numerous HfC carbides in the interdendritic spaces, mainly with a eutectic nature and a script-like shape but also with a blocky shape for some of them. This is a common point with the similar Hf-containing cobalt-based alloys [14] and Hf-containing nickel-based alloys [15] which both presented also these repartition and shape of eutectic HfC carbides. However the presence of obviously blocky pre-eutectic HfC was met essentially in the cobalt alloys. As for these Hf-rich cobalt-based and nickel-based alloys previously elaborated by foundry and tested in oxidation at the same temperature the presence of so high quantities of hafnium influences the high temperature oxidation behavior of the corresponding Fe-25Cr-C base alloys. The kinetics were accelerated by the presence of hafnium, less than observed for the cobalt-based alloys [14] but more for the nickel-based alloys [15]. By comparison with the nickel-based alloys for which the scale thicknesses were rather homogeneous, this is due to the formation of thick multi-constituted oxide islands. This is certainly the growth of the latter oxide islands which induced the linear mass gain contribution which added itself to the parabolic regime with as consequence a fast parabolic-linear kinetic.
Even if the high temperature oxidation behavior of the ternary Hf-free alloys was globally not excellent, it appeared that the presence of an interdendritic HfC network worsen this behavior: more iron oxide or (iron, chromium) oxides have formed and oxidation obviously became catastrophic in several locations. One can wonder whether the HfC network hindered the chromium diffusion towards the oxidation front, this effect being constant in time since HfC carbides obviously transformed on place into HfO2 without liberating the interdendritic spaces close to the extreme surface. Indeed, they do not present a {carbide (HfC)} - free zone (or {oxide (HfO2)}-free zone) allowing the inwards development of a single-phased subsurface through which Cr atoms can diffuse in volume. The interdendritic HfC-carbides network, and thereafter the interdendritic HfO2-oxide networks, slowed Cr diffusion all along the oxidation test. This locally promoted the change of slow oxidation into fast catastrophic oxidation, phenomenon which may expand to the whole surface despite chromium contents remained rather high in subsurface (decreased only down to around 20wt.% against 25wt.% initially). This never occurred for the HfC-containing nickel-based alloys [15], favored by the easy chromium diffusion through the nickel matrix. But, in contrast, this occurred sooner for the HfC-containing cobalt-based alloys [14] since these ones oxidized much faster all along the same isothermal stage, due to the globally less easy chromium diffusion through the cobalt-based matrix.
In contrast such carbide-free zone usually develops from the extreme surface in the case of TaC-containing alloys in the subsurface of which the tantalum carbides disappear over a depth increasing with time. In their case TaC dissociates into Ta and C which diffuse towards the oxidation front to be oxidized respectively into Ta2O5 or CrTaO4 close to the alloy/oxide interface for the first element and into COx gases for the second one. For these TaC-containing alloys this is probably the reason of their much better high temperature oxidation behavior insured by the chromium diffusion maintained easy by the absence of such obstruction.
Concerning the internal oxidation, this one can be attributed to the no diffusion of the immobility of the Hf atoms and to the easy diffusion of oxygen atoms through the ferritic matrix. No hafnium was found in the matrix and hafnium was exclusively present in carbides. Since the later are particularly stable no move from carbides to matrix is possible. During the oxidation test a part of oxygen diffused in the not compact ferritic matrix as well as along the interdendritic spaces, and formed preferentially hafnium carbides. HfC were thus replaced by HfO2 in situ, over a depth increasing with time. The penetration of internal oxidation was obviously accelerated in case of dense HfC carbides as is to say for the FeHf2-2 alloy which presents simultaneously the highest carbon content and the highest hafnium content.
The HfC carbide network was obviously unchanged after almost fifty hours of exposure at 1200°C. This is due to the good stability at high temperature, which is much better than the chromium carbides one (chromium carbides have totally changed from their as-cast shape) and also better than the TaC carbides one (which generally tends to be more fragmented). Except in the subsurface over a depth of about 250µm no internal oxides replaced the hafnium carbides in the FeHf1 and FeHf2-1 alloys. In contrast, some HfO2 were seen among the HfC carbides in the bulk of the FeHf2-2 alloy. This may have (limited) effect on the mechanical behavior of the latter alloy, at high temperaturte as well as at medium and room temperatures (a little lack of ductility can be expected).

6
CONCLUSION
Such HfC-containing iron-based alloys are potentially very interesting since the HfC carbides present characteristics (interdendritic repartition, script-like shape mixed with the matrix… to add to the high refractoriness of such alloys) favoring high mechanical strength at high temperature such as creep-resistance. However, as the equivalent cobalt-based alloys with the same chromium, carbon and hafnium contents, they are obviously threatened by possible catastrophically oxidation, the first steps of which were observed here after only 46 hours of exposure to air at 1200°C. Modifications are required to improve their resistance against high temperature, such as Cr-enrichment of the bulk or surface Cr-enrichment by coatings (e.g. pack cementation). In a first time such improvements of the high temperature oxidation behavior will allow experimentally verifying their supposed high mechanical characteristics at high temperature. This can be the subject of further investigations.
ACKNOWLEDGMENTS
The authors wish to thank Sandrine Mathieu for the electron microscopy characterizations and Pascal Villeger for the X-Ray Diffraction runs.
REFERENCES
1. D. Young, High Temperature Oxidation and Corrosion of Metals, Amsterdam: Elsevier Corrosion Series, 2008.
2. M. J. Donachie, S. J. Donachie, Superalloys: A Technical Guide (2nd Edition), Materials Park: ASM International, 2002.
3. S. Vasseur, “Nickel alloy for centrifugal spinning apparatus for manufacture of glass fibers”, European Patent EP 511099 A1 19921028 (1992).
4. P. Berthod, Journal of Alloys and Compounds, 481, 746 (2009). 5. P. Berthod, Y. Hamini, L. Aranda, L. Héricher, Calphad, 31, 351 (2007). 6. K. Bouhanek, D. Oquab, B. Pieraggi, Materials Science Forum, 251-254, 33 (1997). 7. E. Nold, G. Ondracek, Praktische Metallographie, 23(6), 268 (1986). 8. Y. G. Kim, Journal of Materials Science, 13(4), 759 (1978). 9. W. R. Witzke, Metallurgical Transactions A: Physical Metallurgy and Materials Science, 7A(3), 443
(1976). 10. B. L. Chen, A. Luo, K. S. Shin, D. L. Jacobson, Refract. Metal. : State-of-the-Art, Proc. Symp. TMS Fall
Meet. 65 (1989). 11. P. Berthod, Materials Science: An Indian Journal, 9(12), 453 (2013). 12. P. Berthod, Oxidation of Metals 64(3/4), 235 (2005). 13. P. Berthod, Oxidation of Metals 68(1/2), 77 (2007). 14. E. Conrath, P. Berthod, Corrosion Engineering Science and Technology, 49(1), 45 (2014). 15. E. Conrath, P. Berthod, Oxidation of Metals, in press, available on-line (DOI 10.1007/s11085-013-9449-0)
7
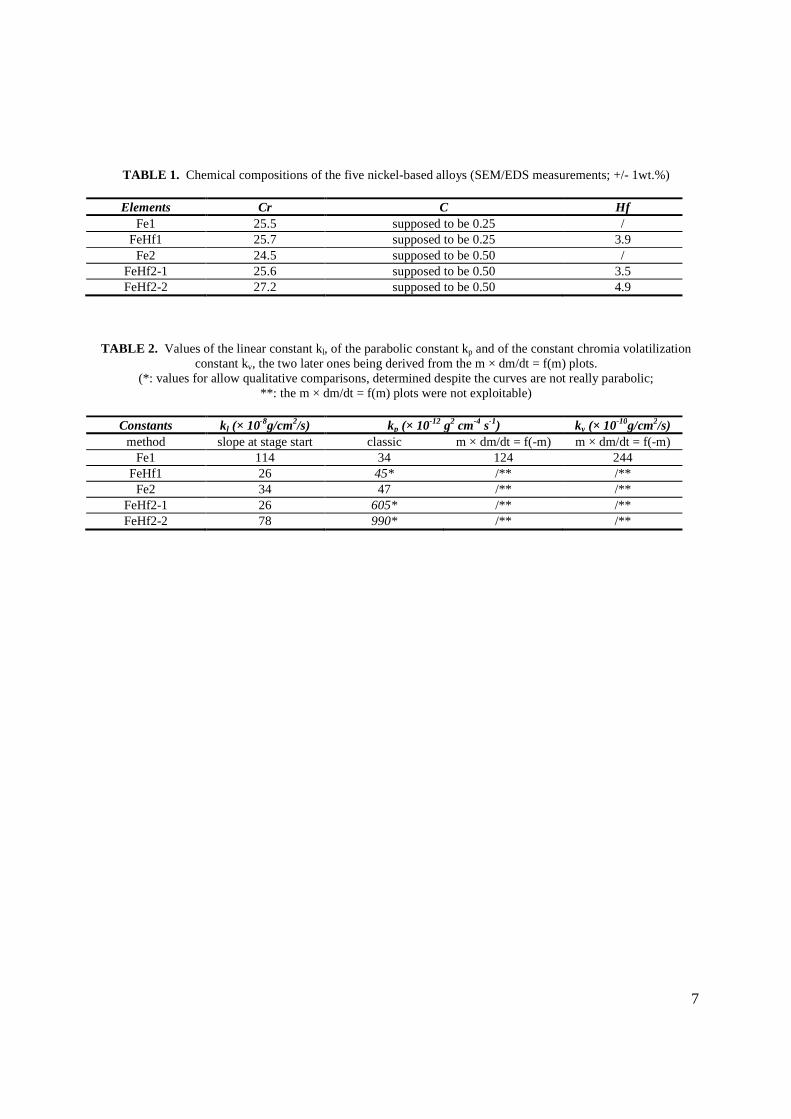
TABLE 1. Chemical compositions of the five nickel-based alloys (SEM/EDS measurements; +/- 1wt.%)
Elements Cr C Hf
Fe1 25.5 supposed to be 0.25 / FeHf1 25.7 supposed to be 0.25 3.9 Fe2 24.5 supposed to be 0.50 /
FeHf2-1 25.6 supposed to be 0.50 3.5 FeHf2-2 27.2 supposed to be 0.50 4.9
TABLE 2. Values of the linear constant kl, of the parabolic constant kp and of the constant chromia volatilization constant kv, the two later ones being derived from the m × dm/dt = f(m) plots.
(*: values for allow qualitative comparisons, determined despite the curves are not really parabolic; **: the m × dm/dt = f(m) plots were not exploitable)
Constants kl (× 10-8g/cm2/s) kp (× 10-12 g2 cm-4 s-1) kv (× 10-10g/cm2/s)
method slope at stage start classic m × dm/dt = f(-m) m × dm/dt = f(-m) Fe1 114 34 124 244
FeHf1 26 45* /** /** Fe2 34 47 /** /**
FeHf2-1 26 605* /** /** FeHf2-2 78 990* /** /**
8
FIGURE 1. SEM/BSE micrographs of the as-cast microstructures of the five studied iron-based alloys

9
FIGURE 2. The mass gain curves obtained for the two 0.25C-containing alloys

10
FIGURE 3. The mass gain curves obtained for the three 0.50C-containing alloys

11
0
0,0005
0,001
0,0015
0,002
0,0025
0,003
0,0035
0 50000 100000 150000 200000
mas
s ga
in (
g/cm
2)
time (s)
exp
classic Kp
Kp-Kv
y = 2,44E-08x + 1,24E-10
0,00E+005,00E-111,00E-101,50E-102,00E-102,50E-103,00E-103,50E-104,00E-104,50E-10
-0,005 -0,004 -0,003 -0,002 -0,001 0
m*(
dm/d
t) (
g2/c
m4/
s)
- m (g/cm2)
A
B
FIGURE 4. Treatment according to the {m × dm/dt = Kp – K × m} method of the mass gain results obtained for
the Fe1 alloy oxidized at 1200°C (A); of test of Kp value classically determined and of a (Kp, Kv) couple of values issued from the treatment done above

12
FIGURE 5. Aspects of the oxidized alloys after return to room temperature

13
Lin
(Cou
nts)
0
1000
2000
3000
4000
2-Theta - Scale
4 10 20 30 40 50 60 70 80 90
Fe
2O
3C
r 2O
3(F
e,
Cr)
2O
3
Cr 2
O3
Cr 2
O3
Cr 2
O3
Cr 2
O3
Cr 2
O3
Cr 2
O3
Cr 2
O3
Fe
2O
3(F
e,
Cr)
2O
3
(Fe
, C
r)2O
3
(Fe
, C
r)2O
3F
e2O
3
Fe2 after 46h 1200°C
Fe
2O
3
Fe
2O
3
Fe
2O
3(F
e,
Cr)
2O
3
(Fe
, C
r)2O
3
(Fe
, C
r)2O
3
(Fe
, C
r)2O
3Fe
2O
3
Fe
2O
3(F
e,
Cr)
2O
3
Fe
2O
3(F
e,
Cr)
2O
3
FIGURE 6. Diffractogram of the Fe2 alloy after 46h of oxidation at 1200°C
Lin
(Cou
nts)
0
100
200
300
400
500
600
700
800
900
1000
1100
1200
1300
1400
1500
1600
1700
2-Theta - Scale
4 10 20 30 40 50 60 70 80 90
HfO
2
HfO
2
HfO
2
Fe
2O
3 Fe
2O
3
Fe
2O
3
Fe
2O
3
Fe
2O
3
Fe
2O
3
Fe
2O
3Fe
2O
3
Fe
2O
3
Cr 2
O3
Cr 2
O3
Cr 2
O3 C
r 2O
3
Cr 2
O3
Cr 2
O3
Cr 2
O3
Fe2-1 after 46h 1200°C
Fe
2O
3
Fe
2O
3
Fe
2O
3
Fe
2O
3
Fe
2O
3
FIGURE 7. Diffractogram of the Fe2-1 alloy after 46h of oxidation at 1200°C

14
FIGURE 8. Optical micrographs (FeHf1sample not etched) showing regions quickly oxidized, regions slowly oxidized and the depth of internal oxidation
FIGURE 9. SEM/BSE micrograph of the oxidized surface of the FeHf1 alloy with the oxide identification

15
FIGURE 10. SEM/BSE micrograph of the oxidized surface of the FeHf2-1 alloy with the oxide identification
FIGURE 11. SEM/BSE micrograph of the oxidized surface of the FeHf2-2 alloy with the oxide identification

16
0
5
10
15
20
25
Fe1 Fe2 FeHf1-1 FeHf2-1 FeHf2-2
Ox
ide
sca
le t
hic
kn
ess
(µ
m)
alloys
FIGURE 12. Thickness of the external oxide scale for all the alloys (average ± standard deviation)
0
250
500
750
1000
1250
1500
1750
2000
Fe1 Fe2 FeHf1-1 FeHf2-1 FeHf2-2
Inte
rna
l o
xid
ati
on
de
pth
(µ
m)
alloys
all the
sample’s
thickness
FIGURE 13. Depth of the internal oxidation zone for all the alloys (average ± standard deviation)

17
FIGURE 14. SEM/BSE micrographs of the bulk microstructures of the FeHf1 alloy after exposure at 1200°C for
46 hours (two magnifications)
FIGURE 15. SEM/BSE micrographs of the bulk microstructures of the FeHf2-1 alloy after exposure at 1200°C for
46 hours (two magnifications)
FIGURE 16. SEM/BSE micrographs of the bulk microstructures of the FeHf2-2 alloy after exposure at 1200°C for
46 hours (two magnifications)


![[1962] the Oxidation of Iron-chromium Alloys and Stainless Steels at High Temperatures](https://static.fdocuments.net/doc/165x107/542d0124219acd4d4b8b4ef4/1962-the-oxidation-of-iron-chromium-alloys-and-stainless-steels-at-high-temperatures.jpg)