HIGH TEMPERATURE DEFORMATION BEHAVIOR OF … · HIGH TEMPERATURE DEFORMATION BEHAVIOR OF PHYSICAL...
15
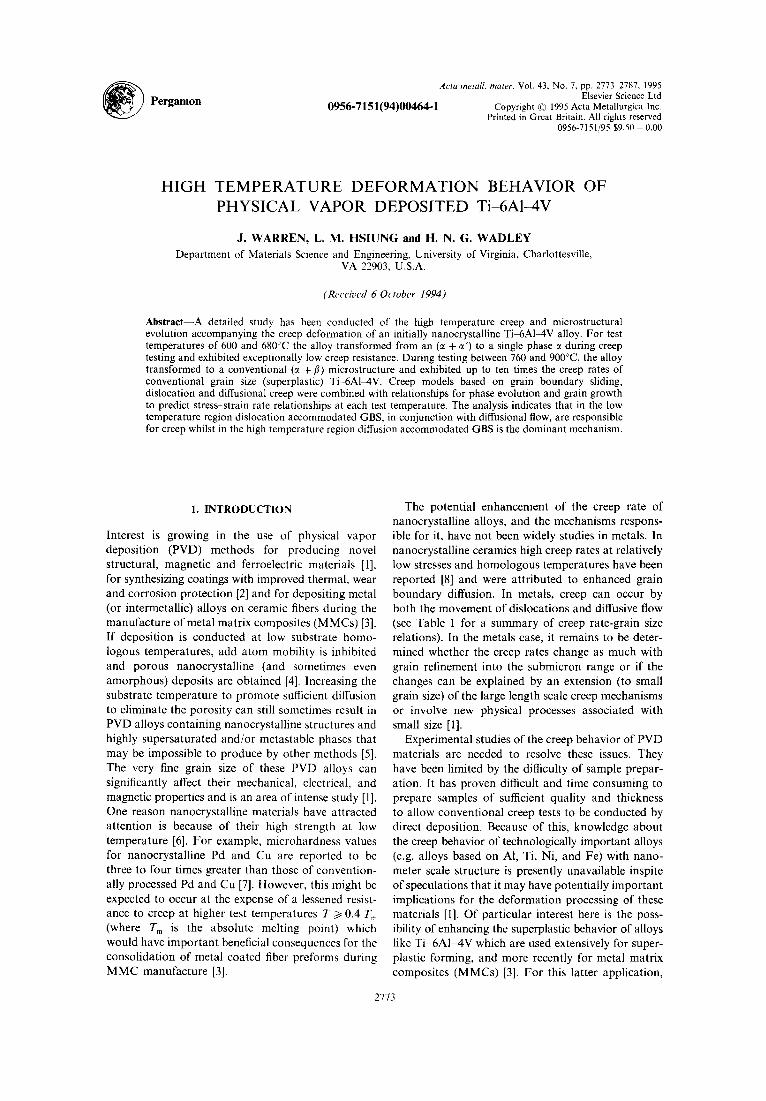
~ ) Pergamon Acta metall, mater. Vol. 43, No. 7, pp. 2773 2787, 1995 Elsevier ScienceLtd 0956-7151(94)00464-1 Copyright © 1995Acta MetallurgicaInc. Printed in Great Britain.All rights reserved 0956-7151/95 $9.50+ 0.00 HIGH TEMPERATURE DEFORMATION BEHAVIOR OF PHYSICAL VAPOR DEPOSITED Ti-6A1-4V J. WARREN,L. M. HSIUNG and H. N. G. WADLEY Department of Materials Science and Engineering, University of Virginia, Charlottesville, VA 22903, U.S.A. (Received 6 October 1994) Abstract--A detailed study has been conducted of the high temperature creep and microstructural evolution accompanying the creep deformation of an initially nanocrystalline Ti~AIMV alloy. For test temperatures of 600 and 680"~C the alloy transformed from an (c~ + ct') to a single phase e during creep testing and exhibited exceptionally low creep resistance. During testing between 760 and 900°C, the alloy transformed to a conventional (ct +/~) microstructure and exhibited up to ten times the creep rates of conventional grain size (superplastic) Ti-6AI~4V. Creep models based on grain boundary sliding, dislocation and diffusional creep were combined with relationships for phase evolution and grain growth to predict stress-strain rate relationships at each test temperature. The analysis indicates that in the low temperature region dislocation accommodated GBS, in conjunction with diffusional flow, are responsible for creep whilst in the high temperature region diffusion accommodated GBS is the dominant mechanism. 1. INTRODUCTION Interest is growing in the use of physical vapor deposition (PVD) methods for producing novel structural, magnetic and ferroelectric materials [1], for synthesizing coatings with improved thermal, wear and corrosion protection [2] and for depositing metal (or intermetallic) alloys on ceramic fibers during the manufacture of metal matrix composites (M MCs) [3]. If deposition is conducted at low substrate homo- logous temperatures, add atom mobility is inhibited and porous nanocrystalline (and sometimes even amorphous) deposits are obtained [4]. Increasing the substrate temperature to promote sufficient diffusion to eliminate the porosity can still sometimes result in PVD alloys containing nanocrystalline structures and highly supersaturated and/or metastable phases that may be impossible to produce by other methods [5]. The very fine grain size of these PVD alloys can significantly affect their mechanical, electrical, and magnetic properties and is an area of intense study [1]. One reason nanocrystalline materials have attracted attention is because of their high strength at low temperature [6]. For example, microhardness values for nanocrystalline Pd and Cu are reported to be three to four times greater than those of convention- ally processed Pd and Cu [7]. However, this might be expected to occur at the expense of a lessened resist- ance to creep at higher test temperatures T/> 0.4 T m (where Tm is the absolute melting point) which would have important beneficial consequences for the consolidation of metal coated fiber preforms during MMC manufacture [3]. The potential enhancement of the creep rate of nanocrystalline alloys, and the mechanisms respons- ible for it, have not been widely studies in metals. In nanocrystalline ceramics high creep rates at relatively low stresses and homologous temperatures have been reported [8] and were attributed to enhanced grain boundary diffusion. In metals, creep can occur by both the movement of dislocations and diffusive flow (see Table 1 for a summary of creep rate-grain size relations). In the metals case, it remains to be deter- mined whether the creep rates change as much with grain refinement into the submicron range or if the changes can be explained by an extension (to small grain size) of the large length scale creep mechanisms or involve new physical processes associated with small size [1]. Experimental studies of the creep behavior of PVD materials are needed to resolve these issues. They have been limited by the difficulty of sample prepar- ation. It has proven difficult and time consuming to prepare samples of sufficient quality and thickness to allow conventional creep tests to be conducted by direct deposition. Because of this, knowledge about the creep behavior of technologically important alloys (e.g. alloys based on AI, Ti, Ni, and Fe) with nano- meter scale structure is presently unavailable inspite of speculations that it may have potentially important implications for the deformation processing of these materials [1]. Of particular interest here is the poss- ibility of enhancing the superplastic behavior of alloys like Ti-6A1-4V which are used extensively for super- plastic forming, and more recently for metal matrix composites (MMCs) [3]. For this latter application, 2773
Transcript of HIGH TEMPERATURE DEFORMATION BEHAVIOR OF … · HIGH TEMPERATURE DEFORMATION BEHAVIOR OF PHYSICAL...
~ ) Pergamon Acta metall, mater. Vol. 43, No. 7, pp. 2773 2787, 1995
Elsevier Science Ltd 0956-7151(94)00464-1 Copyright © 1995 Acta Metallurgica Inc.
Printed in Great Britain. All rights reserved 0956-7151/95 $9.50 + 0.00
HIGH T E M P E R A T U R E D E F O R M A T I O N BEHAVIOR OF PHYSICAL VAPOR DEPOSITED Ti-6A1-4V
J. WARREN, L. M. HSIUNG and H. N. G. WADLEY Department of Materials Science and Engineering, University of Virginia, Charlottesville,
VA 22903, U.S.A.
(Received 6 October 1994)
Abstract--A detailed study has been conducted of the high temperature creep and microstructural evolution accompanying the creep deformation of an initially nanocrystalline Ti~AIMV alloy. For test temperatures of 600 and 680"~C the alloy transformed from an (c~ + ct') to a single phase e during creep testing and exhibited exceptionally low creep resistance. During testing between 760 and 900°C, the alloy transformed to a conventional (ct +/~) microstructure and exhibited up to ten times the creep rates of conventional grain size (superplastic) Ti-6AI~4V. Creep models based on grain boundary sliding, dislocation and diffusional creep were combined with relationships for phase evolution and grain growth to predict stress-strain rate relationships at each test temperature. The analysis indicates that in the low temperature region dislocation accommodated GBS, in conjunction with diffusional flow, are responsible for creep whilst in the high temperature region diffusion accommodated GBS is the dominant mechanism.
1. INTRODUCTION
Interest is growing in the use of physical vapor deposition (PVD) methods for producing novel structural, magnetic and ferroelectric materials [1], for synthesizing coatings with improved thermal, wear and corrosion protection [2] and for depositing metal (or intermetallic) alloys on ceramic fibers during the manufacture of metal matrix composites (M MCs) [3]. If deposition is conducted at low substrate homo- logous temperatures, add atom mobility is inhibited and porous nanocrystalline (and sometimes even amorphous) deposits are obtained [4]. Increasing the substrate temperature to promote sufficient diffusion to eliminate the porosity can still sometimes result in PVD alloys containing nanocrystalline structures and highly supersaturated and/or metastable phases that may be impossible to produce by other methods [5]. The very fine grain size of these PVD alloys can significantly affect their mechanical, electrical, and magnetic properties and is an area of intense study [1]. One reason nanocrystalline materials have attracted attention is because of their high strength at low temperature [6]. For example, microhardness values for nanocrystalline Pd and Cu are reported to be three to four times greater than those of convention- ally processed Pd and Cu [7]. However, this might be expected to occur at the expense of a lessened resist- ance to creep at higher test temperatures T/> 0.4 T m
(where T m is the absolute melting point) which would have important beneficial consequences for the consolidation of metal coated fiber preforms during MMC manufacture [3].
The potential enhancement of the creep rate of nanocrystalline alloys, and the mechanisms respons- ible for it, have not been widely studies in metals. In nanocrystalline ceramics high creep rates at relatively low stresses and homologous temperatures have been reported [8] and were attributed to enhanced grain boundary diffusion. In metals, creep can occur by both the movement of dislocations and diffusive flow (see Table 1 for a summary of creep rate-grain size relations). In the metals case, it remains to be deter- mined whether the creep rates change as much with grain refinement into the submicron range or if the changes can be explained by an extension (to small grain size) of the large length scale creep mechanisms or involve new physical processes associated with small size [1].
Experimental studies of the creep behavior of PVD materials are needed to resolve these issues. They have been limited by the difficulty of sample prepar- ation. It has proven difficult and time consuming to prepare samples of sufficient quality and thickness to allow conventional creep tests to be conducted by direct deposition. Because of this, knowledge about the creep behavior of technologically important alloys (e.g. alloys based on AI, Ti, Ni, and Fe) with nano- meter scale structure is presently unavailable inspite of speculations that it may have potentially important implications for the deformation processing of these materials [1]. Of particular interest here is the poss- ibility of enhancing the superplastic behavior of alloys like Ti-6A1-4V which are used extensively for super- plastic forming, and more recently for metal matrix composites (MMCs) [3]. For this latter application,
2773
2774 WARREN et al.: HIGH TEMPERATURE DEFORMATION OF Ti~fAI~4V
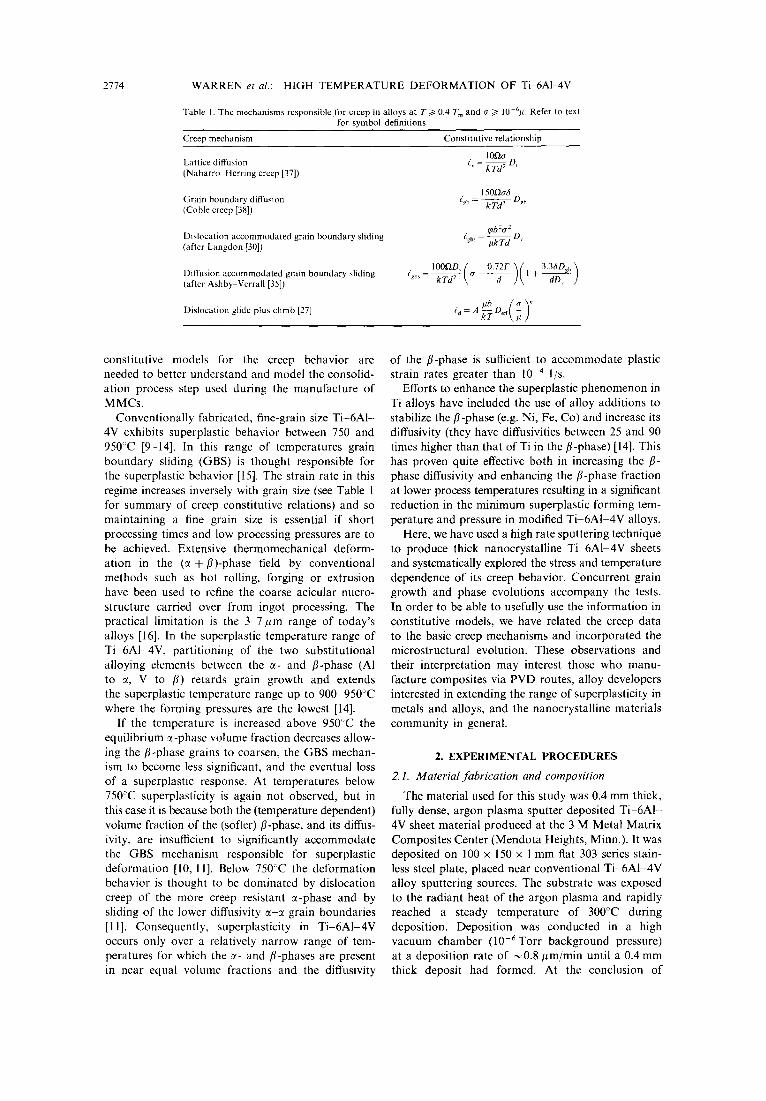
Table 1. The mechanisms responsible for creep in alloys at T//- 0.4 T~ and a t> 10-6#. Refer to text for symbol definitions
Creep mechanism Constitutive relationship
Lattice diffusion (Nabarro Herring creep [37])
Grain boundary diffusion (Coble creep [38])
Dislocation accommodated grain boundary sliding (atter Langdon [30])
Diffusion accommodated grain boundary sliding (after Ashby Verrall [35])
Dislocation glide-plus-climb [27]
I Oflo- d~ = k Td2 D~
150~a6 ~gb = ~ Dgb
~/320 -2 ~gbs = ~ k T d D~
% ~ = ~ - i <" 1 + - - ~ ~ - )
#b / a \"
constitutive models for the creep behavior are needed to better understand and model the consolid- ation process step used during the manufacture of MMCs.
Conventionally fabricated, fine-grain size Ti-6AI- 4V exhibits superplastic behavior between 750 and 950°C [9-14]. In this range of temperatures grain boundary sliding (GBS) is thought responsible for the superplastic behavior [15]. The strain rate in this regime increases inversely with grain size (see Table 1 for summary of creep constitutive relations) and so maintaining a fine grain size is essential if short processing times and low processing pressures are to be achieved. Extensive thermomechanical deform- ation in the (~ +/3)-phase field by conventional methods such as hot rolling, forging or extrusion have been used to refine the coarse acicular micro- structure carried over from ingot processing. The practical limitation is the 3-7/xm range of today's alloys [16]. In the superplastic temperature range of Ti 6AI-4V, partitioning of the two substitutional alloying elements between the ~- and /3-phase (A1 to a, V to /3) retards grain growth and extends the superplastic temperature range up to 900-950°C where the forming pressures are the lowest [14].
If the temperature is increased above 950°C the equilibrium ~-phase volume fraction decreases allow- ing the fl-phase grains to coarsen, the GBS mechan- ism to become less significant, and the eventual loss of a superplastic response. At temperatures below 750°C superplasticity is again not observed, but in this case it is because both the (temperature dependent) volume fraction of the (softer)/3-phase, and its diffus- ivity, are insufficient to significantly accommodate the GBS mechanism responsible for superplastic deformation [10, 11]. Below 750°C the deformation behavior is thought to be dominated by dislocation creep of the more creep resistant ~-phase and by sliding of the lower diffusivity c~-~ grain boundaries [11]. Consequently, superplasticity in Ti-6AI-4V occurs only over a relatively narrow range of tem- peratures for which the z~- and /3-phases are present in near equal volume fractions and the diffusivity
of the fl-phase is sufficient to accommodate plastic strain rates greater than 10 -4 1/s.
Efforts to enhance the superplastic phenomenon in Ti alloys have included the use of alloy additions to stabilize the/7-phase (e.g. Ni, Fe, Co) and increase its diffusivity (they have diffusivities between 25 and 90 times higher than that of Ti in the fl-phase) [14]. This has proven quite effective both in increasing the /3- phase diffusivity and enhancing the/3-phase fraction at lower process temperatures resulting in a significant reduction in the minimum superplastic forming tem- perature and pressure in modified Ti-6AI-4V alloys.
Here, we have used a high rate sputtering technique to produce thick nanocrystalline Ti-6AI-4V sheets and systematically explored the stress and temperature dependence of its creep behavior. Concurrent grain growth and phase evolutions accompany the tests. In order to be able to usefully use the information in constitutive models, we have related the creep data to the basic creep mechanisms and incorporated the microstructural evolution. These observations and their interpretation may interest those who manu- facture composites via PVD routes, alloy developers interested in extending the range of superplasticity in metals and alloys, and the nanocrystalline materials community in general.
2. E X P E R I M E N T A L P R O C E D U R E S
2.1. Ma te r ia l f abr i ca t ion and composi t ion
The material used for this study was 0.4 mm thick, fully dense, argon plasma sputter deposited Ti-6A1- 4V sheet material produced at the 3 M Metal Matrix Composites Center (Mendota Heights, Minn.). It was deposited on 100 x 150 × I mm fiat 303 series stain- less steel plate, placed near conventional Ti-6A1-4V alloy sputtering sources. The substrate was exposed to the radiant heat of the argon plasma and rapidly reached a steady temperature of 300°C during deposition. Deposition was conducted in a high vacuum chamber (10-6Torr background pressure) at a deposition rate of ~ 0 . 8 / ~ m / m i n until a 0.4 mm thick deposit had formed. At the conclusion of
WARREN et al.: HIGH TEMPERATURE DEFORMATION OF Ti~AI~,V 2775
Table 2. Chemical composi t ion o f T i 6AI 4V alloy sourcc and P V D sheet
Element Source (%wt) PVD sheet (%wt) AI 6.00 5.70 V 4.00 3.90 Ga ~ 0.20 0.19 Fe" 0.18 0.23 0:3 0.176/0.178 0.188/0.189 N 2 0.0148/0.0163 0.0138/0.0139 Ti balance balance
~Weak c~-phase stabilizer, solid solution strengthener. 2//-phase stabilizer. 3Potent 7-phase stabilizer, 0.2 maximum allowable concentration.
deposition, the vacuum chamber was purged with argon and allowed to cool. The thermal expansion mismatch between the deposited Ti-alloy sheet and the stainless steel plate conveniently caused the sheet to debond from its substrate upon cooling. Chemical analyses of the source sputter deposited materials were performed (Table 2). They indicated little influ- ence of the vapor deposition process on the sheet composition.
2.2. Creep testing method
For tension tests, strips 10 mm wide and 150ram long were cut from the PVD sheet using computer controlled wire electronic discharge machining. To facilitate gripping of the tensile specimens, the ends of the strips were sandwiched between 65 × l0 × 1.5 mm conventional Ti-6AI-4V tabs and spot-welded together. This resulted in a specimen gauge length of 20 ram. Specimens in the as-deposited microstructural state were then used to investigate the creep behavior. Constant load, isothermal creep tests, were conducted in a 99.97% purity flowing argon atmosphere at five test temperatures of 600, 680, 760, 840 and 900~C. The load for creep testing this material was applied directly to the specimen by a load train mechanism capable of applying small fixed loads (18-140 kN). The creep test assembly was contained within a single zone, programmable furnace housed in a ceramic retort. The furnace had a 300 mm long constant temperature hot zone. A low heating rate of 5°C/rain to the test temperature was necessary to avoid thermal shock of the ceramic retort assembly. During speci- men testing the temperature was monitored by two type K thermocouples mechanically attached to the upper and lower ends of the specimens' effective gauge length. A maximum temperature difference of 4°C was observed between the thermocouples at the test temperatures. Because of the slow heating rate, the specimen temperature stabilized within approx. 2 min of reaching the preprogrammed temperature setting. The load was then applied 1 rain after tem- perature stabilization (thus each specimen was exposed to a 3 rain soak at temperature prior to testing). To obtain isothermal strain rate data over a range of stresses, creep tests were conducted at progressively higher fixed loads using a new specimen for each test.
Instantaneous gauge length extension was measured using a molybdenum alloy extensometer outfitted with
a linearly variable capacitive transducer (LVCT). The transducer could repeatably resolve a 0.0005 engineering strain in the 20 mm specimen gauge length. The high measurement accuracy of this transducer enabled calculation of instantaneous gauge cross section and therefore true flow stress from instan- taneous gauge length extension (assuming volume constancy). The true stress (a) and the point of minimum true strain (~min) were then obtained for each test together with the time to reach the minimum strain rate. For these tests the true strain, at the onset of the minimum true strain rate, was between 3 and 4%. Each creep test conducted at a fixed temperature yielded a single data point on long a vs log Emin plot.
2.3. Microstructural characterization
Microstructural evolution accompanied each creep test. To characterize it, samples were annealed at each of the five creep test temperatures (600, 680, 760, 840, 900°C) for a range of times spanning those required to reach the minimum strain rate during the creep tests. The samples were enclosed in evacuated quartz ampoules, heated at 5°C/rain to the annealing temperature and water quenched to preserve the microstructural features present at the annealing temperature. The quenched specimens were then mounted in epoxy, polished and etched (with Kroll's reagent) and the average grain size for each test tem- perature measured using the Hilliard circle technique [17]. Grain size information was obtained for the as received state and after annealing at the two lowest test temperatures using transmission electron micros- copy (TEM) on specimen coupons annealed between 1 and 1.8 x 10⁴min (310 h). For the higher test tem- peratures the grain size was sufficient to be reliably resolved using SEM micrographs. X-ray diffraction (XRD) patterns and selected area diffraction (SAD) patterns were also taken to determine the phase(s) present. In addition, specimens were analyzed in the TEM after testing to determine the presence and arrangement of dislocations in the gauge sections and determine the effect of strain on the microstructure.
3. PVD M I C R O S T R U C T U R E S
XRD of the PVD material in the as-deposited condition indicated it had a HCP crystal structure. A TEM micrograph of this mierostructure is shown in Fig. 1. TEM analysis indicated the presence of two components of the microstructure; an (HCP) ~-phase and a martensitic (HCP) ~'-phase. The presence of ~' in the microstructure is not unreasonable consider- ing that (1) vanadium supersaturated ~ transforms martensitically to ~' during water quenching in conventional Ti-6AI-4V [18]; and (2) deposition from the vapor phase onto a relatively cold substrate involves cooling rates many orders of magnitude greater than liquid-quenching (vapor quenching is estimated to have cooling rates of 10 ~3 °K/s, liquid- quenching has substantially lower rates of 104-10 s
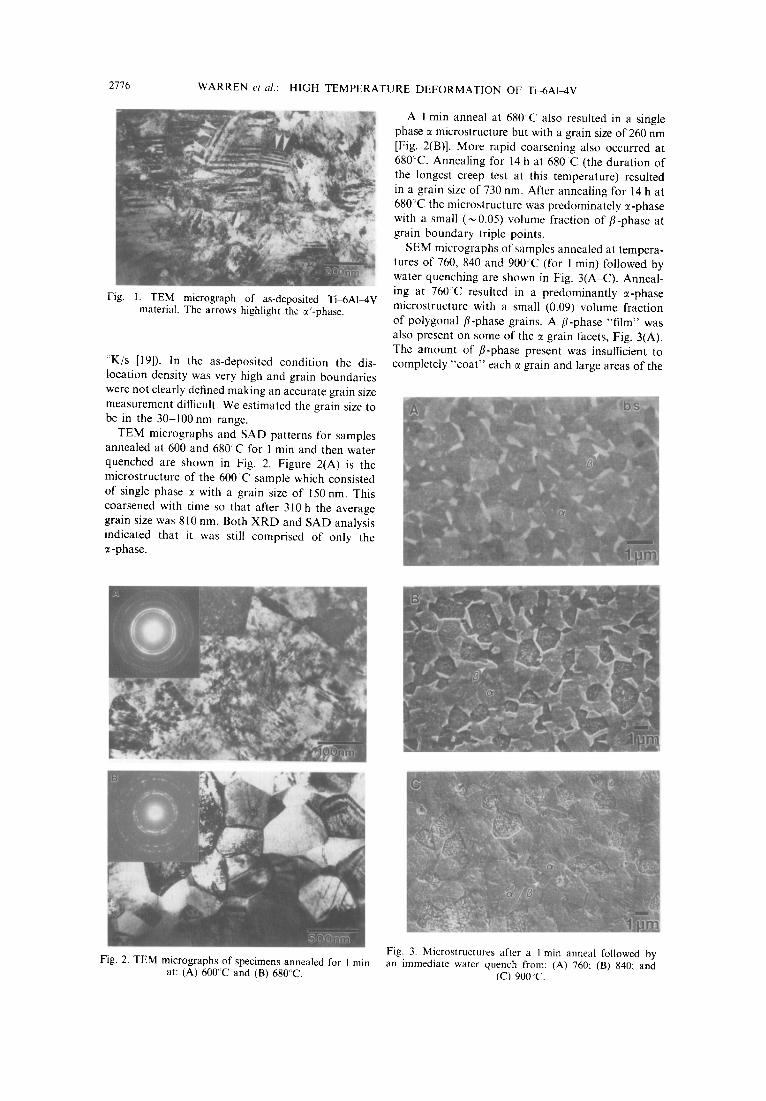
2776 WARREN et al.: HIGH TEMPERATURE DEFORMATION OF Ti--6AI4V
Fig. I. TEM micrograph of as-deposited Ti~6AI~4V material. The arrows highlight the :~'-phase.
°K/s [19]). In the as-deposited condition the dis- location density was very high and grain boundaries were not clearly defined making an accurate grain size measurement difficult. We estimated the grain size to be in the 30-100 nm range.
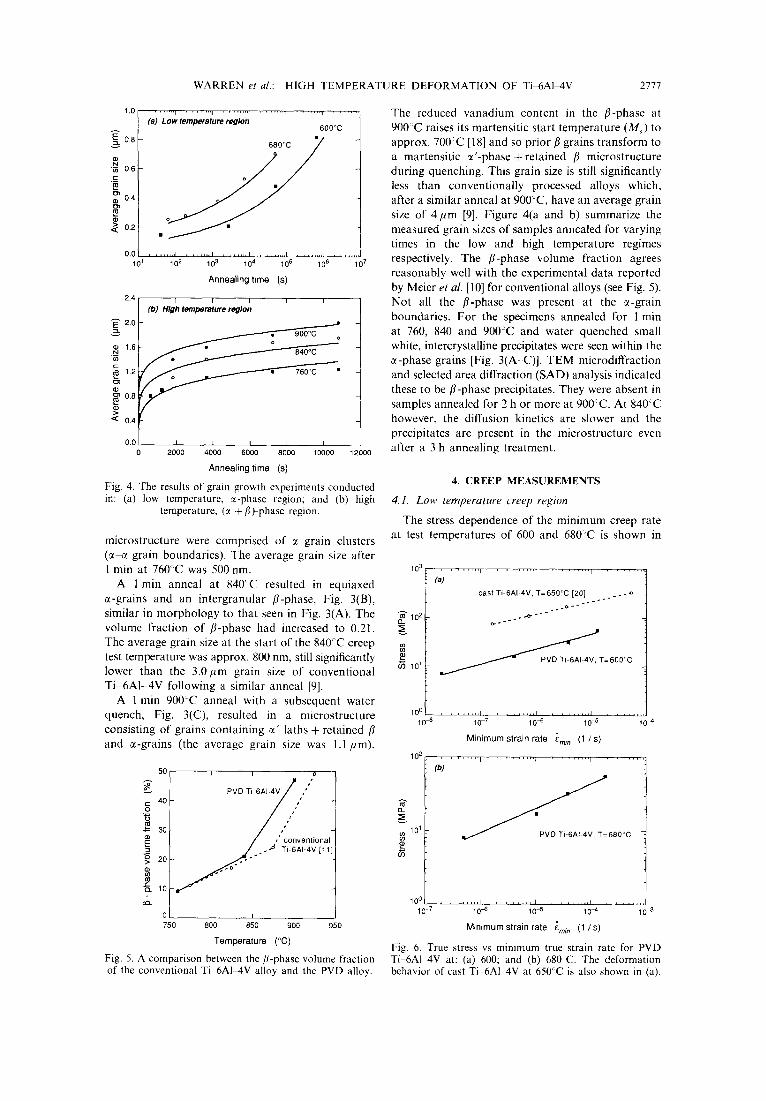
TEM micrographs and SAD patterns for samples annealed at 600 and 6 8 0 C for 1 min and then water quenched are shown in Fig. 2. Figure 2(A) is the microstructure of the 6 0 0 C sample which consisted of single phase :~ with a grain size of 150 nm. This coarsened with time so that after 310 h the average grain size was 810 nm. Both X R D and SAD analysis indicated that it was still comprised of only the
-phase.
Fig. 2. TEM micrographs of specimens annealed for 1 min at: (A) 600'C and (B) 680C.
A 1 min anneal at 680~C also resulted in a single phase ~ microstructure but with a grain size of 260 nm [Fig. 2(B)]. More rapid coarsening also occurred at 680°C. Annealing for 14 h at 6 8 0 C (the duration of the longest creep test at this temperature) resulted in a grain size of 730 nm. After annealing for 14 h at 680°C the microstructure was predominately c~-phase with a small (~0.05) volume fraction of fl-phase at grain boundary triple points.
SEM micrographs of samples annealed at tempera- tures of 760, 840 and 900~C (for 1 min) followed by water quenching are shown in Fig. 3(A-C). Anneal- ing at 760"C resulted in a predominantly a-phase microstructure with a small (0.09) volume fraction of polygonal fl-phase grains. A fi-phase "f i lm" was also present on some of the e grain facets, Fig. 3(A). The amount of fl-phase present was insufficient to completely "coa t" each ~ grain and large areas of the
Fig. 3. Microstructures after a 1 min anneal followed by an immediate water quench from: (A) 760; (B) 840; and
(C) 900 ~C.
WARREN et al.: HIGH TEMPERATURE DEFORMATION OF Ti~iAl~,V 2777
1.0
E• 0.8
" N 0,6 .E
o~ 0.4
< 0.2
0.0 101
2.4
. . . . . . . . I . . . . . . . . I . . . . . . . . ~ . . . . . . . . l . . . . . . . . l . . . . . . .
(a) LOW temperature region 600°C
..... . . . I ........ I ........ I ........ I . . . . . . . . [ . . . . . . 102 103 104 105 106 107
Annealing time (s)
~ 2 . 0
~ 1 . 6
c " ~ 1 . 2
~ 0 . 8
~ : 0.4
0 . 0
] I I T I
(b) H i g h t e m p e r a t u r e r e g i o n
I 40100 I I 0 I 2000 6000 80 0 10000 t2000
Annealing time (s)
Fig. 4. The results of grain growth experiments conducted in: (a) low temperature, ~-phase region; and (b) high
temperature, (~ +/~)-phase region.
microstructure were comprised of ~ grain clusters (~ c< grain boundaries). The average grain size after 1 rain at 760°C was 500 nm.
A 1 min anneal at 840~C resulted in equiaxed ~-grains and an intergranular ~-phase, Fig. 3(B), similar in morphology to that seen in Fig. 3(A). The volume fraction o f / / -phase had increased to 0.21. The average grain size at the start of the 840~C creep test temperature was approx. 800 nm, still significantly lower than the 3.0pro grain size of conventional Ti 6Al-4V following a similar anneal [9].
A 1 rain 9 0 0 C anneal with a subsequent water quench, Fig. 3(C), resulted in a microstructure consisting of grains containing c~' laths + retained // and c~-grains (the average grain size was 1.1 pro).
5O
E 40 g
~ 20
o . . 1 0
0
i i i p
PVD T i - ~ , ' "
~ ,d Ti _ / ~ " CO~A?,~'vO[111 ]
I I I
750 800 850 900 950
Temperature (°C)
Fig. 5. A comparison between the/~-phase volume fraction of the conventional Ti 6Al~4V alloy and the PVD alloy.
The reduced vanadium content in the //-phase at 900°C raises its martensitic start temperature (M~) to approx. 700"C [18] and so prior ,8 grains transform to a martensitic ~'-phase + retained fl microstructure during quenching, This grain size is still significantly less than conventionally processed alloys which, after a similar anneal at 900~C, have an average grain size of 4pro [9]. Figure 4(a and b) summarize the measured grain sizes of samples annealed for varying times in the low and high temperature regimes respectively. The //-phase volume fraction agrees reasonably well with the experimental data reported by Meier et al. [10] for conventional alloys (see Fig. 5). Not all the //-phase was present at the ~-grain boundaries. For the specimens annealed for 1 rain at 760, 840 and 900°C and water quenched small white, intercrystalline precipitates were seen within the
-phase grains [Fig. 3(A-C)]. TEM microdiffraction and selected area diffraction (SAD) analysis indicated these to be/ / -phase precipitates. They were absent in samples annealed for 2 h or more at 900C. At 840~C however, the diffusion kinetics are slower and the precipitates are present in the microstructure even after a 3 h annealing treatment.
4. CREEP MEASUREMENTS
4.1. L o w temperature creep region
The stress dependence of the minimum creep rate at test temperatures of 600 and 6 8 0 C is shown in
103
1o 2
P lO ~
I 0 ° 10-5
(a)
10 2
n
v f
cast Ti-6AI-4V, T= 650°C [20] . . . ,o . ° . o . o - -
°..o-- o.--"
J PVD Ti-6AI-4V, T=600°C
. . . . . i . . . . . . . . i . . . . . . . . i . . . .
10 7 10 ~ 10-5
Minimum strain rate groin (1 /S)
. . . . . I . . . . . . . . I . . . . . . . . I . . . .
~ 6 8 0 ° C
1 0 4
Fig. 6. True stress vs minimum true strain rate for PVD Ti-6AI~4V at: (a) 600; and (b) 680"C. The deformation behavior of cast Ti 6Al~4V at 650C is also shown in (a).
10 0 ........ I , , ,,,,,d , , ,,,,,d , ......
10 _7 10 ~ 10-5 10 -4 10 ~
Minimum strain rate Emi n (1 /s)
2778 WARREN et al.: HIGH TEMPERATURE DEFORMATION OF T i~AIMV
Table 3. Creep stress exponent n, strain rate sensitivity m, and temperature dependent material parameter B results for the PVD
Ti 6Al~4V alloy
Temperature Creep stress exponent n, ("C) (m - 1/n) B[1/(s MPa")]
600 3.40 (0.30) 3.6 x 10- H 680 3.00 (0.33) 1.2 x 10 9 760 1.70 (0.60) 1.6 x 10 6 840 1.34 (0.75) 1.9 x 10 5 900 1.70 (0.60) 1.2 x 10 -5
Fig. 6(a and b). respectively. Creep da ta for the
convent iona l ly processed alloy at 600°C or for any
mic ros t ruc tu re at 680uC was no t available so, for
c o m p a r i s o n purposes , the d e f o r m a t i o n behav io r o f
cast T i -6AI 4V is also s h o w n in Fig. 6(a) [20]. A least
squares analysis o f the exper imenta l da ta was used to
fit a s t ra ight line t h r o u g h the da ta po in ts
o f a log a - l o g ~min plot. The slop m defines the s train rate sensitivity
0 log a m - (1)
0 log g~,,"
The reciprocal o f m is the creep stress exponen t n in
the N o r t o n p o w e r law creep re la t ionship
g m i n = Ban (2)
where i ~ . is the m i n i m u m strain rate, a is the applied
true stress, B is a t empe ra tu r e dependen t mater ia l
pa ramete r . The exper imenta l ly de termined values o f
B, n and m for the low t empera tu re range are given
in Table 3. The low values o f m indicate tha t under
these test cond i t ions superplas t ic behav io r did no t
O c c u r .
Table 4. Experimentally determined ~'mi. values and measured times to reach i,,i. for the test temperatures and stresses used in the study. The estimated grain size at the time ~mi. was measured are also shown
Duration True of transient Grain
T stress ~'i~ creep stage size at CC) (MPa) (I.s) (min) ~ imin ( / i r a ) 2
600 54.2 1.3 x 10 5 50 0.2 600 32.0 3.9 × 10 6 117 0.3 600 15.9 4.0 z 10 7 1333 0.4 600 7.5 2.0 x 10 ~ 18,600 0.7
680 55.5 1.8 x 10 4 3 0.3 680 32.0 3.8 × 10 5 23 0.4 680 17.0 1.0 x 10 5 117 0.5 680 8.0 5.0 x 10 7 833 0.7
760 46.2 9.5 × 10 4 0.5 0.6 760 31.2 5.5 × 10 4 1.3 0.6 760 21.0 3.0 x 10 4 1.7 0.7 760 12.0 1.0 x 10 4 2.8 0.7 760 6.5 3.7 x 10 5 9.6 0.8
840 50.2 2.5 x 10 ~ 0.2 0.8 840 30.7 1.8 x 10 3 0.3 0.8 840 10.1 4.0 × I0 4 1.0 0.9 840 6.5 1.2x 10 4 1.3 0.9
900 30.7 4.2 x 10 3 0.1 1.1 900 20.2 1.6 x 10 ~ 0.3 1.1 900 10.9 6.6 x 10 4 0.7 1.2 900 5.8 2.6 x 10 a 1.3 1.2
~Each specimen held at test temperature for 3 min prior to the start of the test.
-'The effect of strain enhanced grain growth is not included.
A list o f true stresses, associa ted m i n i m u m true
s train rates and grain sizes when the m i n i m u m creep
rate was a t ta ined are given in Table 4. The du r a t i on
o f the t rans ient creep stage (i.e. the t ime to reach the
me asu r ed m i n i m u m stra in rate) is also given in the
table.
4.2. High temperature creep region
Table 3 lists the mea su r e d s t ra in rate sensitivity
values and Table 4 summar i ze s the true s t r e s s - s t r a in
rate values and grain sizes for the creep tests per-
fo rmed in the high t empera tu r e range. In the 760 to
900°C t empera tu r e range the P V D alloy de fo rmed
superplast ical ly. Tota l engineering s t ra ins in excess
of two gauge lengths were rout inely obta ined.
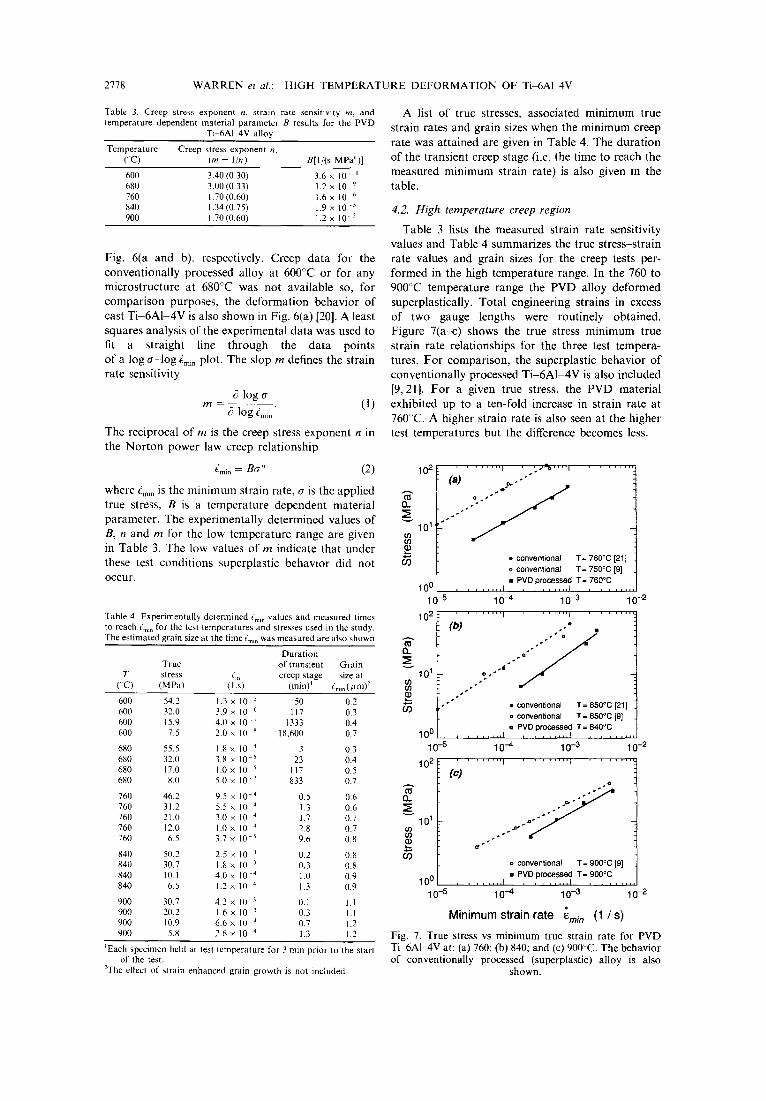
F igure 7(a-c) shows the true s t r e s s - m i n i m u m true
s t ra in rate re la t ionships for the three test t empera -
tures. F o r c o m p a r i s o n , the superplas t ic behav io r o f
convent iona l ly processed T i - 6 A 1 - 4 V is also included
[9, 21]. F o r a given true stress, the P V D mater ia l
exhibi ted up to a ten-fold increase in s t ra in rate at
760°C. A higher s t ra in rate is also seen at the h igher
test t empera tu re s bu t the difference becomes less.
102
0..
v 101 q) (t l
100 10 -5
102
13_
101 ~0 ~0
cO
10 ° 10 -5
102
101 u) o9
cO
10 ° 10 -5
. . . . . . . t " - ' ~ . . . . I . . . . . . . 1
• conven t i ona l T = 7 6 0 ° C [21] o conventional T= 750°C [9] • PVD processed T= 760°C
i i J i . . . . I , , , J . . . . I . . . . . i l l
10 ~, 10-3 10-2
• conven t i ona l T = 8 5 0 ° C [21] . conven t i ona l T = 8 5 0 ° C [9]
= P V D p r o c e s s e d T = 8 4 0 ° C . . . . . . . . I . . . . . . . . I . . . . . . .
10 -4 10 -3 10 . 2
. . . . . . . . I . . . . . . . . I . . . . . . .
(e) • o
cr o
* conven t i ona l T = 9 0 0 ° C [g]
• PVD processed T = 9 0 0 ° C . . . . . . . . I . . . . . . . . I . . . . . . .
10 -4 10 .3 10 -2
Minimum strain rate era/n (1 / s)
Fig. 7. True stress vs minimum true strain rate for PVD Ti~iAl-4V at: (a) 760; (b) 840; and (c) 900°C. The behavior of conventionally processed (superplastic) alloy is also
shown.
WARREN et al.: HIGH TEMPERATURE DEFORMATION OF Ti~AIM-V 2779
5. DEFORMATION MICROSTRUCTURES
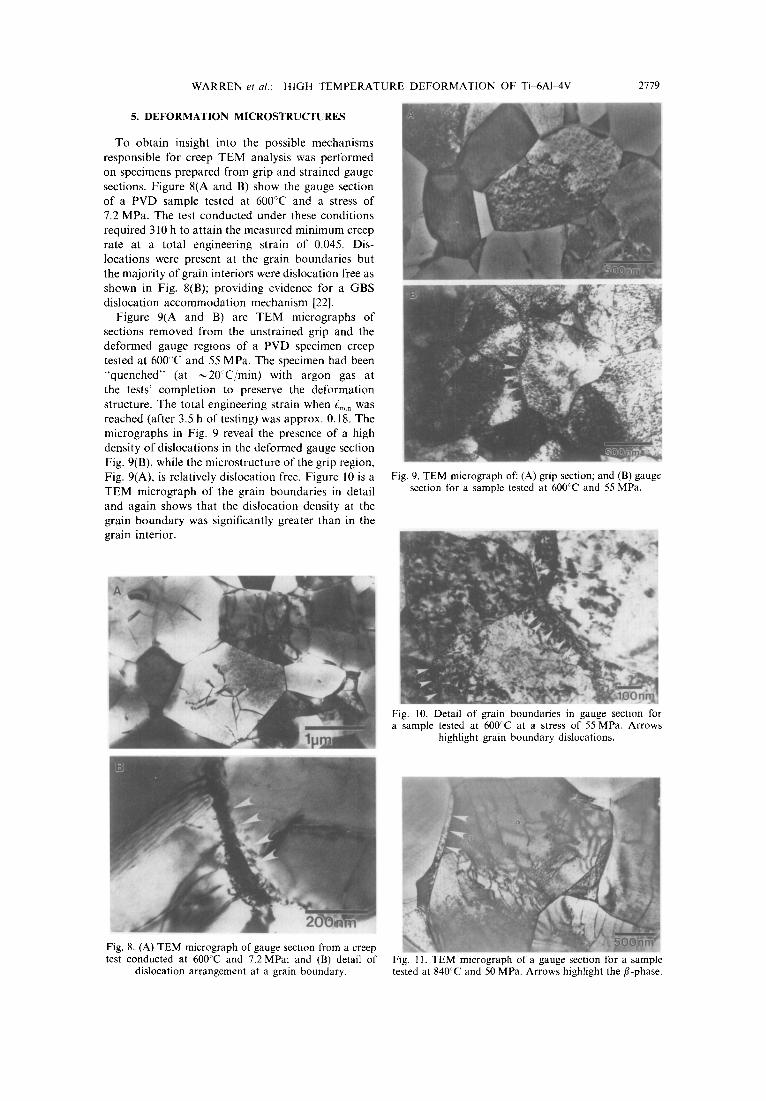
To obtain insight into the possible mechanisms responsible for creep T E M analysis was performed on specimens prepared from grip and strained gauge sections. Figure 8(A and B) show the gauge section of a PVD sample tested at 600°C and a stress of 7.2 MPa. The test conducted under these conditions required 310 h to attain the measured minimum creep rate at a total engineering strain of 0.045. Dis- locations were present at the grain boundaries but the majority of grain interiors were dislocation free as shown in Fig. 8(B); providing evidence for a GBS dislocation accommodat ion mechanism [22].
Figure 9(A and B) are T E M micrographs of sections removed from the unstrained grip and the deformed gauge regions of a PVD specimen creep tested at 600°C and 55 MPa. The specimen had been "quenched" (at ~ 2 0 C / m i n ) with argon gas at the tests' completion to preserve the deformation structure. The total engineering strain when Emm was reached (after 3.5 h of testing) was approx. 0.18. The micrographs in Fig. 9 reveal the presence of a high density of dislocations in the deformed gauge section Fig. 9(B), while the microstructure of the grip region, Fig. 9(A), is relatively dislocation free. Figure 10 is a T E M micrograph of the grain boundaries in detail and again shows that the dislocation density at the grain boundary was significantly greater than in the grain interior.
Fig. 9. TEM micrograph of." (A) grip section; and (B) gauge section for a sample tested at 600°C and 55 MPa.
Fig. 10. Detail of grain boundaries in gauge secnon for a sample tested at 600°C at a stress of 55 MPa. Arrows
highlight grain boundary dislocations.
Fig. 8. (A) TEM micrograph of gauge section from a creep test conducted at 600°C and 7.2 MPa; and (B) detail of
dislocation arrangement at a grain boundary. Fig. 11. TEM micrograph of a gauge section for a sample tested at 840°C and 50 MPa. Arrows highlight the fl-phase.
2780 WARREN et al.: HIGH TEMPERATURE DEFORMATION OF Ti~AI~4V
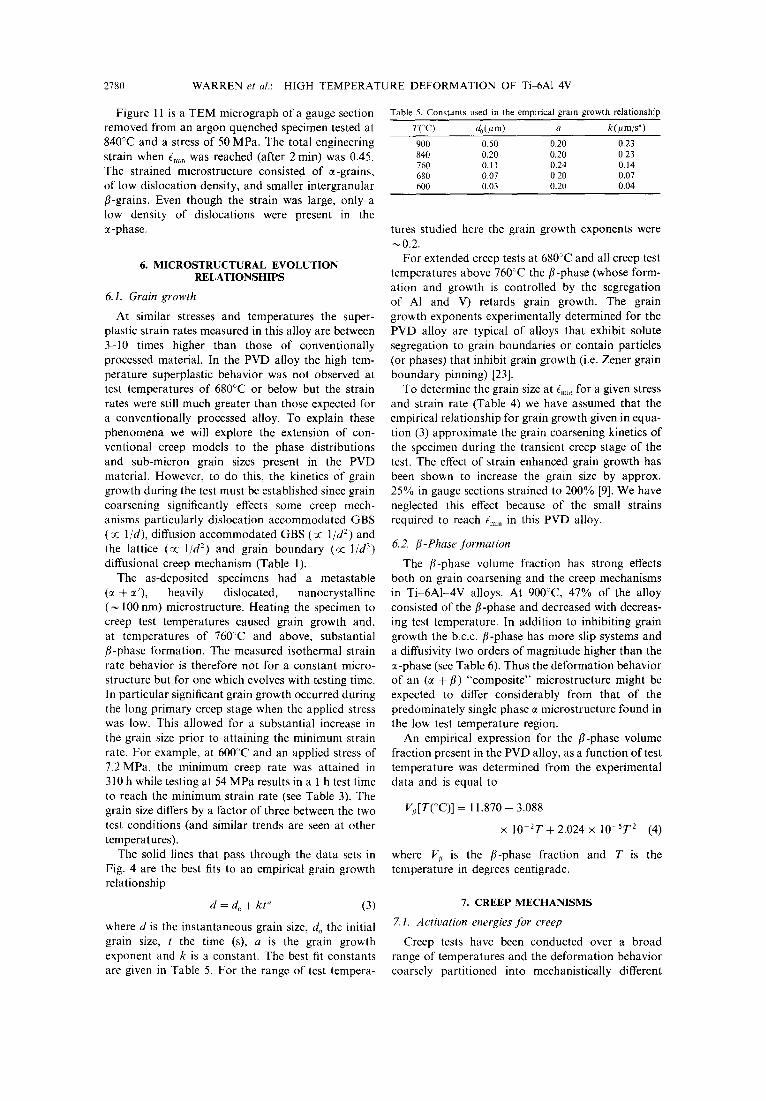
Figure 11 is a TEM micrograph of a gauge section removed from an argon quenched specimen tested at 840°C and a stress of 50 MPa. The total engineering strain when g~,~, was reached (after 2 rain) was 0.45. The strained microstructure consisted of a-grains, of low dislocation density, and smaller intergranular /?-grains. Even though the strain was large, only a low density of dislocations were present in the
-phase.
6. MICROSTRUCTURAL EVOLUTION R E L A T I O N S H I P S
6.1. Grain growth
At similar stresses and temperatures the super- plastic strain rates measured in this alloy are between 3-10 times higher than those of conventionally processed material. In the PVD alloy the high tem- perature superplastic behavior was not observed at test temperatures of 680°C or below but the strain rates were still much greater than those expected for a conventionally processed alloy. To explain these phenomena we will explore the extension of con- ventional creep models to the phase distributions and sub-micron grain sizes present in the PVD material. However, to do this, the kinetics of grain growth during the test must be established since grain coarsening significantly effects some creep mech- anisms particularly dislocation accommodated GBS (oc 1/d), diffusion accommodated GBS (3c l /d 2) and the lattice (so 1/d 2) and grain boundary (oc 1/d 3) diffusional creep mechanism (Table 1).
The as-deposited specimens had a metastable (:~ + ~'), heavily dislocated, nanocrystalline ( ~ 100 nm) mierostructure. Heating the specimen to creep test temperatures caused grain growth and, at temperatures of 760°C and above, substantial fl-phase formation. The measured isothermal strain rate behavior is therefore not for a constant micro- structure but for one which evolves with testing time. In particular significant grain growth occurred during the long primary creep stage when the applied stress was low. This allowed for a substantial increase in the grain size prior to attaining the minimum strain rate. For example, at 600"C and an applied stress of 7.2 MPa, the minimum creep rate was attained in 310 h while testing at 54 MPa results in a 1 h test time to reach the minimum strain rate (see Table 3). The grain size differs by a factor of three between the two test conditions (and similar trends are seen at other temperatures).
The solid lines that pass through the data sets in Fig. 4 are the best fits to an empirical grain growth relationship
d = do + kt a (3)
where d is the instantaneous grain size, do the initial grain size, t the time (s), a is the grain growth exponent and k is a constant. The best fit constants are given in Table 5. For the range of test tempera-
Table 5. Constants used in the empirical grain growth relationship
T ( C ) do(/lm) a k(,um/s ~)
900 0.50 0.20 0.23 840 0.20 0.20 0.23 760 0.11 0.24 0.14 680 0.07 0.20 0.07 600 0.03 0.20 0.04
tures studied here the grain growth exponents were ~0.2.
For extended creep tests at 680'~C and all creep test temperatures above 760c'C the fl-phase (whose form- ation and growth is controlled by the segregation of A1 and V) retards grain growth. The grain growth exponents experimentally determined for the PVD alloy are typical of alloys that exhibit solute segregation to grain boundaries or contain particles (or phases) that inhibit grain growth (i.e. Zener grain boundary pinning) [23].
To determine the grain size at ~m~, for a given stress and strain rate (Table 4) we have assumed that the empirical relationship for grain growth given in equa- tion (3) approximate the grain coarsening kinetics of the specimen during the transient creep stage of the test. The effect of strain enhanced grain growth has been shown to increase the grain size by approx. 25% in gauge sections strained to 200% [9]. We have neglected this effect because of the small strains required to reach {,n~, in this PVD alloy.
6.2. fl-Phase formation
The fl-phase volume fraction has strong effects both on grain coarsening and the creep mechanisms in Ti-6A1-4V alloys. At 900°C, 47% of the alloy consisted of the fl-phase and decreased with decreas- ing test temperature. In addition to inhibiting grain growth the b.c.c, fl-phase has more slip systems and a diffusivity two orders of magnitude higher than the c~-phase (see Table 6). Thus the deformation behavior of an (c~ + fl) "composite" microstructure might be expected to differ considerably from that of the predominately single phase c~ microstructure found in the low test temperature region.
An empirical expression for the /?-phase volume fraction present in the PVD alloy, as a function of test temperature was determined from the experimental data and is equal to
V/dT(°C)] = 11.870 - 3.088
x 10 2T+2.024 × 10-ST 2 (4)
where V, is the /?-phase fraction and T is the temperature in degrees centigrade.
7. CREEP MECHANISMS
7.1. Activation energies for creep
Creep tests have been conducted over a broad range of temperatures and the deformation behavior coarsely partitioned into mechanistically different
WARREN et al.: HIGH TEMPERATURE DEFORMATION OF T i~AI~V 2781
T e m p e r a t u r e ( ° C )
900 840 760 680 600 - 2 T I I ~ r I
150 kJ / tool i i
(c~)
- 8
• ~o E - 1 0
g - 1 2
- 1 8 240 kJ / mol 7 MP
- 2 0 I [ 0.0008 0,0009 0 .0010 0.0011 0 .0012
1 / T ( l / K )
Fig. 12. The relationship between minimum strain rate and I/T for the stress range covered in this work.
regions based on the measured values of activation energy. Figure 12 shows the relationship between In ~mm and 1/T for the entire range of test tempera- tures and stresses studied. It is evident that a distinct transition in the deformation behavior exists between 680 and 760:C. This coincides with the formation of the (high diffusivity) fl-phase in the microstructure, Fig. 5. Thus, the "low temperature region" involves creep of predominately a-phase microstructures whilst the "high temperature region", exhibits super- plastic behavior of a two phase (~ + fl) structure. The average value of the activation energy for all stresses in the low temperature region was 240 kJ/mol. This is almost identical to the activation energy for dis- location creep in elemental ~-Ti (242 k J/tool) [24]. In the high temperature region the average value of the activation energy was 150 k J/tool, similar to the activation energy for volume diffusion in elemental /~-Ti (131 kJ/mol) [25]. Thus, different creep mechan- isms are rate limiting in the two regions.
7.2. Low temperature creep mechanisms
The creep resistance of the PVD alloy in the low temperature range is significantly less than that ob- served in conventionally processed, two phase Ti 6AI-4V alloys. For example, at stresses of 50 MPa and above, the steady state creep strain rates observed in the PVD processed alloy at 6 8 0 C [Fig. 6(b)] are equal to or surpasses the strain rates observed in con- ventionally processed, superplastic T i -6AI-4V alloys even when these are tested at 7 6 0 C [Fig. 7(a)] [21]. Substantially higher strain rates than the conven- tional alloys are also seen at 600 C. For example, the creep rate behavior of as-cast (coarse grain) Ti 6AI 4V alloy tested at 650°C [20] is significantly less than that of the PVD alloy tested at 600C, Fig. 6(a). Thus, the steady state creep strain rates of the PVD alloy appear to be up to two orders of magnitude greater than those of their cast, coarse grain counterparts. Although the creep rate for the PVD material is
increased, the creep stress exponent of the PVD alloy (n = 3.4) is similar to that of the cast material (n = 3.8) suggesting that similar creep mechanisms may be operative even though the grain sizes are very different.
Micromechanical creep models based on a disloca- tion glide-climb mechanism predict creep exponents of 3 [24]. This value arises from the assumption that the steady state strain rate (~) is proportional to the mobile dislocation density (p) and the average glide velocity of the mobile dislocations (v), i.e. e" ~ pv. If it is further assumed that p oc ff-~ and v 3c a then e oc a 3 and n --- 3 [24]. The measured creep stress exponents at 600 and 6 8 0 C were 3.4 and 3.0 respect- ively (see Table 2) and are consistent with a dis- location creep mechanism. The 240 kJ/mol activation energy in this region is identical to that reported for dislocation creep in ~-Ti [24]. Thus, it would appear that the low temperature mechanism of creep in the PVD alloy is dominated by a dislocation mechanism similar to many pure metals and solid solution alloys when tested at around 0.5 T m [26].
Further insight can be gained by examining the general form of the phenomenological rate equation for the deformation of metals and alloys tested at about 0.5 Tm (the Dorn relationship) [27].
- Q , ff ,
where A is a dimensionless constant (the Dorn constant), n is the creep stress exponent, # the tem- perature compensated shear modulus, b the Burgers vector, ~ is the applied stress, Do, . is the pre-exponential constant for lattice diffusion, Q~ is the activation energy for lattice diffusion and k and T are the Boltzmann's constant and absolute temperature respectively.
If the same mechanism operates at 600 and 680"C, the values of A and n in equation (5) can be deter- mined from the experimental creep data taken at the two temperatures. First the steady state creep rates and stresses in equation (5) were normalized
(minkT ( ~ ) " O~#b = A (6)
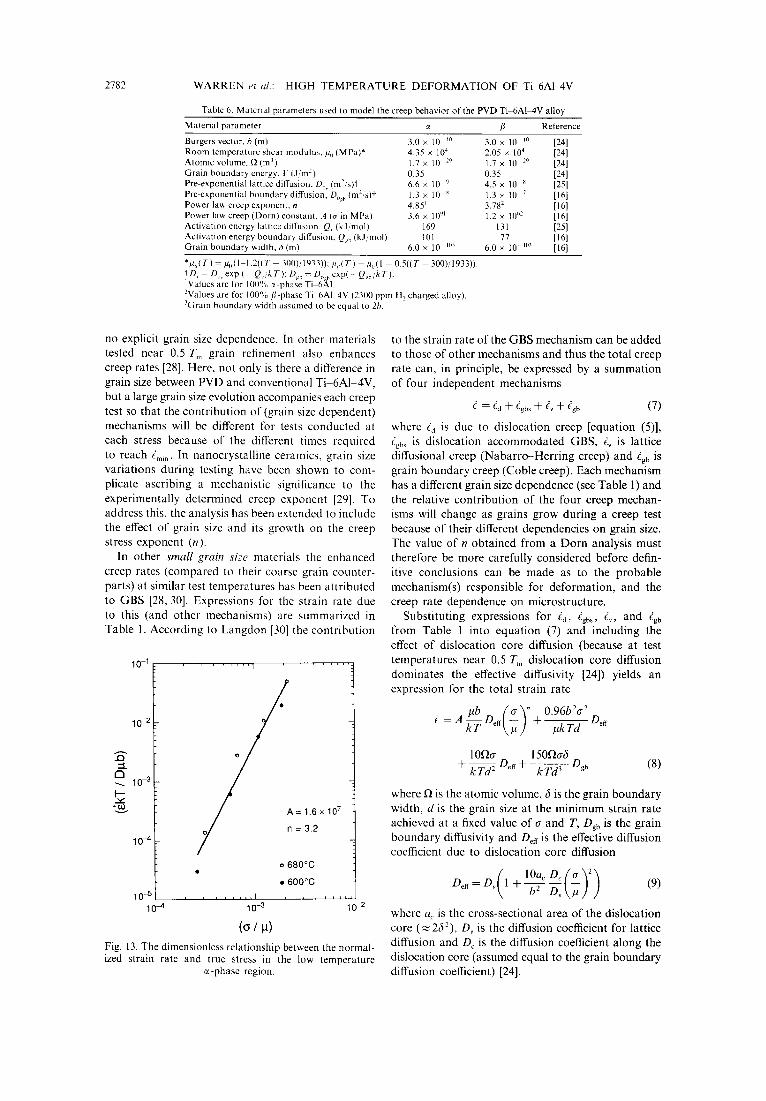
and the normalized data were then plotted on a log-log plot to obtain values for A and n. Our best estimates for the material constants used in equation (6) are given in Table 6. Because of the bulk self- diffusivity of the metastable ~-phase alloy was not available, we have used the self-diffusion coefficients lbr elemental a-Ti. The data for both of the tempera- tures in the low temperature range are seen to fall on a single straight line, Fig. 13, with a slope of n = 3.2 again supporting the view that dislocation creep is the dominant deformation mechanism at both temperatures in this temperature range.
However, equation (6) gives no insight into why the strain rates are approximately two orders of magnitude higher in the PVD processed alloy; it has
2782 WARREN et al.: HIGH TEMPERATURE DEFORMATION OF Ti~iA1MV
Table 6. Material parameters used to model the creep behavior of the PVD Ti 6AIMV alloy
Material parameter :~ fl Reference
Burgers vector, b (m) 3.0 × 10 ~c~ 3.0 x 10 ,o [24] Room temperature shear modulus, ,u 0 (MPa)* 4.35 x 10⁴ 2.05 × l04 [24] Atomic volume, f~(m 3) 1.7 × 10 29 1.7 x 10 29 [24] Grain boundary energy, V (J/m-') 0.35 0.35 [24] Pre-exponential lattice diffusion, Do, (m~/s)f 6.6 x 10 ~ 4.5 x 10 ~ [25] Pre-exponential boundary diffusion, D~,g, (m2/s)+ 1.3 × 10 ~ 1.3 x 10 7 [16] Power law creep exponent, n 4.85 j 3.782 [16] Power law creep (Dorn) constant, A (a in MPa) 3.6 x 1091 1.2 × 10 ~' [16] Activation energy lattice diffusion. Q, (k J/tool) 169 131 [25] Activation energy boundary diffusion, Qgb (kJ/mol) 101 77 [ 16] Gra in boundary width, 3 (m) 6.0 × 10 103 6.0 × 10 w3 [16]
*~=(T) = #[)(1 1.21~(T- 300),1933)); gt~(T) = #0(I - 0.5((T 300)/1933)). ¢D = D, exp ( Q,,kT): Og b = Dt,.b exp( • Q~b/kT). 'Values are for 100% ~-phase Ti 6)~1. ~'Values are for 100%/) '-phase Ti 6AI 4V (2300 ppm H, charged alloy). ~Grain boundary width assumed to be equal to 2b.
no explicit grain size dependence. In other materials tested near 0.5 T m grain refinement also enhances creep rates [28]. Here, not only is there a difference in grain size between PVD and conventional Ti 6A1 4V, but a large grain size evolution accompanies each creep test so that the contribution of (grain size dependent) mechanisms will be different for tests conducted at each stress because of the different times required to reach im~ .. In nanocrystalline ceramics, grain size variations during testing have been shown to com- plicate ascribing a mechanistic significance to the experimentally determined creep exponent [29]. To address this, the analysis has been extended to include the effect of grain size and its growth on the creep stress exponent (n).
In other small grain size materials the enhanced creep rates (compared to their coarse grain counter- parts) at similar test temperatures has been attributed to GBS [28, 30]. Expressions for the strain rate due to this (and other mechanisms) are summarized in Table 1. According to Langdon [30] the contribution
10-I
10 2
..Q :::L
10 ~ I - - . tO v
10 ~
10 ~ 10 -4
. . . . . . . ] . . . . . .
o A = 1 .6 x 10 7
3.2
o 6 8 0 ° C
• 6 0 0 ° C
i i i i L I L L I
10~3 . . . . . . . 10 ~
(o / ~) Fig. [3. The dimensionless relationship between the normal- ized strain rate and true stress in the low temperature
c~-phase region.
to the strain rate of the GBS mechanism can be added to those of other mechanisms and thus the total creep rate can, in principle, be expressed by a summation of four independent mechanisms
z ~d -~ ~gbs -}- iv -J- ~gb (7)
where id is due to dislocation creep [equation (5)], igb~ is dislocation accommodated GBS, 4 is lattice diffusional creep (Nabarro-Herring creep) and igb is grain boundary creep (Coble creep). Each mechanism has a different grain size dependence (see Table 1) and the relative contribution of the four creep mechan- isms will change as grains grow during a creep test because of their different dependencies on grain size. The value of n obtained from a Dorn analysis must therefore be more carefully considered before defin- itive conclusions can be made as to the probable mechanism(s) responsible for deformation, and the creep rate dependence on microstructure.
Substituting expressions for ~d, igb~, iv, and ig b
from Table 1 into equation (7) and including the effect of dislocation core diffusion (because at test temperatures near 0.5 T m dislocation core diffusion dominates the effective diffusivity [24]) yields an expression for the total strain rate
#b ['a ~" 0.96b2a 2
10fla 150fie6 + ~ De. + ~ Dgb (8)
where ~ is the atomic volume, 6 is the grain boundary width, d is the grain size at the minimum strain rate achieved at a fixed value of a and T, Dg b is the grain boundary diffusivity and De~ is the effective diffusion coefficient due to dislocation core diffusion
(,0.oc(;;) De.=D~ 1 + ~ - ~ . (9)
where a~ is the cross-sectional area of the dislocation core (~262). D~, is the diffusion coefficient for lattice diffusion and D~ is the diffusion coefficient along the dislocation core (assumed equal to the grain boundary diffusion coefficient) [24].
WARREN et al.: HIGH TEMPERATURE DEFORMATION OF Ti~AI~4V 2783
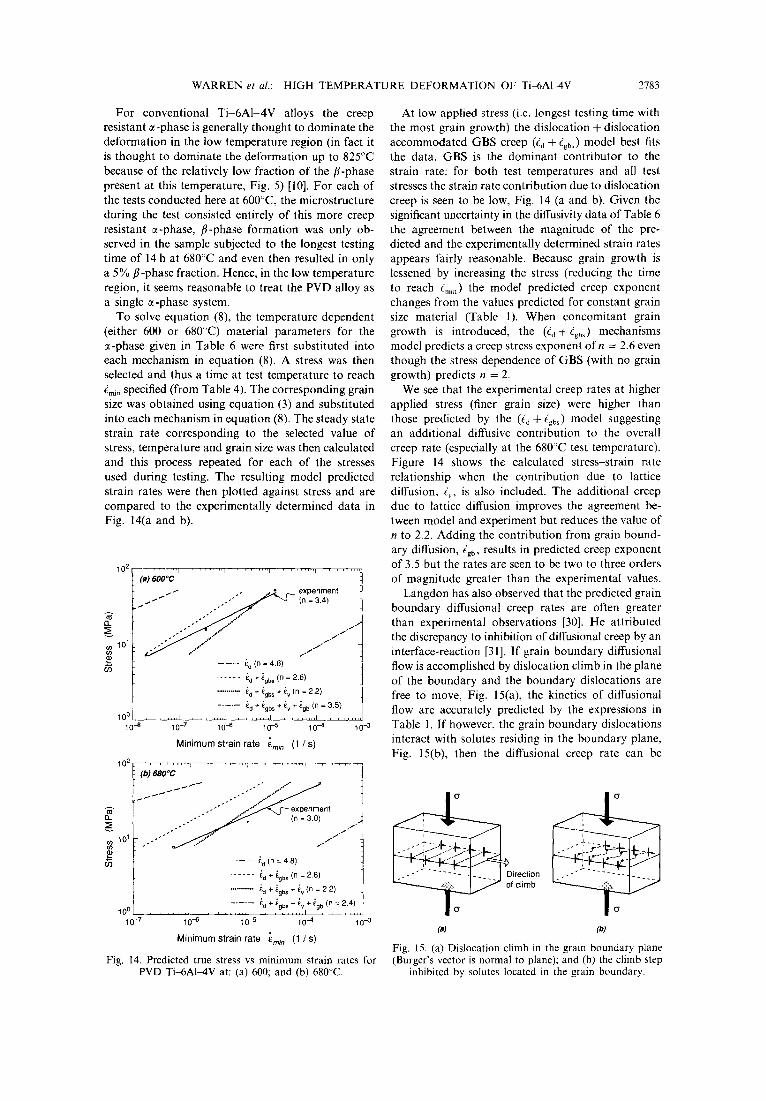
For conventional Ti 6A1-4V alloys the creep resistant a-phase is generally thought to dominate the deformation in the low temperature region (in fact it is thought to dominate the deformation up to 825°C because of the relatively low fraction of the fl-phase present at this temperature, Fig. 5) [10]. For each of the tests conducted here at 600°C, the microstructure during the test consisted entirely of this more creep resistant c~-phase, fl-phase formation was only ob- served in the sample subjected to the longest testing time of 14 h at 680°C and even then resulted in only a 5% fl-phase fraction. Hence, in the low temperature region, it seems reasonable to treat the PVD alloy as a single c~-phase system.
To solve equation (8), the temperature dependent (either 600 or 680°C) material parameters for the ~-phase given in Table 6 were first substituted into each mechanism in equation (8). A stress was then selected and thus a time at test temperature to reach ~=, specified (from Table 4). The corresponding grain size was obtained using equation (3) and substituted into each mechanism in equation (8). The steady state strain rate corresponding to the selected value of stress, temperature and grain size was then calculated and this process repeated for each of the stresses used during testing. The resulting model predicted strain rates were then plotted against stress and are compared to the experimentally determined data in Fig. 14(a and b).
13-
10 2 -- ' . . . . . . . I . . . . . . . . I . . . . . . . . I ~ . . . . . I . . . . . . . ! (a) 600°C ~ xperirnent
In = 3.4)
/ / " f -
I "
- - - - - - ~d (r} = 4 . 8 )
. . . . . kd + kgbs (n = 2.6)
............ ~d + ~g~ + ~v (n = 2 .2)
. . . . . ~:d + Egbs + £v + ~gb (n = 3 .5 ) 10 0 . . . . . . . . I . . . . . . . . i . . . . . . . . I . . . . . . . . I ~ , , L ~
10 4 10 -7 10 4 10 -5 10 `4 10 -3
Minimum strain rate ~m~n (1 / s)
10 2 (b) 680°C
O_ ~ y v (n = 3.0)
. . - " / " 101 i/
- - - ~ (n = 4 6 )
. . . . . . ~d + Egbs (n = 2.6)
........... ~'d + ~:gbs + cv (n = 2.2)
10 0 , , , , - , ' ,~ i , - - ~o + ~gbs + ~v + Cgb (n = 2.4) _ , . . . . . . . . . . . . . . . . I , , , , , , ,
10 -7 10 -s 10 -5 10 ̀ 4 10 -3
Minimum strain rate ~mJo (1 / S)
Fig. 14. Predicted true stress vs minimum strain rates for PVD Ti~AI~4V at: (a) 600; and (b) 680~C.
At low applied stress (i.e. longest testing time with the most grain growth) the dislocation + dislocation accommodated GBS creep (Q + igb~) model best fits the data. GBS is the dominant contributor to the strain rate: for both test temperatures and all test stresses the strain rate contribution due to dislocation creep is seen to be low, Fig. 14 (a and b). Given the significant uncertainty in the diffusivity data of Table 6 the agreement between the magnitude of the pre- dicted and the experimentally determined strain rates appears fairly reasonable. Because grain growth is lessened by increasing the stress (reducing the time to reach imp,) the model predicted creep exponent changes from the values predicted for constant grain size material (Table 1). When concomitant grain growth is introduced, the (Q+~g~) mechanisms model predicts a creep stress exponent ofn = 2.6 even though the stress dependence of GBS (with no grain growth) predicts n = 2.
We see that the experimental creep rates at higher applied stress (finer grain size) were higher than those predicted by the (Q + g g b s ) model suggesting an additional diffusive contribution to the overall creep rate (especially at the 680°C test temperature). Figure 14 shows the calculated stress-strain rate relationship when the contribution due to lattice diffusion, iv, is also included. The additional creep due to lattice diffusion improves the agreement be- tween model and experiment but reduces the value of n to 2.2. Adding the contribution from grain bound- ary diffusion, ggb, results in predicted creep exponent of 3.5 but the rates are seen to be two to three orders of magnitude greater than the experimental values.
Langdon has also observed that the predicted grain boundary diffusional creep rates are often greater than experimental observations [30]. He attributed the discrepancy to inhibition of diffusional creep by an interface-reaction [31]. If grain boundary diffusional flow is accomplished by dislocation climb in the plane of the boundary and the boundary dislocations are free to move, Fig. 15(a), the kinetics of diffusional flow arc accurately predicted by the expressions in Table 1. If however, the grain boundary dislocations interact with solutes residing in the boundary plane, Fig. 15(b), then the diffusional creep rate can be
i 4-
. - - " - ~ - - - - - - [ . . . . . J Di~e~ioo
~ of ehmb
, ~k__
(b)
Fig. 15. (a) Dislocation climb in the grain boundary plane (Burger's vector is normal to plane); and (b) the climb step
inhibited by solutes located in the grain boundary.
2784 WARREN et al.: HIGH TEMPERATURE DEFORMATION OF Ti-6Al~4V
reduced since the boundary dislocations must either by-pass the obstacles or drag them along [31]. In the low temperature region the ~-phase is supersaturated with the//-stabilizing element vanadium and its segre- gation to the grain boundaries (where it eventually forms the intergranular /%phase seen at higher temperatures) may act to obstruct the climb of grain boundary dislocations as is depicted in Fig. 15(b).
It appears to us that deformation in the low temperature region is dominated by dislocation accommodated GBS with additional contributions from lattice and mobility limited grain boundary diffusional creep (at the highest stresses). The relatively high creep stress exponent results from concurrent grain growth during creep testing, and not from dislocation creep. In cases where a large microstructural evolution accompanies testing, it has been demonstrated that mechanistic significance cannot be ascribed to the value of the creep stress exponent without first accounting for grain growth.
7.3. High temperature creep mechanisms
Inspection of Table 3 indicates that the apparent n value was less than two for test temperatures >~ 760C. This, in addition to observed creep strains greater than about two gauge lengths, is normally indicative of a superplastic behavior. It has been well established that GBS (accommodated by dislocations or diffusion) is the primary mechanism responsible for superplastic deformation of Ti 6AI-4V in the 3-7/~m grain size range [15, 21, 26]. Various workers have reported that the optimum superplastic forming temperatures (where the maximum value of m is measured) are between 870 and 940C [9-11, 32, 33] with variations resulting from alloy compositional differences.
The phenomenological rate equation for a single phase, superplastically deforming material is a modified Dorn relationship
"
where p in the grain size exponent (experimentally in the 1.5-3.0 range) and D is a diffusion coefficient (equal to D,. for lattice diffusion accommodated GBS or Og b for grain boundary diffusion accommodated GBS) [27].
Inspection of the modified Dorn relationship for a single phase alloy shows that reducing the grain size, d, increases the attainable strain rate during super- plastic forming. Equation (10), however, does not consider the complexities inherent in the superplastic flow behavior of the two phase alloys encountered in Ti 6AI-4V above 760C. Experimentally, it has been found that in order to achieve superplasticity in the Ti 6AI-4V alloy system both a fine grain size and a substantial volume fraction of the (less creep resistant) /j-phase are necessary. In both the conventional and PVD alloys tested at 760'>C the/j-phase exists at triple
point grain boundary junctions and does not form a fully interconnected structure. Deformation at 760°C must therefore involve either ~-~ GBS or plastic deformation of the ~ grains. The ~-phase is therefore expected to dominate the deformation behavior al- though the/J-phase could facilitate a limited amount of sliding [11].
At 760°C the accommodation mechanism for GBS could be either dislocation motion or grain boundary diffusion [34]. Ignoring any microstructural evolution effects it has been found that in equation 10, n = 2 (m =0.5) for GBS accommodated solely by dislocation motion and n = 1 (m = 1) for sliding accommodated solely by grain boundary diffusion. The experimentally measured creep stress exponent was determined to be n = 1.7 at 760°C, suggesting a dislocation accommodated mechanism, however, this analysis fails to take account of the effects of grain coarsening on the creep stress exponent. At 840°C, we note that the "apparent" n value of the experiments was 1.3, a value more indicative of diffusion accom- modated GBS. Further support of this can be found in the relatively low density of dislocations adjacent to the a-grain boundary in the specimen tested at 840C, Fig. 11.
To more carefully evaluate which mechanisms are active, the flow stress strain rate behavior for both phases in the alloy were assumed to be represented by the additive contributions of the four independent mechanisms previously defined in equation (7)
~ c,r /7 = [~d q- ggbs -~- ~v q- ~gbL or # (11)
where ~ and ~# are the strain rates in the ~- and #- phases respectively. The dislocation accommodated GBS mechanism previously used in the low tempera- ture region results in predicted creep rates at 760°C that are about 15 times lower than the experimentally measured values and has therefore been ignored in the analysis. Hence an alternative mechanism must be assumed responsible for GBS.
Hamilton et al. [16] have successfully used the Ashby-Verrall (A-V) [35] mechanism for diffusion accommodated GBS to model the superplastic behavior of a conventional Ti-6A1-4V alloy and obtained agreement with experimentally determined strain rates to within a factor of about 3 (at a test temperature of 870°C). We have therefore assumed that ~gbs, in the high temperature region, can be represented by the A-V relationship
• ,00o v 0 %bs-- k T d 2 + ~ /t (123
where 6 is the grain boundary width, F is the grain boundary energy and the remaining parameters were the same as previously defined.
To model the deformation behavior of a two- phase, conventionally processed Ti-6AI 4V alloy, Hamilton et al. [16] proposed and experimentally verified that each phase in the alloy experiences the same strain rate (an iso-strain rate assumption).
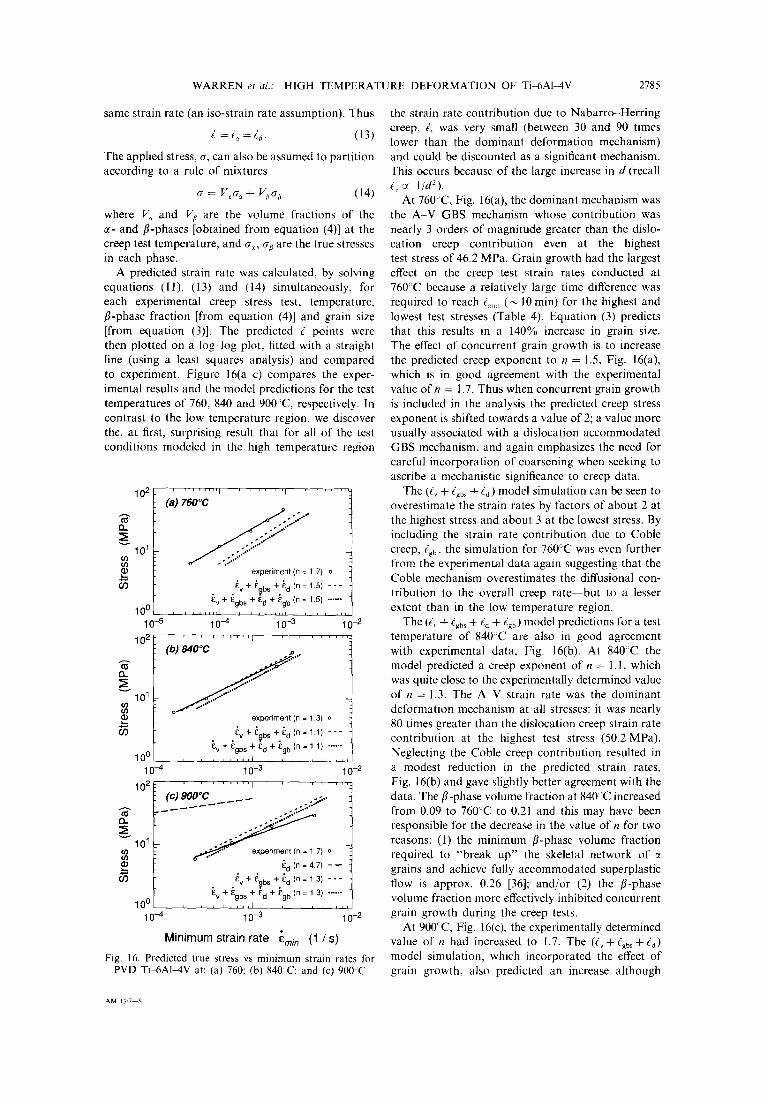
WARREN et al.: HIGH TEMPERATURE DEFORMATION OF Ti~iAI~V 2785
same strain rate (an iso-strain rate assumption). Thus
= i~ = ~r~. (13)
The applied stress, or, can also be assumed to partition according to a rule of mixtures
= V~a~ + Vt~a/~ (14)
where V~ and V~ are the volume fractions of the c~- and/%phases [obtained from equation (4)] at the creep test temperature, and a~, cr~ are the true stresses in each phase.
A predicted strain rate was calculated, by solving equations (11), (13) and (14) simultaneously, for each experimental creep stress test, temperature, /~-phase fraction [from equation (4)] and grain size [from equation (3)]. The predicted g points were then plotted on a log-log plot, fitted with a straight line (using a least squares analysis) and compared to experiment. Figure 16(a-c) compares the exper- imental results and the model predictions for the test temperatures of 760, 840 and 900°C, respectively. In contrast to the low temperature region, we discover the, at first, surprising result that for all of the test conditions modeled in the high temperature region
102 . . . . ' ' " 1 . . . . . . " 1 . . . . . .
(a) z6 oo c
,ol . . . .
O3 experiment (n = 1 7) o
(,t") Ev + E1~bs -I- I~ d (n = l.S) - - -
E:v + E9bs + Ed + ~:gb (n = 1.5) . . . . . 100 . . . . . . . . I . . . . . . . . I . . . . . .
10 -5 10 -4 10 -3 10 -2
10 2 . . . . . . . . 1 . . . . . . . . . (b) 840°C .~ ..
1 2 t . ~ ~ ~ 5 ; e9 101 "~ ' : ' ~ . . . .
o experiment (n = 13) o
..i-, oO ~v + ~bs +. b.~ (n = 1.1) - - -
Ev + Egbs + Ed + Egb (n = 1.1) ...... 10 0 . . . . . . . . I i . . . . . .
1 0 - 4 10 -3 10 -2
10 2 . . . . . . . . i . . . . . . . . (c) 900°C :.:~" :.>...:.>:';':':"~"
7) o
,~ E d ( n = 4 7 ) - -
i v + E~lbs + E d (n = 1 . 3 ) - - -
Ev + Egbs + Ed + £gb (n = 13) ...... 1 0 0 , , , , , , , , I i i i i L i i
1 0 - 4 10 -3 10 -2
M i n i m u m strain rate ~rnin (1 / s )
Fig. 16. Predicted true stress vs minimum strain rates for PVD Ti-6A1-4V at: (a) 760: (b) 840C; and (c) 900':C
the strain rate contribution due to Nabarro-Herr ing creep, i~. was very small (between 30 and 90 times lower than the dominant deformation mechanism) and could be discounted as a significant mechanism. This occurs because of the large increase in d (recall ~,. oC l / d2 ) .
At 760~'C, Fig. 16(a), the dominant mechanism was the A-V GBS mechanism whose contribution was nearly 3 orders of magnitude greater than the dislo- cation creep contribution even at the highest test stress of 46.2 MPa. Grain growth had the largest effect on the creep test strain rates conducted at 760"C because a relatively large time difference was required to reach imm ( ~ 10 min) for the highest and lowest test stresses (Table 4). Equation (3) predicts that this results in a 140% increase in grain size. The effect of concurrent grain growth is to increase the predicted creep exponent to n = 1.5, Fig. 16(a), which is in good agreement with the experimental value of n = 1.7. Thus when concurrent grain growth is included in the analysis the predicted creep stress exponent is shifted towards a value of 2; a value more usually associated with a dislocation accommodated GBS mechanism, and again emphasizes the need for careful incorporation of coarsening when seeking to ascribe a mechanistic significance to creep data.
The (i,. + ~gb~ + ~d) model simulation can be seen to overestimate the strain rates by factors of about 2 at the highest stress and about 3 at the lowest stress. By including the strain rate contribution due to Coble creep, (~ , the simulation for 760°C was even further from the experimental data again suggesting that the Coble mechanism overestimates the diffusional con- tribution to the overall creep ra te - -bu t to a lesser extent than in the low temperature region.
The ((~ + ~gb~ + ~d + igb) model predictions for a test temperature of 840°C are also in good agreement with experimental data, Fig. 16(b). At 840~C the model predicted a creep exponent of n = 1.1, which was quite close to the experimentally determined value of n = 1.3. The A V strain rate was the dominant deformation mechanism at all stresses: it was nearly 80 times greater than the dislocation creep strain rate contribution at the highest test stress (50.2 MPa). Neglecting the Coble creep contribution resulted in a modest reduction in the predicted strain rates, Fig. 16(b) and gave slightly better agreement with the data. The/~-phase volume fraction at 840'C increased from 0.09 to 760°C to 0.21 and this may have been responsible for the decrease in the value of n for two reasons: (1) the minimum fl-phase volume fraction required to "break up" the skeletal network of grains and achieve fully accommodated superplastic flow is approx. 0.26 [36]; and/or (2) the /~-phase volume fraction more effectively inhibited concurrent grain growth during the creep tests.
At 900'C, Fig. 16(c), the experimentally determined value of n had increased to 1.7. The (g~.+igb~+gd) model simulation, which incorporated the effect of grain growth, also predicted an increase although
A M 43~7 S
2786 WARREN et al.: HIGH TEMPERATURE DEFORMATION OF Ti~AI-4V
somewhat lower in value (n = 1.3). Based on the material properties given in Table 6 the modeling results predicted that the A-V mechanism was again the dominant creep mechanism at all test stresses (the strain rate contribution due to the A-V mechanism at the highest stress of 30.7 MPa was about 18 times greater than the dislocation creep contribution). The simulation also predicted that the dislocation creep rate behavior of the two phase alloy, which was now of increasing significance, was dominated by the dislocation creep parameters of the ~-phase.
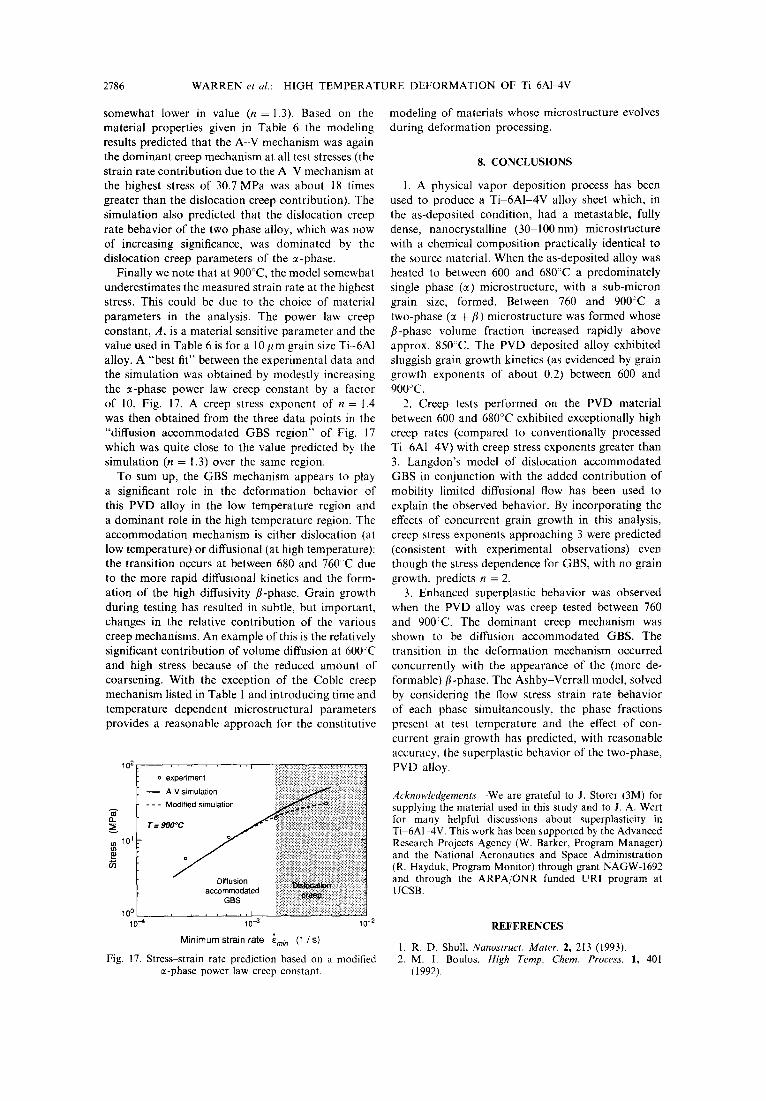
Finally we note that at 900°C, the model somewhat underestimates the measured strain rate at the highest stress. This could be due to the choice of material parameters in the analysis. The power law creep constant, A, is a material sensitive parameter and the value used in Table 6 is for a 10/tin grain size Ti-6AI alloy. A "best fit" between the experimental data and the simulation was obtained by modestly increasing the e-phase power law creep constant by a factor of 10, Fig. 17. A creep stress exponent of n = 1.4 was then obtained from the three data points in the "diffusion accommodated GBS region" of Fig. 17 which was quite close to the value predicted by the simulation (n = 1.3) over the same region.
To sum up, the GBS mechanism appears to play a significant role in the deformation behavior of this PVD alloy in the low temperature region and a dominant role in the high temperature region. The accommodation mechanism is either dislocation (at low temperature) or diffusional (at high temperature): the transition occurs at between 680 and 760cC due to the more rapid diffusional kinetics and the form- ation of the high diffusivity /3-phase. Grain growth during testing has resulted in subtle, but important, changes in the relative contribution of the various creep mechanisms. An example of this is the relatively significant contribution of volume diffusion at 600C and high stress because of the reduced amount of coarsening. With the exception of the Coble creep mechanism listed in Table 1 and introducing time and temperature dependent microstructural parameters provides a reasonable approach for the constitutive
10 2
rl
o e~
- - A
- - - IV
T = 90~
10 0 10 4 10 ~3 10 _2
Minimum strain rate ~nvin (1 / s)
Fig. 17. Stress-strain rate prediction based on a modified e-phase power law creep constant.
modeling of materials whose microstructure evolves during deformation processing.
8. CONCLUSIONS
1. A physical vapor deposition process has been used to produce a Ti 6AI-4V alloy sheet which, in the as-deposited condition, had a metastable, fully dense, nanocrystalline (30-100nm) microstrueture with a chemical composition practically identical to the source material. When the as-deposited alloy was heated to between 600 and 680°C a predominately single phase (~) microstructure, with a sub-micron grain size, formed. Between 760 and 900°C a two-phase (~ +/~) microstructure was formed whose fl-phase volume fraction increased rapidly above approx. 850"~C. The PVD deposited alloy exhibited sluggish grain growth kinetics (as evidenced by grain growth exponents of about 0.2) between 600 and 900C.
2. Creep tests performed on the PVD material between 600 and 680°C exhibited exceptionally high creep rates (compared to conventionally processed Ti-6A1 4V) with creep stress exponents greater than 3. Langdon's model of dislocation accommodated GBS in conjunction with the added contribution of mobility limited diffusional flow has been used to explain the observed behavior. By incorporating the effects of concurrent grain growth in this analysis, creep stress exponents approaching 3 were predicted (consistent with experimental observations) even though the stress dependence for GBS, with no grain growth, predicts n = 2.
3. Enhanced superplastic behavior was observed when the PVD alloy was creep tested between 760 and 900°C. The dominant creep mechanism was shown to be diffusion accommodated GBS. The transition in the deformation mechanism occurred concurrently with the appearance of the (more de- formable) fl-phase. The Ashby-Verrall model, solved by considering the flow stress strain rate behavior of each phase simultaneously, the phase fractions present at test temperature and the effect of con- current grain growth has predicted, with reasonable accuracy, the superplastic behavior of the two-phase, PVD alloy.
Acknowledgements--We are grateful to J. Storer (3M) for supplying the material used in this study and to J. A. Wert for many helpful discussions about superplasticity in Ti 6AI-4V. This work has been supported by the Advanced Research Projects Agency (W. Barker, Program Manager) and the National Aeronautics and Space Administration (R. Hayduk, Program Monitor) through grant NAGW-1692 and through the ARPA/ONR funded URI program at UCSB.
REFERENCES
1. R. D. Shull, Nanostruct. Mater. 2, 213 (1993). 2. M. I. Boulos, High Temp. Chem. Process. 1, 401
(1992).

WARREN et al.: HIGH TEMPERATURE DEFORMATION OF Ti~6Al-4V 2787
3. C. M. Ward-Close and P. G. Partridge, J. Mater. Sci. 25, 4315 (1990).
4. J. A. Thornton, Ann. Rev. Mater. Sci. 7, 239 (1977). 5. C. M. Ward-Close and P. G. Partridge, J. Mater Sci. 25,
4315 (1990). 6. C. S. Pande, R. A. Masumura and R. W. Armstrong,
Nanostruct. Mater. 2, 323 (1993). 7. G. W. Nieman, J. P. Weertman and R. W. Siegel
Nanostruct. Mater. I, 185 (1992). 8. Z. Cui and H. Hahn, Nanostruct. Mater. 1, 419
(1992). 9. A. Arieli and A. Rosen, Metall. Trans. A. 8, 1591
(1977). 10. M. L. Meier, D. R. Lesuer and A. K. Mukherjee, Mater.
Sci. Engng. 154, 171 (1991). 11. M. k. Meier, D. R. Lesuer and A. K. Mukherjee,
Mater. Sci. Engng. 136, 165 (1992). 12. D. Lee and W. A. 13ackofen, Trans. T M S A I M E 239,
1034 (1967). 13. J. A. Wert, Superplastic Forming o]" Structural Alloys
(edited by N. E. Paton and C. H. Hamilton), pp. 169 189. TMS AIME, Warrendale, Pa, (1982).
14. J. A. Wert and N. E. Paton, Metall. Trans. A. 14, 2535 (1983).
15. O. D. Sherby and J. Wadsworth, Prog. Mater. Sci. 33, 169 (1989).
16. C. H. Hamilton, A. K. Gosh and M. W. Mahoney, Advanced Processing Methods jor Titanium Alloys (edited by D. F. Hasson and C. H. Hamilton), pp. 129 144. TMS-AIME, Warrendale, Pa (1982).
17. Metals Handbook (edited by T. Lyman), 8th edn., Vol 8, pp. 42 43. ASM, Metals Park, Ohio (1973).
18. C. R. Brooks, Heat Treatment, Structure and Properties o f Nonferrous Alloys, p. 366 ASM, Metals Park, Ohio (1982).
19. D. Turnbull, Metall. Trans. A. 12, 695 (1981). 20. W. C. Harrington Jr, Metall. Trans. A. 5, 565 (1974).
21. J. Pilling, D. W. Livesey, J. B. Hawkyard and N. Ridley. Metal Sei. I8, 117 (1984).
22. M. Jain, M. C. Chaturvedi, N. L. Richards and N. C. Goel. Mater. Sci. Engng A145, 205 (1991).
23. W. D. Kingery, H. K. Bowen and D. R. Uhlmann, in Introduction to Ceramics, chap. 9, p. 455. Wiley, New York (1976).
24. M. F. Ashby and H. J. Frost, Deformation-Mechanism Maps, pp. 44-45. Pergamon Press, Oxford (1982).
25. F. Dyment, Proc. Fourth Int. Conf. Titanium (edited by H. Kimuraand and O. lzumi), pp. 519 528. TMS- AIME, Warrendale, Pa. (1980).
26. S. Takeuchi and A. S. Argon, J. Mater. Sci. l I , 1542 (1976).
27. A. K. Mukherjee, J. E. Bird and J. E. Dorn, Trans. A S M 62, 155 (1969).
28. F. Garofalo, C. Richmond, W. F. Domis and F. von Gemmingen, Joint International Conference on Creep, pp. 1-31. Institution of Mechanical Engineers, London (1963).
29. H. Hahn and R. S. Averback, J. Am. Ceram. Soc. 74, 2918 (1991).
30. T. G. Langdon, Phil. Mag. 22, 689 (197l). 31. M. F. Ashby, Scripta metall. 3, 837 (1969). 32. R. R. Boyer and J. E. Magnuson, Metall. Trans. A. 10,
1191 (1979). 33. N. E. Paton and C. H. Hamilton, Metall. Trans. A. 10,
241 (1979). 34. B. P. Kashyap and A. K. Mukherjee, International
Conference on Superplasticity (edited by 13. Baudelet and M. Suery), Section 4, pp. 1-24, Editions du C.N.R.S., Paris (1985).
35. M. F, Ashby and R. A. Verrall, Acta metall. 21, 149 (1973).
36. R. C. Gifkins, Metall. Trans. A. 7, 1225 (1976). 37. C. Herring, J. appL Phys. 21, 437 (1950). 38. R. L. Coble, J. appl. Phys. 34, 1679 (1963).