High temperature creep properties and microstructural examinations ...
11
1 HIGH TEMPERATURE CREEP PROPERTIES AND MICROSTRUCTURAL EXAMINATIONS OF P92 WELDS Kalck Charlotte 1, 3* , Fournier Benjamin 1 , Barcelo Françoise 1 , Forest Laurent 2 , Dalle France 1 , Giroux Pierre-François 1, 3 , Tournié Ivan 1 , Gourgues-Lorenzon Anne-Françoise 3 1 : CEA Saclay, DEN/DANS/DMN/SRMA, 91191 Gif sur Yvette Cedex, France 2 : CEA Saclay, DEN/DANS/DM2S/LTA, 91191 Gif sur Yvette Cedex, France 3 : MINES ParisTech, Centre des Matériaux, UMR CNRS 7633, BP 87, 91003 Evry, France *corresponding author: [email protected] Abstract The present study deals with the creep properties of welded joints made of P92 steels. The purpose is to determine the weakest zone at 550°C under various load levels (160-240 MPa) and to investigate the evolution of the microstructure during creep. The study of the fracture surfaces and the microstructural examination of welded joints prior to and after creep tests allow to investigate damage development. Ductile fracture occurs in the heat affected zone, more precisely, in the intecritical area, together with pronounced necking. Observation of the necking area shows many cavities and cracks. Keywords: P92, welded joint, creep rupture strength, EBSD 1 Introduction In the framework of the development of generation IV nuclear reactors, 9% chromium martensitic steels present both a high strength and high creep resistance. They also have a better thermal conductivity, lower thermal expansion and are cheaper than austenitic steels. Among them, P92 (ASME Grade 92) steel seems to be an appropriate candidate for high temperature components and especially for welded components. Its main targeted applications are heat exchangers and hot fluid pipes, which are exposed to long-term creep between 550 and 650°C. However, it has been demonstrated that welding has a significant effect on the creep strength of those steels [1, 2], so that long term mechanical properties of P92 welded joints at 550°C still need further investigation. The objective of this paper is to describe the microstructure of a P92 welded joint and to provide new experimental data on the creep behaviour of welded joints at 550°C. 2 Materials and experimental procedures The study focuses on a P92 butt welded joint. The base metal was provided as a pipe of 219 mm in outer diameter and 19 mm in thickness. The chemical composition of the base metal and filler metal are given in Table 1. The as-received base material had been austenitized at 1060°C for 30 minutes, quenched and then tempered at 770°C for 60 minutes. The joint concerns the assembly of 2 tubes in butt welding configuration with the manual GTAW (Gas Tungsten Arc Welding) process. The welding position is flat. A preheating and an interpass temperature have applied (~220°C).
Transcript of High temperature creep properties and microstructural examinations ...

1
HIGH TEMPERATURE CREEP PROPERTIES AND MICROSTRUCTURAL EXAMINATIONS OF P92 WELDS
Kalck Charlotte1, 3*, Fournier Benjamin1, Barcelo Françoise1, Forest Laurent2, Dalle France1,
Giroux Pierre-François1, 3, Tournié Ivan1, Gourgues-Lorenzon Anne-Françoise3
1 : CEA Saclay, DEN/DANS/DMN/SRMA, 91191 Gif sur Yvette Cedex, France 2 : CEA Saclay, DEN/DANS/DM2S/LTA, 91191 Gif sur Yvette Cedex, France
3 : MINES ParisTech, Centre des Matériaux, UMR CNRS 7633, BP 87, 91003 Evry, France *corresponding author: [email protected]
Abstract
The present study deals with the creep properties of welded joints made of P92 steels. The purpose is to
determine the weakest zone at 550°C under various load levels (160-240 MPa) and to investigate the evolution of the microstructure during creep.
The study of the fracture surfaces and the microstructural examination of welded joints prior to and after creep tests allow to investigate damage development. Ductile fracture occurs in the heat affected zone, more precisely, in the intecritical area, together with pronounced necking. Observation of the necking area shows many cavities and cracks. Keywords: P92, welded joint, creep rupture strength, EBSD
1 Introduction
In the framework of the development of generation IV nuclear reactors, 9% chromium martensitic steels present both a high strength and high creep resistance. They also have a better thermal conductivity, lower thermal expansion and are cheaper than austenitic steels. Among them, P92 (ASME Grade 92) steel seems to be an appropriate candidate for high temperature components and especially for welded components. Its main targeted applications are heat exchangers and hot fluid pipes, which are exposed to long-term creep between 550 and 650°C. However, it has been demonstrated that welding has a significant effect on the creep strength of those steels [1, 2], so that long term mechanical properties of P92 welded joints at 550°C still need further investigation. The objective of this paper is to describe the microstructure of a P92 welded joint and to provide new experimental data on the creep behaviour of welded joints at 550°C.
2 Materials and experimental procedures
The study focuses on a P92 butt welded joint. The base metal was provided as a pipe of 219 mm in outer diameter and 19 mm in thickness. The chemical composition of the base metal and filler metal are given in Table 1. The as-received base material had been austenitized at 1060°C for 30 minutes, quenched and then tempered at 770°C for 60 minutes. The joint concerns the assembly of 2 tubes in butt welding configuration with the manual GTAW (Gas Tungsten Arc Welding) process. The welding position is flat. A preheating and an interpass temperature have applied (~220°C).

2
A post weld heat treatment (PWHT) was applied to the weld in order to relieve residual stresses induced by welding and also to temper the newly formed martensite. The PWHT is a tempering at 760° C during 4h30 hours with heating and cooling rates.
C Mn P S Si Cr W Mo V Nb N B Al Ni
Base Metal
0.12 0.54 0.014 0.004 0.23 8.68 1.59 0.37 0.19 0.06 0.046 0.002 0.020 0.26
Filler rod
0.109 0.46 0.008 0.001 0.38 8.76 1.55 0.40 0.201 0.06 0.044 - - 0.53
Table 1: Chemical composition (wt %) of the base and weld metal.
2.1 Metallographic investigations of the welded joint and of crept samples
2.1.1 Microstructural observations
The microstructure of the welded joint was observed with an optical microscope after mechanical polishing down to 1 µm with diamond paste followed by vibrating colloidal silicon suspension (OPS) polishing. Finally, a Villela (1g of acid picric acid + 5mL of HCl + 100mL of ethyl alcohol) etching was performed.
Thin foils were also prepared from the base metal and observed with transmission electron microscopy.
Electron backscatter diffraction (EBSD) examinations were conducted with a scanning electron microscope (SEM) with a working distance of 25mm, an accelerating voltage of 25kV and a beam current of 6 nA. The maps were obtained with a beam step size of 0.5 µm, using a JEOL JSM 6400 SEM with a LaB6 cathode and an EBSD HKL system with Channel 5 software [2].
2.1.2 Microhardness measurements
Vickers Microhardness tests were carried out along the transversal axis of the welded joint sample, before and after creep tests. Measurements were performed using a LEITZ WETZLAR GERMANY machine. Indents were made with a weight of 500g and a holding time of 10 seconds.
2.2 Creep tests
Smooth cross-weld specimens were extracted from the weldment, along the longitudinal axis of the pipe. Their geometry is presented in figure 1.
Figure 1: Scheme of creep specimen geometry.
Creep tests were conducted in air under uniaxial tensile load control using ADAMEL creep machines. The temperature gradient between both ends was kept lower than 3°C. These tests were performed at 550°C from 160 to 240 MPa (See table 2). Specimen elongation was continuously measured and recorded using extensometers with a sensitivity of 1µm.
After creep, macrostructure and microstructure were revealed using Villela etching of longitudinal cross-sections in order to locate fracture with respect to the various zones of the

3
welded joint. In order to investigate damage developed during creep, fracture surfaces and longitudinal cross-sections of the creep specimens were observed by SEM.
3 Results and discussion
3.1 Metallographic characterization of the as-received material
The various zones in the welded joint are schematically represented in Figure 2.
Figure 2: Scheme of the welded joint.
The welded joint is composed of a range of different microstructures which constitute the base metal, the welded joint and the heat affected zone (HAZ). The microstructure is related to the thermal history experienced during the welding.
The microstructure of HAZ varies along the distance from the fusion line. The area close to the weld metal shows coarse parent austenite grains and is called the
coarse-grained zone (CGHAZ). Then, next to the CGHAZ, the HAZ presents an area with very fine parent austenite grains (FGHAZ). A last zone, located between the base metal and the FGHAZ, presents a particular microstructure, made of martensite laths and prior austenite grains denoted the intercritical zone (ICHAZ).
A microhardness profile performed at mid-thickness is symbolized by the dash-dot line in Figure 3. The combination of microhardness profiles and observations of the welded joint allows highlighting the location and the width of the different areas of the HAZ (Figure 4).
Figure3: Cross-weld microhardness profile combined with observations of the welded joint.
The weld metal is the harder part of the joint (the average value is 265 HV). The
hardness in the HAZ is varying. A softened zone (200 HV) is observed in the HAZ next to the base metal. It probably corresponds to the ICHAZ. Then, the hardness strongly increases in the HAZ towards the weld metal. The area which is harder than the other zones and located close to the weld metal corresponds to the CGHAZ.
Base metal
Weld metal
HAZ Base metal
HAZ
19 mm
150,00
170,00
190,00
210,00
230,00
250,00
270,00
290,00
0 5000 10000 15000 20000Distance of the indentation from the first one (m)
Vic
kers
Mic
roh
ard
nes
s H
V 0
,5
ICHAZ FGHAZ CGHAZ

4
a) b)
c) d)
e) Figure 4: Optical observations of the different areas of the welded joint: a) the base metal, b) the intercritical area, c) the FGHAZ, d) the CGHAZ and e) the weld metal. EBSD maps display the microstructure of different zones of the welded joint (figures
5, 7 and 8).
a) b) Figure 5: EBSD orientation map a) and boundary map (misorientation >5°) b) of the base metal.
The microstructure of the base metal is a usual martensitic microstructure made of laths, arranged in blocks and packets (Figures 5 and 6) [4, 5].
The average size of a block is about 4 µm (Detection criterion: misorientation > 5°). Giroux [6] estimated the subgrain size of the same base metal to be 0.37 µm. He estimated the average dislocation density of the material at about 2.1014 m-2.

5
Figure 6: Bright Field TEM observations of the Base metal.
The microstructure of the base metal also displays many precipitates along grain boundaries and also inside the grains [4, 5].
The fine–grained zone (FGHAZ) (figure 7) presents a microstructure with very fine crystals, which mean size is about 2.9 µm.
a) b) Figure 7: EBSD orientations map a) and boundary map (misorientation >5°) b) of the fine-grained zone.
a) b) Figure 8: EBSD orientations map a) and boundary map (misorientation >5°) b) of the softened zone. EBSD observations of the softened zone show that the microstructure is very similar to
that of the base metal at the investigated scale (figure 8). This suggests that the lower hardness might be due to a difference of subgrain or lath size or to a different precipitation state.
3.2 Creep results
3.2.1 Creep curves
Creep tests results are summarized in Table 2 and Figure 9. Specimens subjected to applied stresses of 229.6 MPa and 240 MPa both broke in the HAZ, very close to the base metal, namely, in the ICHAZ. The specimen crept at 205 MPa has not been observed yet.
2 µm
1 µm

6
Applied stress (MPa) Test duration (h) Current state 160 7700 Non Fractured
174.6 7300 Non Fractured 205 6187 Fractured 205 8700 Non Fractured
229.6 2837 Fractured 240 1127 Fractured
Table 2: Creep results. “Non Fractured” means that the creep test is still in progress.
Time (h)0 2000 4000 6000 8000 10000
Def
orm
atio
n (
%)
0
2
4
6
8
10
240 MPa
205 MPa
174,6 MPa
160 MPa
205 MPa229,6 MPa
Figure 9: Creep curves at 550°C.
The fracture elongation is rather high (several percents). The three typical creep stages are clearly visible in Figure 9. The values of strain at the end of the first two stages are indicated in Table 3. The two creep curves at 205 MPa are superimposed for the first two creep stages but differ in the third stage. However, the ratio between both lifetimes will probably not exceed 2 or 3 as the third stage already started for the ongoing test.
Applied
stress (MPa)
Deformation at the end of the first stage (%)
Time at the end of the first stage
(h)
Deformation at the end of the
second stage (%)
Time at the end of the second
stage (h) 160 0.018 0.161 - -
174.6 0.552 6556 - - 205-broken 0.983 1480 1.942 4780
205 0.885 1400 2.06 6400 229.6 0.703 300 1.725 1800 240 0.593 140 1.558 680
Table 3: Amount of strain and time at the end of the primary and the secondary creep stages.

7
Applied stress (MPa)
10 100 1000
Min
imal
str
ain
rat
e (%
/s)
10-9
10-8
10-7
10-6
10-5
10-4
This studyP92 Welded joints, L. Falat, 625°CP91 Welded joints, Gaffard, 625°CP91 Welded joints, Vivier, 500°C
Figure 10: Minimal strain rate versus applied stress for welded joints [3, 6 and 7].
The minimum creep rates of the crept samples can be modelled by a typical Norton
power-law curve defined by equation 1: nAσε =
• (equation1)
Where •ε is the minimum creep rate, σ the applied stress, A and n are parameters
depending on material and temperature. For this study, the model gives n=11.57. This relatively high value suggests that the creep deformation mechanism is controlled by dislocations motion, possibly together with an effect of internal stresses. This result can be compared with the values found at 500°C by Vivier [1] and at 625°C by Gaffard [7] for welded joints of P91 (Figure 10).
Time to fracture (hrs)102 103 104 105
Ap
plie
d s
tres
s (M
Pa)
100
1000
Welded Joint KALCKECCC Base metalECCC theoretical Welded JointP 91 Welded Joint Jandova et al
Figure 11: Applied stress versus time to fracture, at 550°C [1, 8].
In Figure 11, ECCC “theoretical” values correspond to times to fracture of welded joint calculated from ECCC base metal values and reduced by a factor of 10 compared to time to fracture of base material [8].
As expected, the creep strength of the welded joint is lower than the creep resistance of the base metal. The ratio between the values of the base metal and the actual welded joint is about 3.3 i.e. three times lower than that expected from “theoretical” ECCC values.
Moreover, creep lifetime is larger for P92 welded joints than for P91 welded joints [9] at the same temperature. The Monkman-Grant constant (Figure 12) is also higher than that of P91.
8
Time to fracture (h)
1e+2 1e+3 1e+4 1e+5 1e+6 1e+7
Min
imal
str
ain
rat
e (%
/s)
1e-9
1e-8
1e-7
1e-6
1e-5
1e-4
T91 Base metal, E.M. Haney et al, 500, 550 and 600 °C.This studyP92 Welded joints, L. Falat, 625°CP 91 Welded Joint,Gaffard, 625°CP92 base metal, CEA, 550°C.
Figure 12: Monkman-Grant curve for crept specimens [8, 9 and 10].
The dashed line in Figure 12 corresponds to a linear approximation of a set of data about
T91 at temperatures ranging from 500 to 625°C, studied by E.M. Haney et al [10]. Data about P92 welded joints coming both from this study and from L. Falat experiments [4] are spread homogeneously along the same line.
Besides, we can see that the diminution of P92 properties due to the welding is less significant than for P91. The difference between the Monkman-Grant properties (figure 12) of the welds compared to the base metal is much more pronounced for P91 than P92. This is consistent with the 3.3 ratio observed on the lifetime in figure 11.
3.2.2 Fracture surface examination
Fracture surfaces of broken samples present a circular shape. The facture mode is transgranular ductile. The facture surfaces in figure 13 exhibit many dimples, which is typical of a ductile fracture in the dislocation creep regime.
Figure 13: Fracture surface of the crept sample after 2837h (229.6 MPa, 550°C).
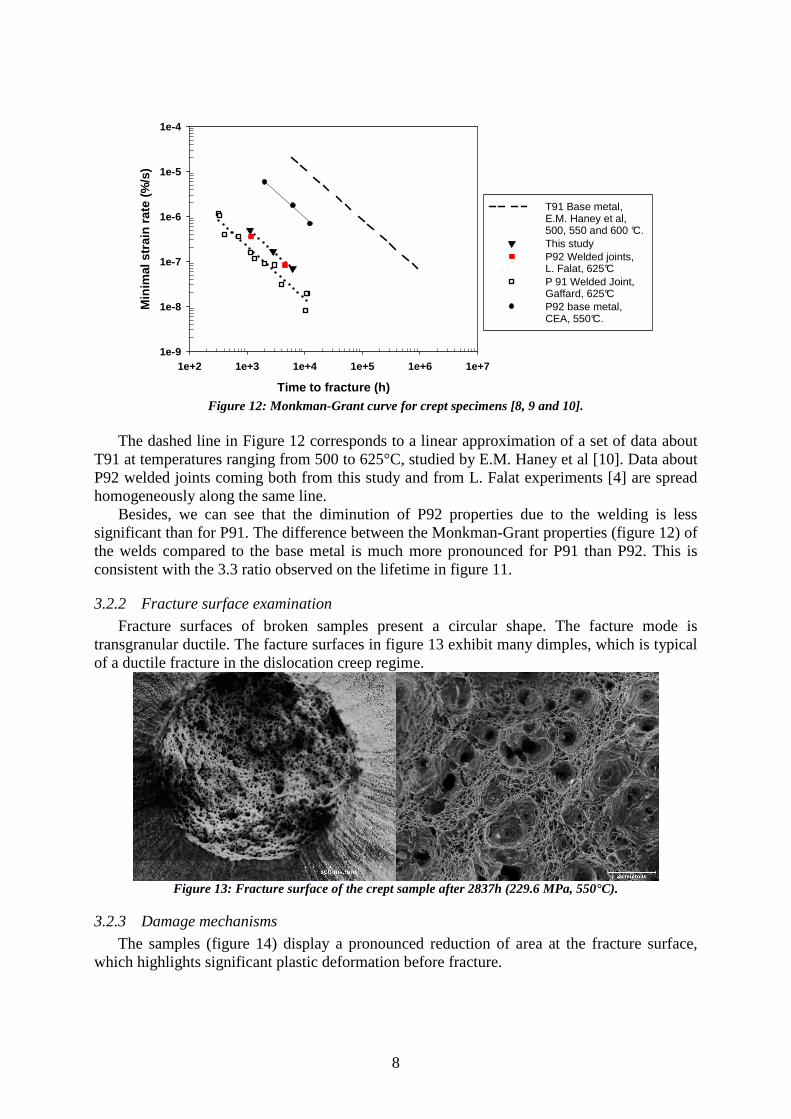
3.2.3 Damage mechanisms
The samples (figure 14) display a pronounced reduction of area at the fracture surface, which highlights significant plastic deformation before fracture.

9
Applied Stress (MPa) Necking (%) 205 72
229,6 81 240 79
Table 4: Necking of the broken sample
Figure 14: Necking area of a crept sample (240 MPa, 550°C).
A lot of cavities and short cracks can be observed in the necking area of the broken
specimen (Figure 15). Cavities are elongated along the loading direction.
Figure15: SEM observations of damage in the necking area of crept sample (240 MPa, 550°C, cross-section).
Figure 16: SEM observations of the cross-section of the crept specimen far from the necking area (240 MPa,
550°C). Far from the necking area (figure 16), much lower cavities are concentrated in the necking
zone. Therefore, the damage mechanism does not seem to be controlled by vacancy diffusion at 550°C in the tested conditions. This assumption is in agreement with the significant reduction of area and the Norton parameters.
500 µm

10
3.2.4 Hardness measurements after creep
Microhardness profiles were measured on longitudinal cross sections of two creep fractured samples (figure 17), showing a significant increase in hardness in the necking area. This fact is linked to the strain hardening occurring during deformation. Moreover, in the weld metal, hardness values are more scattered than before creep.
180,00
200,00
220,00
240,00
260,00
280,00
300,00
-4000 1000 6000 11000 16000 21000
Distance of the indentation from the first one (µm)
Vic
kers
mic
roh
ard
nes
s H
V 0
,5
229.6 MPa
240 MPa
Before creep
Figure 17: Cross-weld microhardness profiles of two crept specimens
The microhardness profiles allowed determining the location of fracture in two specimens. Fracture occurred in the intercritical area for both samples. Table 5 presents the fracture location of samples having experienced creep tests under different conditions.
P 91 P 92 Temperature
Stress(MPa)
500 (°C) 550(°C) 625(°C) 550(°C) 600(°C) 625(°C)
50 ICHAZ 60 ICHAZ 70 80 ICHAZ ICHAZ 100 ICHAZ ICHAZ 120 ICHAZ 140 160 WM WM ICHAZ 180 WM WM 200 WM 210 WM 220 WM WM 230 WM WM ICHAZ 240 WM ICHAZ 250 WM 260 WM 280 WM 300 WM
Table 5: Comparison of fracture location in welded joint for various values of stress and test temperature [1, 2, 9 and 11]. The results of the present study are in bold.
Fracture surface

11
Concerning P91 welded joints we can observe that for high stresses, fracture occurs in the weld metal, whereas for lower stresses, it takes place in the ICHAZ. The experiments of this study, performed on P92 welded joints, show that type IV fracture occurs even at high stresses. At 550°C, we notice that the type IV fracture happens 19 times earlier in P92 welded joints (about 1000 hours) than in P91 welded joints (about 20000 hours).
4 Conclusion P92 welded joints were subjected to creep tests under 160 up to 240 MPa at 550°C. In the
experimental conditions tested, the creep lifetime of the welded joint is approximately 3.3 times shorter than that of the base metal. The Norton exponent was quite high (11.5).
Fractures took place in the intercritical heat-affected zone. Significant reduction of area occurred during creep tests. Necking areas showed many cavities and cracks, oriented along the loading axis. However, no cavity was detected far from the fracture surface.
In the investigated conditions, the fracture mechanism seems to be linked to viscoplastic deformation. Acknowledgments
The direction of the Nuclear Energy Department of the CEA is acknowledged for financial support through the DISN/TEMAS project. References [1] Vivier F., Fluage à 500°C d’un joint soudé d’un acier 9Cr-1Mo modifié. Evolution de la microstructure & Comportement mécanique, PhD thesis, Ecole des Mines de Paris, 2009. [2] Gaffard V., Experimental study and modelling of high temperature creep flow and damage behaviour of 9Cr1Mo-NbV steel weldments, PhD thesis, Ecole des Mines de Paris, 2005. [3] HKL Technology, Channel 5, 2001 [4] Falat L., Vyrostková A., Homolová V., Svoboda M., Creep deformation and failure of E911/E911 and P92/P92 similar weld-joints, Engineering Failure Analysis 16 (2009) 2114–2120 [5] Fournier B., Fatigue –fluage des aciers martensitiques à 9-12 % de chrome: comportement et endommagement, PhD thesis, Ecole des Mines de Paris, 2007. [6] Giroux P.F., Mechanical and microstructural stability of P92 steel under uniaxial tension at high temperature. [7] Gaffard V., Gourgues-Lorenzon A.F., Besson J., High temperature creep flow and damage properties of9Cr1MoNbV steels: Base metal and weldment. [8] ECCC datasheets 2005, Steel ASTM Grade 92 [9] Jandova D., Kasl J., Kanta V., Influence of Substructure on Creep Failure of P91 Steel Weld Joints, ECCC Creep conference, April 2009. [10] Haney E. M., Dalle F., Sauzay M., Vincent L., Tournié I., Allais L., Fournier B., Macroscopic results of long-term creep on a modified 9Cr–1Mo steel (T91). [11] Wanatabe T., Tabuchi M., Yamazaki M., Hongo H., Tanabe T., Creep damage evaluation of 9Cr-1Mo-V-Nb steel welded joints showing type IV fracture, International Journal of Pressure Vessels and Piping 83 (2006) 63–71