High-speed microstrip multi-anode multichannel plate ...
7
High-speed microstrip multi-anode multichannel plate detector system Andreas Riedo, Marek Tulej, Urs Rohner, and Peter Wurz Citation: Review of Scientific Instruments 88, 045114 (2017); doi: 10.1063/1.4981813 View online: http://dx.doi.org/10.1063/1.4981813 View Table of Contents: http://aip.scitation.org/toc/rsi/88/4 Published by the American Institute of Physics
Transcript of High-speed microstrip multi-anode multichannel plate ...

High-speed microstrip multi-anode multichannel plate detector systemAndreas Riedo, Marek Tulej, Urs Rohner, and Peter Wurz
Citation: Review of Scientific Instruments 88, 045114 (2017); doi: 10.1063/1.4981813View online: http://dx.doi.org/10.1063/1.4981813View Table of Contents: http://aip.scitation.org/toc/rsi/88/4Published by the American Institute of Physics
REVIEW OF SCIENTIFIC INSTRUMENTS 88, 045114 (2017)
High-speed microstrip multi-anode multichannel plate detector systemAndreas Riedo,1,2,a) Marek Tulej,2 Urs Rohner,2,b) and Peter Wurz21Leiden Observatory, Sackler Laboratory for Astrophysics, Leiden University, Leiden, The Netherlands2Physics Institute, Space Research and Planetary Sciences, University of Bern, Bern, Switzerland
(Received 2 January 2017; accepted 8 April 2017; published online 26 April 2017)
High-speed detector systems with high dynamic range and pulse width characteristics in the sub-nanosecond regime are mandatory for high resolution and highly sensitive time-of-flight mass spec-trometers. Typically, for a reasonable detector area, an impedance-matched anode design is necessaryto transmit the registered signal fast and distortion-free from the anode to the signal acquisition sys-tem. In this report, a high-speed microstrip multi-anode multichannel plate detector is presented anddiscussed. The anode consists of four separate active concentric anode segments allowing a simul-taneous readout of signal with a dynamic range of about eight orders of magnitude. The impedancematched anode segments show pulse width of about 250 ps, measured at full width at half maximum,and rise time of ∼170 ps, measured with an oscilloscope with a sampling rate of 20 GS/s and 4GHz analogue bandwidth. The usage of multichannel plates as signal amplifier allowed the design ofa lightweight, low power consuming, and compact detector system, suitable, e.g., for the integrationinto space instrumentation or portable systems where size, weight, and power consumption are limitedparameters. Published by AIP Publishing. [http://dx.doi.org/10.1063/1.4981813]
I. INTRODUCTION
High-speed detector systems are key elements and manda-tory for high mass resolution time-of-flight (TOF) mass spec-trometry. Slow detector response times (rise/fall times) limitthe mass resolution of a TOF mass spectrometer (becausem/∆m = t/2∆t, with m the mass and t the flight time of anion) and therefore the overall analytical performance of thesystem. For TOF mass spectrometry, response times in the sub-nanosecond regime are typically required for the detection ofpulse widths in the nanosecond range. Detector systems basedon multichannel plates (MCPs) are usually used in such instru-mentation due to their fast response times and high amplifica-tion of incoming signal. To date, several different designs offast MCP detectors are commercially available from commer-cial suppliers, such as Photonis or Hammamatsu Photonics.The realization of fast response times and the distortion freetransmission of recorded signals is highly demanding and spe-cial attention needs to be devoted on the electronic design ofthe detection system, e.g., impedance matched anode design,the integration of dedicated signal lines and couplings, amongothers. The concept of an impedance matched anode designis known since 1970s and was first introduced by Wiza bydiscussing a conical anode design.1
Since decades, we have developed various MCPdetector systems for different applications.2–13 Most ofthem were designed for the integration into space instru-mentation, including the detector system for the reflec-tron TOF (RTOF) mass spectrometer onboard EuropeanSpace Agency’s (ESA) Rosetta spacecraft to the comet
a)Author to whom correspondence should be addressed. Electronic mail:[email protected]
b)Present address: TOFWERK AG, Uttigenstrasse 22, 3600 Thun, Switzer-land.
67P/Churyumov-Gerasimenko,7 for the neutral gas mass spec-trometer for the Polar-Balloon Atmospheric CompositionExperiment (P-BACE) mission,9,10 for the miniature lasermass spectrometer designed for the planetary rover onboardESA’s BepiColombo space mission to Mercury,12 or for the gaschromatograph-mass spectrometer for the upcoming RussianLuna-Resurs mission to the Moon.8 Typically, strict require-ments concerning mass, size, and power consumption need tobe fulfilled for an instrument to be part of the scientific pay-load of a spacecraft. The design of detector systems based ona MCP concept is of high interest in this field of research dueto their low power consumption, compact dimensions, lightweight, and large active area for detection.
Here we present the design and performance evaluationof a high-speed microstrip multi-anode MCP detector systemintegrated in our laser ablation/ionization mass spectrome-ter.14–16 The design is based on the detector system developedfor the laser mass spectrometer instrument for the lander plat-form onboard ESA’s BepiColombo space mission but signif-icantly and steadily improved since its first version.11 Pleasenote that the lander platform was cancelled by ESA due tobudgetary reasons and with it all instrumentation foreseen forthe lander and rover. The detector system consists of four 50Ωimpedance-matched active anode channels, shows a full widthmeasured at half maximum (FWHM) of recorded signal in therange of 200–300 ps, and a rise time of about 170 ps. Further-more, the simultaneous readout of the electric signals of theactive anode channels provide a dynamic range of about eightorders of magnitude as discussed first time by Riedo et al.,2013.17
II. DETECTOR DESIGN
The described detector system is integrated in a miniaturereflectron-type TOF laser ablation/ionization mass spectrom-eter (160 mm × Ø 60 mm, instrument name LMS) for the
0034-6748/2017/88(4)/045114/6/$30.00 88, 045114-1 Published by AIP Publishing.

045114-2 Riedo et al. Rev. Sci. Instrum. 88, 045114 (2017)
quantitative and sensitive in situ identification of the elemen-tal and isotope composition of solids and soils on the surfaceof planetary objects, including asteroids, moons, and plan-ets. The design and principles of operation of LMS, includingits measurement performance, are described extensively inprevious publications.16–26 LMS has the capabilities to pro-vide sensitive and quantitative elemental analysis at the 10ppb level,16,17 accurate isotope ratio measurements,21 2D19,20
and 3D26 elemental imaging of heterogeneous materials, highresolution chemical depth profiling at sub-nm scale,18,24 andmost recently demonstrated measurement capabilities towardsmolecular studies at minimized fragmentation.25 Neverthe-less, a brief description is provided in the following for abetter understanding of the design and functionality of theinstrument.
A pulsed laser system is used as an ablation/ionizationsource of solid sample material. The laser pulses are guidedwith a laser optical system to the top of the mass spectrom-eter, which is located within a vacuum chamber, and arefocused with a lens system through the center of the ionoptical system of the mass spectrometer towards the solidsample material.16 Each laser shot is removing and ionizingsimultaneously the sample material. Only positively chargedspecies can enter the ion optical system of the mass spec-trometer. After entering the system, the ion optical systemaccelerates (voltage of up to about 2.5 kV), focuses (volt-age of up to about 2.5 kV), and confines the ions towardsthe field free drift path (drift tube, mass to charge m/z sep-aration, voltage of up to about 1.2 kV) by passing first theconcentric detector system (center hole of Ø 6.4 mm). Theions are subsequently reflected at the ion mirror (voltages inthe range of about 200 V to +500 V), pass a second time thefield free drift path, and are finally registered by the detectorsystem (Fig. 1). Depending on the measurement campaign,including, e.g., element analysis, isotope analysis, chemicaldepth profiling, and characteristics of sample material, theapplied voltages on the ion optics vary. Because of the smallsize of the LMS instrument, the varying plasma conditionsfor the different samples translate into different ion opticalsettings. The voltages are optimized for, e.g., best ion transmis-sion of a certain element/isotope or mass resolution (m/∆m)using an adaptive swarm algorithm software.22 In Riedo et al.,2013,17 a complete and representative set of applied voltages islisted.
Ions of different mass are arriving at the detector system intime sequences, according to their m/z ratio (according to theTOF measurement principle17). Typically, a full TOF spec-trum, ranging from the detection of hydrogen to lead, has atime length of about 13 µs in the LMS instrument, which cor-responds to the arrival time of lead.17 Once the ion cloud ofthe same m/z ratio arrives at the MCP detector system, the ionsare electrically amplified by their initiated electron avalanches.The avalanches are collected finally by the segmented anodesystem (Fig. 1).
Figure 2 shows the electric schematics of the LMS detec-tor system. The incoming ions are electrically amplified by theMCP detector system, which consists of two matched MCPsin chevron configuration with an active area of 40 mm indiameter (Photonis, Inc. USA, Long-LifeTM Microchannel
FIG. 1. Left: A schematic drawing of the LMS instrument. Only positivelycharged ions can enter the mass spectrometer after the ablation and ionizationprocess of sample material. The positive ions are guided with the ion opticalsystem through the detector system, pass the field free drift path (drift tube),and are reflected subsequently at the ion mirror towards the MCP detector sys-tem.11,16 Right: Side view of the mechanical schematic of the anode system,part of the MCP detector system.
Plate Set, MCP 40/12/8/8 D 60:1 MP 6.4CH EDR, MS; withD for detection, MP for mounting pad, CH for center hole inmm, EDR for extended dynamic range, and MS for matchedset). A set of dedicated resistors (R1 and R2, in series to thehigh voltage supplies of the plates) and capacitors (CMCP1 andCMCP2, in parallel to the plates) is connected in close prox-imity to each of the MCPs allowing high speed provision ofelectrons for the electron pulses after an ion hit on the detec-tor system. The implementation of the capacitors in parallelconfiguration allows best, in terms of speed, electron feedingof the MCPs.5 A segmented microstrip anode plate, a systemof 5 concentric areas (channels) each isolated to each other,is used to collect the electron pulses from the registered ions.
FIG. 2. Electric schematics of the LMS detector system.

045114-3 Riedo et al. Rev. Sci. Instrum. 88, 045114 (2017)
TABLE I. Key parameters of the LMS detector system.
Overall dimension 7.5 mm × Ø 70 mmWeight 100 gPower consumption ≤1 WVoltages
MCP 1 1.80 kV to 2.1 kVMCP 2 250 V
AnodeDesign PCBSubstrate TeflonCoating Au# Channels 5, active 4
Channel dimensionCircular ring thickness of 2.8 mm,
spacing 0.2 mm
Coupling50 Ω, impedance matched,
microstrip designIntegrated MCPs
Dimensions Ø 50 mmActive area Ø 40 mmPore size Ø 8 µmPore angle 8
L/D 60:1Pitch 12 µmDesign Chevron configuration, 2 MCPsSupplier Photonis, Inc., USA
The anode is a custom-made high frequency circular microstripdesign and is realized on a printed circuit board (PCB). Theinner most area is grounded whereas the subsequent four chan-nels (2–5, Fig. 2) are designed for 50 Ω electrical impedance.Vacuum compatible coaxial cables are connected at the seg-mented anode plate transporting the signals to the high speedanalog-to-digital converter (ADC) and data acquisition systemby passing first the flange with subminiature version A (SMA)feed-throughs at the UHV chamber. In total, about 1 m of SMAcable is used between anode channels and acquisition system.The length of the coaxial cables is chosen as short as possibleto prevent peak broadening and distortion during signal trans-mission and to minimize noise pick-up. Special attention hasbeen devoted for the definition of the grounding concept of thedetector system by means of a single grounding point for allhigh voltage connections. In Table I, the key parameters of theLMS detector system are listed.
III. MEASUREMENTSA. Single ion events
Measurements were conducted within the LMS vacuumchamber, which has a typical base pressure of about 5 × 10⁸
mbar.8,9 Ion registrations on the LMS detector from ionizedresidual gas inside the vacuum chamber from the vacuumgauge at a rate of about 1 ion/s were used for the charac-terization of each anode area of the detector system (2–5,Fig. 2). Typically, two high speed ADC data acquisition cards(Keysight Technologies, each with two active channels, 8 bit,up to 4 GS/s) are used to record the electric signals duringmass spectrometric measurements. However, for the quantifi-cation of the detector performance, a high speed digital storage
oscilloscope (DSO, Tektronix, TEK TDS7404) with a sam-pling rate of 20 GS/s and an analogue bandwidth ofBW = 4 GHz was used. The sampling speed, corresponding to50 ps time intervals on the time axis, is sufficiently high but atlimit for the characterization of the reported detector system(see Sec. IV A).
Potential differences in the range of ∆V is 1550 V to1850 V were applied between the stack of the two MCPs(HV MCP1–HV MCP2 in Fig. 2), by stepwise increasing thispotential difference by 50 V. The applied voltage at the exitof the second MCP (HV MCP2, Fig. 2) was kept constant at250 V during the measurements. Home-made high-voltagepower supplies, offering sufficient high voltage resolution ofthe applied voltages (∼1 V), were used for the performanceevaluation. For each channel and each applied potential dif-ference, ten single ion events were recorded. The raw datawere forwarded from the oscilloscope to a host-computer forsubsequent data analyses. Standard fit routines (provided bythe program OriginPro, OriginLab) were used for the charac-terization of recorded electric signals, which is the full widthat half maximum (FWHM), and rise time of detected electricsignals. The function Gauss Amplitude was used as fit func-tion, showing best match with the detected signal and definedby
y = y0 + A* exp (− 0.5*((x − xc)/w)2),
where y0 denotes the offset (background), A the amplitude,xc the peak center, and w the Gaussian width of the recordedpeak.
B. Dynamic range
Mass spectrometric measurements were conducted on aNational Institute of Standard and Technology (NIST) certi-fied reference material (SRM665) to demonstrate the dynamicrange performance of the system. A femtosecond laser system(CPA system, Clark-MXR, Inc., Dexter, MI, USA; pulse widthτ ∼ 190 fs, wavelength λ = 775 nm, laser pulse repetition rate≤1 kHz) was used in this study for clean ablation and efficientionization of sample material. Depending on the measurementcampaign, ranging from chemical depth profiling analysis ofsemiconductor materials18,24 to chemical analysis of microm-eter fossils embedded in a host matrix,23 the laser irradianceneeds to be adjusted, typically ranging from sub TW/cm2 totens of TW/cm2, corresponding to pulse energies in the rangeof sub µJ to a few µJ and ablation craters with about 10 to 20µm in diameter. Here, a laser irradiance of about 0.3 TW/cm2
was applied for ablation and ionization of sample material.The electric signals were recorded using the two high-speedADC data acquisition cards described above in this contribu-tion. The mass spectrum used to evaluate the dynamic rangeconsists of an accumulation of 200 000 single laser shot massspectra. The single laser shot mass spectra were sequentiallyaccumulated first on the acquisition system to a single massspectrum consisting of 2000 single laser shot mass spectra,which is stored on the host computer (in total 100 such massspectra). A software routine written in Matlab was used forpost-processing these data and for the co-adding of these 100mass spectra into the final mass spectrum.

045114-4 Riedo et al. Rev. Sci. Instrum. 88, 045114 (2017)
IV. DISCUSSIONA. Single ion events
A typical recording with the DSO of the electric signal ofa single ion event is shown in the top panel of Fig. 3 as a blackline (anode channel 4, ∆VMCP over MCP stack of 1.65 kV).The red line in Fig. 3 corresponds to the Gauss Amplitudefit of the measured data, as discussed in the previous para-graph. In the bottom panel, the residuals between the fit andraw data are shown, considering only the time range used forthe fit. In this example, a FWHM of 266 ps, a rise time of 190ps (10% to 90% level), and a signal amplitude of 4.73 mVwere measured. Considering the peak broadening by the ana-log bandwidth of the oscilloscope, for which the rise time canbe estimated as trise ≈ 1/(3 × BW) = 83 ps,2,5 we calculate adeconvolved rise time of∼170 ps. Additionally, the peak shapeis highly symmetric, and no significant electrical ringing tothe tailing side of the peak is observed. Ringing and broad-ening are typical results of an impedance mismatch some-where along the transmission between acquisition and detectorsystem.
Many of today’s commercially available standard MCPdetector systems (chevron configuration) show typical pulsewidths (FWHM) in the order of 500 ps, rise times below 300ps, and consist typically of a single anode, see, e.g., prod-uct line of Hammamatsu Photonics or Photonis. The Gen2UltraFastTM TOF Detector system from the company Photo-nis is, to our best knowledge, one of the fastest MCP detectorsystem today commercially available on the market. The sys-tem (active area of 18 mm in diameter, MCP pore diameter of
FIG. 3. Single ion event registered on anode channel 4 recorded with theDSO (20 Gs/s, 4 GHz BW); a potential difference ∆VMCP of 1.65 kV wasapplied over the MCP stack. Top panel: raw signal (black line) with a GaussAmplitude fit of the pulse (red line) is shown. The detected signal shows apulse width measured at FWHM of about 266 ps, signal amplitude of about4.7 mV, and a rise time of 190 ps. Bottom panel: residuals between raw andfitted data over time range used for fit (see top panel).
2 µm, single anode) shows pulse widths (FWHM) shorter than200 ps and rise times close to 125 ps. The usage of MCPs withpore diameters of only a few microns is of considerable interestif fastest pulse characteristics are required for the experimentalsetup, since rise time and pulse width roughly scale with thepore size of the channel plates.4,5,27
For the large active area of Ø 40 mm needed for our sys-tem, MCPs with pore diameter of 2 µm are too thin to bepractical. We decided to use multichannel plates with porediameters of 8 µm. To cover the active area, a requirement ofour instrument setup, and to allow for a large dynamic range,we designed a multi-anode system for simultaneous readoutof electrical signals from this large active area. The currentdesign fulfils our target parameters of high amplification ofdetected ions and high dynamic range of about eight orders ofmagnitude, discussed in Sec. IV B.
Figure 4 shows the correlation between measured pulsewidth (FWHM) and signal amplitude of detected single ion sig-nals for all anode channels (2–5, Fig. 2). All channels show acomparable measurement performance in terms of pulse widthand signal amplitude dependences on the applied MCP volt-age. A logarithmic trend (solid black line) between measuredpulse width and signal amplitude can be observed for all chan-nels. The measurements scatter with about ±10% around thislogarithmic trend line. Fastest signals with a measured pulsewidth of about 200–300 ps (not bandwidth corrected) withlowest signal amplitudes of about 2 mV were measured atlowest applied potential difference (∆VMCP = 1.55 kV). Byincreasing the applied potential difference at the detector sys-tem, an increase of signal amplitudes with increasing pulsewidth can be observed. We conjecture that space charge effectsinside the pores of the MCPs are the source of this broadeningeffect. At an increased number density of electrons (increasedspace charge) within a single MCP pore, Coulombic repul-sion becomes non-negligible and will spread the electron cloudalong the pore axis and hence broadens the registered chargepulse in time.
In Table II, an estimation of generated electrons per MCPpore at two extremes of applied potential differences at thedetector system (∆VMCP of 1.55 kV and 1.85 kV) is given.The calculation is based on measurements conducted on anodechannel 3 (measured single ion events) and by estimating thatthe electron cloud generated in one pore of MCP1 is distributedover 10 single pores on MCP2 (based on geometrical consid-erations). The total number of electrons (or modal gain, 2ndcolumn in Table II) generated for one single ion event can bederived from the integration over time of the detected signaland knowing that we have a 50 Ω impedance matched detec-tor design. The increase of the potential difference of about300 V results in an increase of the modal gain, that is, thenumber of generated electrons in a single MCP pore, of abouttwo decades. As a rule of thumb, every 50 V increase of thepotential difference increases the modal gain by a factor ofabout 2.
B. Dynamic range
The design of a detector system with a dynamic range(simultaneous readout of large and small signals) covering

045114-5 Riedo et al. Rev. Sci. Instrum. 88, 045114 (2017)
FIG. 4. Correlation between detected signal amplitudes and pulse widths (FWHM) of single ion events measured at anode channels 2–5 and applying potentialdifferences ∆V over the MCP stack in the range of 1.55 kV to 1.85 kV. A logarithmic trend (black solid line) between increasing pulse widths with increasingsignal amplitudes for all channels can be observed. The individual measurements scatter around the logarithmic trend line (shown by the dashed curves ±10%of logarithmic fit).
several orders of magnitude is typical of high interest in massspectrometric measurements. A high dynamic range allows insingle measurements the quantification of the abundance ofmajor to trace elements in a sample or the detection of iso-topes of an element showing a high variation in their isotopefractions, e.g., the isotopes of Pt with variations in isotopeabundances from 33.832 for 195Pt to 0.014 for 190Pt (weightpercentages).28
The segmented anode system of the LMS detector sys-tem allows the simultaneous recording and read-out of electricsignals at different gain levels because of the different geomet-ric factor of the anodes, the different ion flux from the massanalyser on the anode segments, and the different electronic
TABLE II. Calculation of the modal gain at two extremes of applied poten-tial differences for the estimation of the number of electrons per MCP pore.Measurements conducted on anode channel 3 were used for the calculations.The increase of the potential difference at the detector system by about 300 Vresults in an increase of number of electrons of about two decades.
Applied # Electrons # Electrons/MCP Measured FWHM/amplitude∆ (V) (gain) pore (ps/mV)
1550 ∼6.4 × 10⁴ ∼6.4 × 10³ ∼266/∼2.01850 ∼3.0 × 10⁶ ∼3.0 × 10⁵ ∼580/∼31.4
gains of the signal acquisition system for each channel. Forexample, mass spectrometric measurements with LMS are typ-ically accomplished by recording the signals at three differentelectronic gain levels, ranging from the so called High-Gain(HG), Mid-Gain (MG), and Low-Gain (LG) channel.17 In theHG channel, the gain level is set to the highest possible valueallowing the detection of the smallest electric signals corre-sponding to the trace elements or isotopes within the samplematerial (element and isotope abundances down to ppb level).In this channel intense signals, corresponding to elements ofmajor abundance, are saturated in the electronics and cannotbe quantified correctly. These elements are recorded in theLG channel with the lowest gain value. Elements and isotopesof low abundance that are hardly detected in the LG chan-nel or are saturated in the HG channel can be recorded in theMG channel. Once the measurement is accomplished in allchannels simultaneously, a superposition of these channels canbe realized by means of selecting detected elements/isotopesin channels that are not saturated. The superposition proce-dure is discussed in more detail in a previous publicationwhere the elements B and C are used as elements/isotopesto inter-calibrate between the three active channels.17
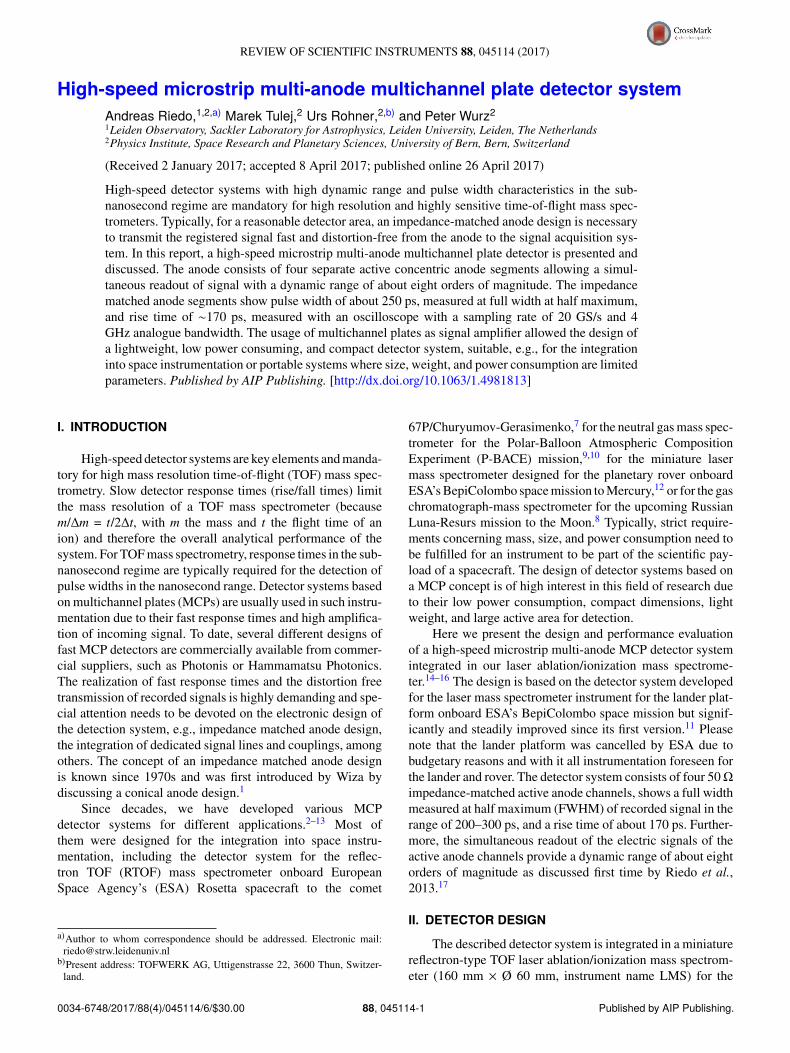
In Figure 5, the superposition of the LG (in red) andHG (in black) spectrum is shown. For simplicity, only the
045114-6 Riedo et al. Rev. Sci. Instrum. 88, 045114 (2017)
FIG. 5. Superimposed HG (black) and LG (red) mass spectra of a measure-ment campaign conducted on NIST SRM 665. In this campaign, a dynamicrange of about 7.5 orders of magnitude is accomplished.
signals from HG and LG channels are shown. High abundantspecies are detected in the LG spectrum without artefacts ofsaturation. In the HG spectrum, low abundant species can beanalyzed, e.g., Mo isotopes with abundances of only a few ppm(atomic fraction), however, at the expense that high abundantelements/isotopes are saturated. Taken together, the HG andLG spectra allow for a spectrometric analysis over about 7.5decades of signal intensities.
V. CONCLUSIONS
The design and performance of a microstrip multi-anodemultichannel plate detector system originally designed forlaser ablation/ionization mass spectrometry are discussed. Thesystem consists of four active impedance matched microstripconcentric anode channels for simultaneous read-out of theelectrical signals from the MCPs. The different channelscan be recorded at different gain levels, which allow massspectrometric investigations with a dynamic range of abouteight orders of magnitude. The implemented electrical con-cept, including the dedicated sets of resistors and capaci-tors, allows fast rise times of about 170 ps (bandwidth cor-rected) and measured pulse widths in the range of 200–300ps of recorded single ion events. The compact, lightweight,and low power consuming design of the detector systemallows the implementation into space instrumentation orportable instruments where these parameters are of specialinterest.
ACKNOWLEDGMENTS
This work is supported by the Swiss National ScienceFoundation.
1J. L. Wiza, Nucl. Instrum. Methods 162, 587 (1979).2R. Schletti, P. Wurz, S. Scherer, and O. H. Siegmund, Rev. Sci. Instrum.72(3), 1634 (2001).
3P. Wurz and R. Schletti, Rev. Sci. Instrum. 72(8), 3225 (2001).4P. Wurz and L. Gubler, Rev. Sci. Instrum. 65(4), 871 (1994).5P. Wurz and L. Gubler, Rev. Sci. Instrum. 67(5), 1790 (1996).6R. Rispoli, E. De Angelis, L. Colasanti, N. Vertolli, S. Orsini, J. A. Scheer,A. Mura, A. Milillo, P. Wurz, S. Selci, A. M. Di Lellis, R. Leoni,M. D’Alessandro, F. Mattioli, and S. Cibella, Opt. Eng. 52(5), 051206(2013).
7O. H. W. Siegmund, K. E. Kromer, P. Wurz, R. Schletti, and H. Cottard,Proc. SPIE 4140, X-Ray and Gamma-Ray Instrumentation for AstronomyXI, 229 (2000).
8L. Hofer, P. Wurz, A. Buch, M. Cabane, P. Coll, D. Coscia, M. Gersimov,D. Lasi, A. Sapgir, C. Szopa, and M. Tulej, Planet. Space Sci. 111, 126(2015).
9D. Abplanalp, P. Wurz, L. Huber, I. Leya, E. Kopp, U. Rohner, M. Wieser,L. Kalla, and S. Barabash, Adv. Space Res. 44, 870 (2009).
10P. Wurz, D. Aplanalp, M. Tulej, and H. Lammer, Planet. Space Sci. 74, 264(2012).
11U. Rohner, J. Whitby, and P. Wurz, Meas. Sci. Technol. 14, 2159 (2003).12U. Rohner, J. A. Whitby, P. Wurz, and S. Barabash, Rev. Sci. Instrum. 75,
1314 (2004).13M. Tulej, S. Meyer, M. Luthi, D. Lasi, A. Galli, L. Desorgher, W. Hajdas,
S. Karlsson, L. Kalla, and P. Wurz, Rev. Sci. Instrum. 86, 083310 (2015).14D. D. Grieg and H. F. Engelmann, Proc. IRE 40, 1644 (1952).15R. Garg, I. Bahl, and M. Bozzi, Microstrip Lines and Slotlines, 3rd ed.
(Artech House, Boston, London, 2013).16A. Riedo, M. Neuland, S. Meyer, M. Tulej, and P. Wurz, J. Anal. At.
Spectrom. 28, 1256 (2013).17A. Riedo, A. Bieler, M. Neuland, M. Tulej, and P. Wurz, J. Mass Spectrom.
48, 1 (2013).18V. Grimaudo, P. Moreno-Garcıa, A. Riedo, M. B. Neuland, M. Tulej,
P. Broekmann, and P. Wurz, Anal. Chem. 87, 2037 (2015).19M. Tulej, A. Riedo, M. B. Neuland, S. Meyer, P. Wurz, N. Thomas,
V. Grimaudo, P. Moreno-Garcıa, P. Broekmann, A. Neubeck, and M. Ivars-son, Geostand. Geoanal. Res. 38, 441 (2014).
20M. B. Neuland, S. Meyer, K. Mezger, A. Riedo, M. Tulej, and P. Wurz,Planet. Space Sci. 101, 196 (2014).
21A. Riedo, S. Meyer, B. Heredia, M. B. Neuland, A. Bieler, M. Tulej, I. Leya,M. Iakovleva, K. Mezger, and P. Wurz, Planet. Space Sci. 87, 1 (2013).
22A. Bieler, K. Altwegg, L. Hofer, A. Jackel, A. Riedo, T. Semon,P. Wahlstrom, and P. Wurz, J. Mass Spectrom. 46, 1143 (2011).
23M. Tulej, A. Neubeck, M. Ivarsson, A. Riedo, M. Neuland, S. Meyer, andP. Wurz, Astrobiology 15, 669 (2015).
24A. Riedo, V. Grimaudo, P. Moreno-Garcıa, M. B. Neuland, M. Tulej,P. Wurz, and P. Broekmann, J. Anal. At. Spectrom. 30, 2371 (2015).
25P. Moreno-Garcıa, V. Grimaudo, A. Riedo, M. Tulej, M. B. Neuland,P. Wurz, and P. Broekmann, Electrochim. Acta 199, 394 (2016).
26V. Grimaudo, P. Moreno-Garcia, A. Riedo, S. Meyer, M. Tulej, M. B.Neuland, M. Mohos, C. Gutz, S. R. Waldvogel, P. Wurz, and P. Broekmann,Anal. Chem. 89, 1632 (2017).
27H. Kume, K. Koyama, K. Nakatsugawa, S. Suzuki, and D. Fatlowitz, Appl.Opt. 27, 1170 (1988).
28J. S. Becker, Inorganic Mass Spectrometry-Principles and Applications(John Wiley & Sons, Ltd., England, 2007).