
High Speed Characterization Report - Samtec...
17
High Speed Characterization Report EEDP-016-39.36-DV1-DV2-1 EEDP-016-39.36-DV1-DV2-2 (Mated with HSEC-125-01-X-DV) REVISION DATE: February 7, 2005
Transcript of High Speed Characterization Report - Samtec...
High Speed Characterization Report
EEDP-016-39.36-DV1-DV2-1 EEDP-016-39.36-DV1-DV2-2
(Mated with HSEC-125-01-X-DV)
REVISION DATE: February 7, 2005

High Speed Characterization Report – EEDP Series
TABLE OF CONTENTS
Revision Date: 02/07/2005 ii
Introduction....................................................................................................................... 1 Product Description.......................................................................................................... 1 Results Summary .............................................................................................................. 2
Time Domain Data ....................................................................................................... 2 Differential Impedance ............................................................................................. 2 Timing Delay Measurements.................................................................................... 3 NEXT.......................................................................................................................... 3 FEXT .......................................................................................................................... 4
Frequency Domain Data .............................................................................................. 5 Differential Insertion Loss ........................................................................................ 5 Differential Return Loss ........................................................................................... 7 Differential Near-End Crosstalk.............................................................................. 9 Differential Far End Crosstalk .............................................................................. 10
Test Procedures............................................................................................................... 11
Fixturing...................................................................................................................... 11 Time Domain Testing................................................................................................. 13
Differential Impedance ........................................................................................... 13 Propagation Delay ................................................................................................... 13 Skew.......................................................................................................................... 13 NEXT and FEXT..................................................................................................... 13
Frequency Domain Testing........................................................................................ 14 Attenuation............................................................................................................... 14 Return Loss .............................................................................................................. 14 Near and Far End Crosstalk .................................................................................. 14
Equipment ....................................................................................................................... 15

High Speed Characterization Report – EEDP Series
Revision Date: 02/07/2005 1
Introduction This testing was performed to evaluate the electrical performance of the EEDP family of twin-ax, interface card cable assemblies. Testing was performed in accordance to the High Performance Electrical Interconnect (HPEI) SFF-84161, Level 1, testing standards when applicable. Differential time domain and frequency domain measurements were made. In the time domain differential impedance, near-end and far-end crosstalk (NEXT and FEXT, respectively), propagation delay, and skew were measured. Frequency domain measurements were preformed using TDA’s IConnect software (Version 3.0.2 MX) and include differential insertion loss (IL), return loss (RL), NEXT and FEXT. All measurements were made by mating each sample to a HSEC8 (P/N: HSEC8-125-01-x-DV) high-speed socket which is mounted to test boards that were specifically designed for this project; referred to in this report as Test PCBs. It should be noted that for differential impedance, skew, insertion loss and return loss the longest and the shortest electrical paths were tested. Because the cables are of equal length the longest and shortest electrical paths were determined by the trace lengths of the termination cards, (See Figure 1 on the next page). Product Description The sample consisted of a two 39.36 inch length of Hitachi 30 AWG ribbon twin-ax cable terminated, at both ends, with a termination card (P/N: HSC8-025-01-25-DP) soldered to the respective cable. There are two types of termination cards that exist; a non-crossover card which is green in color and a crossover card which is red. The use of different termination cards allow for crossover and non-crossover cable assemblies. For this product line, a cable assembly with pin 1 to pin 1 (non-crossover) mapping is achieved using one green and one red termination card. Conversely, a cable assembly with pin 1 to pin 2 (crossover) mapping is achieved with two green termination cards. Refer to Figure 1 on the following page. Also, refer to the product drawings that are available at www.samtec.com/technical_specifications/overview.asp?series=EEDP for more pin out information. The ends are then cover with plastic caps.
Termination PCB Length (in) Product Number Mapping End J1 End J2 39.36 EEDP-016-39.36-DV1-DV2-1 Pin 1 --> Pin1 Green Green 39.36 EEDP-016-39.36-DV1-DV2-2 Pin 1 --> Pin2 Green Red
Table 1: EEDP Sample Descriptions. 1 Measurement and Performance Requirements for HPEI Bulk Cable, Rev 10, March 25, 2004

High Speed Characterization Report – EEDP Series
Revision Date: 02/07/2005 2
Figure 1: Sample tested: EEDP-016-19.68-DV1-DV2-1; shown with caps off Results Summary Time Domain Data Differential Impedance Differential impedance measurements were performed using a filtered risetime of 100ps. Note that all measurements were performed with the cable assembly mated to the respective connector/Test PCBs. Data was measured at the cable termination and 200ps into the cable. The sub headings J1 and J2 under End Options represent the near-end cable assembly connector and the Zmin and Zmax column headings represent the minimum and maximum differential impedances found across the respective mated connector region. Note that the non-crossover version, EEDP-39.36-DV1-DV2-2, uses the same termination card at both ends; therefore, no impedance measurement was made at the opposing end of the non-crossover version.
Table 2: Differential Impedance Measurements; tr=100ps
End Option Cable J1 J2 J1 J2 Assembly Path
ZDiff-min (Ω) ZDiff-max (Ω) ZDiff-min (Ω) ZDiff-max (Ω) ZDiff (Ω) ZDiff (Ω) Long 79.2 100.0 80.2 100.0 100.4 100.4 EEDP-39.36-1 Short 79.2 100.0 80.2 100.0 99.6 101.2 Long 79.2 100.0 N/A 100.0 98.8 N/A EEDP-39.36-2 Short 78.9 100.0 N/A 100.0 98.0 N/A

High Speed Characterization Report – EEDP Series
Revision Date: 02/07/2005 3
Timing Delay Measurements Skew was calculated as the difference between the propagation delay of the longest and the shortest electrical paths and is reported in Table 3 below. Note that both cables on each sample are the same length and are both terminated to a termination card (edge card); therefore, the longest and shortest electrical paths are selected relative to the termination card. The outermost differential pair 4/6 is the longest and an inner pair 16/18 is the shortest electrical path.
Skew Assembly Path Propagation Delay (nS) Long - Short (pS)
Long 4.983 EEDP-39.36-1 Short 4.888
5
Long 4.875 EEDP-39.36-2 Short 4.888
13
Table 3: Timing Measurements NEXT The near-end crosstalk was measured in the time domain, as a differential voltage, using a filtered risetime of 100ps and then converted to a percentage of the drive voltage and reported below in Table 4. Note that because of the construction of the termination card only one differential pair per sample was tested. The aggressor pair is 28 & 30 and the victim pair is 22 & 24. The J1 and J2 sub headings in Table 4 represent the near-end cable assembly connector. All NEXT measurements were performed with the cable assembly mated to the respective connector/Test PCB. Since most of the crosstalk occurs in the connectors, the values in Table 4 represent the crosstalk that occurs in the near-end mated cable assembly and the Test PCBs connectors.
End Option J1 J2 Assembly
NEXT (mV) NEXT (%) NEXT (mV) NEXT (%) EEDP-39.36-1 1.32 0.3 1.88 0.4 EEDP-39.36-2 1.28 0.3 N/A N/A
Table 4: % NEXT; tr=100ps

High Speed Characterization Report – EEDP Series
Revision Date: 02/07/2005 4
FEXT The far-end crosstalk was measured in the time domain, as a differential voltage, using a filtered risetime of 100ps and then converted to a percentage of the drive voltage and reported below in Table 5. Note that because of the construction of the termination card only one differential pair per sample was tested. For non-crossover sample the aggressor pair is 28 & 30 and the victim pair is 22 & 24 and for the crossover sample the aggressor pair is 28 & 30 and the victim pair is 21 & 23. The J1 and J2 sub headings in Table 5 represent the near-end cable assembly connector. FEXT was measured at the far-end and includes the cumulative crosstalk of the mated cable assembly, Test PCBs connectors and the cable itself.
Table 5: % FEXT; tr=100ps
End Option J1 J2 Assembly
FEXT (mV) FEXT (%) FEXT (mV) FEXT (%) EEDP-39.36-1 1.80 0.4 1.76 0.4 EEDP-39.36-2 1.64 0.4 N/A N/A

High Speed Characterization Report – EEDP Series
Revision Date: 02/07/2005 5
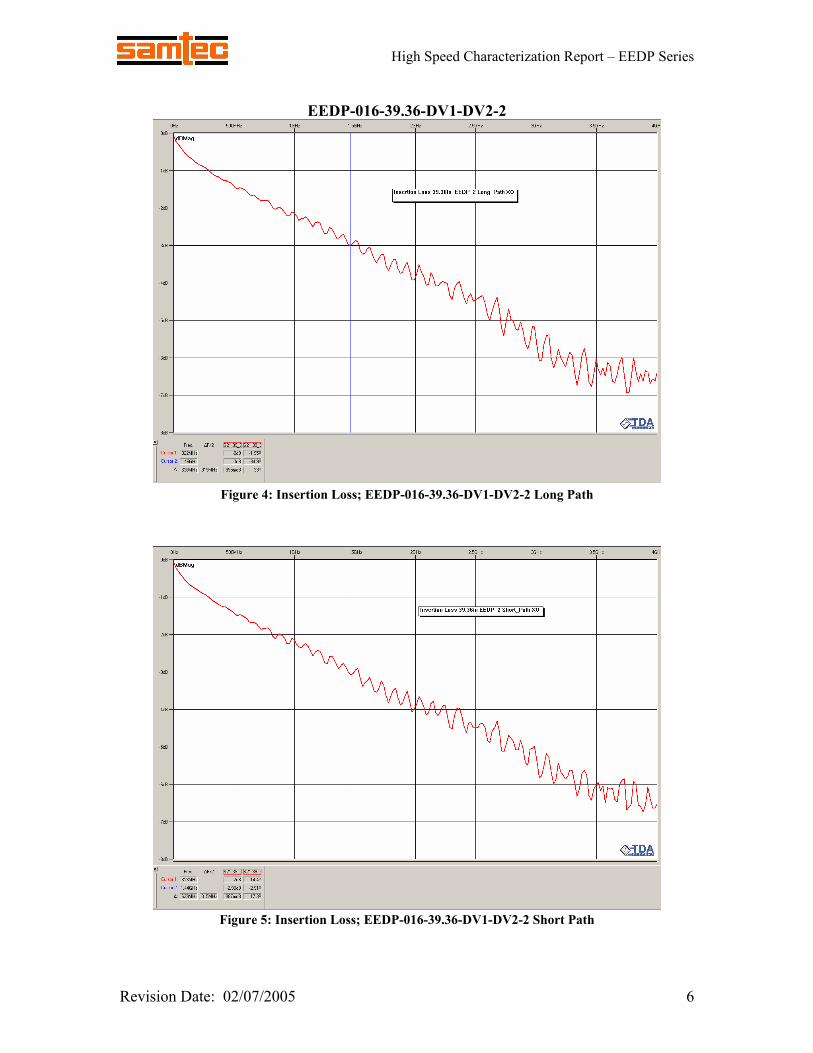
Frequency Domain Data Differential Insertion Loss
EEDP-016-39.36-DV1-DV2-1
Figure 2: Insertion Loss; EEDP-016-39.36-DV1-DV2-1 Long Path
Figure 3: Insertion Loss; EEDP-016-39.36-DV1-DV2-1 Short Path
High Speed Characterization Report – EEDP Series
Revision Date: 02/07/2005 6
EEDP-016-39.36-DV1-DV2-2
Figure 4: Insertion Loss; EEDP-016-39.36-DV1-DV2-2 Long Path
Figure 5: Insertion Loss; EEDP-016-39.36-DV1-DV2-2 Short Path

High Speed Characterization Report – EEDP Series
Revision Date: 02/07/2005 7
Differential Return Loss
EEDP-016-39.36-DV1-DV2-1
Figure 6: Return Loss; EEDP-016-39.36-DV1-DV2-1 Long Path
Figure 7: Return Loss; EEDP-016-39.36-DV1-DV2-1 Short Path

High Speed Characterization Report – EEDP Series
Revision Date: 02/07/2005 8
EEDP-016-39.36-DV1-DV2-2
Figure 8: Return Loss; EEDP-016-39.36-DV1-DV2-2 Long Path
Figure 9: Return Loss; EEDP-016-39.36-DV1-DV2-2 Short Path

High Speed Characterization Report – EEDP Series
Revision Date: 02/07/2005 9
Differential Near-End Crosstalk
EEDP-016-39.36-DV1-DV2-X
Figure 10: NEXT; EEDP-016-39.36-DV1-DV2-1 Aggressor-Lines 28/30, Victim-Lines 22/24
Figure 11: NEXT; EEDP-016-39.36-DV1-DV2-2 Aggressor-Lines 28/30, Victim-Lines 22/24
High Speed Characterization Report – EEDP Series
Revision Date: 02/07/2005 10
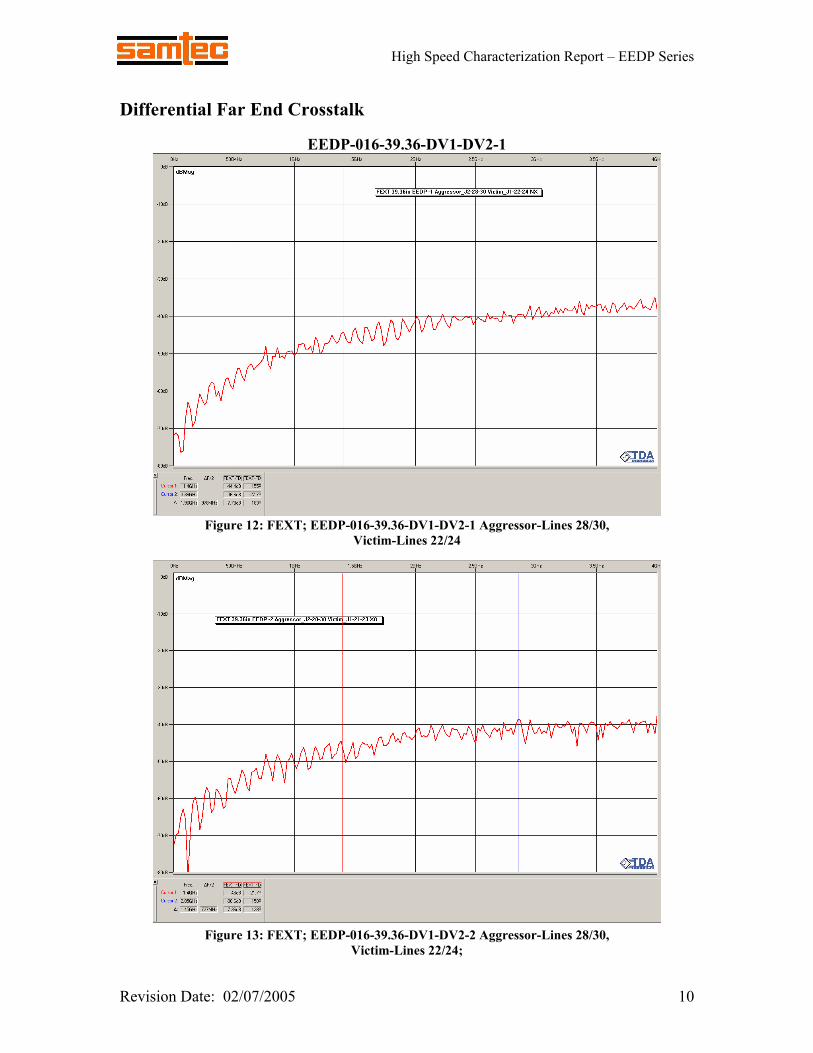
Differential Far End Crosstalk
EEDP-016-39.36-DV1-DV2-1
Figure 12: FEXT; EEDP-016-39.36-DV1-DV2-1 Aggressor-Lines 28/30, Victim-Lines 22/24
Figure 13: FEXT; EEDP-016-39.36-DV1-DV2-2 Aggressor-Lines 28/30, Victim-Lines 22/24;

High Speed Characterization Report – EEDP Series
Revision Date: 02/07/2005 11
Test Procedures Fixturing All measurements were performed using test boards specifically designed for this project-referred to in this report as “Test PCBs.” The test boards all have trace lengths of 3.102 inches and provide for an interconnection to the sample under test by use of replaceable SMA connectors, which do not require soldering. For measurements that required reference measurements (insertion loss and propagation delay), a reference trace board was utilized as shown in Figure 14 below. The reference board was used to compensate for the losses due to the coaxial test cables, SMA launches and the Test PCBs traces during the measurement process. Figure 14: Test setup for Insertion Loss and Propagation Delay Reference acquisition Differential measurements were performed using the Test PCB as shown below in Figure 15. A picture of the Test PCB and an EEDP sample is shown in Figure 16 on the following page. Figure 15: Characterization test setup
TDR
TDR
Tektronix 11801B
Reference Board Coax Cable Coax Cable
SMA Launches
Tektronix 11801B
TDR
TDR
Tektronix 11801B
EEDP Sample
Near End Test Board Far End Test Board
Coax Cable Coax Cable
SMA Launches
TeKtronix 11801B
High Speed Characterization Report – EEDP Series
Revision Date: 02/07/2005 12
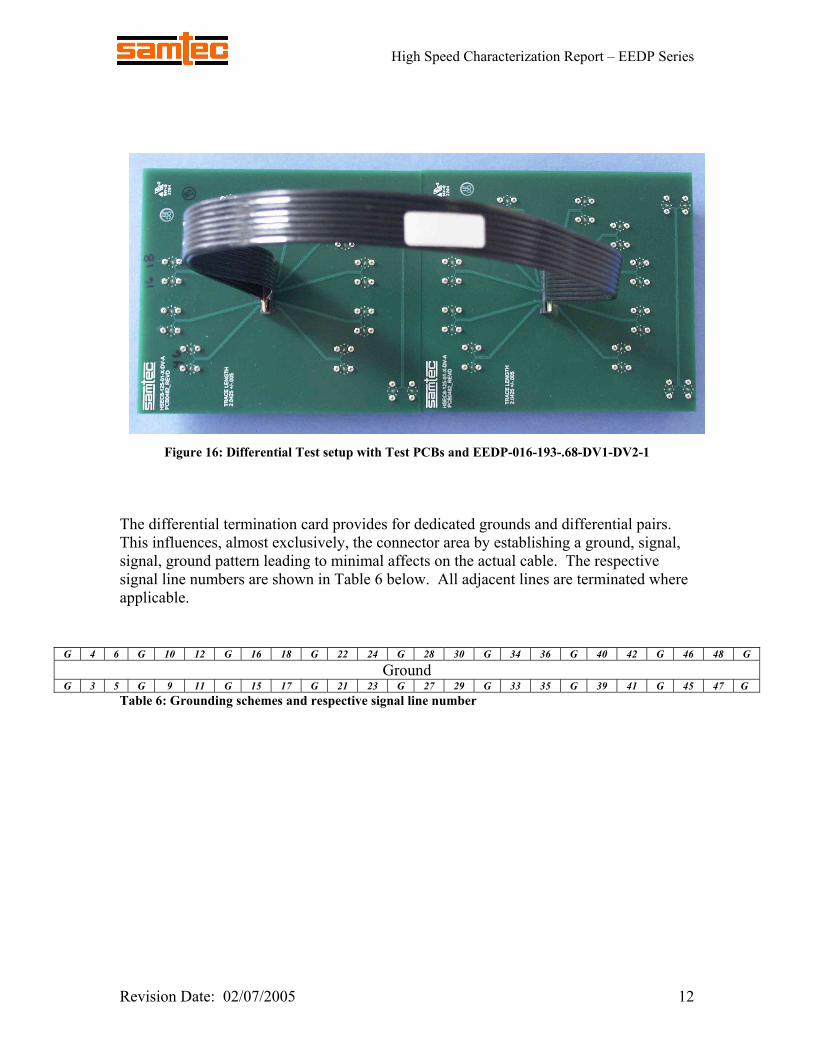
Figure 16: Differential Test setup with Test PCBs and EEDP-016-193-.68-DV1-DV2-1 The differential termination card provides for dedicated grounds and differential pairs. This influences, almost exclusively, the connector area by establishing a ground, signal, signal, ground pattern leading to minimal affects on the actual cable. The respective signal line numbers are shown in Table 6 below. All adjacent lines are terminated where applicable.
Table 6: Grounding schemes and respective signal line number
G 4 6 G 10 12 G 16 18 G 22 24 G 28 30 G 34 36 G 40 42 G 46 48 G Ground
G 3 5 G 9 11 G 15 17 G 21 23 G 27 29 G 33 35 G 39 41 G 45 47 G

High Speed Characterization Report – EEDP Series
Revision Date: 02/07/2005 13
Time Domain Testing Differential Impedance The Tektronix 11801B oscilloscope was set up in TDR (time domain reflectometry) mode using 100 averages and a 500-point record length. The horizontal scale was set to 100ps/div to allow the near-end connector and a portion of the cable to be displayed. The filtering function was set to 100ps. Measurements were made at the near-end of each sample. The differential impedance measurements include the mated cable connector and 200ps into the cable. Propagation Delay The time domain transmission capabilities (TDT) of the oscilloscope were used to measure the propagation delay. The delay of the test cables, SMA connectors, and a reference PCB were measured collectively and stored as an input reference waveform. The reference PCB was replaced by the sample and the Test PCBs. The pulse at the output of the sample was measured. The propagation delay was determined by using the propagation delay measurement function of the oscilloscope. This function measures the difference in time, at 50% level, between the output pulse and the input pulse. Skew The skew was calculated by taking the difference of the propagation delay measurements. It should be noted that both cables on each sample are the same length and the interface cards are edge cards; therefore, the longest and shortest electrical paths are selected relative to the interface card. The outermost differential pair 4/6 is the longest path and pair 16/18 is the shortest electrical path. NEXT and FEXT Near-end crosstalk (NEXT) and far-end crosstalk (FEXT) measurements were made using the Tektronix 11801B oscilloscope. A thru reference of the coaxial test cables, SMAs, and reference board was performed to compensate for the test setup losses (see Figure 37 on page 23). To acquire NEXT, a near-end differential pair was driven using the oscilloscope. NEXT was measured on an adjacent differential pair at the near-end (see Figure 17 on page 15). Acquiring FEXT, a near- end differential pair was driven with the oscilloscope. FEXT was measured on an adjacent differential pair at the far-end (see Figure 18 on page 15). All adjacent lines were terminated, at both ends, with 50Ω SMA loads; refer to Figures 17 and 18 on page 15.

High Speed Characterization Report – EEDP Series
Revision Date: 02/07/2005 14
Frequency Domain Testing Attenuation Insertion Loss measurements were made using the Tektronix 11801B oscilloscope. Testing was performed using a risetime of 35ps. The horizontal scale was set to 5ns/div, the record length was set to 5120 points, and the number of averages was set to 128. These values were selected to ensure that the number of points relative to the window length was long enough to capture the highest frequencies and still yield a small enough frequency step to gain adequate resolution. Test setup losses were compensated for by acquiring a thru measurement (reference output pulse) of the coaxial test cables, SMAs, and the reference board (see Figure 14 on page 11). The reference board was then replaced with the Test PCBs and the sample (see Figure 15 on page 11). A thru measurement was taken and then post processed by using TDA Systems’, IConnect software. The result is the insertion loss of the cable assembly. Return Loss Return Loss measurements were made using the Tektronix 11801B oscilloscope. The horizontal scale was set to 5ns/div, the record length was set to 5120 points and the number of averages was set to 128. These values were selected to ensure that the number of points relative to the window length was long enough to capture the highest frequencies and still yield a small enough frequency step to gain adequate resolution. A matched reflection waveform of the cable assembly was acquired and then post processed by using TDA Systems’, IConnect software. The result is the return loss of the cable assembly. Near and Far End Crosstalk NEXT and FEXT were measured initially in the time domain using the Tektronix 11801B oscilloscope. The horizontal scale was set to 5ns/div, the record length was set to 5120 points, and the number of averages was set to 128. To acquire the NEXT, a differential open circuit reference measurement was taken at the connector that is mounted on the Test PCBS. Then a near-end differential pair was driven using the oscilloscope. NEXT was measured, in the time domain, on an adjacent differential pair (see Figure 17 on the next page). NEXT was then post processed by using TDA Systems’ IConnect software. The result is the NEXT of the cable assembly in the frequency domain. Acquiring FEXT, a thru reference of the coaxial test cables, SMAs, and the reference board was performed to compensate for the test setup losses (see Figure 14 page 11). FEXT was measured, in the time domain, on an adjacent differential pair at the far-end (see Figure 18 on the next page). FEXT was then post processed by using TDA Systems’ IConnect software. The result is the FEXT of the cable assembly in the frequency domain. All adjacent lines were terminated, at both ends, with 50Ω SMA loads; refer to Figure 18 on the next page.

High Speed Characterization Report – EEDP Series
Revision Date: 02/07/2005 15
Figure 19: NEXT Measurement Setup
Figure 20: FEXT Measurement Setup Equipment Time Domain Testing
Tektronix 11801B Oscilloscope Tektronix SD-26 Sampling Head Tektronix SD-27 TDR/Sampling Head
TDA Systems IConnect Version 3.0.2 MX
Tektronix 11801B
Coax Cable
TDR
EEDP Sample Near End Test Board
Far End Test Board
SMA Launches
= 50 ohm termination
Source Line
Victim Line (NEXT)
Chs. 1 & 2
Chs. 3 & 4
Tektronix 11801B
Coax Cable
Chs. 1&2 & 2
EEDP Sample
Near End Test Board Far End Test Board
Coax Cable
SMA Launches
Tektronix 11801B
Chs. 3&4
= 50 ohm termination
Source Line Victim Line (FEXT)


