High resolution seismic study of the Holocene infill of the Elkhorn Slough, central California
11
Research papers High resolution seismic study of the Holocene infill of the Elkhorn Slough, central California Ana Garcı ´a-Garcı ´a a,b,n , Matthew D. Levey c , Elizabeth B. Watson d a Department of Earth and Planetary Sciences, University of California Santa Cruz, 1156 High Street, Santa Cruz, CA 95064, USA b Department of Earth Sciences, Monterey Peninsula College, Monterey, CA 93940, USA c SeaSpatial Consulting, Santa Cruz, CA 95060, USA d ORD-NHEERL, Atlantic Ecology Division, US Environmental Protection Agency, Narragansett, RI 02882, USA article info Article history: Received 19 June 2012 Received in revised form 15 January 2013 Accepted 17 January 2013 Available online 24 January 2013 Keywords: High-resolution seismic analysis Marine transgression Holocene Elkhorn Slough California abstract The seismic analysis of the sedimentary infill of the Elkhorn Slough, central California, reveals a succession of three main seismic units: U1, U2, U3, with their correspondent discontinuities d 2 , d 3 . These units are deposited over a paleorelief representing the channel location at least 8k years ago. The location of that paleochannel has not changed with time, but the geometry of the infilling sedimentary packages has done so through the years. Discontinuities d 2 and d 3 show a relic island or relative high in the center of the Slough that separated the sedimentation into two main small basins at least 3k years ago. There is evidence of erosion in the last two sedimentary units showing that the present erosive pattern began decades ago at minimum. We have correlated radiocarbon data of selected cores with the high resolution chirp profiles and reconstructed the infill for the Elkhorn Slough. In the most recent unit, the occurrence of numerous lateral accretion surfaces on both ends of the main channel is discussed within their environmental setting, tidal currents and the net ebb flux of the area. We have interpreted the presence of gas in the sediments of the slough, with a gas front located at the tops of units 2 and 3, which are discontinuities that reflect an effective seal for the gas. Our data shows no obvious evidence for seepage, although the shallow presence of some of the fronts points out the fragility of the environment in the present erosive conditions. & 2013 Elsevier Ltd. All rights reserved. 1. Introduction Elkhorn Slough is a tidal slough and estuary in coastal Monterey County, California and is one of the largest tracts of intact tidal salt marsh in California outside of San Francisco Bay. Elkhorn Slough is protected as the Elkhorn Slough State Marine Reserve, the Elkhorn Slough State Marine Conservation Area, is part of the Monterey Bay National Marine Sanctuary, and is home to one of the nation’s first National Estuarine Research Reserves (ESNERR). While there are numerous studies pertaining to its marine ecology, few articles have been published pertaining to its geologic history (Schwartz et al., 1986; West, 1988; Hornberger, 1991; Schwartz, 2002; Israel and Watt, 2006; Watson et al., 2011) so many aspects of the Sloughs’ recent geologic history remain poorly understood. In this paper we present a detailed study of the Holocene infill of the Elkhorn Slough through the study of high-resolution seismic profiling data, presenting correlations with available core data, reconstructing the last thousands of years’ (approx. 5000 yr B.P. to the present day) story of the infilling of this particularly shallow environment, and a discussion of the implications on its future stability. 1.1. Study area: Elkhorn Slough geological setting Elkhorn Slough rests fully within the allochtonous Salinian block (Vedder et al., 1983), between the San Andreas Fault and the San Gregorio Fault which are active, right-lateral, strike-slip fault zones (Schwartz et al., 1986). These faults are moving the Salinian Block to the northwest at a current rate of 27–33 mm per year (Vedder et al., 1983). The Salinian block (Kidder et al., 2003; Ducea et al., 2009) represents a sliver of the Sierra-Nevada batholith which was pushed into the Monterey Bay by Pacific Plate motion (Greene et al., 2002). Post-processing long-term (5þ years) of GPS receiver data suggests that a small amount subsidence is occurring on the Salinian block in concert with lateral movement relative to the Stable North American Reference Frame (VanDyke, personal communication), however, well defined marine terraces located along the Monterey Bay coastline Contents lists available at SciVerse ScienceDirect journal homepage: www.elsevier.com/locate/csr Continental Shelf Research 0278-4343/$ - see front matter & 2013 Elsevier Ltd. All rights reserved. http://dx.doi.org/10.1016/j.csr.2013.01.012 n Corresponding author at: Department of Earth and Planetary Sciences, University of California Santa Cruz, 1156 High Street, Santa Cruz, CA 95064, USA. Tel.: þ1 831 252 3169; fax: þ1 831 459 3074. E-mail addresses: [email protected] (A. Garcı ´a-Garcı ´a), [email protected] (M.D. Levey), [email protected] (E.B. Watson). Continental Shelf Research 55 (2013) 108–118
-
Upload
elizabeth-b -
Category
Documents
-
view
215 -
download
0
Transcript of High resolution seismic study of the Holocene infill of the Elkhorn Slough, central California

Continental Shelf Research 55 (2013) 108–118
Contents lists available at SciVerse ScienceDirect
Continental Shelf Research
0278-43
http://d
n Corr
Univers
USA. Te
E-m
mlevey
journal homepage: www.elsevier.com/locate/csr
Research papers
High resolution seismic study of the Holocene infill of the Elkhorn Slough,central California
Ana Garcıa-Garcıa a,b,n, Matthew D. Levey c, Elizabeth B. Watson d
a Department of Earth and Planetary Sciences, University of California Santa Cruz, 1156 High Street, Santa Cruz, CA 95064, USAb Department of Earth Sciences, Monterey Peninsula College, Monterey, CA 93940, USAc SeaSpatial Consulting, Santa Cruz, CA 95060, USAd ORD-NHEERL, Atlantic Ecology Division, US Environmental Protection Agency, Narragansett, RI 02882, USA
a r t i c l e i n f o
Article history:
Received 19 June 2012
Received in revised form
15 January 2013
Accepted 17 January 2013Available online 24 January 2013
Keywords:
High-resolution seismic analysis
Marine transgression
Holocene
Elkhorn Slough
California
43/$ - see front matter & 2013 Elsevier Ltd. A
x.doi.org/10.1016/j.csr.2013.01.012
esponding author at: Department of Ear
ity of California Santa Cruz, 1156 High Str
l.: þ1 831 252 3169; fax: þ1 831 459 3074.
ail addresses: [email protected] (A. Garcıa-G
@seaspatial.com (M.D. Levey), Watson.Elizabe
a b s t r a c t
The seismic analysis of the sedimentary infill of the Elkhorn Slough, central California, reveals a
succession of three main seismic units: U1, U2, U3, with their correspondent discontinuities d2, d3.
These units are deposited over a paleorelief representing the channel location at least 8k years ago.
The location of that paleochannel has not changed with time, but the geometry of the infilling
sedimentary packages has done so through the years. Discontinuities d2 and d3 show a relic island or
relative high in the center of the Slough that separated the sedimentation into two main small basins at
least 3k years ago. There is evidence of erosion in the last two sedimentary units showing that the
present erosive pattern began decades ago at minimum. We have correlated radiocarbon data of
selected cores with the high resolution chirp profiles and reconstructed the infill for the Elkhorn Slough.
In the most recent unit, the occurrence of numerous lateral accretion surfaces on both ends of the
main channel is discussed within their environmental setting, tidal currents and the net ebb flux of the
area. We have interpreted the presence of gas in the sediments of the slough, with a gas front located at
the tops of units 2 and 3, which are discontinuities that reflect an effective seal for the gas. Our data
shows no obvious evidence for seepage, although the shallow presence of some of the fronts points out
the fragility of the environment in the present erosive conditions.
& 2013 Elsevier Ltd. All rights reserved.
1. Introduction
Elkhorn Slough is a tidal slough and estuary in coastal MontereyCounty, California and is one of the largest tracts of intact tidal saltmarsh in California outside of San Francisco Bay. Elkhorn Slough isprotected as the Elkhorn Slough State Marine Reserve, the ElkhornSlough State Marine Conservation Area, is part of the Monterey BayNational Marine Sanctuary, and is home to one of the nation’s firstNational Estuarine Research Reserves (ESNERR).
While there are numerous studies pertaining to its marineecology, few articles have been published pertaining to itsgeologic history (Schwartz et al., 1986; West, 1988; Hornberger,1991; Schwartz, 2002; Israel and Watt, 2006; Watson et al., 2011)so many aspects of the Sloughs’ recent geologic history remainpoorly understood. In this paper we present a detailed studyof the Holocene infill of the Elkhorn Slough through the study
ll rights reserved.
th and Planetary Sciences,
eet, Santa Cruz, CA 95064,
arcıa),
[email protected] (E.B. Watson).
of high-resolution seismic profiling data, presenting correlationswith available core data, reconstructing the last thousands ofyears’ (approx. 5000 yr B.P. to the present day) story of theinfilling of this particularly shallow environment, and a discussionof the implications on its future stability.
1.1. Study area: Elkhorn Slough geological setting
Elkhorn Slough rests fully within the allochtonous Salinian block(Vedder et al., 1983), between the San Andreas Fault and the SanGregorio Fault which are active, right-lateral, strike-slip fault zones(Schwartz et al., 1986). These faults are moving the Salinian Block tothe northwest at a current rate of 27–33 mm per year (Vedder et al.,1983). The Salinian block (Kidder et al., 2003; Ducea et al., 2009)represents a sliver of the Sierra-Nevada batholith which was pushedinto the Monterey Bay by Pacific Plate motion (Greene et al., 2002).Post-processing long-term (5þyears) of GPS receiver data suggeststhat a small amount subsidence is occurring on the Salinian block inconcert with lateral movement relative to the Stable North AmericanReference Frame (VanDyke, personal communication), however, welldefined marine terraces located along the Monterey Bay coastline

Fig. 1. Elkhorn Slough map with location of chirp lines and core sites # 24, 67, 33, and 47. Note the outline of the current channel in red. Core locations shown in yellow are
sites from Watson (2011). Combined LIDAR and multibeam bathymetry data courtesy of the Seafloor Mapping Lab at CSUMB (For interpretation of the references to color
in this figure legend, the reader is referred to the web version of this article).
A. Garcıa-Garcıa et al. / Continental Shelf Research 55 (2013) 108–118 109
(Dupre, 1990) argue instead for low but positive vertical slip rates(Weber, 1990).
Present day Elkhorn Slough (see Fig. 1) is an elongated, tidallyinfluenced coastal estuarine meandering embayment that isdissected by numerous tidal channels, and which is flanked byextensive intertidal mudbanks and salt marshes (Schwartz, 2002).It is located near the head of the Monterey submarine canyon,although it is not a direct landward extension of it (Greene et al.,2002). Rather, Elkhorn Slough is one of a series of lowland lakesand sloughs located on the floodplains of the lower Salinas andPajaro Rivers (watershed sizes of 10,800 and 3400 km2, respec-tively), which are found where tributaries entrenched intocoastal terraces have been dammed by Holocene alluvial sedi-ment deposits associated with trunk streams (Dupre, 1990;Heard, 1992). Based on pollen records showing increasing preva-lence of halophytic species through the Holocene, and middenshellfish records of fresh-water intolerant species such as Olympiaoysters and Gaper clams, many of the nearby sloughs (e.g. Watson-ville Slough, Elkhorn Slough, Moro Cojo Slough) became tidal as a
result of Holocene sea level transgression (West, 1988; Jones, 2003;Watson, 2011). Fifty percent, or 1000 acres, of Elkhorn Slough’s saltmarshes have been lost over the past 150 years due to humanactions. Marsh deteroriation has also occurred in environments notdirectly impacted by diking and tidal restriction (VanDyke andWasson, 2005), suggesting that the indirect impacts of humanactivities, such as harbor construction, river diversion, or highnutrient loads are contributing to marsh loss, although the relativeimportance of these factors is still not well understood. In addition,Elkhorn Slough’s estuarine habitats suffer from subsidence,degraded water quality conditions, and invasion of non-nativespecies (Caffrey et al., 2002).
2. Material and methods
Investigations of estuarine stratigraphy involved collectionand analysis of sub-bottom acoustic profiles collected from thelower intertidal and sub-tidal at Elkhorn Slough (Fig. 1). A total of

Fig. 2. EdgeTech SB-424 full-spectrum CHIRP profiler, attached to the small boat. Data were acquired and interpreted using Triton Imaging’s SB-Logger and SB-Interpreter
software.
A. Garcıa-Garcıa et al. / Continental Shelf Research 55 (2013) 108–118110
29.6 km of chirp data were collected during 2011 with an Edge-Tech SB-424 full-spectrum sub-bottom CHIRP profiler usingdefault pulse ‘‘d’’ which generates a sweep frequency of 4 kHz–24 kHz for 10 ms, and a vertical resolution of 0.4 m (Fig. 2). Datawere acquired using Triton Imaging’s SB-Logger software, andinterpreted using their SB-Interpreter software. A velocity of1550 m/s was used to convert time data within the sediment.Positional data were acquired using a Trimble GeoXT hand-heldGPS unit with GNSS for sub-meter accuracy. Data were streamedevery one second in NMEA format to the acquisition computerrunning SB-Logger.
Specifically, sub-bottom profiles were examined for seismicunits infilling the slough, through a seismic analysis. The seismicanalysis comprised a detailed study of reflection terminations andreflection configurations which has been used for identification ofseismic units and their boundaries (Mitchum et al., 1977; Vailet al., 1991, 1977; Posamentier et al., 1988).
The description and analysis of 85þ estuarine sediment coresas a background dataset was done by Watson (2011) (yellow dots,Fig. 1), which were collected from the upper inter-tidal zonewhere it was not possible to collect seismic profiles due toextremely shallow water depths of o10 cm. Of these 85 coringlocations, four cores representing distinct geographic and strati-graphic types were selected to provide age control, and togroundtruth the interpreted seismic units (highlighted core sites,Fig. 1). To collect intact cores in sealed liners, a combination ofpiston (Big Creek and Round Hill) and vibracores (Rubis Creek andHudson’s Landing) were collected; piston cores were collectedusing a modified Livingston piston corer with a barrel width of5 cm, and length of 85 cm, which had been outfitted withbutyrate liners. Vibracores were collected with 300 aluminumirrigation line outfitted with a modified cement shaker. Corerecovery lengths were 3 m on average.
These cores were transported to the National Lacustrine CoreFacility (LacCore) at the University of Minnesota for additionalprocessing. Cores were split, digitally imaged and X-rayed,scanned for magnetic susceptibility using a Bartington loop
sensor driven by a Geotek MSCL-S logging instrument, and fortotal elemental abundance of major and minor elements using aCox Analytical Itrax X-ray flouresence core scanner. For corescollected in aluminum, large u-channels were removed foranalysis in order to remove confounding effects. Archivehalves have been retained by LacCore, and samples may berequisitioned.
Chronologic control for the cores was provided using a combina-tion of AMS radiocarbon dating, gamma spectroscopy, and analysis oftotal lead concentrations. Accelerator mass-spectroscopy (AMS)radiocarbon dating, in concert with d13C measures, was performedon twelve organic samples by the University of Georgia’s Center forApplied Isotope Study. Radiocarbon ages were converted to calendaryears using Calib version 6.0 (Stuiver et al., 2011). To calculate recentaccumulation rates, sediments were analyzed for excess Pb-210 andCs-137 using low-energy germanium gamma ray detectors, and formetals using inductively coupled plasma atomic emissions spectro-scopy (ICP-AES). The maximum depth of radiocesium was assignedan age of 1954; and additional refinements were made to thechronologies, as possible, utilizing the mid-1960s radiocesium peak,the late 1970s total lead peak, and results from Pb-210 decay curves.A slope-regression (constant initial concentration; CIC) modelingapproach was utilized for the Pb-210 data unless the fit was poordue to variations in accumulation rate through time, in which casethe constant rate of supply (CRS) technique was utilized.
3. Results
3.1. Seismic analysis
The seismic analysis of the slough chirp seismic records showsseveral seismic units as its infill. We have named from bottom totop-the correspondent identified discontinuities as: d1, d2, d3.Therefore we have considered seismic units: U1, U2, U3 as theinfill of the Elkhorn Slough (Figs. 3 and 4).
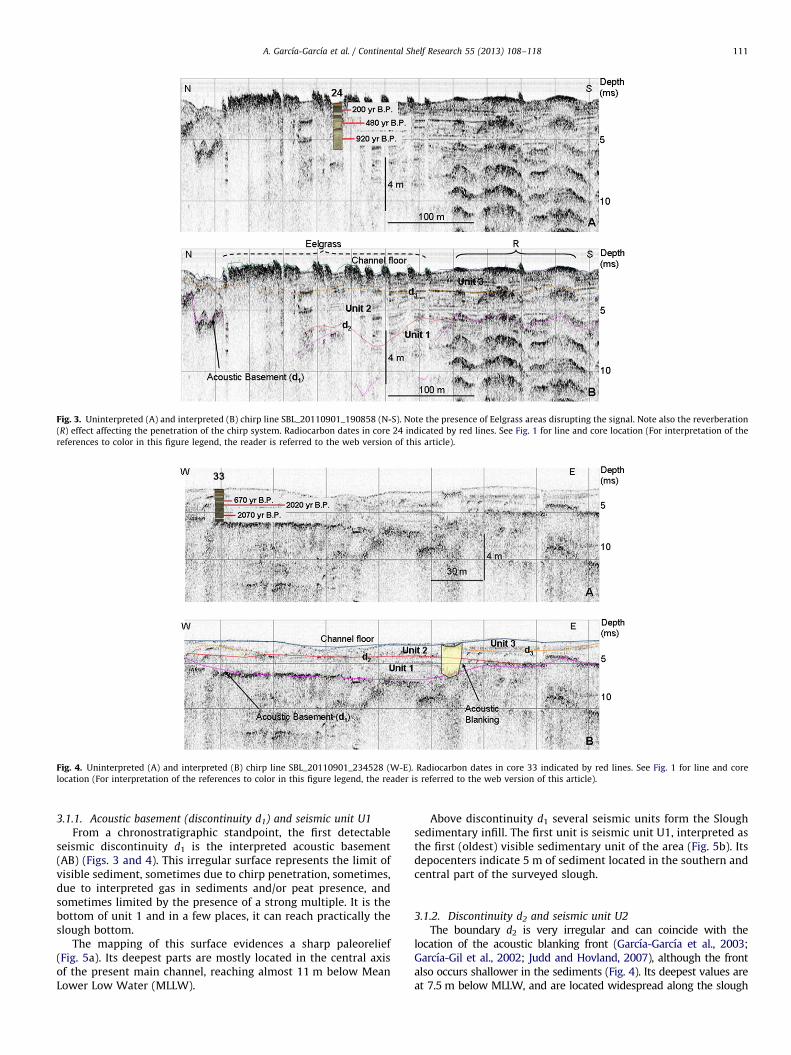
Fig. 3. Uninterpreted (A) and interpreted (B) chirp line SBL_20110901_190858 (N-S). Note the presence of Eelgrass areas disrupting the signal. Note also the reverberation
(R) effect affecting the penetration of the chirp system. Radiocarbon dates in core 24 indicated by red lines. See Fig. 1 for line and core location (For interpretation of the
references to color in this figure legend, the reader is referred to the web version of this article).
Fig. 4. Uninterpreted (A) and interpreted (B) chirp line SBL_20110901_234528 (W-E). Radiocarbon dates in core 33 indicated by red lines. See Fig. 1 for line and core
location (For interpretation of the references to color in this figure legend, the reader is referred to the web version of this article).
A. Garcıa-Garcıa et al. / Continental Shelf Research 55 (2013) 108–118 111
3.1.1. Acoustic basement (discontinuity d1) and seismic unit U1
From a chronostratigraphic standpoint, the first detectableseismic discontinuity d1 is the interpreted acoustic basement(AB) (Figs. 3 and 4). This irregular surface represents the limit ofvisible sediment, sometimes due to chirp penetration, sometimes,due to interpreted gas in sediments and/or peat presence, andsometimes limited by the presence of a strong multiple. It is thebottom of unit 1 and in a few places, it can reach practically theslough bottom.
The mapping of this surface evidences a sharp paleorelief(Fig. 5a). Its deepest parts are mostly located in the central axisof the present main channel, reaching almost 11 m below MeanLower Low Water (MLLW).
Above discontinuity d1 several seismic units form the Sloughsedimentary infill. The first unit is seismic unit U1, interpreted asthe first (oldest) visible sedimentary unit of the area (Fig. 5b). Itsdepocenters indicate 5 m of sediment located in the southern andcentral part of the surveyed slough.
3.1.2. Discontinuity d2 and seismic unit U2
The boundary d2 is very irregular and can coincide with thelocation of the acoustic blanking front (Garcıa-Garcıa et al., 2003;Garcıa-Gil et al., 2002; Judd and Hovland, 2007), although the frontalso occurs shallower in the sediments (Fig. 4). Its deepest values areat 7.5 m below MLLW, and are located widespread along the slough

Fig. 5. (a) Depth (MLLW) to acoustic basement (d1) overlaying hillshade image created from the digital elevation model. Data (dots) were converted to TINs and then
interpolated using Natural Neighbors and converted into rasters. Note the deepest visible basement is 410 m below MLLW and located at the present main channel.
(b) Map showing the interpolated thickness of Unit U1 (m). (c) Depth (MLLW) to the top of Unit 1 (d2) overlaying hillshade image created from the digital elevation model.
(d). Map showing the interpolated thickness of Unit U2 (m). (e) Depth (MLLW) to the top of Unit 2 (d3) overlaying hillshade image created from the digital elevation model.
(f). Map showing the interpolated thickness of Unit U3 (m).
A. Garcıa-Garcıa et al. / Continental Shelf Research 55 (2013) 108–118112
(Fig. 5c). It is worth noting the relative high that this discontinuityshows in the central-north slough, between Kirby Park and Big Creek,surfacing to 0.5 m below MLLW, and creating two sub-basins for thesedimentation of the overlain unit U2.
Above discontinuity d2, or directly over the acoustic basement(Fig. 3), lies seismic unit U2. This unit is more continuous thanunit U1. Towards the lower unit, it shows internal sub-horizontalreflectors, whilst towards the upper limit; a strong erosion ofthose is visible, towards the edges of the channel, and the center.In a few places, this makes the unit exposed (see Fig. 8).
The depocenters almost reach 4 m, and are located at threesites along the Slough, two of them, south and central, coincidespatially with the depocenters of unit U1 (Fig. 5d). Note that thedepocenters in the central and north areas are located at each sideof the relative high of discontinuity d2.
3.1.3. Discontinuity d3 and seismic unit U3
This boundary d3 is sub-horizontal and continuous throughoutmost of the area (Figs. 3 and 4). Its deepest parts are mostlylocated in the central-south axis of the present main channel(Fig. 5e) reaching almost 7 m below MLLW. There is a relativehigh in the center of the slough (between Kirby Park and BigCreek), although less pronounced than the one in discontinuity d2.It also represents the shallowest seal-unit for the acoustic blank-ings that occur in the area.
Unit 3 is located in between d3 and the present-day Sloughfloor. It is the most recent sedimentary package and the morecontinuous one, with internal sub-horizontal reflectors. Its depo-centers of 4 m are concentrated mostly to the sides of the presentmain channel (Fig. 5f). This unit shows a few prominent lateralaccretion surfaces that have a clinoform-shape, located at the

Fig. 6. Location of interpreted prograding forms in seismic unit U3 and examples of chirp lines.
A. Garcıa-Garcıa et al. / Continental Shelf Research 55 (2013) 108–118 113
flanks of the channel (Fig. 6). The mapping of those formsindicates that most of them (on the East side of the slough) areprograding West, towards the axis of the main channel. Three ofthem, in the center of the Slough, show progradation in theopposite direction. The interpreted nature of these prominentlateral accretion surfaces is covered in the Discussion.
3.2. Sediment cores
Estuarine sediment deposits were typically composed of finesediment (particle size modes of 4–16 mm in diameter), withsediment organic contents ranging from 0–70%. X-radiographsshowed clear laminations, and therefore little evidence for bio-turbation was found (Fig. 7).
In upper portion of the Slough, core 47 (Hudson’s Landing,Fig. 1 and Fig. 7a) was dominated by homogenous depositsconsisting of fine low organic content marsh sediments in thefirst 20 cm, and sedge peat to a depth of greater than threemeters. Near-surface changes in preserved roots and rhizomeswere detected.
In the upper eastern portion of the Elkhorn Slough, core 33(Big Creek, Fig. 1 and Fig. 7b) sediments were composed of marshfacies 0–125 cm, with the lower 130 cm consisting of fine mud.No sedge peat was found.
In the mid-portion of Elkhorn Slough, core 67 (Round Hill,Fig. 1 and Fig. 7c) showed heterogeneity with alternating layers ofmud, marsh, and peat facies. This core showed marsh in the first145 cm, 175–242 cm, 275–300 cm, mud in 158–165 cm interval,peat in 165–175 cm, and 242–275 cm.
The analysis of sediment core 24 (Rubis area, Figs. 1 and 7d),shows marsh facies in the first 75 cm, followed by panne faciesdown to 3 m.
Radiocarbon data for the four cores is shown in Table 1. Threevalues per core were obtained. The location of those values wascorrelated to the available chirp line when possible. Selectedexamples for cores 33 and 24 are shown in Figs. 3 and 4.Radiocarbon ages in the 3 m long cores ranged between210720 yr B.P. to 2070720 yr B.P. A recently processed core in
the Yampah area (Y*, Fig. 1) indicated a radiocarbon value of4055735 yr B.P. at 510 cm (Watson et al., 2011).
4. Discussion
4.1. Core datasets
In both the lower and upper Slough, clear changes in strati-graphy appear at depths which correspond temporally to con-struction of the deepwater harbor at Moss Landing.
For the northern portion of Elkhorn Slough (core 47; Hudson’sLanding, Fig. 1), estuarine sediment composition was found to bedominated by homogenous deposits consisting of fine sedimentand sedge peat, to a depth of greater than three meters. Near-surface changes in preserved roots and rhizomes suggestthat increased salinity at the site has fostered a shift fromsalt-intolerant taxa prior to the 1950 s (e.g. Schoenoplectus americanus
Schoenoplectus californicus, Scirpus maritimus) to salt-tolerant taxatoday (Sarcocornia pacifica, Distichlis spicata). Similarly, a near-surface increase in fine sediment deposition suggests either anincrease in tidal flooding duration associated with a larger tidal range(related to the construction of the deepwater harbor), or alternativelya strong decline in root and rhizome productivity or preservationassociated with the species composition shifts.
In the upper eastern portion of Elkhorn Slough (core 33; BigCreek, Figs. 1 and 4), wetland sediments were found to deeperdepths adjacent to uplands, suggesting lateral expansion of wet-lands through the Late Holocene in this area (consistent with thework of Schwartz et al., 1986), although we found no sedge peatin this region. The lithic portion of estuarine sediments werecomposed exclusively of fine muds, apart from surface sedimentsadjacent to active alluvial fans draining upslope agriculturalfields, and one core collected adjacent to a large tidal channel,which contained some fine sand at depth. Radiocarbon ages(Table 1) suggest unit U1 deposited at least 2070 yr B.P. Theyalso suggest a change in sedimentation rate before and after2020 yr B.P. at core site 33. We infer a deposition of 1 m between

Dep
th (c
m)
10
50
100
150
150
200
250
300
Dep
th (c
m)
10
50
100
150
150
200
250
300D
epth
(cm
)
10
50
100
150
150
200
250
300
Dep
th (c
m)
10
50
100
150
150
200
250
300
Fig. 7. Images (left) and X-rays (right) of cores 47 (a), 33 (b), 67 (c) and 24 (d). See Fig. 1 for cores location.
A. Garcıa-Garcıa et al. / Continental Shelf Research 55 (2013) 108–118114
2070 yr B.P. and 2020 yr B.P. at core site 33 (Fig. 4), whichindicates a sedimentation rate of 20 mm/yr, much higher thanLate Holocene average background values of 1–3 mm/yr (Watson,2008; Watson et al., 2011).
Strong heterogeneity was found both within and betweensediment cores in the mid-portion of Elkhorn Slough (core 67;Round Hill, also, Hummingbird and Yampah areas (Watson,2011), see Fig. 1). In general, deeper basal peat depths werefound adjacent to uplands, and most wetlands were of recentorigin. However, in many locations we found alternating layers ofestuarine muds and thick peats, or alternating layers of low andhigh organic content estuarine wetland deposits. Because thispattern is restricted to mid-Elkhorn Slough, we find it difficult toattribute to a specific external forcing (e.g. inlet closure or climatevariability). However, this pattern does suggest that during much
of the Late Holocene, most of the inter-tidal in this region was onthe cusp of being able to support brackish wetland vegetation,and periodic changes in environmental conditions were capableof causing significant changes in estuarine habitats. At Yampahmarsh, a rapid expansion in salt marsh extent was found to dateto recent times.
The earliest detailed coast survey map (Johnson, 1854) showsthe lower portion of Elkhorn Slough as a marsh platform withbroad areas of unvegetated shallow ponds. Although this map endsjust to the west of our study area, our analysis of sediment cores inthe Rubis area (Core 24, Figs. 1 and 3), suggests that pre-historically, this landscape pattern continued eastward, from apond dominated platform in the west to a more contiguous marshlandscape in the eastern part of the Rubis Creek region. Radio-carbon ages (Table 1) suggest an age of 500 yr B.P. for discontinuity

Table 1Supporting information for samples analyzed for radiocarbon. All samples were rhizomes of wetland plants (typical substrate penetration depth of o10 cm).
Core number Location Sample depth (cm) d13C % PDB Age 14C yr B.P. Age median cal yr B.P. Age 2s max cal yr B.P. Age 2s min cal yr B.P.
47 Hudson’s landing 75 �25.30 210720 169 301 0
47 Hudson’s landing 145 �26.40 770720 694 727 674
47 Hudson’s landing 265 �25.14 1480725 1363 1405 1313
33 Big creek 100 �25.26 670725 661 681 565
33 Big creek 125 �23.93 2020725 712 761 676
33 Big creek 213 �23.85 2070720 1321 1357 1291
67 Round hill 100 �26.93 400720 485 508 335
67 Round hill 169 �26.23 1730725 1644 1705 1566
67 Round hill 275 �27.83 1960730 1911 1989 1829
24 Rubis creek 45 �24.00 200725 177 299 0
24 Rubis creek 130 �23.42 480725 519 537 503
24 Rubis creek 232 �20.66 920725 852 920 778
Yn Yampah 510 �25a 4055735 4535 4798 4425
Yn¼Radiocarbon data at Yampah (Watson et al., 2011).
a Assumed value. See Fig. 1 for samples location.
Fig. 8. Chirp line SBL_20110901_192623 (E-W) showing interpreted seismic units, acoustic basement and acoustic blanking. Cores taken by Watson (2011) close to the
line have been correlated; cores # 4, 2, 70 at o25 m, and core #1, located 35 m to the west of the line. Note the location of the 2.5 k cal yr B.P. datation in core 2 (vertical
error of �0.5 m). With interpreted facies: green as ‘marsh’, yellow as ‘mud’, and pink as ‘peat’. See Fig. 1 for line location. (For interpretation of the references to color in
this figure legend, the reader is referred to the web version of this article).
A. Garcıa-Garcıa et al. / Continental Shelf Research 55 (2013) 108–118 115
d3 (unit U3 infill) and that unit U2 developed at least 1000 yearsago. They also suggest that at some point over the last 1–500 yearsago, more contiguous marsh developed in this area, consistent withthe marsh expansion that occurred at Yampah during roughly thesame time period.
In the south area at Yampah, recent radiocarbon date of a core500 m away of our chip survey suggests an age of 4055 yr B.P. at adepth of 510 cm (Watson et al., 2011). We could infer that unit U1would be correlated to this level (Fig. 8).
4.2. Reconstruction of the Elkhorn Slough infill
The mapped acoustic basement shows a very erosive and reflec-tive surface (d1). In Fig. 5a it can be seen how close the location of thecurrent channel and this paleochannel are. Schwartz et al. (1986)discussed the infill of the Elkhorn slough from borehole informationas being �8k years B.P. This means that for the last 8000 years, thelocation and shape of the main channel has not changed except someminor deviations near the southern edge indicated by deep holesbeyond the current channel location.
On top of this paleochannel, unit 1 fills the slough withthicknesses up to 5 m (Fig. 5b). Studies by Schwartz et al.(1986) found the first marine incursion to the slough as an oldersand layer at the base of the boreholes collected across theHighway 1 Bridge (Fig. 1), and a second layer of muddy sanddated 6200–1800 yr B.P. by the authors. We do not see the oldersand layer in our chirp lines as it is most probably at the limit ofour system resolution or is located westward and outside ourstudy area. We do infer that unit U1 might be the muddy sandlayer that shows on top of it in the boreholes.
The top of unit U1 shows a characteristic relative hightopography in the center of the slough, between Kirby Park and
Big Creek, see Fig. 5c. A cross section along the current channelshows this island to be as shallow as 0.5 m below MLLW,extending spatially 200 m�500 m. This ‘‘island’’ separates thenorthern and southern portion of the slough and alters how thedeposition/infilling took place.
Watson (2011) studied the extent of the marsh facies in theslough through time and how it evolved in time. Some of hercores can be correlated to our chirp lines (Figs. 1 and 8). In core 2,the author confirms a date of 2500 cal. yr B.P. for a marsh layerthat has been highlighted in the figure with a red dashed line.Using this radiocarbon data, we can suggest the island or relativehigh of top of unit 1 would have formed earlier than 2500 yr B.P.ago. It is worth noting that the place where this island is locatedcoincides with a very sharp northwest turn of the main channel,possibly indicating tectonic activity at that time. And although noobvious faults were observed in our datasets, Mullins et al. (1985)indicate the influence of sea-level fluctuations and tectonics inthe sedimentary infill of the western California coast and margin.
Borehole data (Schwartz et al., 1986) indicate a silt layer followedby a clay layer for the last 3k years, completing the mostly upwardthinning sequence indicating final estuarine conditions. These cancorrespond to our interpreted units U2 and U3. These data areconsistent with the radiocarbon data we have on cores 33 and 24(Figs. 3 and 4, Table 1), which shows an age of 2070 yr B.P. ininterpreted unit U1; an age of 670 and 920 yr B.P. in seismic unit U2;and a date of 200 yr B.P. for unit U3 (younger than 480 yr B.P., Fig. 3).
Through time, the slough continued infilling for the last 3000years and looking at top of unit U2 (Fig. 5e), we see the relativehigh found at the center still exists, being less pronounced inrelief but more widespread. The depocenters of U3, the mostrecent unit, are located in those areas of semi-basins (Fig. 5f). Thinsediment thickness in the channel of this Unit U3 corresponds to

A. Garcıa-Garcıa et al. / Continental Shelf Research 55 (2013) 108–118116
erosion seen in multibeam bathymetric surveys between 2003and 2005 (Pat Iampietro, pers. comm.) and have exposed the lowersedimentary units in some areas.
Apart from showing a very erosive pattern, Unit U3’s characteristicis the presence of a clinoform-like structure in both inner and outerbends of the main channel (Fig. 6). The term ‘‘clinoform’’, firstintroduced by Rich (1951), has evolved from describing the shapeof a depositional surface at a continental margin scale, to currentlydescribe strata packages with oblique internal layering, best imagedon seismic reflection profiles, with: a ‘‘topset,’’ the most shallow andlow-angle area, a ‘‘foreset,’’ the central and steepest area, and a‘‘bottomset,’’ the flat area farther basinward (Cattaneo et al., 2004;Hampson, 2000; Mitchum et al., 1977). The break in seafloor slopebetween the topset and the foreset is often called the ‘‘rollover point’’.
After measuring all 16 clinoforms-like structures for lengthand thickness at their rollover point, the average for these are52 m long and 1.7 m thick. These sedimentary deposits have asigmoidal shape at the bends of the channel. Their bottom surface(bottomset) is eroding the previous unit (see truncation in Fig. 6)and they themselves show erosion evidence on what is currentlythe bottom of the slough. Their top represents past slough waterlevels when the water was lower than in present times. A studyby Israel and Watt (2006) indicate some of these as ‘sub-tidalmud bank terraces’ along the channel, showing obvious erosioneffects. We suggest the sediment source came from the SalinasRiver, and a lesser extent from the local watershed.
Regarding the lateral accretion surfaces found in unit U3 (Fig. 6),these appear to record accretion on to the inner and outer bends ofthe channel. These forms could also be considered as point bar andcounter point bar deposits (Smith et al., 2009). Without a furtherlithofacies analysis is not possible to conclude which interpretation ismore accurate. In front of Kirby Park and in the western bend of thechannel (Fig. 6), the only place where the accretion surfaces arelocated, Israel and Watt (2006) report a tidal creek flow along asecondary tidal channel that might explain the location of thosedepositional forms. The authors indicate the sediments are beingtransported down-channel towards Kirby Park on ebbing tides. Theyalso indicate an increase of the tidal prism and the currents withobserved maximum current speeds of 1.25 m/s on the ebb tide, and0.42 m/s on the flood tide.
4.3. Gas occurrence
In the Elkhorn Slough, the presence of black, anaerobic sediments,hydrogen sulfide smell, and the appearance of Beggiatoa, a purple andgreen photosynthetic sulfur bacteria (Caffrey, 2002), suggest thatsulfate reduction is occurring, a coupled process found in high organiccontent anoxic sediments whereby by sulfate is reduced to hydrogensulfide gas and organic matter is mineralized to methane or carbondioxide. While studies suggest that salt marshes are not associatedwith significant methane fluxes (either in pore-water or at the soil-atmosphere interface; Bartlett et al., 1987), it is possible that thistrapped gas is a legacy of the both current decomposition processesand somewhat lower salinity conditions suggested by pollen analysisof Late Holocene estuarine sediments (Watson et al., 2011), and maybe composed primarily CO2 or primarily CH4.
The presence of acoustic blankings throughout the chirp lines andpossible acoustic plumes in the water column points to the occur-rence of gas in the sediments in different levels, from 20 cm belowthe bottom of the slough to almost 5 m into the sediment. The gasfront seems to be located at discontinuities d2 and d3, which seem toact as effective seals for the trapped gas. Our data did not showobvious indication of gas seeping.
The vertical position of the top of the acoustic blankings hasbeen mapped in all areas, occurring from 20 cm below the presentbottom of the slough to 5 m below it. This front can migrate
vertically due to seasonal variations of temperature within theannual cycle (Wever and Fiedler, 1995; Wever et al., 1998),changes in the effectiveness of the seal, neotectonics (Laieret al., 1992) and/or seismic movements (Field and Jennings,1987; Laier et al., 1992; Hasiotis et al., 1996; Dando et al.,2000). Hagen and Vogt (1999) found in Chesapeake Bay move-ments in the front of the gas accumulations up to 0.5 m. All ofthese factors apply to the Slough, which is becoming a veryerosional environment and the gas would be less stable with timeand therefore it is likely to be prone to escape in the near future.Because this is a conservation area, more studies should be doneto qualify and quantify the composition and occurrence of gassesin the sediments and the possible escape of gas into the watercolumn and atmosphere.
The results of this study have broad implications for sedimentmapping in coastal estuaries, lagoons, and deltas. Seismic imaging isbeing increasingly utilized in studies of Quaternary coastal geology insettings such as lagoons (Buynevich and Donnelly, 2006; Allard et al.,2009). Here, we use sub-bottom profiles to map geologic disconti-nuities and contemporary erosional processes in a Central Californiaestuary that has been impacted by a number of changes tocoastal land use and tidal hydrodynamics over the past century(Schwartz, 2002). In contrast with several other well-studied estuar-ine lagoons, tidal flats at Elkhorn Slough were not underlain withdeposits indicative of migrating tidal channels (McClennen andHousely, 2006; Hijma et al., 2010), rather, paleo-thalwegs wereconsistently found to underlay modern thalwegs, suggesting thatthe main tidal channel of Elkhorn Slough has been consistentlyconfined to a stream channel entrenched during the Pleistocenesea-level low stand. This pattern of estuarine development mightapply broadly in California, where estuaries are limited in areal extentby high energy conditions: coastal uplift, heavy surf, and a narrowcontinental shelf (Grewell et al., 2007). Further, we found seismic unitanalysis to provide unambiguous evidence of erosional patternswhere erosion has disrupted unit boundaries. Erosional paraconfor-mities are difficult to identify in core profiles, yet knowing whethertidal or sub-tidal flats are accumulating sediment or eroding awaycan be useful information for conservation and restoration planning.Depending on unit stratigraphy, seismic analysis thus may providecoastal managers with a tool to assess benthic habitat stability ondecadal to longer-time scales without resorting to repeat surveys.
In addition to geological mapping, this study also suggestsbroader applications for sub-bottom acoustic profiling. By collect-ing profiles above salt marsh and submerged aquatic vegetation(SAV), we tested the ability of acoustic pulses and post-processingsoftware to penetrate these habitat types. We found that acousticblanking and reverberation acted as a strong barrier for visualiz-ing stratigraphy below marshlands or SAV. However, we diddiscover highly distinctive acoustic characteristics of SAV, readilypermitting the identification of SAV on acoustic profiles.In locations where optical-based techniques for SAV detectionare limited by water clarity, we hypothesize that acoustic ‘sub-bottom’ profiling may provide a cheaper or easier solution for theground-truthing of SAV maps than traditional scuba or side-scansonar surveys. Because of its multi-faceted applications, wetherefore advocate the use of such a tool for benthic mapping.
5. Conclusions
Using a sub-bottom ‘‘chirp’’ profiler we have imaged for thefirst time the Elkhorn Slough 8000 yr B.P. old paleochannel and itsinfill. We have confirmed that the location of that paleochanneland the present main channel mostly coincide and therefore, nomajor tectonic events have recently occurred in the area.

A. Garcıa-Garcıa et al. / Continental Shelf Research 55 (2013) 108–118 117
Radiocarbon data has been correlated to the seismic datasetsindicating that the oldest visible unit U1 is older than 2070 yr B.P.,probably older than 4055 yr B.P.; unit U2 is between 670 and920 yr B.P.; and the start of unit U3 deposition was younger than480 yr B.P. Reconstructing the sedimentary infill, we havedetected twice in the last 3000 years the creation of an islandbifurcating the channel, thus forming two main depocenters forthe units U2 and U3, which filled the Slough in the marinetransgression. These units have evidence of erosion, a patternthat continues at present.
On the bends of the channel, there are numerous lateralaccretion surfaces that can be interpreted as point bar/counterpoint bars, with an average length of 52 m and thickness of 1.7 mat their rollover point. More work is needed to investigate theseand understand their impact on the channel location and flowpatterns.
The presence of gas in the sediments has been interpreted inthe two more recent units. Their gas fronts seem to be acting aseffective seals but it is worth noting that some of them are locatedso shallow (20 cm below present bottom) that the present neterosion environment might destabilize these seals, with potentialnegative implications, such as continued elevation losses foralready excessively deteriorated marshlands. Therefore we sug-gest monitoring in future research.
Acknowledgments
The authors wish to thank the SeaFloor Mapping Lab at CSUMB foruse of their Edgetech CHIRP profiler, Captain Ron Eby for his time andskillful handling of the acquisition vessel, Geoff Shipton of TritonImaging for his assistance during acquisition and interpretation ofCHIRP data, and Triton Imaging for donating their excellent seismicacquisition and interpretation software. We also wish to thank thestaff of the Elkhorn Slough Foundation for their assistance and use ofequipment. We would like to also thank the reviewers Mr. Maher andeditor Mr. Jonathan Sharples, whose suggestions and commentsimproved the earlier version of the manuscript. Funding and supportfor this project was provided by CICEET, the Cooperative Institute forCoastal and Estuarine Environmental Technology. A partnership ofthe National Oceanic and Atmospheric Administration and theUniversity of New Hampshire, CICEET develops tools for clean waterand healthy coasts nationwide. Partial support was also provided byFugro Geoconsulting Inc. We want to thank Dr. Gary Hampsom forhis insight regarding lateral accretion surfaces and point and counterpoint bars, and Dr. Gary Greene for clarification on the geologicalbackground. We also thank Dr. Ivano Aiello at Moss Landing MarineLaboratories for early discussions on the manuscript.
Cores were logged at the Limnological Research Center, Depart-ment of Geology and Geophysics, University of Minnesota-TwinCities. This report is contribution number ORD-003257 of the U.S.EPA’s Office of Research and Development, National Health andEnvironmental Effects Research Laboratory, Atlantic Ecology Division,Mention of trade names or commercial products does not constituteendorsement or recommendation for use.
References
Allard, J., Chaumillon, E., Fenies, H., 2009. A synthesis of morphological evolutionsand Holocene stratigraphy of a wave-dominated estuary: the Arachchonlagoon, SW France. Continental Shelf Research 29, 957–969.
Bartlett, K.B., Bartlett, D.S., Harris, R.C., Sebacher, D.I., 1987. Methane emissionsalong a salt marsh salinity gradient. Biogeochemistry 4, 183–202.
Buynevich, I.V., Donnelly, J.P., 2006. Geological signatures of barrier breaching andoverwashin, southern Massassachusetts. USA. Journal of Coastal Research S39,112–116.
Caffrey, J., 2002. Biogeochemical cycling. In: Caffrey, J., Brown, M., Breck Tyler, W.,Silberstein, M. (Eds.), Changes in California Estuary. A Profile of Elkhorn
Slough. Elkhorn Slough Foundation. Moss Landing, California, pp. 215–236(Chapter 12).
Caffrey, J., Mountjoy, D., Silberstein, M., Zabin, C., 2002. Management Issues. In:Caffrey, J., Brown, M., Breck Tyler, W., Silberstein, M. (Eds.), Changes inCalifornia Estuary. A Profile of Elkhorn Slough. Elkhorn Slough Foundation.Moss Landing, California, pp. 257–271 (Chapter 14).
Cattaneo, A., Trincardi, F., Langone, L., Asioli, A., Puig, P., 2004. Clinoformgeneration on mediterranean margins. Oceanography 17 (4), 105–117.
Dando, P.R., Goldson, L.E., Linke, P., Muller, S., Perissorais, C., Varnavas, S.P., 2000.Shallow gas venting along the Hellenic volcanic arc, Aegean Sea. AbstractVolume 6th International Conference of Gas in Marine Sediments. St. Peters-burg, Russia, pp. 19–20.
Ducea, M.N., Kidder, S., Chesley, J.T., Saleeby, J.B., 2009. Tectonic underplating oftrench sediments beneath magmatic arcs: the central California example.International Geology Review 51 (1), 1–26.
Dupre, W.R., 1990. Quaternary geology of the Monterey Bay region, California. In:Garrison, R.E., Greene, H.G., Hicks, K.R., Weber, G.E., Wright, T.L. (Eds.), Geologyand tectonics of the central California Coast region, San Francisco to Monterey,volume and guidebook. American Association of Petroleum Geologists, PacificSection. Bakersfield, California, pp. 185–192.
Field, M.E., Jennings, A.E., 1987. Seafloor gas seeps triggered by a NorthernCalifornia earthquake. Marine Geology 77, 39–51.
Garcıa-Garcıa, A., Garcıa-Gil, S., Vilas, F., 2003. Monitoring the Spanish gas fields inthe Rıa de Vigo (1991–2001). Geo-Marine Letters 23 (3/4), 200–206.
Garcıa-Gil, S., Vilas, F., Garcıa-Garcıa, A., 2002. Shallow gas features in incised-valley fills (Rıa de Vigo, NW Spain): a case study. In: Judd, A., Curzi, P. (Eds.),Shallow Gas Studies, 22. Continental Shelf Research, pp. 2303–2315.
Greene, H.G., Maher, N., Paull, C., 2002. Physiography of the Monterey Bay regionand implications about continental margin development. Marine Geology 181,55–82.
Grewell, B., Callaway, J.C., Ferren Jr., R., 2007. Estuarine Wetlands. In: Barbour,M.G., Keeler-Wolf, T., Schoenherr, A.A. (Eds.), Terrestrial vegetation of Califor-nia. UC Press, Berkeley and Los Angeles, California, pp. 123–154 (Chapter 5).
Hampson, G.J., 2000. Discontinuity surfaces, clinoforms, and facies architecture ina wave-dominated, shoreface–shelf parasequence. Journal of SedimentaryResearch 70 (2), 325–340.
Hagen, R.A., Vogt, P.R., 1999. Seasonal variability of shallow biogenic gas inChesapeake Bay. Marine Geology 158, 75–88.
Hasiotis, T., Papatheodorov, G., Kastanos, N., Ferentinos, G., 1996. A pockmark fieldin the Patras Gulf (Greece) and its activation during the 14/7/93 seismic event.Marine Geology 130, 333–344.
Heard, J.E., 1992. Hydrogeology of High-Salinity Ground Water in the ‘‘180-foot’’Pressure Aquifer Southwest Salinas, Monterey County, California. Master’sThesis. Paper no. 467, 142 pp.
Hijma, M.P., van der Spek, A.J.F., van Heteren, S., 2010. Development of a mid-Holocene estuarine basin, Rhine-Meuse mouth area, offshore the Netherlands.Marine Geology 271, 198–211.
Hornberger, M., 1991. Paleoenvironment of Elkhorn Slough and SurroundingWetland Habitats: An Ecological Study Using a Geological Approach. M.S.Thesis. Moss Landing Marine Lab.
Israel, K., Watt, S., 2006. Elkhorn Slough: A Review of the Geology, Geomorphol-ogy, Hydrodynamics and Inlet Stability. Internal Report for Elkhorn SloughNational Estuarine Research Reserve, 80 pp.
Johnson, W.M., 1854. Map of Part of the Coast of Cal. From Pajaro River Southward.U.S. Coast and Geodetic Survey, Department of Commerce.
Jones, T.L., 2003. Prehistoric Human Ecology of the Big Sur Coast, California.Contributions of the University of California. Archaeological Research Facility.University of California, Berkeley 61.
Judd, A., Hovland, M., 2007. Seabed fluid flow. impact on geology, biology, and themarine environment. Cambridge University Press, Cambridge, UK 475.
Kidder, S., Ducea, M., Gehrels, G., Patchett, P.J., Vervoort, J., 2003. Tectonic andmagmatic development of the Salininan Coast Ridge Belt, California. Tectonics22 (5), 1058, http://dx.doi.org/10.1029/2002TC001409.
Laier, T., Jørgensen, N.O., Buchardt, B., Cederberg, T., Kuijpers, A., 1992. Accumula-tion and seepages of biogenic gas in Northern Denmark. Continental ShelfResearch 12 (10), 1173–1186.
McClennen, C.E., Housely, R.A., 2006. Late-Holocene channel meander migrationand mudflat accumulation rates, Lagoon of Venice, Italy. Journal of CoastalResearch 22, 930–945.
Mitchum Jr., R.M., Vail, P.R., Sangree, J.B., 1977. Seismic Stratigraphy and GlobalChanges of Sea Level, Part 6: Stratigraphic Interpretation of Seismic ReflectionPatterns in Depositional Sequences. In: Payton, C.E. (Ed.), SeismicStratigraphy—Applications to Hydrocarbon Exploration, 26. American Asso-ciation of Petroleum Geologists Memoirs, pp. 117–133.
Mullins, H.T., Nagel, D.K., Dominguez, L.L., 1985. Tectonic and eustatic controls oflate quaternary sedimentation along the central California (Santa Cruz)continental margin: high-resolution seismic stratigraphic evidence. Sedimen-tary Geology 45, 327–347.
Posamentier, H.W., James, D.P., Allen, G.P., 1988. Eustatic Controls on ClasticDeposition I-Conceptual Framework. In: Wilgun, C.K., Hastings, B.S., Kendall,C., Posamentier, H.W., Ross, C.A., Van Wagoner, J.C. (Eds.), Sea-Level Changes:An Integrated Approach. Society of Economic Paleontologists and Mineralo-gists, 42. Special Publication, pp. 109–124.
Rich, J.L., 1951. Three critical environments of deposition, and criteria forrecognition of rocks deposited in each of them. Geological Society of AmericaBulletin 62, 1–20.
A. Garcıa-Garcıa et al. / Continental Shelf Research 55 (2013) 108–118118
Schwartz, D., 2002. Changes in California Estuary. A profile of Elkhorn Slough:Geology. In: Caffrey, J., Brown, M., Breck Tyler, W., Silberstein, M. (Eds.),Changes in California Estuary. A Profile of Elkhorn Slough. Elkhorn SloughFoundation. Moss Landing, California, pp. 16–24 (Chapter 2).
Schwartz, D.L., Mullins, H.T., Belknap, D.F., 1986. Holocene geologic history of atransform Margin Estuary: Elkhorn Slough, Central California. Estuarine,Coastal and Shelf Science 22, 285–302.
Smith, D.G., Hubbard, S.M., Leckie, D.A., Fustic, M., 2009. Counter point bardeposits: lithofacies and reservoir significance in the meandering modernPeace River and ancient McMurray Formation, Alberta, Canada. Sedimentology56 (6), 1655–1669.
Stuiver, M., Reimer, P.J., Reimer, R., 2011. Radiocarbon calibration program, CALIB6.0 [En ligne]. /http://calib.qub.ac.uk/calib/calib.htmlS, consulted on May2012.
Vail, P.R., Audemard, F., Bowman, S.A., Eisner, P.N., Perez-Cruz, C., 1991.The Stratigraphic Signatures of Tectonics, Eustacy y Sedimentology. In:Einsele, G., Ricken, W., Seilacher, A. (Eds.), Cycles and Events in Stratigraphy.Springer-Verlag, Berlin, pp. 617–659.
Vail, P.R., Mitchum Jr., R.M., Todd, R.G., Widmier, J.M., Thompson III, S., Sangree,J.B., Bubb, J.N., Hatelid, W.G., 1977. Seismic stratigraphy and global changes ofsea level. In: Payton, C.E. (Ed.), Seismic Stratigraphy—Applications to Hydro-carbon Exploration, 26. American Association of Petroleum Geologists Mem-oirs, pp. 49–213.
VanDyke, E., Wasson, K., 2005. Historical ecology of a Central California estuary:150 years of habitat change. Estuaries 28 (2), 173–189.
Vedder, J.G., Howell, D.G., McLean, H., 1983. Stratigraphy, sedimentation andtectonic accretion of exotic terranes, southern coast ranges, California. Amer-ican Association Petroleum Geologists Memoir 34, 471–498.
Watson, E.B., 2008. Dating Recent Sedimentation Rates in Healthy Marsh atElkhorn Slough Using Pb-210 and Cs-137 Dating Methods. Report for ElkhornSlough National Estuarine Research Reserve, Moss Landing, 12 pp.
Watson, E.B., 2011. Elkhorn Slough marsh stratigraphy: prehistoric marsh extentand recent sediment accretion. Powerpoint presented at TWP coastal decision-maker workshop, Elkhorn Slough, California.
Watson, E.B., Wasson, K., Paternack, G.B., Woolfolk, A., Van Dyke, E., Gray, A.B.,Wheatcroft, R.A., Pakenham, A., 2011. Applications from paleoecology toenvironmental management and restoration in a dynamic coastal environ-ment. Restoration Ecology 19, 765–775.
Weber, G.E., 1990, Pleistocene Marine Terraces and NEotectonics of the SanGregorio Fault Zone (pp. 1–12); Marine Terraces, a Brief Introduction (pp.50–63), and Late Pleistocene slip rates on the San Gregorio Fault Zone at PointAno Nuevo, San Mateo County, California (pp. 64–79). In: Griggs, G.B., Weber,G.E. (Eds.) Field Trip Guide: Coastal Geologic Hazards and Coastal Tectonics,Northern Monterey Bay and Santa Cruz and San Mateo County Coastlines,Association of Engineering Geologists, March 3, 1990, 146 p.
West, G.J., 1988. Exploratory pollen analysis of sediments from Elkhorn Slough. In:Dietz, S.A., Hildebrandt, W., Jones, T. (Eds.) Archaeological Investigations atElkhorn Slough: CA-MNT-229, A middle period site on the central Californiacoast, pp. 25–56. Papers in Northern California Anthropology no. 3. NorthernCalifornia Anthropological Research Group, Berkeley.
Wever, T.F., Abegg, F., Fiedler, H.M., Fechner, G., Stender, I.H., 1998. Shallow gas inthe muddy sediments of Eckernforde Bay, Germany. Continental ShelfResearch 18, 1715–1739.
Wever, T.F., Fiedler, H.M., 1995. Variability of acoustic turbidity in Eckernforde Bay(Southwest Baltic Sea) related to the annual temperature cycle. MarineGeology 125, 21–27.