High Resolution Melting Curve Analysis for Rapid...
18
Journal of Tuberculosis Research, 2016, 4, 155-172 http://www.scirp.org/journal/jtr ISSN Online: 2329-8448 ISSN Print: 2329-843X DOI: 10.4236/jtr.2016.44019 November 30, 2016 High Resolution Melting Curve Analysis for Rapid Detection of Pyrazinamide Resistance in Mycobacterium tuberculosis Clinical Isolates Fatima Osman 1 , Farzana Ismail 1,2 , Ayman Osman 3 , Shaheed Omar 4 , Halima Said 4 , Nazir Ismail 4 1 Department of Medical Microbiology, Faculty of Health Science, University of Pretoria, Pretoria, South Africa 2 National Health Laboratory Service, Tshwane Academic Division, Pretoria, South Africa 3 Department of Immunology, Faculty of Health Science, University of Pretoria, Pretoria, South Africa 4 Centre for Tuberculosis, National Institute for Communicable Diseases, Johannesburg, South Africa Abstract Background: Pyrazinamide (PZA) is one of the most important drugs for tuberculo- sis (TB) treatment, however, its susceptibility is not routinely tested. High-resolution melting (HRM) curve analysis has been widely used for many applications. In this study, HRM assay was developed and evaluated for the detection of PZA resistance in Mycobacterium tuberculosis clinical isolates. Methods: Ninety five M. tuberculo- sis clinical isolates with different susceptibility patterns to anti-TB drugs were used to evaluate this assay. Isolates were phenotypically (Bactec MGIT 960) and genotypi- cally (HRM and pncA gene sequencing) analysed for PZA resistance. Results: Bactec MGIT 960 analysis revealed that 29 of the 95 M. tuberculosis isolates were PZA re- sistant. In comparison to the Bactec MGIT 960, HRM showed a sensitivity of 47.7% and specificity of 74.6%, and the overall agreement between the two methods was 68.4%. Based on DNA sequencing, a correlation of 0.67 (significant at p-value < 0.05) between phenotypic resistance to PZA and pncA mutations was observed. PZA re- sistance was strongly associated with multi-drug resistant (MDR)-TB as it was shown in 79.3% of the MDR isolates included in the study. Conclusion: HRM is simple and useful for screening clinical M. tuberculosis isolates for PZA resistance, however, further modifications to improve its performance are required. Keywords Pyrazinamide, Tuberculosis, High Resolution Melting Curve Analysis, Drug Resistance, pncA Gene How to cite this paper: Osman, F., Ismail, F., Osman, A., Omar, S., Said, H. and Ismail, N. (2016) High Resolution Melting Curve Analysis for Rapid Detection of Pyrazina- mide Resistance in Mycobacterium tubercu- losis Clinical Isolates. Journal of Tuberculosis Research, 4, 155-172. http://dx.doi.org/10.4236/jtr.2016.44019 Received: May 26, 2016 Accepted: November 27, 2016 Published: November 30, 2016 Copyright © 2016 by authors and Scientific Research Publishing Inc. This work is licensed under the Creative Commons Attribution International License (CC BY 4.0). http://creativecommons.org/licenses/by/4.0/ Open Access
Transcript of High Resolution Melting Curve Analysis for Rapid...

Journal of Tuberculosis Research, 2016, 4, 155-172 http://www.scirp.org/journal/jtr
ISSN Online: 2329-8448 ISSN Print: 2329-843X
DOI: 10.4236/jtr.2016.44019 November 30, 2016
High Resolution Melting Curve Analysis for Rapid Detection of Pyrazinamide Resistance in Mycobacterium tuberculosis Clinical Isolates
Fatima Osman1, Farzana Ismail1,2, Ayman Osman3, Shaheed Omar4, Halima Said4, Nazir Ismail4
1Department of Medical Microbiology, Faculty of Health Science, University of Pretoria, Pretoria, South Africa 2National Health Laboratory Service, Tshwane Academic Division, Pretoria, South Africa 3Department of Immunology, Faculty of Health Science, University of Pretoria, Pretoria, South Africa 4Centre for Tuberculosis, National Institute for Communicable Diseases, Johannesburg, South Africa
Abstract Background: Pyrazinamide (PZA) is one of the most important drugs for tuberculo-sis (TB) treatment, however, its susceptibility is not routinely tested. High-resolution melting (HRM) curve analysis has been widely used for many applications. In this study, HRM assay was developed and evaluated for the detection of PZA resistance in Mycobacterium tuberculosis clinical isolates. Methods: Ninety five M. tuberculo-sis clinical isolates with different susceptibility patterns to anti-TB drugs were used to evaluate this assay. Isolates were phenotypically (Bactec MGIT 960) and genotypi-cally (HRM and pncA gene sequencing) analysed for PZA resistance. Results: Bactec MGIT 960 analysis revealed that 29 of the 95 M. tuberculosis isolates were PZA re-sistant. In comparison to the Bactec MGIT 960, HRM showed a sensitivity of 47.7% and specificity of 74.6%, and the overall agreement between the two methods was 68.4%. Based on DNA sequencing, a correlation of 0.67 (significant at p-value < 0.05) between phenotypic resistance to PZA and pncA mutations was observed. PZA re-sistance was strongly associated with multi-drug resistant (MDR)-TB as it was shown in 79.3% of the MDR isolates included in the study. Conclusion: HRM is simple and useful for screening clinical M. tuberculosis isolates for PZA resistance, however, further modifications to improve its performance are required.
Keywords Pyrazinamide, Tuberculosis, High Resolution Melting Curve Analysis, Drug Resistance, pncA Gene
How to cite this paper: Osman, F., Ismail, F., Osman, A., Omar, S., Said, H. and Ismail, N. (2016) High Resolution Melting Curve Analysis for Rapid Detection of Pyrazina-mide Resistance in Mycobacterium tubercu-losis Clinical Isolates. Journal of Tuberculosis Research, 4, 155-172. http://dx.doi.org/10.4236/jtr.2016.44019 Received: May 26, 2016 Accepted: November 27, 2016 Published: November 30, 2016 Copyright © 2016 by authors and Scientific Research Publishing Inc. This work is licensed under the Creative Commons Attribution International License (CC BY 4.0). http://creativecommons.org/licenses/by/4.0/
Open Access

F. Osman et al.
156
1. Background
Pyrazinamide (PZA) is one of the most important drugs for tuberculosis (TB) treat-ment. It has a unique sterilizing effect on killing semi-dormant bacilli and is also very effective against multi-drug (MDR)-TB [1] [2]. Pyrozinoic acid (POA) is the active form of the drug and is metabolized by pyrazinamidase (PZase) enzyme which is en-coded by the pncA gene [3]. Although number of studies suggest that PZA resistance is not caused by a single mechanism, mutations in the pncA gene are considered as the main mechanism of PZA resistance in M. tuberculosis [4]. The lack of reliable cul-ture-based methods which require an acidic condition and high cost of the molecular techniques makes the testing of PZA resistance generally very difficult to perform [5]. It is very important to develop rapid and accurate drug susceptibility testing (DST) to prevent the spread of multi-drug resistant (MDR)-TB as well as extremely drug resis-tant (XDR)-TB.
Several molecular techniques have been described for the detection of anti-TB drug resistance-associated mutations, including the line probe assays GenoType MTBDRplus (Hain Lifescience GmbH, Nehren, Germany), GenoType MTBDRsl (Hain Lifescience GmbH, Nehren, Germany), INNO-LiPA Rif.TB (Innogenetics, Ghent, Belgium), and Xpert MTB/RIF (Cepheid, Sunnyvale, CA) [6] [7]. However, these are probe based as-says and only suitable for mutations that are located in hotspot regions of specific genes. Mutations in the pncA are dispersed throughout the gene and its upstream pro-moter; this makes the development of probe-based methods challenging [8]. Direct se-quencing of pncA amplicons remains the best genotypic strategy, however this is costly.
High-resolution melting (HRM) curve analysis is a simple technique and has been widely used for many applications. PCR amplicons are heated and fluorescence loss is monitored in real-time. Variations in sequences are detected by difference in melting point (Tm) compared to reference DNA; it does not require the use specific probes [9] [10]. In the TB field, HRM has been used for detecting rifampin (RIF), isoniazid (INH), streptomycin (STR), and fluoroquinolone resistant M. tuberculosis [11]. In this study, we describe an HRM technique to detect pncA mutations in M. tuberculosis clinical isolates and compare its results to the phenotypic PZA susceptibility testing (The Bac-tec MGIT 960). Isolates that had discordant results were sent for sequencing. This method uses the Roche LightCycler 480® and involves simultaneous amplification of three overlapping fragments.
2. Methods
The study was conducted at the NHLS-TB Laboratory Tshwane Academic Division (Diagnostic division of the Department of Medical Microbiology, University of Pretoria from July 2013 to October 2013. Ethics approval was obtained (number 57/2012) prior to commencement of the study. The study isolates (95) were a mixture of MDR-TB and non-MDR-TB collected from the National Health Laboratory Service (NHLS) TB Laboratory. All isolates were presumptively identified as M. tuberculosis complex using Ziehl-Neelsen (ZN) stain and tested for susceptibility using the GenoType MTBDR plus

F. Osman et al.
157
line probe assay (HainLifescience GmbH, Germany). Isolates were then categorized as either MDRs or Non-MDRs (Mono-RIF resistance, Mono-INH resistance or fully sen-sitive) [7].
Purity of all isolates by ZN staining was confirmed before susceptibility testing was performed. To exclude bacterial and fungal contamination, another amount of a well- mixed suspension was inoculated using sterile glass pipette on chocolate agar (pro-duced in-house, NHLS Laboratory, Tshwane Academic Division) and incubated aero-bically at 37˚C. All plates were inspected for bacterial growth every 24 hrs for two days.
Isolates were sub-cultured onto 7H10 agar medium (Becton Dickinson, Sparks, MD, USA) and incubated for three weeks aerobically at 37˚C until typical M. tuberculosis colonies appeared (dry, wrinkled, warty, with colourless rough surface). Colonies were picked and sub-cultured into MGIT tubes (Becton Dickinson, Sparks, MD, USA) ac-cording to the manufacturer’s procedure.
Each isolate was tested for PZA susceptibility when the Bactec MGIT 960 indicated positive culture growth. The day the Bactec MGIT 960 (Becton Dickinson, Sparks, MD, USA) gives a positive signal is considered as day zero. Once positive, tubes were re-moved from the Bactec MGIT 960 (Becton Dickinson, Sparks, MD, USA) they were transferred into an incubator 37˚C ± 1˚C until susceptibility testing was performed (within five days). Undiluted inoculum was used if the isolate was processed on days one or two. On days three, four or five, the growth culture was diluted 1:5 using normal saline (0.9%) (SABAX Pour Saline, Adcock Ingram, South Africa) prior to susceptibility testing. PZA susceptibility testing was performed according to the manufacturer’s pro-cedure (Becton Dickinson, Sparks, MD, USA). Susceptibility results were available within four to 21 days. Once the test was completed, a report was generated and printed. Each isolate was categorized as “S” (susceptible) or “R” (resistant).
2.1. DNA Extraction of M. tuberculosis Isolates
Genomic DNA was extracted from the M. tuberculosis isolates using QIAquick PCR Purification Kit (Whitehead Scientific, Brackenfell, South Africa) according to the manufacture’s procedure. Extracted DNA was quantified using specific spectropho-tometry (NanoDrop; ND-1000; USA), and adjusted to a concentration of five to 30 ng/µl using elution buffer (BioMérieux, France), this range is required by HRM for op-timal performance. The extracted DNA was then transferred into a sterile 1.5 ml tube (BioMérieux, France) and used directly for HRM analysis or stored at −80˚C.
2.2. HRM Optimization
The LightCycler® 480 HRM master mix contains all the ingredients required. The two most important contents which needed to be optimized carefully before commencing with the testing process were MgCl2 and primers.
2.2.1. MgCl2 Because specific amplification is essential for HRM analysis, determination of MgCl2

F. Osman et al.
158
optimum concentration for each new primer pair is very important. A separate 25 mM MgCl2 stock solution was supplied with the master mix. This is to allow the easy opti-mization of Mg2+ concentration. Optimization was achieved by running a positive sam-ple with serial dilutions of MgCl2 (1.0, 1.5, 2.0, 2.5, 3.0 3.5 mM) and analysis of the PCR products by agarose gel electrophoresis.
2.2.2. Primers Primers previously described by Scorpio et al. were synthesized by Inqaba Biotechnical Industries Pretoria, South Africa to the M. tuberculosis pncA sequence (GenBank ac-cession number U59967) [12] (Table 1). Prior to the experiment and to ensure specific amplification for HRM analysis, the optimal primer concentration (the lowest concen-tration that still results in a high rate of amplicon yield with a low cut off point (Cp) and adequate fluorescence dynamics for a given target concentration) was determined. This was achieved by testing different concentrations of each primer (0.1, 0.2 and 0.3 µM).
2.3. Real-Time PCR and HRM Conditions
HRM curve analysis including the amplification step was performed using the LightCy-cler® 480 High Resolution Melting Master Kit and the LightCycler® 480 Instrument II (Roche, Germany). In order to detect all possible mutations in the pncA gene (561 bp) regardless of their locations, and to achieve the recommended size of the gene for HRM analysis (less than 300 bp), the target gene was amplified using three sets of primers to produce three fragments of the target gene [12].
The reaction mixture was prepared according to the manufacturer’s instructions (LightCycler 480® Real-Time PCR manual, 2009). HRM master mix consisted of 2× a concentration hot-start reaction mix that contained FastStartTaq DNA polymerase, re-action buffer, dNTP mix (with dUTP) and HRM Dye. PCR reaction composition is shown in Table 2. Inclusion of HRM dye enabled detection of double-stranded DNA by fluorescence, monitoring formation of amplicon during PCR cycling and melting curve analysis.
These components were added into a 1.5 ml reaction tube on ice and mixed carefully by pipetting up and down. The amount in the volume column was multiplied by the Table 1. Primers sequences of used for the amplification of pncA gene.
Primers Sequences 5'…………..3'
Set 1 P1 F: GTCGGTCATGTTCGCGATCG
P2 R: TCGGCCAGGTAGTCGCTGAT
Set 2 P3 F: ATCAGCGACTACCTGGCCGA
P4 R: GATTGCCGACGTGTCCAGAC
Set 3 P5 F: CCACCGATCATTGTGTGCGC
P6 R: GCTTTGCGGCGAGCGCTCCA

F. Osman et al.
159
Table 2. Reaction mixture used in HRM analysis for the detection of pncA gene mutation in M. tuberculosis.
Reagents Volume (µl)×1 Final Concentration
Master Mix, 2× conc. 10 µl 1× conc.
Mgcl2, 25 mM 1.6 µl 2 mM
Primer mix, 20 × conc. {4 µM} 1.0 µl 0.2 µM
Template DNA 5.0 µl 5 - 30 ng
Water, PCR-grade 2.4 µl -
Total volume 20 µl -
number of reactions to be run. Fifteen µl of the PCR mixture was transferred into each well of the LightCycler® 480 Instrument multi-well plate (Roche, Germany) then 5 µl of the DNA template was added, mixed by pipetting up and down. The LightCycler® 480 foil was used to seal the multi-well plate before loading it into the LightCycler® 480 (Roche, Germany) (Table 3).
A non-template control containing sterile distilled water was included in the experi-ment. M. tuberculosis wild type strain American Type Culture Collection (ATCC H37) as well as a M. bovis strain served as negative and positive controls for the pncA muta-tion respectively. Collected data were analysed following the final step using Light Cy-cler 480 software version 1.5. Temperature plots were generated by converting the wild type melting profile to a horizontal line and normalizing the melting profiles of the examined isolates against the M. tuberculosis wild-type profile. M. tuberculosis isolates with mutations in the pncA sequence were distinguished from the wild type based on the difference in melting temperature observed. At the end of the analysis, the software either reported the isolate as a wild type (PZA susceptible) or mutant (PZA resistant).
2.4. DNA Sequencing of the pncA Gene of Discordant M. tuberculosis Isolates
The entire pncA gene was sequenced using two primers, P1 and P6, which flank the en-tire pncA gene and its upstream promoter (700-bp). Purified DNA (10 µl) from each isolate was sent for DNA sequencing which was carried out by a commercial sequenc-ing centre using standard Sanger sequencing (InqabaBiotec, SA). Retrieved sequences were compared with the wild type pncA sequence from M. tuberculosis H37Rv for the detection of mutations associated with PZA resistance. Sequence alignment and analy-sis was performed using special software (CLC Genomics workbench, Denmark). Iso-lates were either reported as wild type (PZA susceptible) or mutant (PZA resistant). These results were compared to the HRM results, as well as the phenotypic drug sus-ceptibility results obtained from the Bactec MGIT 960 to assess the HRM against a mo-lecular gold standard as well.
2.5. Statistical Analysis
Statistical analysis was performed using the Bactec MGIT 960 as a phenotypic gold

F. Osman et al.
160
Table 3. PCR amplification and HRM conditions.
Steps in the PCR cycle Temperature Time No. of cycles
Initial denaturation (FastStartTaq DNA Polymerase)
95˚C 10:00 min 1
Denaturation 95˚C 00:10 sec
45 Annealing 63˚C 15:00 min
Extension 72˚C 00:16 sec
For HRM
Second hold
95˚C 1:00 min
1
40˚C 00:01 min
65˚C 00:01 sec
Second temperature increase 95˚C Fluorescent detection
(25 acquisition per 1˚C)
Cooling down 40˚C 00:10 sec
standard method and DNA sequencing as a molecular gold standard method. Results of HRM and MGIT or sequencing susceptibility testing were entered into 2 × 2 tables to calculate the sensitivity (ability to detect true resistance) and specificity (ability to detect true susceptibility) of HRM against MGIT as well as the positive predictive values (PPV) and the negative predictive values (NPV).
3. Results
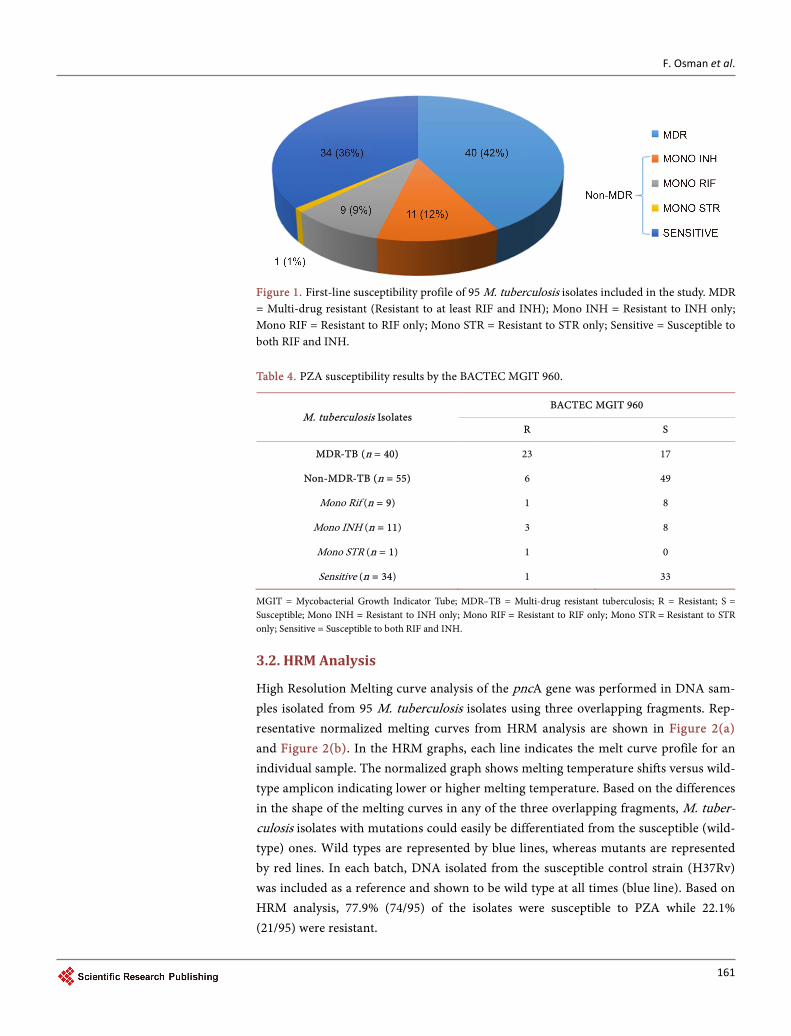
A total of 120 M. tuberculosis isolates were collected from the NHLS-TB Laboratory Tshwane Academic Division (Diagnostic division of the Department of Medical Micro-biology, University of Pretoria. Seven isolates were excluded due to duplication. Addi-tional 18 isolates had no HRM results and were excluded from analysis. Susceptibility of the 95 M. tuberculosis isolates included in the final analysis to the first-line anti-TB drugs are shown in Figure 1. Isolates were categorized as MDR-TB (Resistant to both RIF and INH) and Non-MDR-TB (susceptible to at least RIF or/and INH).
3.1. The BACTEC MGIT 960
According to the Bactec MGIT 960, 30.5% (29/95) of the isolates were phenotypically resistant to PZA. Of these 79.3% (23/29) were MDR and 20.7% (6/29) were non-MDR. Prazinamide susceptible isolates were detected in 69.4% (66/95) of the isolates, in which 25.8% (17/66) were MDR and 74.2% (49/66) were non-MDR (Table 4). Of the 34 iso-lates that were phenotypically susceptible to other drugs, 33 were determined to be sus-ceptible to PZA. However, one isolate, which was phenotypically susceptible to other drugs, was PZA-resistant, suggesting PZA mono-resistance (Table 4). The average time of reporting PZA susceptibility results was 8.5 days and 86.3% of isolates were reported in four to 12 days.
F. Osman et al.
161
Figure 1. First-line susceptibility profile of 95 M. tuberculosis isolates included in the study. MDR = Multi-drug resistant (Resistant to at least RIF and INH); Mono INH = Resistant to INH only; Mono RIF = Resistant to RIF only; Mono STR = Resistant to STR only; Sensitive = Susceptible to both RIF and INH. Table 4. PZA susceptibility results by the BACTEC MGIT 960.
M. tuberculosis Isolates BACTEC MGIT 960
R S
MDR-TB (n = 40) 23 17
Non-MDR-TB (n = 55) 6 49
Mono Rif (n = 9) 1 8
Mono INH (n = 11) 3 8
Mono STR (n = 1) 1 0
Sensitive (n = 34) 1 33
MGIT = Mycobacterial Growth Indicator Tube; MDR–TB = Multi-drug resistant tuberculosis; R = Resistant; S = Susceptible; Mono INH = Resistant to INH only; Mono RIF = Resistant to RIF only; Mono STR = Resistant to STR only; Sensitive = Susceptible to both RIF and INH.
3.2. HRM Analysis
High Resolution Melting curve analysis of the pncA gene was performed in DNA sam-ples isolated from 95 M. tuberculosis isolates using three overlapping fragments. Rep-resentative normalized melting curves from HRM analysis are shown in Figure 2(a) and Figure 2(b). In the HRM graphs, each line indicates the melt curve profile for an individual sample. The normalized graph shows melting temperature shifts versus wild- type amplicon indicating lower or higher melting temperature. Based on the differences in the shape of the melting curves in any of the three overlapping fragments, M. tuber-culosis isolates with mutations could easily be differentiated from the susceptible (wild- type) ones. Wild types are represented by blue lines, whereas mutants are represented by red lines. In each batch, DNA isolated from the susceptible control strain (H37Rv) was included as a reference and shown to be wild type at all times (blue line). Based on HRM analysis, 77.9% (74/95) of the isolates were susceptible to PZA while 22.1% (21/95) were resistant.

F. Osman et al.
162
(a)
(b)
Figure 2. Normalized melting curves from HRM analysis of the pncA gene. (a): Amplicons am-plified from susceptible isolate versus wild-type reference strain (H37Rv); (b): Amplicons ampli-fied from susceptible and resistant isolates versus wild-type reference strain (H37Rv).
3.3. Comparison of PZA Susceptibility Testing Results for the BACTEC MGIT 960 and HRM Analysis
Of the 95 isolates included in this study, 55 isolates (57.9%) and 10 isolates (10.5%) were have shown resistance and susceptibility by both methods, respectively. Discor-dant results were observed in 30 isolates (31.6%). When the Bactec MGIT 960 method was considered as the gold standard, HRM showed a sensitivity (ability to detect true resistance) of 47.7% and specificity (ability to detect true susceptibility) of 74.6%. The accuracy, the positive and negative predictive value of HRM were 69.5%, 34.5% and 83.3%, respectively. The overall agreement between the two methods was 68.4% (Table 5).
3.4. DNA Sequencing of pncA Gene
PCR products were obtained from 48 isolates (50.5% of the total sample size) and se-quenced. These included all isolates that showed resistance to PZA by MGIT 960 (30), all isolates that showed resistance by HRM (11) and seven isolates that were randomly selected from those which were susceptible by both methods i.e. MGIT 960 and HRM (Table 6).
Different types of mutations in the pncA-encoding region were identified in 27 iso-lates (56.3%), including nucleotide substitutions, insertions and deletions. No multiple- site mutation was detected (Table 6). Substitution of a single nucleotide was the most
F. Osman et al.
163
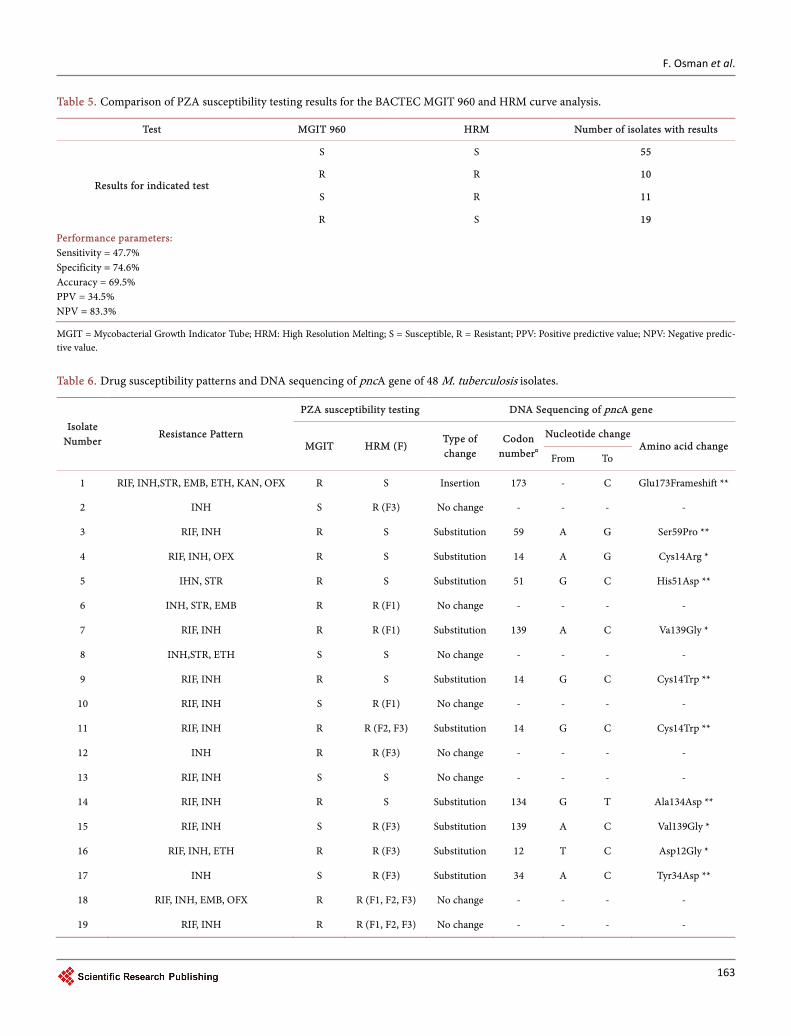
Table 5. Comparison of PZA susceptibility testing results for the BACTEC MGIT 960 and HRM curve analysis.
Test MGIT 960 HRM Number of isolates with results
Results for indicated test
S S 55
R R 10
S R 11
R S 19
Performance parameters: Sensitivity = 47.7% Specificity = 74.6% Accuracy = 69.5% PPV = 34.5% NPV = 83.3%
MGIT = Mycobacterial Growth Indicator Tube; HRM: High Resolution Melting; S = Susceptible, R = Resistant; PPV: Positive predictive value; NPV: Negative predic-tive value.
Table 6. Drug susceptibility patterns and DNA sequencing of pncA gene of 48 M. tuberculosis isolates.
Isolate Number
Resistance Pattern
PZA susceptibility testing DNA Sequencing of pncA gene
MGIT HRM (F) Type of change
Codon number¤
Nucleotide change Amino acid change
From To
1 RIF, INH,STR, EMB, ETH, KAN, OFX R S Insertion 173 - C Glu173Frameshift **
2 INH S R (F3) No change - - - -
3 RIF, INH R S Substitution 59 A G Ser59Pro **
4 RIF, INH, OFX R S Substitution 14 A G Cys14Arg *
5 IHN, STR R S Substitution 51 G C His51Asp **
6 INH, STR, EMB R R (F1) No change - - - -
7 RIF, INH R R (F1) Substitution 139 A C Va139Gly *
8 INH,STR, ETH S S No change - - - -
9 RIF, INH R S Substitution 14 G C Cys14Trp **
10 RIF, INH S R (F1) No change - - - -
11 RIF, INH R R (F2, F3) Substitution 14 G C Cys14Trp **
12 INH R R (F3) No change - - - -
13 RIF, INH S S No change - - - -
14 RIF, INH R S Substitution 134 G T Ala134Asp **
15 RIF, INH S R (F3) Substitution 139 A C Val139Gly *
16 RIF, INH, ETH R R (F3) Substitution 12 T C Asp12Gly *
17 INH S R (F3) Substitution 34 A C Tyr34Asp **
18 RIF, INH, EMB, OFX R R (F1, F2, F3) No change - - - -
19 RIF, INH R R (F1, F2, F3) No change - - - -

F. Osman et al.
164
Continued
20 RIF, INH R R (F1, F2, F3) Deletion 21 A - Val21Frameshift **
21 RIF, INH OFX S S Substitution 10 G A Ala10Val *
22 RIF, INH, EMB R R (F1) Substitution 14 A G Cys14Arg *
23 RIF, INH S S Substitution 14 G C Cys14Trp **
24 STR R S No change - - - -
25 RIF, INH R S No change - - - -
26 RIF, INH S S No change - - - -
27 RIF R S No change - - - -
28 RIF, INH, STR, EMB R S Substitution 135 T G Thr135Pro *
29 RIF, INH S R (F3) Substitution 139 A C Val139Gly *
30 RIF S R (F1) Substitution 172 A G Leu172Pro *
31 RIF, INH R R (F2) Substitution 59 A G Ser59Pro **
32 RIF, INH R S Substitution 135 T G Thr135Pro *
33 RIF, INH R S Substitution 135 T G Thr135Pro *
34 RIF, INH, EMB R S Substitution 135 T G Thr135Pro *
35 RIF, INH, STR R S Substitution 135 T G Thr135Pro *
36 RIF, INH R S No change - - - -
37 RIF, INH R S Insertion 12 - C Asp12Frameshift **
38 Susceptible S R (F1, F3) Substitution 122 G A Gln122Stop **
39 RIF, INH R S Substitution 12 T C Asp12Gly *
40 RIF, INH R S No change - - - -
41 Susceptible S S No change - - - -
42 Susceptible S R (F3) No change - - - -
43 Susceptible S S No change - - - -
44 Susceptible S S No change - - - -
45 Susceptible S S No change - - - -
46 Susceptible R S Substitution 57 G C His57Asp **
47 Susceptible S R (F1, F2, F3) No change - - - -
48 Susceptible S R (F2, F3) No change - - - -
H37Rv Susceptible S S No change - - - -
PZA = Pyrazinamide; MGIT = Mycobacterial Growth Indicator Tube; HRM: High Resolution Melting; (F): Fragment showing variation by HRM; RIF = Rifampicin; INH = Isoniazid; STR = Streptomycin; EMB = Ethambutol; ETH = Ethionamide; KAN = Kanamycin; OFX = Ofloxacin; S = Susceptible; R = Resistant; A = Adenine; T = Thymine; C = Cytosine; G = Guanine; H37Rv = Control strain (Wild-type); (¤) = Number of codon position was counted from the start codon (ATG) of the pncA; (*) = High confidence mutations (mutations associated with in-vitro documented resistance reported by at least 10 publications); (**) = New mutations (reported for the first time).

F. Osman et al.
165
common mutation 88.9% (24/27), followed by insertion 7.4% (2/27) and deletion 3.7% (1/27). No mutation was detected in 21 (43.7%) isolates, of these, four (19%) were re-sistant by both methods, five (23.8%) were resistant by MGIT 960 only, five (23.8%) were resistant by HRM only and seven (33.4%) were susceptible by both methods (Table 6).
As indicated in Table 6, the mutation rate among the phenotypically resistant iso-lates that were reported by MGIT 960 was 65.5% (19/29), whereas mutations were only detected in 45.5% (5/11) isolates that were initially reported as resistant by HRM. Addi-tionally, mutations were shown in 60% (6/10) of the isolates that were reported resis-tant by both methods. No mutation was identified in the wild-type (H37Rv) strain. However, two isolates, despite being susceptible by both MGIT and HRM, showed mu-tations in the pncA gene. High confidence mutations, i.e. mutations associated with in-vitro documented resistance reported by at least 10 publications were found in 51.8% (14/27) of isolates. The rest, 48.2% (13/27), were new mutations which have not been reported in previous studies.
The most frequently mutated sites were at codon 135, which showed a substitution from thymine to guanine at nucleotide 403, this resulted in a switch at translation from threonine to proline in five isolates (18.5%). Another common site was codon 139 which showed a substitution from adenine to cytosine at nucleotide 416, and resulted in a switch at translation from valine to glycine in three isolates (11.1%). Additional three isolates (11.1%) showed new mutations in codon 14, switching translation from cys-teine to tryptophan. These three mutation sites accounted for more than one third of all the mutations identified (Table 6).
3.5. Comparison of HRM Analysis and the BACTEC MGIT 960 with DNA Sequencing
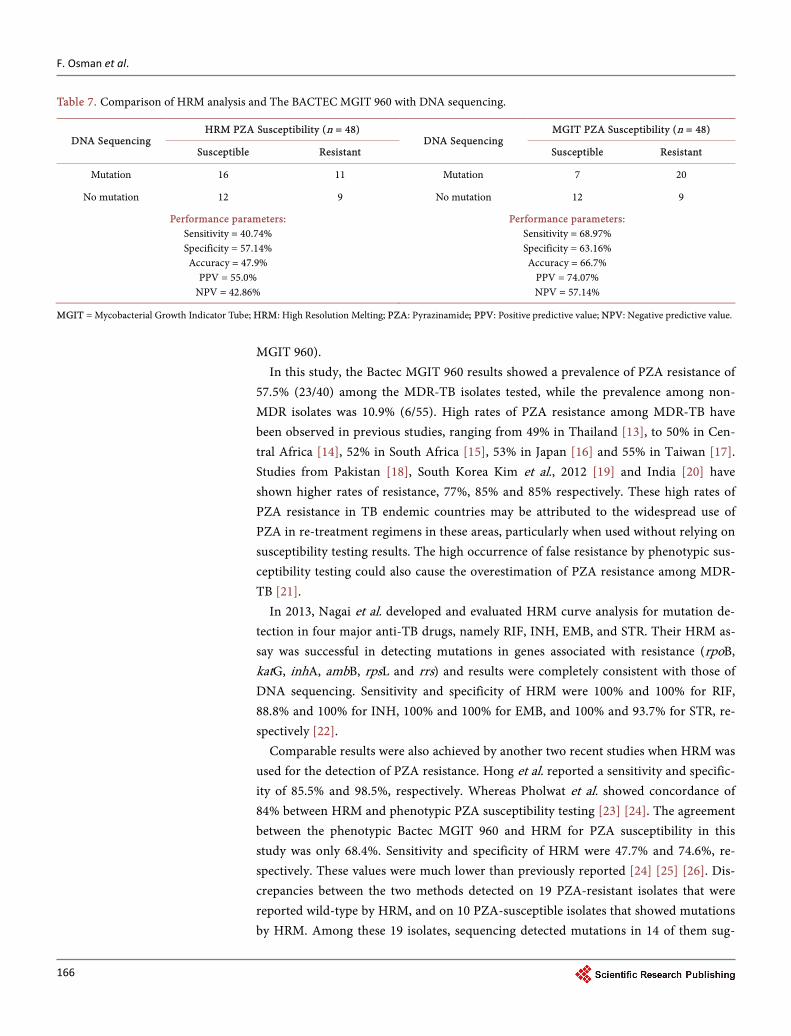
Isolates with discordant results between HRM analysis and the Bactec MGIT PZA sus-ceptibility were compared with DNA sequencing of the pncA gene (Table 7). HRM analysis was concordant with DNA sequencing for 47.9% (23/48) of the isolates. Among the 25 discordant isolates, 16 isolates had mutations in the pncA gene while HRM detected no variation; and 9 had no mutations in the pncA while HRM detected variation. DNA Sequencing of pncA was concordant with the Bactec MGIT 960 PZA susceptibility testing for 66.7% (32/48) of the isolates. Among the 16 discordant iso-lates, nine were PZA resistant while sequencing detected no mutation, and seven were PZA susceptible while sequencing showed mutations. Overall, there were fewer dis-crepancies with MGIT than with HRM.
4. Discussion
Although PZA forms an integral part of both first line and MDR TB management, rou-tine susceptibility testing of this drug is not performed due to various challenges pre-sent in the currently available techniques. This study evaluated the rapid technique of HRM for the detection of PZA resistance against the phenotypic gold standard (Bactec
F. Osman et al.
166
Table 7. Comparison of HRM analysis and The BACTEC MGIT 960 with DNA sequencing.
DNA Sequencing HRM PZA Susceptibility (n = 48)
DNA Sequencing MGIT PZA Susceptibility (n = 48)
Susceptible Resistant Susceptible Resistant
Mutation 16 11 Mutation 7 20
No mutation 12 9 No mutation 12 9
Performance parameters: Sensitivity = 40.74% Specificity = 57.14% Accuracy = 47.9%
PPV = 55.0% NPV = 42.86%
Performance parameters: Sensitivity = 68.97% Specificity = 63.16% Accuracy = 66.7%
PPV = 74.07% NPV = 57.14%
MGIT = Mycobacterial Growth Indicator Tube; HRM: High Resolution Melting; PZA: Pyrazinamide; PPV: Positive predictive value; NPV: Negative predictive value.
MGIT 960).
In this study, the Bactec MGIT 960 results showed a prevalence of PZA resistance of 57.5% (23/40) among the MDR-TB isolates tested, while the prevalence among non- MDR isolates was 10.9% (6/55). High rates of PZA resistance among MDR-TB have been observed in previous studies, ranging from 49% in Thailand [13], to 50% in Cen-tral Africa [14], 52% in South Africa [15], 53% in Japan [16] and 55% in Taiwan [17]. Studies from Pakistan [18], South Korea Kim et al., 2012 [19] and India [20] have shown higher rates of resistance, 77%, 85% and 85% respectively. These high rates of PZA resistance in TB endemic countries may be attributed to the widespread use of PZA in re-treatment regimens in these areas, particularly when used without relying on susceptibility testing results. The high occurrence of false resistance by phenotypic sus-ceptibility testing could also cause the overestimation of PZA resistance among MDR- TB [21].
In 2013, Nagai et al. developed and evaluated HRM curve analysis for mutation de-tection in four major anti-TB drugs, namely RIF, INH, EMB, and STR. Their HRM as-say was successful in detecting mutations in genes associated with resistance (rpoB, katG, inhA, ambB, rpsL and rrs) and results were completely consistent with those of DNA sequencing. Sensitivity and specificity of HRM were 100% and 100% for RIF, 88.8% and 100% for INH, 100% and 100% for EMB, and 100% and 93.7% for STR, re-spectively [22].
Comparable results were also achieved by another two recent studies when HRM was used for the detection of PZA resistance. Hong et al. reported a sensitivity and specific-ity of 85.5% and 98.5%, respectively. Whereas Pholwat et al. showed concordance of 84% between HRM and phenotypic PZA susceptibility testing [23] [24]. The agreement between the phenotypic Bactec MGIT 960 and HRM for PZA susceptibility in this study was only 68.4%. Sensitivity and specificity of HRM were 47.7% and 74.6%, re-spectively. These values were much lower than previously reported [24] [25] [26]. Dis-crepancies between the two methods detected on 19 PZA-resistant isolates that were reported wild-type by HRM, and on 10 PZA-susceptible isolates that showed mutations by HRM. Among these 19 isolates, sequencing detected mutations in 14 of them sug-

F. Osman et al.
167
gesting that HRM was not able to detect these mutants which were also phenotypically resistant. The majority variants were SNPs with five of the 19 occurring at codon 135.
Conversely, five of the ten susceptible isolates which were reported as variants by HRM showed no mutation on sequencing. Although this would suggest that these were false on HRM, it is also possible that the HRM result is true since HRM is PCR based and has a greater likelihood of detecting mixed populations which may not be detected by Sanger sequencing, and these sub-populations may not be large enough to show re-sistance phenotypically. We did not perform next generation sequencing which may have provided an answer to this uncertainty.
Recent studies have indicated that the new “gold standard” for PZA resistance de-termination should be sequencing. When considering the discordant isolates only and comparing HRM and MGIT 960 against this “new” gold standard, the accuracy for HRM was 47.9% while that of the Bactec MGIT 960 was slightly better at 66.7% (Table 7).
Phenotypic resistance to PZA has been correlated with mutations in the pncA gene in several previous studies. Some of these studies have reported this correlation to be inconsistent, ranging between 41% and 80% [25]-[31], whereas other studies showed higher correlation ranging from 91% - 97% [15] [17] [32] [33] [34]. In the current study, based on sequencing results, a correlation of 0.67 (significant at p-value < 0.05) between phenotypic resistance to PZA and pncA mutation was observed, this is com-parable to majority of the previous studies, more especially to the study that was con-ducted in South Africa by Bishop et al., in which a correlation of 67% was also reported [35].
The mutations detected in our study were found to be scattered along the entire pncA gene with no major hot spots identified. However, mutations at codon 135 were found in five isolates, whereas mutations at codons 14 and 139 were shown by three isolates each. These observations of scattered mutations are supported by similar find-ings in previous studies [27] [36]. The high diversity of pncA mutations limits its inclu-sion in the current molecular techniques such as GenoType MTBDRplus (Hain Lifescience) [37].
Absence of mutations in the pncA gene or its upper promoter in 26.7% of the PZA- resistant isolates we tested correlated with the study that was done by Sreevatsan et al., in which they reported no pncA mutations in 28% of PZA-resistant M. tuberculosis strains tested [15]. These cases could also be explained by another mechanism of resis-tance to PZA. Recently, rpsA gene has been shown to play a role in PZA resistance and has been recommended to be used as an additional target for the molecular detection of PZA susceptibility [9] [38], however in another study, none of the PZA-resistant strains harboured mutations in the rpsA gene [39]. Based on these variations, the association between PZA resistance and rpsA mutations remains un-established and requires fur-ther investigations in the future.
The low sensitivity and specificity of HRM in this study could be due to the use of three sets of primers as compared to five or seven as used in previous studies [40] [41].

F. Osman et al.
168
Unlike other studies, the current HRM was developed and evaluated using the Roche LightCycler® 480. So far, only one study has utilized the Roche LightCycler 480® for PZA susceptibility testing and used the Bactec MGIT 960 as a reference method [42]. They have shown a sensitivity and specificity of 85.5% and 98.5%, respectively and concluded that HRM is a rapid and accurate test for the detection of PZA resistance and can be used as a screening method [26]. However, recently, HRM results generated from the Rotor-gene system for the detection of PZA resistance have been found to be easier to interpret than other platforms [25].
Another explanation for the low correlation between PZA resistance and pncA mu-tations in this study is the possibility of phenotypic false resistance. This observation has been proven elsewhere [25]. PZA phenotypic susceptibility testing by the Bactec MGIT 960 is normally carried out at pH of 5.9, resistance could be falsely reported as a result of the ammonia produced during mycobacterial growth; ammonia elevates the pH of the media thus inactivating the drug [26]. According to the Henderson-Hassel- balch equation, M. tuberculosis should be tested for PZA susceptibility at a concentra-tion of at least 156 µg/ml [10], rather than the current cut-off used in the Bactec MGIT 960 method (100 µg/ml). PZA resistance could also be caused by the action of efflux pumps which has been shown to play a role in mycobacterial resistance [43]. Detection of pncA mutations in the susceptible isolates suggests that these mutations might not be fully expressed to show phenotypic PZA resistance.
5. Conclusions
In this study, apart from simplicity and speed, the current HRM genotypic method to determine PZA susceptibility using the gene scanning software of the Roche LightCy-cler 480 was shown to be moderately specific with low sensitivity. Further modifications to improve its performance are required. Pyrazinamide resistance was common among MDR-TB and the current study results showed low association of the phenotypic PZA resistance with mutations in the pncA gene. This warrants further studies to determine potential alternate genetic mechanisms of resistance to PZA in our context and re- evaluation of the MGIT 960 for detection of phenotypic resistance with an alternate phenotypic method such as the Wayne’s test.
This study provides an important baseline for more extensive evaluation studies to improve and validate the use of HRM in determining PZA susceptibility. In the future, using more than three fragments (six or seven) should be considered as this could in-crease the sensitivity and specificity of HRM in detecting pncA mutations. However, this might also increase the cost of the test. Additionally, combining such data to results from the biochemical analysis of PZase enzyme (Wayne’s test) would add to its value and ease the interpretation of the final results.
Conflict of Interest
The authors declare that they have no financial or non-financial competing interests.

F. Osman et al.
169
Funding
This project was supported by grant from the National Health Laboratory Service of South Africa.
References [1] Ahmady, A., Poolad, T., Rafee, P., Tousheh, M., Kahbazi, M. and Arjomandzadegan, M.
(2013) Study of Pyrazinamidase Structural Changes in Pyrazinamide Resistant and Suscep-tible Isolates of Mycobacterium tuberculosis. Tuberk Toraks, 61, 110-114. http://dx.doi.org/10.5578/tt.3888
[2] Yee, D.P., Menzies, D. and Brassard, P. (2012) Clinical Outcomes of Pyrazinamide-Mono- resistant Mycobacterium tuberculosis in Quebec. International Journal of Tuberculosis and Lung Disease, 16, 604-609.
[3] Raynaud, C., Lanéelle, M., Senaratne, R.H., Draper, P., Lanéelle, G. and Daffé, M. (1999) Mechanisms of Pyrazinamide Resistance in Mycobacteria: Importance of Lack of Uptake in Addition to Lack of Pyrazinamidase Activity. Microbiology, 145, 1359-1367. http://dx.doi.org/10.1099/13500872-145-6-1359
[4] Sheen, P., Lozano, K., Gilman, R.H., Valencia, H.J., Loli, S., Fuentes, P., et al. (2013) pncA Gene Expression and Prediction Factors on Pyrazinamide Resistance in Mycobacterium tuberculosis. Tuberculosis, 93, 515-522. http://dx.doi.org/10.1016/j.tube.2013.03.005
[5] Zimic, M., Loli, S., Gilman, R.H., Gutierrez, A., Fuentes, P., Cotrina, M., et al. (2012) A New Approach for Pyrazinamide Susceptibility Testing in Mycobacterium tuberculosis. Micro-bial Drug Resistance, 4, 372-375. http://dx.doi.org/10.1089/mdr.2011.0207
[6] Ajbani, K., Nikam, C., Kazi, M., Gray, C., Boehme, C., Balan, K., et al. (2012) Evaluation of Genotype MTBDRsl Assay to Detect Drug Resistance Associated with Fluoroquinolones, Aminoglycosides and Ethambutol on Clinical Sediments. PLoS One, 7, e49433. http://dx.doi.org/10.1371/journal.pone.0049433
[7] Jureen, P., Werngren, J. and Hoffner, S.E. (2004) Evaluation of the Line Probe Assay (LiPA) for Rapid Detection of Rifampicin Resistance in Mycobacterium tuberculosis. Tuberculosis, 84, 311-316. http://dx.doi.org/10.1016/j.tube.2003.12.001
[8] Morlock, G.P., Crawford, J.T., Butler, W.R., Brim, S.E., Sikes, D., Mazurek, G.H., et al. (2000) Phenotypic Characterization of pncA Mutants of Mycobacterium tuberculosis. An-timicrobial Agents and Chemotherapy, 44, 2291-2295. http://dx.doi.org/10.1128/AAC.44.9.2291-2295.2000
[9] Sreevatsan, S., Pan, X., Zhang, Y., Kreiswirth, B.N. and Musser, J.M. (1997) Mutations As-sociated with Pyrazinamide Resistance in pncA of Mycobacterium tuberculosis Complex Organisms. Antimicrobial Agents and Chemotherapy, 41, 636-640.
[10] Scorpio, A., Lindholm-Levy, P., Heifets, L., Gilman, R., Siddiqi, S., Cynamon, M., et al. (1997) Characterization of pncA Mutations in Pyrazinamide-Resistant Mycobacterium tu-berculosis. Antimicrobial Agents and Chemotherapy, 41, 540-543.
[11] Slany, M., Vanerkova, M., Nemcova, E., Zaloudikova, B., Ruzicka, F. and Freiberger, T. (2010) Differentiation of Staphylococcus spp. by High-Resolution Melting Analysis. Cana-dian Journal of Microbiology, 56, 1040-1049. http://dx.doi.org/10.1139/W10-091
[12] Merchant-Patel, S., Blackall, P.J., Templeton, J., Price, E.P., Tong, S.Y., Huygens, F., et al. (2010) Campylobacter jejuni and Campylobacter coli Genotyping by High-Resolution Melting Analysis of a flaA Fragment. Applied and Environmental Microbiology, 76, 493- 499. http://dx.doi.org/10.1128/AEM.01164-09

F. Osman et al.
170
[13] Choi, G.E., Lee, S.M., Yi, J., Hwang, S.H., Kim, H.H., Lee, E.Y., et al. (2010) High- Resolu-tion Melting Curve Analysis for Rapid Detection of Rifampin and Isoniazid Resistance in Mycobacterium tuberculosis Clinical Isolates. Journal of Clinical Microbiology, 48, 3893- 3898. http://dx.doi.org/10.1128/JCM.00396-10
[14] Scorpio, A. and Zhang, Y. (1996) Mutations in pncA, a Gene Encoding Pyrazinamidase/ Nicotinamidase, Cause Resistance to the Antituberculous Drug Pyrazinamide in Tubercle Bacillus. Nature Medicine, 2, 662-667. http://dx.doi.org/10.1038/nm0696-662
[15] Jonmalung, J., Prammananan, T., Leechawengwongs, M. and Chaiprasert, A. (2010) Sur-veillance of Pyrazinamide Susceptibility among Multidrug-Resistant Mycobacterium tu-berculosis Isolates from Siriraj Hospital, Thailand. BMC Microbiology, 10, 223. http://dx.doi.org/10.1186/1471-2180-10-223
[16] Minime-Lingoupou, F., Pierre-Audigier, C., Kassa-Kelembho, E., Barilone, N., Zandanga, G., Rauzier, J., et al. (2010) Rapid Identification of Multidrug-Resistant Tuberculosis Iso-lates in Treatment Failure or Relapse Patients in Bangui, Central African Republic. Interna-tional Journal of Tuberculosis and Lung Disease, 14, 782-785.
[17] Louw, G.E., Warren, R.M., Donald, P.R., Murray, M.B., Bosman, M., Van Helden, P.D., et al. (2006) Frequency and Implications of Pyrazinamide Resistance in Managing Previously Treated Tuberculosis Patients. International Journal of Tuberculosis and Lung Disease, 10, 802-807.
[18] Ando, H., Mitarai, S., Kondo, Y., Suetake, T., Sekiguchi, J.I., Kato, S., et al. (2010) Pyrazi-namide Resistance in Multidrug-Resistant Mycobacterium tuberculosis Isolates in Japan. Clinical Microbiology and Infection, 16, 1164-1168. http://dx.doi.org/10.1111/j.1469-0691.2009.03078.x
[19] Chiu, Y.C., Huang, S.F., Yu, K.W., Lee, Y.C., Feng, J.Y. and Su, W.J. (2011) Characteristics of pncA Mutations in Multidrug-Resistant Tuberculosis in Taiwan. BMC Infectious Dis-eases, 11, 240.
[20] Rao, N.A., Irfan, M., Soomro, M.M. and Mehfooz, Z. (2010) Drug Resistance Pattern in Multidrug Resistance Pulmonary Tuberculosis Patients. Journal of the College of Physicians and Surgeons Pakistan, 20, 262-265.
[21] Kim, H.J., Kwak, H.K., Lee, J., Yun, Y.J., Lee, J.S., Lee, M.S., et al. (2012) Patterns of pncA Mutations in Drug-Resistant Mycobacterium tuberculosis Isolated from Patients in South Korea. International Journal of Tuberculosis and Lung Disease, 16, 98-103. http://dx.doi.org/10.5588/ijtld.10.0739
[22] Shenai, S., Rodrigues, C., Sadani, M., Sukhadia, N. and Mehta, A. (2009) Comparison of Phenotypic and Genotypic Methods for Pyrazinamide Susceptibility Testing. Indian Journal of Tuberculosis, 56, 82-90.
[23] Zhang, Y., Chiu Chang, K., Leung, C., Wai Yew, W., Gicquel, B., Fallows, D., et al. (2012) “ZS-MDR-TB” versus “ZR-MDR-TB”: Improving Treatment of MDR-TB by Identifying Pyrazinamide Susceptibility. Emerging Microbes & Infections, 1, e5. http://dx.doi.org/10.1038/emi.2012.18
[24] Nagai, Y., Iwade, Y., Hayakawa, E., Nakano, M., Sakai, T., Mitarai, S., et al. (2013) High Resolution Melting Curve Assay for Rapid Detection of Drug-Resistant Mycobacterium tu-berculosis. Journal of Infection and Chemotherapy, 19, 1116-1125. http://dx.doi.org/10.1007/s10156-013-0636-3
[25] Hong, C.Y., Wang, F. and Liu, X.L. (2013) Detection of pncA Mutation Associated with Pyrazinamide Resistance in Mycobacterium tuberculosis by High-Resolution Melting Curve Analysis. Chinese Journal of Tuberculosis and Respiratory Diseases, 36, 198-201.
[26] Pholwat, S., Stroup, S., Gratz, J., Trangan, V., Foongladda, S., Kumburu, H., et al. (2014)

F. Osman et al.
171
Pyrazinamide Susceptibility Testing of Mycobacterium tuberculosis by High Resolution Melt Analysis. Tuberculosis, 94, 20-25. http://dx.doi.org/10.1016/j.tube.2013.10.006
[27] Bishop, K.S., Blumberg, L., Trollip, A.P., Smith, A.N., Roux, L., York, D.F., et al. (2001) Characterisation of the pncA Gene in Mycobacterium tuberculosis Isolates from Gauteng, South Africa. International Journal of Tuberculosis and Lung Disease, 5, 952-957.
[28] Huang, T.S., Lee, S.S., Tu, H.Z., Huang, W.K., Chen, Y.S., Huang, C.K., et al. (2003) Corre-lation between Pyrazinamide Activity and pncA Mutations in Mycobacterium tuberculosis Isolates in Taiwan. Antimicrobial Agents and Chemotherapy, 47, 3672-3673. http://dx.doi.org/10.1128/AAC.47.11.3672-3673.2003
[29] Miyagi, C., Yamane, N., Yogesh, B., Ano, H. and Takashima, T. (2004) Genetic and Pheno-typic Characterization of Pyrazinamide-Resistant Mycobacterium tuberculosis Complex Isolates in Japan. Diagnostic Microbiology and Infectious Disease, 48, 111-116. http://dx.doi.org/10.1016/j.diagmicrobio.2003.09.013
[30] Rodrigues Vde, F., Telles, M.A., Ribeiro, M.O., Cafrune, P.I., Rossetti, M.L. and Zaha, A. (2005) Characterization of pncA Mutations in Pyrazinamide-Resistant Mycobacterium tu-berculosis in Brazil. Antimicrobial Agents and Chemotherapy, 49, 444-446. http://dx.doi.org/10.1128/AAC.49.1.444-446.2005
[31] Chan, R.C.Y., Hui, M., Chan, E.W.C., Au, T.K., Chin, M.L., Yip, C.K., et al. (2007) Genetic and Phenotypic Characterization of Drug-Resistant Mycobacterium tuberculosis Isolates in Hong Kong. Journal of Antimicrobial Chemotherapy, 59, 866-873. http://dx.doi.org/10.1093/jac/dkm054
[32] Pandey, S., Newton, S., Upton, A., Roberts, S. and Drinković, D. (2009) Characterisation of pncA Mutations in Clinical Mycobacterium tuberculosis Isolates in New Zealand. Pathol-ogy, 41, 582-584. http://dx.doi.org/10.1080/00313020903071587
[33] Hou, L., Osei-Hyiaman, D., Zhang, Z., Wang, B., Yang, A. and Kano, K. (2000) Molecular Characterization of pncA Gene Mutations in Mycobacterium tuberculosis Clinical Isolates from China. Epidemiology and Infection, 124, 227-232. http://dx.doi.org/10.1017/S0950268899003635
[34] Mphahlele, M., Syre, H., Valvatne, H., Stavrum, R., Mannsåker, T., Muthivhi, T., et al. (2008) Pyrazinamide Resistance among South African Multidrug-Resistant Mycobacterium tuberculosis Isolates. Journal of Clinical Microbiology, 46, 3459-3464. http://dx.doi.org/10.1128/JCM.00973-08
[35] Hirano, K., Takahashi, M., Kazumi, Y., Fukasawa, Y. and Abe, C. (1997) Mutation in pncA Is a Major Mechanism of Pyrazinamide Resistance in Mycobacterium tuberculosis. Tuber-cle and Lung Disease, 78, 117-122. http://dx.doi.org/10.1016/S0962-8479(98)80004-X
[36] Lee, K.W., Lee, J.M. and Jung, K.S. (2001) Characterization of pncA Mutations of Pyrazi-namide-Resistant Mycobacterium tuberculosis in Korea. Journal of Korean Medical Sci-ence, 16, 537-543. http://dx.doi.org/10.3346/jkms.2001.16.5.537
[37] Doustdar, F., Khosravi, A.D. and Farnia, P. (2009) Mycobacterium tuberculosis Genotypic Diversity in Pyrazinamide-Resistant Isolates of Iran. Microbial Drug Resistance, 15, 251- 256. http://dx.doi.org/10.1089/mdr.2009.0066
[38] Hillemann, D., Rusch-Gerdes, S. and Richter, E. (2007) Evaluation of the GenoType MTBDRplus Assay for Rifampin and Isoniazid Susceptibility Testing of Mycobacterium tuberculosis Strains and Clinical Specimens. Journal of Clinical Microbiology, 45, 2635- 2640. http://dx.doi.org/10.1128/JCM.00521-07
[39] Shi, W., Zhang, X., Jiang, X., Yuan, H., Lee, J.S., Barry, C.E., et al. (2011) Pyrazinamide In-hibits Trans-Translation in Mycobacterium tuberculosis. Science, 333, 1630-1632.

F. Osman et al.
172
http://dx.doi.org/10.1126/science.1208813
[40] Tan, Y., Hu, Z., Zhang, T., Cai, X., Kuang, H., Liu, Y., et al. (2014) Role of pncA and rpsA Gene Sequencing in Detection of Pyrazinamide Resistance in Mycobacterium tuberculosis Isolates from Southern China. Journal of Clinical Microbiology, 52, 291-297. http://dx.doi.org/10.1128/JCM.01903-13
[41] Bhuju, S., Fonseca, L.D., Marsico, A.G., de Oliveira Vieira, G.B., Sobral, L.F., Stehr, M., et al. (2013) Mycobacterium tuberculosis Isolates from Rio de Janeiro Reveal Unusually Low Correlation between Pyrazinamide Resistance and Mutations in the pncA Gene. Infection Genetics and Evolution, 19, 1-6. http://dx.doi.org/10.1016/j.meegid.2013.06.008
[42] Watcharasamphankul, W., Houpt, E.R. and Foongladda, S. (2013) Rapid Detection of Pyrazinamide Resistant Mycobacterium tuberculosis by High Resolution Melting Curve Analysis. Journal of the Medical Association of Thailand, 96, 1218-1223.
[43] Zhang, Y., Permar, S. and Sun, Z. (2002) Conditions That May Affect the Results of Suscep-tibility Testing of Mycobacterium tuberculosis to Pyrazinamide. Journal of Medical Micro-biology, 51, 42-49. http://dx.doi.org/10.1099/0022-1317-51-1-42
Submit or recommend next manuscript to SCIRP and we will provide best service for you:
Accepting pre-submission inquiries through Email, Facebook, LinkedIn, Twitter, etc. A wide selection of journals (inclusive of 9 subjects, more than 200 journals) Providing 24-hour high-quality service User-friendly online submission system Fair and swift peer-review system Efficient typesetting and proofreading procedure Display of the result of downloads and visits, as well as the number of cited articles Maximum dissemination of your research work
Submit your manuscript at: http://papersubmission.scirp.org/ Or contact [email protected]