High Price of Mandatory Auto Insurance in Predominantly ...
16
High Price of Mandatory Auto Insurance in Predominantly African American Communities November 2015 Tom Feltner, Director of Financial Services Douglas Heller, Consumer Advocate
Transcript of High Price of Mandatory Auto Insurance in Predominantly ...
High Price of Mandatory Auto Insurance in Predominantly African American Communities
November 2015
Tom Feltner, Director of Financial Services
Douglas Heller, Consumer Advocate
High Price of Mandatory Auto Insurance in Predominately African American Communities
Consumer Federation of America | Page 2
Introduction
All states except New Hampshire require drivers to purchase auto insurance, and the importance of
automobile ownership for most Americans adds a special responsibility to ensure fairness in the
auto insurance marketplace.1 In previous analyses, the Consumer Federation of America (CFA) has
investigated the affordability of auto insurance and researched pricing practices in the auto
insurance market. That work identified the effect of the widespread use of non-driving rating
factors used to set premiums, including the use of socio-economic characteristics such as level of
education, occupation and others that unfairly discriminate against low- and moderate-income
good drivers.
For this report, CFA looked at premium data from the five largest auto insurers for a single good
driver profile in most ZIP codes throughout the country and examined average premiums in
predominantly African American communities and predominantly white communities controlling
for income and population density. The results of this analysis suggest that, on average, a good
driver in a predominantly African American community will pay considerably more for state-
mandated auto insurance coverage than a similarly situated driver in a predominantly white
community.
In order to address the concern that different communities have different auto insurance risks by
virtue of the type of driving typical of its residents (for example, high-speed open roads in rural
communities or bumper-to-bumper traffic in densely populated urban areas), this analysis also
considers auto insurance premiums by racial composition of the ZIP code controlling for population
density and income.
While the insurance industry has, at times, been dismissive of concerns about the high price of auto
insurance in underserved communities and for people of color,2 we do not seek to assess or impugn
the intentions of insurance companies with this report. We believe, instead, that it would be more
productive to focus on the impact of high auto insurance prices and the implications these findings
should have for industry, regulators, and policymakers.
1 The requirement that drivers in every state but New Hampshire purchase auto insurance is compounded as an issue of social
concern because of the strong relationship between access to a car and employment rates, hours worked, and earnings. See, for
example: Charles L. Baum, “The Effects of Vehicle Ownership on Employment,” Journal of Urban Economics,” v. 66, n. 2,
151-163. Evelyn Blumenberg and Margy Waller, “The Long Journey to Work: A Federal Transportation Policy for Working
Families,” Center on Urban and Metropolitan Policy, Brookings Institute (July 20003).
2 For example, in 2014 the National Association of Mutual Insurance Companies, the nation's largest insurance trade association,
illustrated this dismissive perspective in a letter to the Federal Insurance Office (FIO): "...data reveal that households in the two
lowest quintiles spent nearly as much on alcohol and tobacco products combined as on automobile insurance, and that they
spent more on audio and visual (A/V) equipment and services than on automobile insurance..." and "...we would submit that the
percentage of household income spent by minority consumers on automobile insurance appears to be reasonable relative to the
percentage of income spent on non-essential goods" identified in the letter as tobacco products, alcoholic beverages, audio and
visual equipment and services, and pets, toys and hobbies. Separately, in its 2014 letter to FIO, the Financial Services
Roundtable wrote: "FSR believes that 'traditionally underserved communities' is basically impossible to define when place [sic]
in the context of the auto insurance market, as essentially every community has access to a wide range of insurance coverage
and pricing options."

High Price of Mandatory Auto Insurance in Predominately African American Communities
Consumer Federation of America | Page 3
Summary of Findings
Across the country, the price of state-mandated, minimum-limits auto insurance offered to a good
driver increases where the proportion of African Americans living in a community increases.
Among the findings:
In communities where more than three quarters of the residents are African American,
premiums average 70 percent higher than in those with populations that are less than one
quarter African American ($1,060 vs. $622).
In the densest urban communities, the average premium in predominantly African American
ZIP codes is 60 percent higher than the average premium in equally dense predominantly white
urban ZIP codes ($1,797 vs. $1,126).
In rural ZIP codes, the average premium in predominantly African American ZIP codes is 23
percent more than the average premium in rural, predominantly white ZIP codes ($669 vs.
$542).
The average premium in upper middle-income, predominantly African American ZIP codes is
194 percent higher than the average premium charged to a similarly situated driver in an upper
middle-income, predominantly white ZIP code ($2,113 vs. $717).
Across the country, Progressive's and Farmers Insurance's good driver premiums show the
most disparity between predominantly African American ZIP codes and predominantly white
ZIP codes, with both companies averaging 92 percent. State Farm, Allstate and GEICO also
charge substantially more—62, 56, and 52 percent respectively.
In several metropolitan regions around the country, including the Baltimore, New York,
Louisville, Washington, DC, Detroit, Boston, and Orlando metropolitan regions, the disparity of
premiums is more than 50 percent between predominantly African American and
predominantly white ZIP codes.

High Price of Mandatory Auto Insurance in Predominately African American Communities
Consumer Federation of America | Page 4
Data and Methodology
Prior Research
CFA has used two methods for determining the cost of auto insurance for lower-income people and
the impact of non-driving rating factors on insurance premiums: collecting and analyzing data from
insurers’ websites and acquiring data from a third-party vendor.
In previous reports, CFA collected premium quotes from individual companies' websites to assess
the impact of various rating factors on the price of auto insurance. Using this method, previous
research found, for example, that several major insurers charge significantly higher premiums to
drivers with only a high school diploma than to those drivers with higher levels of education, such
as a master’s degree.3 Previous research also found that in many states, some major insurers
provide no discount, or only a minimal discount, to low-mileage drivers, despite the actuarial
evidence that annual mileage strongly correlates with risk of loss.4
In 2014, CFA used a comprehensive dataset of auto insurance quotes for a typical moderate-income
good driver acquired from Quadrant Information Services to evaluate the availability and
accessibility of state-mandated auto insurance in lower income communities in the 50 largest
metro areas. The report found that in approximately a third of lower-income ZIP codes none of the
largest insurers offered a basic policy for less than $500.5 A previous analysis of these data found
that good drivers with low credit scores are charged as much as 123 percent more than drivers
with high credit scores, controlling for all other factors including driving record.6
In addition to reviewing data about premiums quoted by insurance companies to a typical good
driver, CFA has commissioned public opinion research on affordability of auto insurance. A
national survey conducted by ORC International in fall 2013 found that 76 percent of Americans
believe that state required minimum coverage auto insurance policy should cost no more than
$500. While there may be some debate as to what the precise measure of auto insurance
affordability should be, this polling provides important insight into the public's view of what
3 Brobeck, Stephen. “Use of Education, Occupation, and Other Non-Driving Factors Inflate Premiums for Low- and Moderate-
Income Drivers.” Washington, DC: Consumer Federation of America, September 24, 2012.
http://consumerfed.org/pdfs/PR.AutoInsuranceRateFactorRelease.9.24.12.pdf.
4 Brobeck, Stephen, and Michelle Styczynski. “Auto Insurers Fail to Reward Low Mileage Drivers.” Washington, DC, May 21,
2015. http://consumerfed.org/news/902.
5 Feltner, Tom, Stephen Brobeck, and J. Robert Hunter. “The High Price of Mandatory Auto Insurance for Lower Income
Households: Premium Price Data for 50 Urban Regions.” Washington, DC: Consumer Federation of America, September 2014.
http://consumerfed.org/pdfs/140929_highpriceofmandatoryautoinsurance_cfa.pdf.
6 Brobeck, Stephen, J. Robert Hunter, and Tom Feltner. “The Use of Credit Scores by Auto Insurers: Adverse Impacts on Low-
and Moderate-Income Drivers.” Consumer Federation of America, December 2013.
http://www.consumerfed.org/pdfs/useofcreditscoresbyautoinsurers_dec2013_cfa.pdf.
High Price of Mandatory Auto Insurance in Predominately African American Communities
Consumer Federation of America | Page 5
consumers should have to spend on a product they are required to buy in order to comply with
state insurance requirements and avoid fines and other penalties.
Prior to the analysis presented here, CFA had not assessed how the differences in average ZIP code
premiums vary by neighborhood racial composition. Other researchers, however, have previously
addressed the issue of race and redlining in relation to auto insurance. For example, Ong and Stoll
concluded that “automobile insurance rates are higher in low-income and minority neighborhoods
because of both direct and indirect effects…This story is truer for residents in predominantly black
neighborhoods. Residents in African American neighborhoods pay more, all things being equal.”7
About the insurance premiums used in this report
To examine the difference in minimum liability premiums in predominantly white and pre-
dominantly African American communities, CFA acquired January 2014 premium data provided by
major private passenger auto insurance groups in each state. These data include premiums for five
of the largest companies by national market share – Allstate, Farmers, GEICO, Progressive, and State
Farm, which represent 53.2 percent of the market.8 The data were purchased from Quadrant
Information Services, a third party data vendor that compiles property and casualty insurance rate
sets and conducts market pricing analyses.
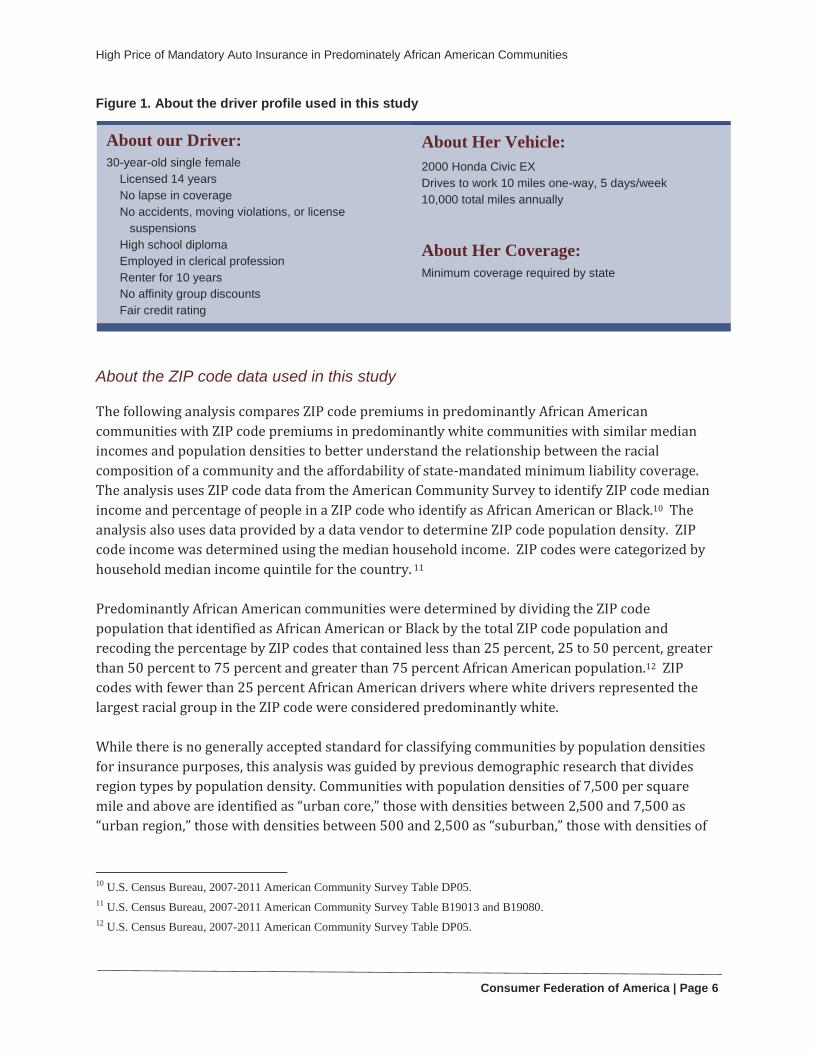
Premiums were based on a single driver profile and represent rates quoted to an unmarried
woman with a good driving history, who has graduated from high school, holds a clerical job, and
rents her home (a complete list of rating factors held constant is available in Figure 1). Although
premiums often vary as these factors change, for the purposes of analysis, it is our view that the
good driver profile used here can serve as representative of a moderate-income driver. Based on
previous CFA research, a driver’s insurance score based on credit reporting information results in
considerable variation in premium price. Prices in nine cities, that research found, increased an
average of 127 percent moving from the best insurance score to the worst insurance score.9 For the
following analysis, CFA used a fair insurance score – the middle category of a ten-category range
provided by Quadrant Information Services.
7 Ong, P.M., and M.A. Stoll. “Redlining or Risk? A Spatial Analysis of Auto Insurance Rates in Los Angeles.” Journal of Policy
Analysis and Management 26, no. 4 (2007): 827. doi:10.1002/pam.20287.
8 “Property and Casualty Insurance Industry 2014 Top 25 Groups and Companies by Countrywide Premium.” Washington, D.C.:
National Association of Insurance Commissioners, April 6, 2015.
http://www.naic.org/documents/web_market_share_150302_2014_property_lob.pdf.
9 Brobeck, Stephen, J. Robert Hunter, and Thomas Feltner. “The Use of Credit Scores by Auto Insurers: Adverse Impacts on
Low- and Moderate-Income Drivers.” Washington, DC: Consumer Federation of America, December
2013.http://www.consumerfed.org/pdfs/useofcreditscoresbyautoinsurers_dec2013_cfa.pdf.
High Price of Mandatory Auto Insurance in Predominately African American Communities
Consumer Federation of America | Page 6
Figure 1. About the driver profile used in this study
About the ZIP code data used in this study
The following analysis compares ZIP code premiums in predominantly African American
communities with ZIP code premiums in predominantly white communities with similar median
incomes and population densities to better understand the relationship between the racial
composition of a community and the affordability of state-mandated minimum liability coverage.
The analysis uses ZIP code data from the American Community Survey to identify ZIP code median
income and percentage of people in a ZIP code who identify as African American or Black.10 The
analysis also uses data provided by a data vendor to determine ZIP code population density. ZIP
code income was determined using the median household income. ZIP codes were categorized by
household median income quintile for the country. 11
Predominantly African American communities were determined by dividing the ZIP code
population that identified as African American or Black by the total ZIP code population and
recoding the percentage by ZIP codes that contained less than 25 percent, 25 to 50 percent, greater
than 50 percent to 75 percent and greater than 75 percent African American population.12 ZIP
codes with fewer than 25 percent African American drivers where white drivers represented the
largest racial group in the ZIP code were considered predominantly white.
While there is no generally accepted standard for classifying communities by population densities
for insurance purposes, this analysis was guided by previous demographic research that divides
region types by population density. Communities with population densities of 7,500 per square
mile and above are identified as “urban core,” those with densities between 2,500 and 7,500 as
“urban region,” those with densities between 500 and 2,500 as “suburban,” those with densities of
10 U.S. Census Bureau, 2007-2011 American Community Survey Table DP05.
11 U.S. Census Bureau, 2007-2011 American Community Survey Table B19013 and B19080.
12 U.S. Census Bureau, 2007-2011 American Community Survey Table DP05.
About our Driver:
30-year-old single female
Licensed 14 years
No lapse in coverage
No accidents, moving violations, or license
suspensions
High school diploma
Employed in clerical profession
Renter for 10 years
No affinity group discounts
Fair credit rating
About Her Vehicle:
2000 Honda Civic EX
Drives to work 10 miles one-way, 5 days/week
10,000 total miles annually
About Her Coverage:
Minimum coverage required by state
High Price of Mandatory Auto Insurance in Predominately African American Communities
Consumer Federation of America | Page 7
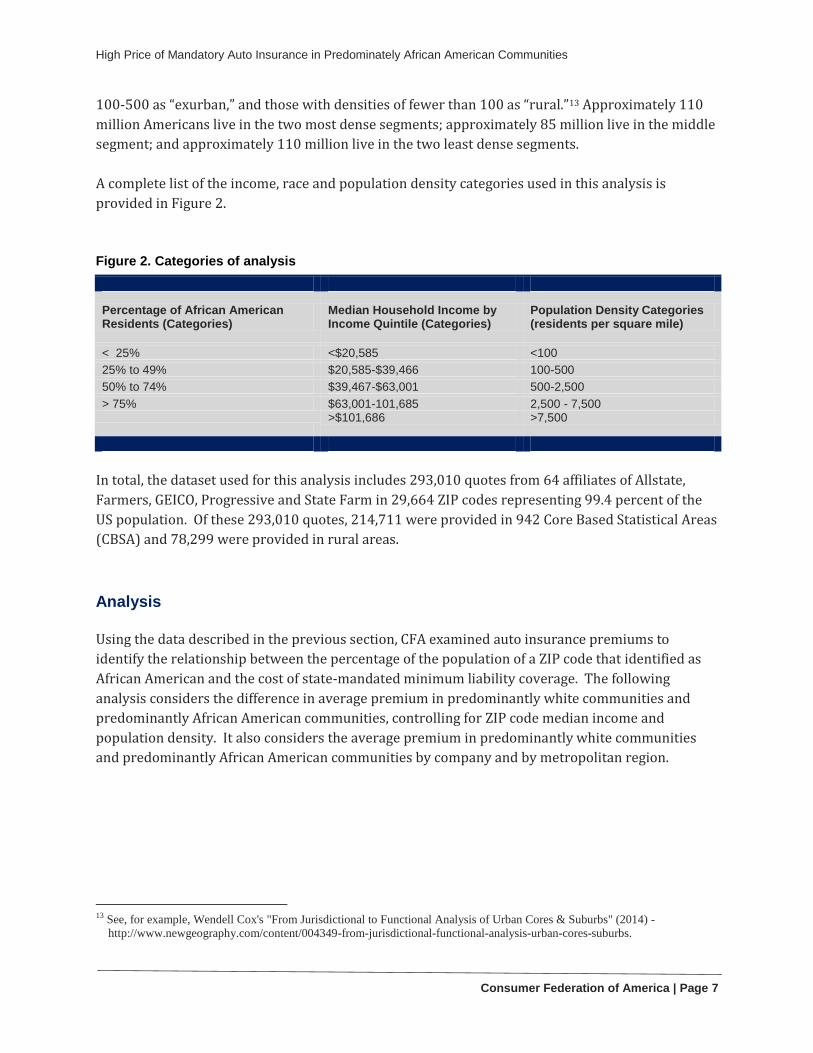
100-500 as “exurban,” and those with densities of fewer than 100 as “rural.”13 Approximately 110
million Americans live in the two most dense segments; approximately 85 million live in the middle
segment; and approximately 110 million live in the two least dense segments.
A complete list of the income, race and population density categories used in this analysis is
provided in Figure 2.
Figure 2. Categories of analysis
Percentage of African American Residents (Categories)
Median Household Income by Income Quintile (Categories)
Population Density Categories (residents per square mile)
< 25% <$20,585 <100
25% to 49% $20,585-$39,466 100-500
50% to 74% $39,467-$63,001 500-2,500
> 75% $63,001-101,685 2,500 - 7,500
>$101,686 >7,500
In total, the dataset used for this analysis includes 293,010 quotes from 64 affiliates of Allstate,
Farmers, GEICO, Progressive and State Farm in 29,664 ZIP codes representing 99.4 percent of the
US population. Of these 293,010 quotes, 214,711 were provided in 942 Core Based Statistical Areas
(CBSA) and 78,299 were provided in rural areas.
Analysis
Using the data described in the previous section, CFA examined auto insurance premiums to
identify the relationship between the percentage of the population of a ZIP code that identified as
African American and the cost of state-mandated minimum liability coverage. The following
analysis considers the difference in average premium in predominantly white communities and
predominantly African American communities, controlling for ZIP code median income and
population density. It also considers the average premium in predominantly white communities
and predominantly African American communities by company and by metropolitan region.
13 See, for example, Wendell Cox's "From Jurisdictional to Functional Analysis of Urban Cores & Suburbs" (2014) -
http://www.newgeography.com/content/004349-from-jurisdictional-functional-analysis-urban-cores-suburbs.
High Price of Mandatory Auto Insurance in Predominately African American Communities
Consumer Federation of America | Page 8
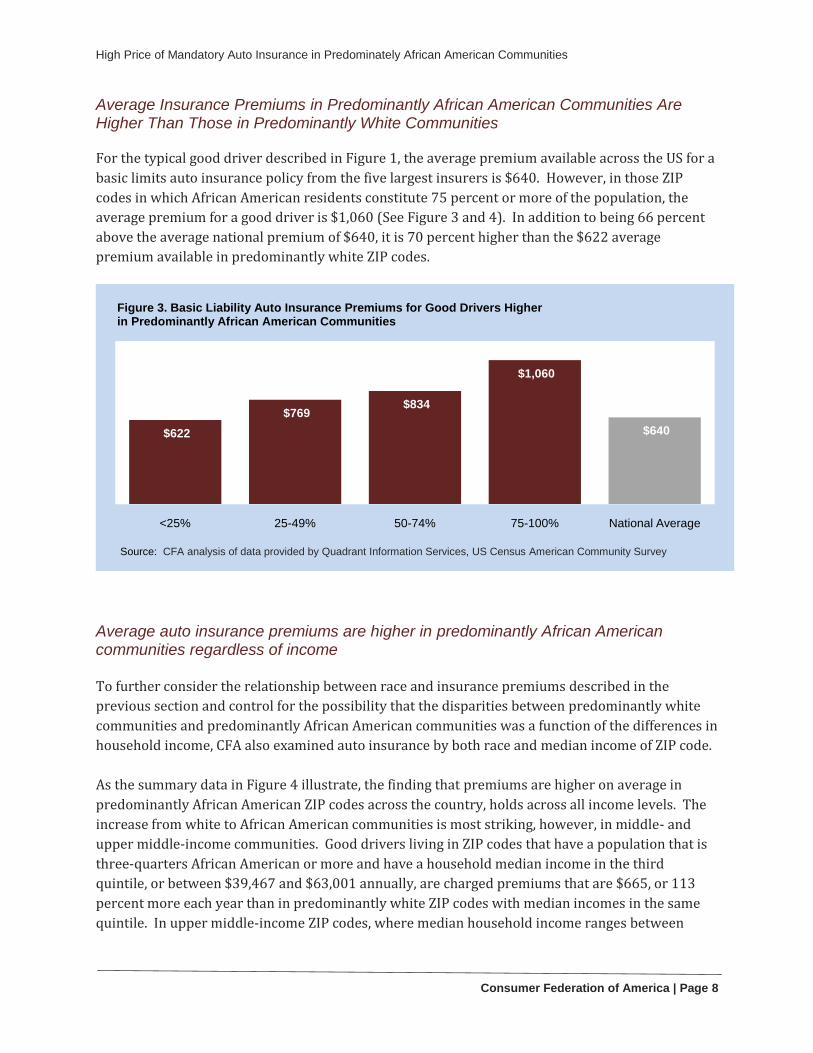
Average Insurance Premiums in Predominantly African American Communities Are Higher Than Those in Predominantly White Communities
For the typical good driver described in Figure 1, the average premium available across the US for a
basic limits auto insurance policy from the five largest insurers is $640. However, in those ZIP
codes in which African American residents constitute 75 percent or more of the population, the
average premium for a good driver is $1,060 (See Figure 3 and 4). In addition to being 66 percent
above the average national premium of $640, it is 70 percent higher than the $622 average
premium available in predominantly white ZIP codes.
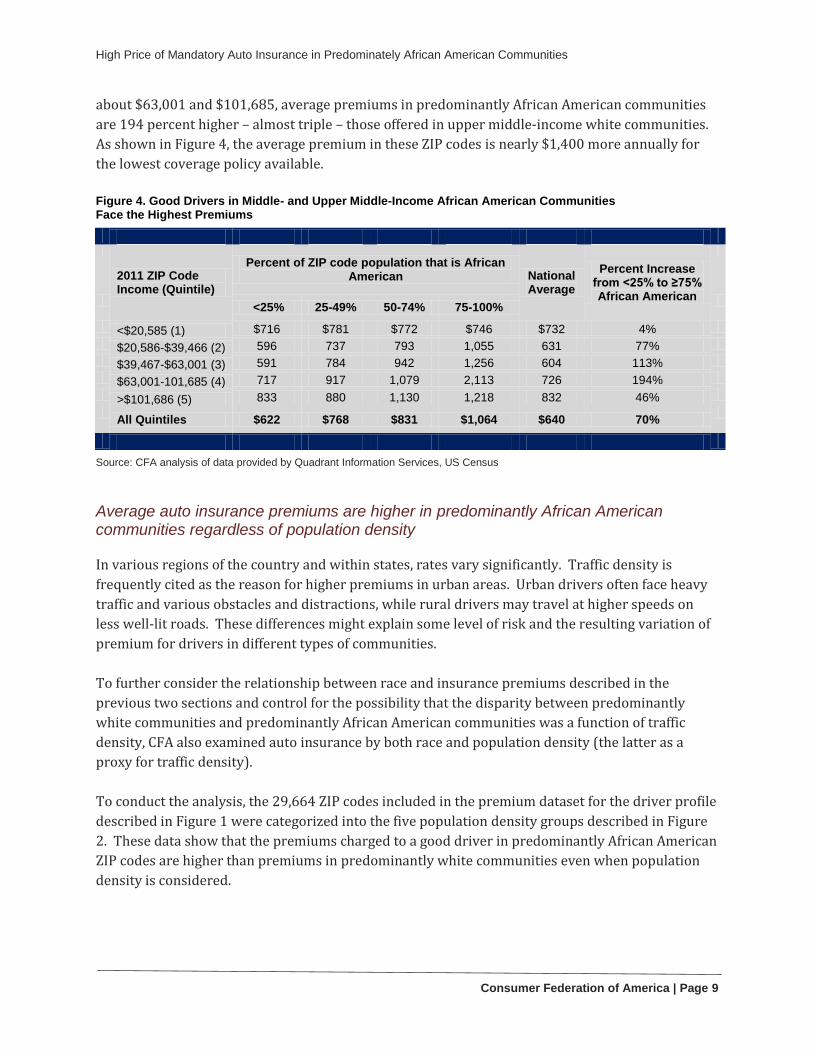
Average auto insurance premiums are higher in predominantly African American communities regardless of income To further consider the relationship between race and insurance premiums described in the
previous section and control for the possibility that the disparities between predominantly white
communities and predominantly African American communities was a function of the differences in
household income, CFA also examined auto insurance by both race and median income of ZIP code.
As the summary data in Figure 4 illustrate, the finding that premiums are higher on average in
predominantly African American ZIP codes across the country, holds across all income levels. The
increase from white to African American communities is most striking, however, in middle- and
upper middle-income communities. Good drivers living in ZIP codes that have a population that is
three-quarters African American or more and have a household median income in the third
quintile, or between $39,467 and $63,001 annually, are charged premiums that are $665, or 113
percent more each year than in predominantly white ZIP codes with median incomes in the same
quintile. In upper middle-income ZIP codes, where median household income ranges between
$622
$769 $834
$1,060
$640
<25% 25-49% 50-74% 75-100% National Average
Figure 3. Basic Liability Auto Insurance Premiums for Good Drivers Higher in Predominantly African American Communities
Source: CFA analysis of data provided by Quadrant Information Services, US Census American Community Survey
High Price of Mandatory Auto Insurance in Predominately African American Communities
Consumer Federation of America | Page 9
about $63,001 and $101,685, average premiums in predominantly African American communities
are 194 percent higher – almost triple – those offered in upper middle-income white communities.
As shown in Figure 4, the average premium in these ZIP codes is nearly $1,400 more annually for
the lowest coverage policy available.
Figure 4. Good Drivers in Middle- and Upper Middle-Income African American Communities Face the Highest Premiums
2011 ZIP Code Income (Quintile)
Percent of ZIP code population that is African American National
Average
Percent Increase from <25% to ≥75% African American
<25% 25-49% 50-74% 75-100%
<$20,585 (1) $716 $781 $772 $746 $732 4%
$20,586-$39,466 (2) 596 737 793 1,055 631 77%
$39,467-$63,001 (3) 591 784 942 1,256 604 113%
$63,001-101,685 (4) 717 917 1,079 2,113 726 194%
>$101,686 (5) 833 880 1,130 1,218 832 46%
All Quintiles $622 $768 $831 $1,064 $640 70%
Source: CFA analysis of data provided by Quadrant Information Services, US Census
Average auto insurance premiums are higher in predominantly African American communities regardless of population density
In various regions of the country and within states, rates vary significantly. Traffic density is
frequently cited as the reason for higher premiums in urban areas. Urban drivers often face heavy
traffic and various obstacles and distractions, while rural drivers may travel at higher speeds on
less well-lit roads. These differences might explain some level of risk and the resulting variation of
premium for drivers in different types of communities.
To further consider the relationship between race and insurance premiums described in the
previous two sections and control for the possibility that the disparity between predominantly
white communities and predominantly African American communities was a function of traffic
density, CFA also examined auto insurance by both race and population density (the latter as a
proxy for traffic density).
To conduct the analysis, the 29,664 ZIP codes included in the premium dataset for the driver profile
described in Figure 1 were categorized into the five population density groups described in Figure
2. These data show that the premiums charged to a good driver in predominantly African American
ZIP codes are higher than premiums in predominantly white communities even when population
density is considered.

High Price of Mandatory Auto Insurance in Predominately African American Communities
Consumer Federation of America | Page 10
Irrespective of population density, drivers in predominantly African American ZIP codes paid, on
average, higher premiums for minimum liability coverage (Figure 5-1). Drivers in the most dense,
predominantly African American ZIP codes had an average premium 60 percent higher than
similarly situated drivers in predominantly white ZIP codes, and drivers living in predominantly
African American rural ZIP codes faced an average premium 23 percent higher than those living in
predominantly white rural ZIP codes (Figure 2).
Figure 5-1. Average Premium by Population Density and Percentage of African American Residents
2011 ZIP Code Population Density
<25% African
American
25-49% African
American
50%-75% African
American
>75% African
American
National Average
Percent Increase from <25% to ≥75% African American
Most Dense $1,126 $1,481 $1,684 $1,797 $1,269 60%
More Dense 818 899 940 1,089 845 33%
Moderately Dense 715 742 785 828 722 16%
Less Dense 636 674 784 733 639 15%
Least Dense 542 624 645 669 547 23%
All ZIP codes $622 $769 $834 $1,060 $640 70%
Source: CFA analysis of data provided by Quadrant Information Services, US Census
$1,126
$1,481
$1,684$1,797
$1,269
<25% African American
25-49% African American
50%-75% African American
>75% African American
National Average
Figure 5-2. Good driver auto insurance rates are $666 higher in predominantly African American urban core communities (>7,500 people per square mile) than in similar communities with fewer African Americans
Source: CFA analysis of data provided by Quadrant Information Services, US Census

High Price of Mandatory Auto Insurance in Predominately African American Communities
Consumer Federation of America | Page 11
Premiums are higher in African American communities at all of the five largest insurers
In addition to higher premiums regardless of ZIP code median income or population density,
drivers in predominantly African American ZIP codes had higher average minimum liability
premiums regardless of company. Among the five largest insurers, Progressive and Farmers
Insurance both had average premiums that were 92 percent higher in predominantly African
American ZIP codes than predominantly white ZIP codes. This represents a $638 annual difference
for Progressive's customers and $609 difference for Farmers Insurance's customers for only the
basic liability coverage required by each state (Figure 6-1).
All five companies had average premiums that are at least 50 percent higher in predominantly
African American ZIP codes than in those with few African American residents. GEICO, Allstate, and
State Farm had average premiums that were 53 percent, 56 percent, and 63 percent higher,
respectively, on average (Figure 6-2).
Figure 6-1. Average Premium by Company and Percentage of African American Residents
Company <25%
African American
25-49% African
American
50-75% African
American
≥75% African
American
National Average
Percent Increase from <25% to ≥75% African American
Allstate $658 $800 $848 $1,024 $674 56%
Farmers 662 757 795 1,271 676 92%
GEICO 575 713 793 876 591 53%
Progressive 694 852 911 1,332 717 93%
State Farm 543 697 771 882 561 63%
Top Five Companies $622 $769 $834 $1,060 $640 70%
Source: CFA analysis of data provided by Quadrant Information Services, US Census

High Price of Mandatory Auto Insurance in Predominately African American Communities
Consumer Federation of America | Page 12
Premiums in African American communities by metropolitan region
CFA also reviewed average rates in the 942 CBSAs included in the dataset and identified the 30
CBSAs with the largest differences in average premium between predominantly white communities
and predominantly African American communities.
Average premiums in predominantly African American ZIP codes in the Baltimore-Towson, MD
CBSA were nearly double, or 94 percent higher than, the average premiums in its predominantly
white communities, and average premiums were 83 percent higher in the New York metro area and
75 percent higher in the Louisville metro area. Other metro areas in the top 10 areas with the
highest differences in auto rates between predominately white and predominately African
American communities are Washington-Arlington-Alexandria (+69 percent), Detroit-Warren-
Livonia, MI (+60 percent), Boston-Cambridge-Quincy, MA-NH(+51 percent), Orlando-Kissimmee-
Sanford, FL (+52 percent), St. Louis, MO-IL (+46 percent), Hartford-West Hartford-East Hartford, CT
(+42 percent) and Flint, MI (+41 percent). The complete results are included in Figure 7.
52% 56%63%
71%
92% 92%
GEICO Allstate State Farm Average of Top Five Companies
Farmers Progressive
Source: CFA analysis of data provided by Quadrant Information Services, US Census
Figure 6-2. Average Premium increase by Company in Predominantly African American Communities Compared with Predominantly White Communities

High Price of Mandatory Auto Insurance in Predominately African American Communities
Consumer Federation of America | Page 13
Figure 7. CBSAs with the 30 Largest Percent Increases in Average Premiums from Predominantly White Communities to Predominantly African American Communities
CBSA <25%
African American
≥75% African
American
CBSA Average
Percent Increase from <25% to ≥75%
African American
2011 Population
Population Rank
Baltimore-Towson, MD $1,035 $2,012 $1,172 94% 2,697,421 20
New York-N. New Jersey-Long Island, NY-NJ-PA 1,444 2,647 1,559 83% 18,796,078 1
Louisville/Jefferson County, KY-IN 804 1,406 847 75% 1,273,988 42
Washington-Arlington-Alexandria, DC-VA-MD-WV 733 1,241 825 69% 5,503,801 8
Detroit-Warren-Livonia, MI 1,897 3,040 2,076 60% 4,320,982 11
Orlando-Kissimmee-Sanford, FL 1,063 1,615 1,103 52% 2,113,650 26
Boston-Cambridge-Quincy, MA-NH 571 860 575 51% 4,521,737 10
St. Louis, MO-IL 544 792 582 46% 2,801,982 18
Hartford-West Hartford-East Hartford, CT 922 1,306 935 42% 1,207,636 45
Flint, MI 1,692 2,386 1,767 41% 429,272 114
Kansas City, MO-KS 519 718 534 38% 2,018,661 29
Milwaukee-Waukesha-West Allis, WI 466 610 486 31% 1,547,501 39
Philadelphia-Camden-Wilmington, PA-NJ-DE-MD 889 1,158 932 30% 5,938,918 5
Buffalo-Niagara Falls, NY 789 1,015 819 29% 1,135,750 47
Toledo, OH 417 536 429 29% 652,484 81
Miami-Fort Lauderdale-Pompano Beach, FL 1,796 2,271 1,878 26% 5,526,089 7
Atlanta-Sandy Springs-Marietta, GA 751 945 791 26% 5,213,854 9
New Orleans-Metairie-Kenner, LA 993 1,235 1,063 24% 1,139,643 46
Chicago-Joliet-Naperville, IL-IN-WI 518 639 534 23% 9,425,706 3
Richmond, VA 537 659 537 23% 1,248,271 43
Columbus, OH 430 520 439 21% 1,819,568 31
Hilton Head Island-Beaufort, SC 722 859 747 19% 183,243 226
Jacksonville, FL 940 1,108 972 18% 1,334,688 40
Virginia Beach-Norfolk-Newport News, VA-NC 510 595 535 17% 1,666,758 36
Cleveland-Elyria-Mentor, OH 435 507 451 17% 2,080,318 28
Albany, GA 638 741 646 16% 157,632 258
Macon, GA 714 829 736 16% 231,828 190
Augusta-Richmond County, GA-SC 675 781 680 16% 550,420 92
Dallas-Fort Worth-Arlington, TX 675 780 685 16% 6,280,597 4
Los Angeles-Long Beach-Santa Ana, CA 617 711 621 15% 12,777,695 2
National Average $622 $1,060 $640 70%
Source: CFA analysis of data provided by Quadrant Information Services, US Census
High Price of Mandatory Auto Insurance in Predominately African American Communities
Consumer Federation of America | Page 14
Conclusion
Most states prohibit the consideration of a driver’s race or ethnicity when determining premiums.
However, the findings of this report suggest that good drivers living in predominantly African
American communities will pay, on average, 70 percent more for state-mandated minimum
liability-only coverage than a similarly-situated driver in a predominantly white community. After
controlling for both population density (as a proxy for traffic density) and income, we found that
drivers living in predominantly African American communities continued to see higher average
premiums than similarly situated drivers in predominantly white communities.
Recommendations
This analysis does not imply that auto insurance companies deploy explicitly discriminatory
practices, and CFA did not conduct any research aimed at making such a determination. This
analysis assesses impacts not intent, and our findings provide substantial evidence that the pricing
of auto insurance results in good drivers in predominantly African American communities paying
higher prices than similarly situated drivers in predominantly white communities – prices that for
most lower-income drivers would be prohibitively expensive.
1. Regulators need to more seriously address the impact of auto insurance pricing methods on people of color and lower-income drivers. This requires that more attention be paid to the use of non-driving rating factors that, cumulatively, result in higher prices for lower-income good drivers as well as the rating practices that lead to the findings of this report.
State insurance regulators should require all companies to provide a ZIP code pricing
report in which they provide the premium for a good driver (using a standardized profile
such as the one described in Figure 1 above) in every ZIP code in the state. These data
should also include demographic data for each ZIP code to determine if the company's
pricing practices result in consistently higher premiums in communities of color. State
insurance regulators should require companies that identify a pattern of higher insurance
premiums in communities of color to provide further explanation of their pricing
methodologies and plans to address the findings.
The Federal Insurance Office (FIO) should review the affordability and accessibility of
state-mandated minimum liability coverage in low- and moderate-income communities
and communities of color. This review should be based on premium data collected directly
from insurers for a series of driver profiles that are reflective of typical lower-income
drivers and include premiums from both the standard and non-standard markets. FIO

High Price of Mandatory Auto Insurance in Predominately African American Communities
Consumer Federation of America | Page 15
issued a request for information in April of 2014 and a second request for information in
June 2015. We urge the completion of an affordability review in 2016. 14
The National Association of Insurance Commissioners should develop a model data
call that will assist state regulators and legislators in tracking insurance costs for low- and
moderate-income (LMI) drivers and those in traditionally underserved communities,
including communities of color. State insurance commissioners should collect
comprehensive data regarding the amount that drivers are charged for auto insurance.
Since insurers do not generally collect the income of their policyholders, the NAIC should
construct a model data call that will help regulators better understand the premiums
charged to LMI drivers. Such a model would require insurers to provide premiums charged
to drivers with certain socioeconomic characteristics typical of LMI drivers, such as
occupation, education, credit score, ZIP code and homeownership status. Further, the data
call could be used to determine such things as insurers’ market share in LMI communities
and communities of color relative to statewide market share and the actual premiums paid
in these communities. The NAIC is currently developing a data call to determine what
rating factors insurance companies use when setting auto premiums, but it does not solicit
data on the premiums that drivers pay for coverage.
2. State lawmakers should enact legislation to improve data collection and enact needed
reforms.
Lawmakers should enact legislation requiring the collection of data related to pricing of auto insurance in communities of color, especially where state insurance regulators fail to do so.
States should enact legislation that emphasizes drivers' safety records over factors
such as ZIP code and other non-driving related characteristics such as education,
occupation, and credit score. The legislation should limit the rating factors insurers can use
in setting auto insurance rates, including limiting the impact that a driver's ZIP code can
have on his or her rates relative to driving safety record.
States should consider establishing programs that provide minimal liability coverage
to safe lower-income drivers at an affordable price sufficient to fund claims covered by
the program without subsidy. For several years, for example, California has offered this
type of coverage to good lower income drivers for between $213 and $363 a year—a
quarter to a third of the average premium currently charged in an LMI ZIP code.
14 For more information on data collection recommendations please see comments filed in response to the Federal Insurance
Office Request for Information Monitoring Availability and Affordability of Auto Insurance (TREAS-DO-2015-0005) filed by
49 consumer, community and civil rights organizations and available for review at
http://www.consumerfed.org/pdfs/150831_TREAS-DO-2015-0005_FIO_consumercomments.pdf.

High Price of Mandatory Auto Insurance in Predominately African American Communities
Consumer Federation of America | Page 16
States should require insurers to offer drivers with clean driving records the lowest
premium for which they qualify from among the company’s affiliates doing business in
the state. The data set acquired by CFA shows the wide range of premiums charged to the
very same driver by the five largest insurers, including affiliated underwriters within a
single company’s group. Any driver with a good driving record should be offered the
opportunity to purchase coverage from the affiliate that yields the lowest premium for that
coverage. Currently, only California has this “best price” requirement for good drivers.