High Potash Volcanic Rocks and Pyroclastic Deposits of ...
14
Journal of Sciences, Islamic Republic of Iran 28(2): 155 - 168 (2017) http://jsciences.ut.ac.ir University of Tehran, ISSN 1016-1104 155 High Potash Volcanic Rocks and Pyroclastic Deposits of Damavand Volcano, Iran, an Example of Intraplate Volcanism M. Mortazavi * Department of Geology, Faculty of Sciences, University of Hormozgan, P.O.Box 3995, Bandar Abbass, Islamic Republic of Iran Received: 30 November 2015 / Revised: 4 January 2016 / Accepted: 5 September 2016 Abstract Damavand is a fascinating dormant stratovolcano, 60 km to the ENE of Tehran located in the Alborz Mountains. Damavand volcanic products consist of lava flows and pyroclastic fall, flow and surge deposits from different eruption cycles. The volcanic rocks ranges from trachyandesite to trachyadacite and minor basalt. The mineral assemblage consists of potash feldspar (Or43/7), Plagioclase (An25 to An59), amphibole, clinopyroxene (augite and salite), orthopyroxene (hypersthene and ferro-hypersthene), biotite (phologophite) and Fe-Ti oxides. Some of the lavas and pyroclastic deposits show calc-alkaline affinities. Lavas from different cycled are classified as shoshonitic types and most pyroclastic deposits are classified as High-K. In comparison to n-type MORB, three recent pyroclastic deposits in Damavand show an enrichment in LREE, LILE, Th, and P and are slightly depleted in MREE and HREE. Incompatible LILE (Rb, Ba and Sr) together with Th and U have not shown broad enrichment as a function of increasing SiO 2 content. Variations in the Major and trace element compositions of Damavand rocks and pyroclastic deposits are difficult to explain by fractional crystallization mechanism. Scatter of several trace elements in plots against SiO 2 and incompatible trace elements, also suggests that the petrogenesis is more complex than a simple fractionation process from a single composition parent. High K, Ba and Rb content in volcanic products could be due to enrichment of these elements in the source. Field observation such as limitation of magmatism in region suggest that decompression melting could be generate the Damavand Lavas and pyroclastic deposits. Keywords: Damavand Pyroclastics; Damavand Volcano; Damavand lavas. * Corresponding author: Tel:+989173616592; Fax: +987633711027; Email:[email protected], [email protected] Introduction Damavand is a dormant volcano, 60 km to the ENE of Tehran, and is the highest mountain (5670 m) in the Middle East and west Asia. Damavand located in the Alborz Mountains of northern Iran in the Mazandaran Province. Damavand is the largest strata-volcano of the calcalkaline and is an outstanding location to
Transcript of High Potash Volcanic Rocks and Pyroclastic Deposits of ...

Journal of Sciences, Islamic Republic of Iran 28(2): 155 - 168 (2017) http://jsciences.ut.ac.ir University of Tehran, ISSN 1016-1104
155
High Potash Volcanic Rocks and Pyroclastic Deposits of
Damavand Volcano, Iran, an Example of Intraplate
Volcanism
M. Mortazavi*
Department of Geology, Faculty of Sciences, University of Hormozgan, P.O.Box 3995, Bandar
Abbass, Islamic Republic of Iran
Received: 30 November 2015 / Revised: 4 January 2016 / Accepted: 5 September 2016
Abstract
Damavand is a fascinating dormant stratovolcano, 60 km to the ENE of Tehran
located in the Alborz Mountains. Damavand volcanic products consist of lava flows and
pyroclastic fall, flow and surge deposits from different eruption cycles. The volcanic
rocks ranges from trachyandesite to trachyadacite and minor basalt. The mineral
assemblage consists of potash feldspar (Or43/7), Plagioclase (An25 to An59), amphibole,
clinopyroxene (augite and salite), orthopyroxene (hypersthene and ferro-hypersthene),
biotite (phologophite) and Fe-Ti oxides. Some of the lavas and pyroclastic deposits show
calc-alkaline affinities. Lavas from different cycled are classified as shoshonitic types
and most pyroclastic deposits are classified as High-K. In comparison to n-type MORB,
three recent pyroclastic deposits in Damavand show an enrichment in LREE, LILE, Th,
and P and are slightly depleted in MREE and HREE. Incompatible LILE (Rb, Ba and Sr)
together with Th and U have not shown broad enrichment as a function of increasing
SiO2 content. Variations in the Major and trace element compositions of Damavand rocks
and pyroclastic deposits are difficult to explain by fractional crystallization mechanism.
Scatter of several trace elements in plots against SiO2 and incompatible trace elements,
also suggests that the petrogenesis is more complex than a simple fractionation process
from a single composition parent. High K, Ba and Rb content in volcanic products could
be due to enrichment of these elements in the source. Field observation such as limitation
of magmatism in region suggest that decompression melting could be generate the
Damavand Lavas and pyroclastic deposits.
Keywords: Damavand Pyroclastics; Damavand Volcano; Damavand lavas.
* Corresponding author: Tel:+989173616592; Fax: +987633711027; Email:[email protected],
Introduction
Damavand is a dormant volcano, 60 km to the ENE
of Tehran, and is the highest mountain (5670 m) in the
Middle East and west Asia. Damavand located in the
Alborz Mountains of northern Iran in the Mazandaran
Province. Damavand is the largest strata-volcano of the
calcalkaline and is an outstanding location to
Vol. 28 No. 2 Spring 2017 M. Mortazavi. J. Sci. I. R. Iran
156
investigate volcanic and magmatic processes. There are
no known historic eruptions of Damavand and the latest
eruption occurred 7000 years ago. Damavand volcanic
products consist of many lava flows and pyroclastic
fall, flow and surge deposits which cover an area up to
400 km2 around the volcano. Although the stratigraphy,
geochronology, volcanology and petrology of the
Damavand volcano has been studied by researches, but
need to study more extensive. Damavand history
include several eruptions of intermediate lavas and
widespread pyroclastic deposits which can be
interpreted as a powerful explosive volcano.
The purpose of this article is to report the petrology,
mineral chemistry, and geochemistry of lavas and
pyroclastic deposits to provide information on the
genesis of magmas. Damavand volcanic rocks and
pyroclastic deposits have investigated. Petrology,
geochemistry and mineral chemistry of 40 volcanic
rocks have been studied and geochemistry of more than
90 pumice samples from three recent explosive
eruptions also examined. These eruptions from older to
younger were named Rayneh Pyroclastic Deposits,
Karam-Poshteh Pyroclastic Deposits and Mallar
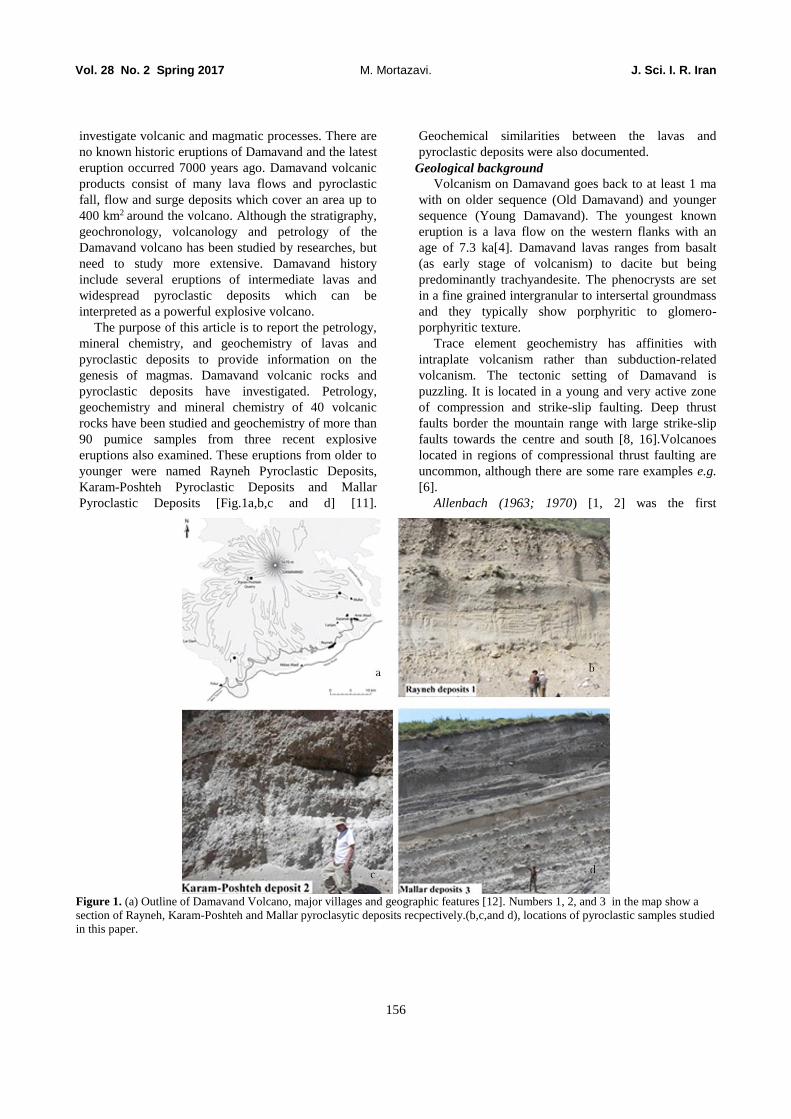
Pyroclastic Deposits [Fig.1a,b,c and d] [11].
Geochemical similarities between the lavas and
pyroclastic deposits were also documented.
Geological background
Volcanism on Damavand goes back to at least 1 ma
with on older sequence (Old Damavand) and younger
sequence (Young Damavand). The youngest known
eruption is a lava flow on the western flanks with an
age of 7.3 ka[4]. Damavand lavas ranges from basalt
(as early stage of volcanism) to dacite but being
predominantly trachyandesite. The phenocrysts are set
in a fine grained intergranular to intersertal groundmass
and they typically show porphyritic to glomero-
porphyritic texture.
Trace element geochemistry has affinities with
intraplate volcanism rather than subduction-related
volcanism. The tectonic setting of Damavand is
puzzling. It is located in a young and very active zone
of compression and strike-slip faulting. Deep thrust
faults border the mountain range with large strike-slip
faults towards the centre and south [8, 16].Volcanoes
located in regions of compressional thrust faulting are
uncommon, although there are some rare examples e.g.
[6].
Allenbach (1963; 1970) [1, 2] was the first
Figure 1. (a) Outline of Damavand Volcano, major villages and geographic features [12]. Numbers 1, 2, and 3 in the map show a
section of Rayneh, Karam-Poshteh and Mallar pyroclasytic deposits recpectively.(b,c,and d), locations of pyroclastic samples studied
in this paper.

High Potash Volcanic Rocks and Pyroclastic Deposits of Damavand Volcano …
157
systematic study of the geology. Knowledge about the
stratigraphy, age and geochemistry was significantly
enhanced by the study ofDavidson et al. (2004) [4],
Mortazavi et al. (2009) [12] and Mortazavi (2013))
[13]. There is, however, no detailed or reliable
geological map. The youngest known eruption is a lava
flow on the western flanks with an age of 7.3 ka.
Davidson et al. (2004) [4] also confirmed that the
largely volcanic products are remarkably uniform in
composition and petrology, being predominantly
porphyritic trachyandesite. Darvishzadeh and Mordi
(1997) [3] described young pyroclastic deposits that
they concluded were formed by sub-Plinian explosive
eruptions. Mortazavi et al. (2009) [12] describe the
distribution and characteristics of three pyroclastic
units and interpret the, in terms of eruption style, likely
magnitude, and hazardous effects. Mortazavi et al.
(2009) [12] then discuss the current state of the volcano
and the likelihood of the next eruption being explosive.
He discuss possible scenarios and impacts of future
eruptions locally and regionally and present the hazards
that would result from tephra fall in the cities and
provinces neighboring Damavand. Mortazavi et al.
(2009) [11] show that Damavand volcano has had high
intensity explosive eruptions, producing widespread
pyroclastic fall and flow deposits. Mohammadi (2016)
investigate the geochemistry and petrogenesis of the
youngest lavas of Damavand and suggest that volcanic
rocks originated from adakitic magma [11].
Mineralogy and geochemistry of lavas and pyroclastic
deposits can provide valuable information about
evolution of magma through time and composition of
parent magmas. To achieve this goal, field relationships
and geological features, texture, petrology,
geochemistry, and petrogenesis of lava and pyroclastic
deposits will be described.
Petrography
The petrography, crystal chemistry, petrology and
geochemistry of volcanic and pyroclastic rocks in
Damavand volcano are described. We adopt a
classification, modified from Gill (1981) [7], and based
on dry analysis: basalt (<53% SiO2); andesite (53-63%
SiO2); dacite (63-68% SiO2); rhyodacite (68-72% SiO2)
and rhyolite (> 72% SiO2). Description of crystal grain
sizes are in terms of: phenocrysts, microphenocrysts
and microlites. In the following account
microphenocrysts and microlites are considered as
components of the groundmass in those rocks with
porphyritic texture. The volume percent of crystal
phases was determined in thin sections under optical
microscope using x40 magnification. Mineral analyses
were performed on a JEOL JXA 8600 four spectrometer
electron probe with operating conditions of 15 KV,
beam current of 15 Na and minimum beam diameter of
1 nm. Mineral analyses are provided in the electronic
supplementary material.
The volcanic rocks ranges from trachyandesite to
trachydacite (SiO2 53-65%) [Fig. 2]. Although basalt
(SiO2 45%) are available as minor. The mineral
assemblage consists of potash feldspar (kf), plagioclase
(pl), amphibole (amp), clinopyroxene (cpx),
orthopyroxene (opx), biotite (biot) and Fe-Ti oxide
(opq). There are also minor interstitial glass and
vesicles. In the following description we distinguish
between large crystals, small crystals and crystallites
using an arbitrary division of maximum crystal length
(> 300 µm, 300-100 µm and < 100 µm).
Potash feldspar is commonly the most abundant of
Figure 2. Na2O+K2O versus SiO2 diagram showing volcanic rocks and pyroclastic deposits ranges from trachyandesite to
trachydacite.
Vol. 28 No. 2 Spring 2017 M. Mortazavi. J. Sci. I. R. Iran
158
the large crystals (30%) in most Damavand volcanic
rocks. Potash feldspar also occurs as small crystals and
crystallites. Most large crystals are subhedral to
unhedral; some are tabular show sieve texture and
rarely contain inclusions of brown glass, Fe-Ti oxides
and apatite. Crystal size ranges from 0.7 to 2.2 and
maximum crystal size rich to 3 mm. Potash feldspar
phenocrysts are divided into zoned and unzoned
crystals. Carlsbad twining is common and reaction rim
also occur in some crystals [Fig. 3a and b]. Potash
content (Or from K2O + Na2O + CaO)in majority of
large potash feldspar rich to 43/7% [Table 1].
Plagioclase is occurs as phenocrysts and
microphenocrysts. Plagioclase also occurs as small
crystals and crystallites. Plagioclase abundance is
between 5 to 10 percent. Crystal size ranges from 0.7 to
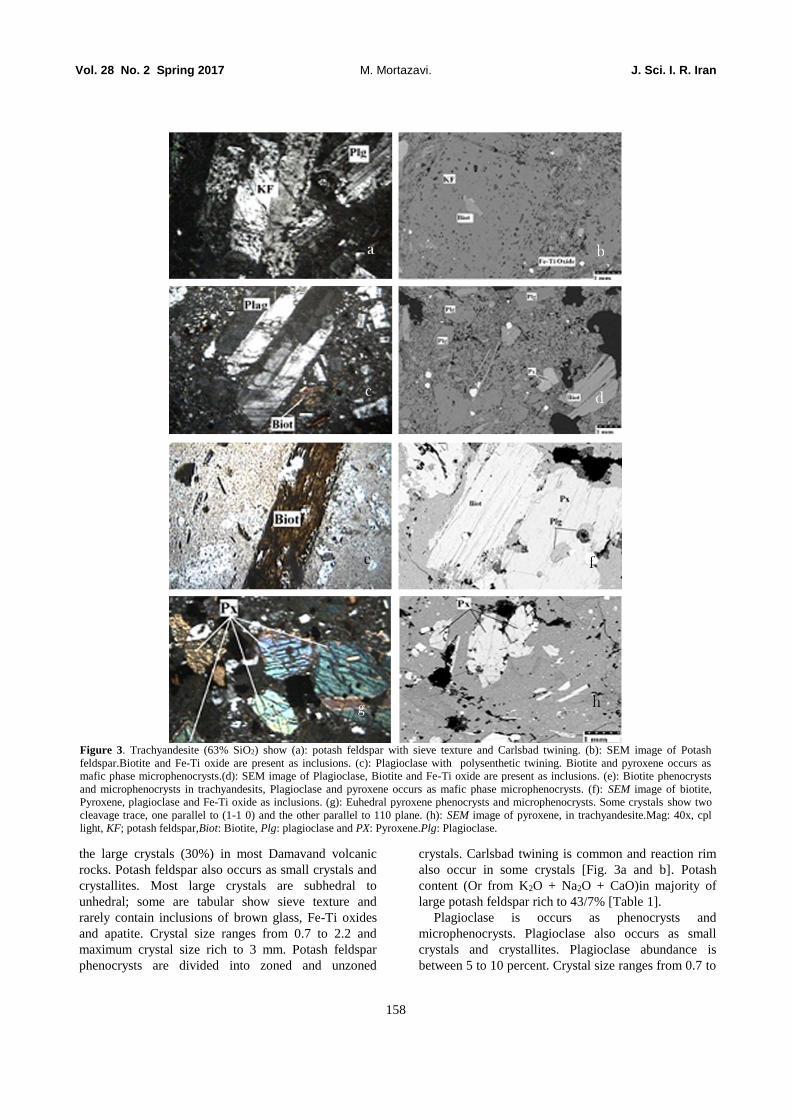
Figure 3. Trachyandesite (63% SiO2) show (a): potash feldspar with sieve texture and Carlsbad twining. (b): SEM image of Potash
feldspar.Biotite and Fe-Ti oxide are present as inclusions. (c): Plagioclase with polysenthetic twining. Biotite and pyroxene occurs as
mafic phase microphenocrysts.(d): SEM image of Plagioclase, Biotite and Fe-Ti oxide are present as inclusions. (e): Biotite phenocrysts
and microphenocrysts in trachyandesits, Plagioclase and pyroxene occurs as mafic phase microphenocrysts. (f): SEM image of biotite,
Pyroxene, plagioclase and Fe-Ti oxide as inclusions. (g): Euhedral pyroxene phenocrysts and microphenocrysts. Some crystals show two
cleavage trace, one parallel to (1-1 0) and the other parallel to 110 plane. (h): SEM image of pyroxene, in trachyandesite.Mag: 40x, cpl
light, KF; potash feldspar,Biot: Biotite, Plg: plagioclase and PX: Pyroxene.Plg: Plagioclase.

High Potash Volcanic Rocks and Pyroclastic Deposits of Damavand Volcano …
159
2.2 and maximum crystal size rich to 3 mm. Most large
crystals are euhedral to subhedral and prismatic and
rarely unhedral; some are tabular. Plagioclase
commonly show polysynthetic and albitic twining and
commonly contain inclusions of Fe-Ti oxides.
Plagioclase phenocrysts are divided into zoned and
unzoned crystals [Fig. 3c & d]. An content (Ca from
K2O + Na2O + CaO)in majority of large plagioclase
ranges from An25 to An59 [Table 1].
Biotite is occurs almost as microphenocrysts but
rarely phenocrysts. Biotite also present in groundmass.
Biotite abundance is between 5 to 10 percent. Crystal
size is commonly less than 1mm but in some cases
crystals with 2 mm long can be seen. Most crystals are
subhedral and show perfect cleavage. Parallel
extinction and brownish pelochroism are their main
character. Biotite in many cases altered to opaque
crystals. A framework of crystals can be distinguish in
progressive alteration. Routile and apatite occur as
inclusions in Biotite [Fig. 3e&f]. Microprobe analyses
[Table1] show that biotite are rich in Fe-Ti suggest that
alteration to Fe-Ti Oxides. Microprobe data suggest
most micas are phologophite.
Clinopyroxene and orthopyroxene (cpx>>opx) occur
as subhedral to unhedral crystals with maximum length
of 1 mm and width of 0.8 mm. Individual crystals are
either unzoned or show normal zoning with higher
Fe/Mg rims. Pyroxenes contain abundant inclusions of
glass, needles of apatite and Fe-Ti oxides [Fig. 3g&h],
[Table 1].
Pyroxene content varies between less than 5% to 7
%. Clinopyroxene (En (38-46)-Fs (4-12)-Wo (44-53) to
En46-Fs13-Wo40) mostly classified as augite and salite
with a few cases plotting as endiopside and diopside.
Most orthopyroxene are hypersthene (En50 to En57)
with Ca less than 0.5. There are also a few ferro-
hypersthene crystals [Table 1].
The matrix of the trachyandesitic rocks (18-30%) is
typically very fine grained with microcrystalline and
crystallites of plagioclase, k-feldspar, clino and ortho
pyroxene, apatite, opaque minerals, secondary calcite
and rarely glass. Vesicles up to 2.5 mm in width are
Table 1. Representative microprobe analyses of biotite, K feldspar, Pyroxene, Fe oxides and apatite
from Damavand volcanic rocks.
Biot Biot Biot Biot Biot Biot
Ideal Cations 7.82 7.82 7.82 7.82 7.82 7.82
Ideal Oxygens 11.00 11.00 11.00 11.00 11.00 11.00
SiO2 38.08 38.09 39.26 36.72 37.41 37.69
TiO2 5.38 5.30 5.51 5.96 6.18 6.03
Al2O3 13.05 12.90 13.40 13.32 13.14 13.20
Cr2O3 0.02 0.03 0.01 0.00 0.02 0.01
FeO 11.87 11.50 11.35 11.38 12.62 13.02
MnO 0.06 0.07 0.06 0.04 0.10 0.07
MgO 16.81 16.64 15.11 16.31 15.54 16.03
Na2O 0.75 0.95 0.85 0.97 0.99 0.90
K2O 8.55 8.67 8.40 8.32 8.52 8.93
Total 94.57 94.15 93.97 93.00 94.51 95.90
Table 1. Cntd
Px Px Px Px Px Px Px Px Px Px Px Px Px
Ideal
Cations
4.00 4.00 4.00 4.00 4.00 4.00 4.00 4.00 4.00 4.00 4.00 4.00 4.00
Ideal Oxygens
6.00 6.00 6.00 6.00 6.00 6.00 6.00 6.00 6.00 6.00 6.00 6.00 6.00
SiO2 53.38 51.89 53.78 52.86 52.46 52.51 68.43 50.93 48.32 46.97 51.68 48.67 46.07
TiO2 0.24 0.74 0.39 0.40 0.50 0.24 0.42 0.96 0.79 0.98 0.33 0.68 0.93 Al2O3 0.82 2.07 1.25 1.22 2.23 1.04 14.37 3.53 5.37 6.84 2.29 4.89 7.66
Cr2O3 0.00 0.21 0.04 0.11 0.23 0.00 0.01 0.16 0.00 0.00 0.25 0.00 0.01 FeO 7.69 7.56 7.00 7.50 6.75 8.53 2.37 6.27 8.00 8.75 5.35 7.89 8.98
MnO 0.48 0.28 0.29 0.39 0.25 0.44 0.08 0.10 0.17 0.20 0.10 0.26 0.24
MgO 14.82 14.96 15.72 15.33 15.33 14.77 0.31 14.87 12.98 11.79 15.91 12.65 11.29 CaO 22.17 21.51 21.64 21.47 21.39 21.13 1.07 21.57 23.35 22.92 23.63 23.07 22.88
Na2O 0.47 0.54 0.47 0.64 0.57 0.62 4.36 0.46 0.36 0.40 0.19 0.63 0.57
Total 100.08 99.77 100.59 99.93 99.72 99.28 96.70 98.85 99.33 98.86 99.74 98.75 98.63 En 43.06 44.56 45.06 45.41 45.36 44.12 1.22 44.56 40.86 38.22 46.43 40.56 37.94
Fs 10.66 9.41 10.36 8.88 9.16 10.51 95.78 9 6.32 8.40 4 6.28 6.77
Wo 46.28 46.03 44.58 45.70 45.49 45.37 46.44 46.44 52.83 53.38 49.57 53.16 55.29

Vol. 28 No. 2 Spring 2017 M. Mortazavi. J. Sci. I. R. Iran
160
rarely present. The matrix fills the spaces between the
interlocking frameworks of large crystals. Rocks
characteristically display porphyritic texture. In some
cases seriate texture is shown by a wide range of grain
sizes of plagioclase, pyroxene and small proportions of
Fe-Ti oxide. In some samples the wedge-shaped
intersections between the large and small crystals have
occupied by hypo-crystalline material.
Geochemistry trends
The identification of the geochemical affinities of
pyroclastic rocks was carried out using oxide wt% to
plot on the triangular AFM diagram. Majority
pyroclastic deposits plot just below and minor on the
boundary line and therefore show calc-alkaline
affinities in this diagram [Fig. 5].
The wt% oxide data are also plotted in FeO/MgO
Table 1. Cntd
Plg Plg Plg Plg Plg Plg Plg Plg Plg Plg
Ideal Cations 4.91 4.91 4.91 4.91 4.91 4.91 4.91 4.91 4.91 4.91
Ideal Oxygens 8.00 8.00 8.00 8.00 8.00 8.00 8.00 8.00 8.00 8.00 SiO2 62.95 60.26 61.69 60.57 61.98 61.97 60.34 31.37 35.68 59.68
Plg Plg Plg Plg Plg Plg Plg Plg Plg Plg
TiO2 0.12 0.04 0.03 0.04 0.05 0.03 0.04 0.04 0.03 0.06 Al2O3 23.32 24.81 24.31 24.37 25.35 23.69 25.07 13.69 15.77 24.58
FeO 0.74 0.47 0.41 0.43 0.47 0.38 0.28 0.52 0.48 0.46
MnO 0.02 0.00 0.01 0.00 0.01 0.02 0.00 0.04 0.02 0.02 MgO 0.08 0.01 0.05 0.01 0.03 0.02 0.02 0.08 0.10 0.02
ZnO 0.00 0.00 0.00 0.00 0.00 0.00 0.00 0.00 0.00 0.00
CaO 5.09 6.42 5.69 6.00 6.35 4.87 6.76 5.85 5.96 6.30 Plg Plg Plg Plg Plg Plg Plg Plg Plg Plg
Na2O 6.93 7.06 7.71 7.20 6.77 7.97 6.84 8.80 9.48 7.42 K2O 2.18 1.08 1.35 1.24 1.14 1.57 1.01 0.70 0.66 1.10
Total 101.44 100.13 101.23 99.85 102.15 100.53 100.37 61.09 68.18 99.63
Ab 62.03 62.39 65.68 63.54 61.40 68.17 60.84 70.45 71.77 63.83
An 25.14 31.35 26.77 29.27 31.82 22.99 33.23 22.89 24.93 29.96
Or 12.82 6.26 7.55 7.18 6.78 8.84 5.93 3.66 3.30 6.22
Table 1. Cntd
Plg Plg Plg Plg Kf Kf Kf Kf Kf Kf
Ideal Cations 4.91 4.91 4.91 4.91 4.91 4.91 4.91 4.91 4.91 4.91
Ideal Oxygens 8.00 8.00 8.00 8.00 8.00 8.00 8.00 8.00 8.00 8.00 SiO2 54.68 58.68 50.80 49.33 58.70 59.38 59.38 68.29 36.07 36.07
TiO2 0.06 0.02 0.46 0.06 0.07 0.04 0.05 0.66 0.34 0.34
Al2O3 27.51 16.23 17.01 19.63 25.47 24.89 24.81 15.53 9.48 9.48 FeO 0.41 0.28 1.11 0.31 0.50 0.48 0.47 2.03 1.49 1.49
MnO 0.01 0.03 0.00 0.01 0.00 0.01 0.02 0.03 0.03 0.03
MgO 0.01 0.29 0.03 0.01 0.04 0.01 0.01 0.24 0.45 0.45 Plg Plg Plg Plg Kf Kf Kf Kf Kf Kf
CaO 10.02 4.31 2.51 4.70 7.43 6.68 6.84 0.84 0.69 0.69
Na2O 5.28 5.82 6.42 6.23 6.58 7.23 7.10 4.81 2.90 2.90 K2O 0.61 2.26 1.46 0.86 0.97 1.01 1.06 6.23 3.47 3.47
Total 98.61 87.95 79.81 81.18 99.77 99.73 99.74 98.68 54.93 54.93
Ab 47.07 60.07 73.22 66.33 58.10 62.38 61.34 51.34 52.07 52.07 An 49.36 24.57 15.84 27.66 36.26 31.88 32.66 4.94 6.88 6.88
Or 3.57 15.35 10.94 6 5.64 5.75 6 43.71 41.06 41.06
Fe-Ox Fe-Ox Apat Apat Apat Apat Apat Apat Apat
Ideal Cations 1.00 1.00
Ideal Oxygens 1.50 1.50 SiO2 0.42 0.38 0.45 0.30 0.28 0.43 0.67 TiO2 0.00 0.00 0.03 0.00 0.00 0.00 0.02
SiO2 0.08 0.09 Al2O3 0.00 0.01 0.02 0.02 0.01 0.01 0.00
TiO2 4.54 3.85 Cr2O3 0.00 0.00 0.00 0.00 0.00 0.00 0.00 Al2O3 3.45 2.75 FeO 0.21 0.27 0.70 0.34 0.30 0.50 0.27
Fe-Ox Fe-Ox Apat Apat Apat Apat Apat Apat Apat
Cr2O3 0.18 0.16 MnO 0.04 0.10 0.10 0.13 0.09 0.08 0.04 FeO 80.69 81.19 MgO 0.15 0.28 0.50 0.33 0.29 0.29 0.12
MnO 0.57 0.56 ZnO 0.00 0.00 0.00 0.00 0.00 0.00 0.00
MgO 3.77 3.35 CaO 49.07 52.36 52.42 52.92 52.91 52.19 49.84 ZnO 0.00 0.00 Na2O 0.30 0.37 0.60 0.57 0.49 0.52 0.20
CaO 0.02 0.05 K2O 0.01 0.00 0.08 0.00 0.02 0.07 0.02
Na2O 0.07 0.06 Total 50.20 53.76 54.89 54.61 54.40 54.08 51.19
K2O 0.00 0.05

High Potash Volcanic Rocks and Pyroclastic Deposits of Damavand Volcano …
161
versus SiO2 diagram [Fig. 6]. Most pyroclastic deposits
show tholeiitic affinities.
It is noted that some samples plot within the
calcalkaline field in the AFM diagram [Fig. 5], but plot
within the tholeiitic field in the Miyashiro diagram
[Fig.6]. This is simply an artifact of the different
arbitrary boundaries between these igneous suites on
the two different diagrams. It also reflects the fact that
these samples have compositions close to the
boundaries and also due to presence of Fe-Ti oxides.
Based on a K2O versus SiO2 diagram [Fig. 7a], with
classification boundaries after Peccerillo and Taylor
(1976)[15], lavas from different cycled are classified as
shoshonitic types. Most pyroclastic deposits are
classified as High-K. It is clear from this diagram [Fig.
7a] that lava and pyroclastic deposits define trends
from generally “high-K” to “shoshonitic series” with
increasing SiO2 content. The key point is that the K2O
a b
c
Figure 4. (a): Composition of potash feldspar and plagioclase in volcanic rocks. There are wide ranges of potash feldspar and
plagioclase in volcanic rocks. (b): Micas are almost phologophite in Damavand volcanic rocks and Fe-Ti content result of biotite
alteration. (c): Pyroxenes in Damavand volcanic rocks are rich in Ca and poor in Fe and mainly are diopside.
Figure 5. AFM diagram. P deposits plot just below and or on the boundary line in the calc-alkaline part of diagram. Mallar
pyroclastic deposits (solid triangles), Karam-Poshteh pyroclastic deposits (open triangles) and Rayneh pyroclastic deposits (solid
circles).

Vol. 28 No. 2 Spring 2017 M. Mortazavi. J. Sci. I. R. Iran
162
content will be decrease from older deposits (Rayneh
pyroclastic deposits) to younger ones (Mallar
pyroclastic deposits). Na2O+ K2O diagram versus SiO2
also show that Damavand lavas are alkaline whilst
pyroclastic deposits almost plotted in sub-alkaline area
[Fig.7b].
Major element geochemistry
Major element variation diagrams for Damavand
lavas and pyroclastic deposits rocks are shown in [Fig.
8]. K2O in Damavand pyroclastic deposits shows a flat
or weak tendency to decrease with increasing SiO2
between 60 to 65 wt%, whilst K2O in Damavand lavas
increases with increasing SiO2. Some of the volcanic
rocks and the pyroclastic deposits are distinctive on the
K2O versus SiO2 diagram [Fig. 8] in having lower K2O
values at a given content SiO2 in comparison to other
volcanic rocks and the pyroclastic deposits. It found
that the pyroclastic deposits on Damavand decreased in
relative K2O content with time and the older pyroclastic
deposits being richer in K2O. It is also observed that the
Figure 6. FeO/MgO vs. SiO2 diagram for pyroclastic deposits. Pyroclastic deposits plotted in tholeiitic field. The line defining the
boundary between the fields of tholeiitic and calc-alkaline volcanic suites after [10] is shown for reference. Mallar pyroclastic
deposits (solid triangles), Karam-Poshteh pyroclastic deposits (open triangles) and Rayneh pyroclastic deposits (solid circles).
Figure 7. (a): K2O versus SiO2 diagram, modified after [16] showing thrachyandesitic rocks and pyroclastic deposits from this
study. (b): Na2O+K2O diagram versus SiO2, showing thrachyandesitic rocks and pyroclastic deposits from this study.Mallar
pyroclastic deposits (open triangles), Karam-Poshteh pyroclastic deposits (open triangles) and Rayneh pyroclastic deposits (solid
circles), Damavand lavas (solid diamond) and Damavand lavas data from [5] (solid square).

High Potash Volcanic Rocks and Pyroclastic Deposits of Damavand Volcano …
163
K2O content are not the same in different volcanic
rocks on Damavand. CaO content in lavas, show
considerable decrease with increasing SiO2 and scatter
or weak tendency in Karam-Poshteh Pyroclastic
deposits. Taken together, CaO content in lavas, Rayneh
and Mallar pyroclastic deposits, show linear trends and
decrease with increasing SiO2. Al2O3 in volcanic rocks
shows a slight decrease in SiO2 between 55 to 65wt%,
Figure 8. Major elements variation diagrams for lavas and pyroclastic deposits of Damavand Volcano. Symbols are the same as Fig.7.
a
b c
Figure 9. Multi element diagrams for (a): rare earth elements. Data normalized to N-type MORB. and (b) trace elements arranged in an
order of increasing incompatibility and mobility from right to left normalized to N-type MORB (b) and primitive mantle (c). Each line in
the diagrams, (graph) is an averages compositins of 30 Samples.

Vol. 28 No. 2 Spring 2017 M. Mortazavi. J. Sci. I. R. Iran
164
whereas Al2O3 in pyroclastic deposits from the other
units (Rayneh, Karam-Poshteh and Mallar) show a
linear trend with increasing SiO2. Na2O shows a linear
trend in both volcanic and pyroclastic deposits, but are
notable for having significantly lower content in
pyroclastic deposits compare with volcanic rocks. FeO
content in volcanic and pyroclastic deposits show a
linear trend and slight decrease with increasing SiO2.
Several Pyroclastic samples shows significantly higher
FeO than the majority. MgO in pyroclastic deposits
remains approximately constant over a range of SiO2
(55-65%), except for higher amount in volcanic rocks
which show a decrease in MgO continuously with
increasing SiO2. Pyroclastic deposits have higher FeO
and lower MgO than volcanic rocks.TiO2 shows
considerable scatter in both volcanic rocks and
pyroclastic deposits. Although P2O5 has a scattered
trend in both volcanic rocks and pyroclastic deposits, it
generally shows a flat variation with SiO2 [Fig. 8]
[Table 2].
race element geochemistry
The trace element characteristics of the volcanic
rocks and pyroclastic deposits in Damavand Volcano
are displayed using the multi element spider diagram of
Pearce (1982) [14], in which elements are normalized
against a N-type MORB standard Sun and McDonough,
(1989) [17]. The trace element data have been plotted
in terms of Rare Earth Elements (REE) alone [Fig. 9a]
and for selected trace elements, after consideration of
relative incompatibilities and mobility [Fig. 9 b & c]
[Table 3]. Here light, middle and heavy rare earth
elements are denoted as LREE, MREE and HREE
respectively and Large Ion Lithophile Elements as
LILE. To avoid from any complexity (90 samples) and
ability to compare trace elements from different
eruptive phase, the averages of elements in each
eruptive phases have been plotted.
In comparison to N-type MORB, three recent
pyroclastic deposits in Damavand show an enrichment
in LREE (La, Ce, Sm, Eu), LILE (Ba, Rb, K, Sr,), Th,
U, and P and are slightly depleted in MREE (Gd, Tb,
Table 2. Representative major and trace elementdata of volcanic rocks and pyroclastic deposits from Damavand volcano. Sample 1-D 2-D 3-D 4-D 5-D 6-D 7-D 8-D 9-D S3L8C S3L8M S3L8F S3L6L
SiO2 63.5 64.75 63.56 58.21 62.47 62.46 63.38 65.17 64 57.74 61.00 61.51 61.03
TiO2 1.04 0.93 1.05 1.79 1.15 1.16 1.1 1.6 1.15 1.12 1.06 1.01 1.08
Al2O3 14.42 14.12 14.37 15.91 14.25 14.13 14.41 13.5 13.6 14.93 15.45 15.24 15.55
FeO 4.93 4.43 4.84 3.97 5.59 5.03 4.71 4.7 4.76 8.64 4.85 4.63 5.87
MnO 0.07 0.07 0.08 0.09 0.08 0.07 0.07 0.07 0.07 <.1 <.1 <.1 0.10
MgO 1.68 1.7 1.79 2.9 1.99 1.95 1.85 1.73 1.67 1.49 1.38 1.30 1.60
CaO 4.46 3.8 4.63 7.31 5 5.05 4.61 3.96 4.91 3.96 3.27 3.15 4.04
Na2O 4.5 4.74 4.57 4.75 4.71 4.46 4.8 4.24 4.36 3.96 3.27 3.15 4.04
K2O 4.82 4.9 4.5 3.84 4.17 4.71 4.54 5.01 4.89 3.07 3.20 3.17 3.63
P2O5 0.58 0.55 0.6 1.23 0.59 0.59 0.52 0.5 0.6 4.16 4.16 4.26 4.05
Total 100 100 100 100 100 100 100 100 100 0.82 0.76 0.71 0.93
Ba 1189 1080 1153 1289 1132 1132 1148 1196 1141 100.00 100.00 100.00 100.00
Rb 110 139 111 61 99 107 104 112 109 330.25 398.15 365.80 395.00
Sr 1172 1052 1254 1676 1282 1315 1284 1434 1343 1082.2 1206.6 1128.79 1198.7
Zr 316 341 305 332 304 298 294 321 303 610.19 753.79 764.85 755.50
Pb 18 26 27 26 36 17 17 19 14 34.47 22.03 8.61 31.81
Y 19 20 18 16 18 1 817 19 18 12.70 15.52 13.31 16.14
Nb 43 47 48 58 45 45 35 47 37 46 46 49 48.79
U 2 5 0 0 0 0 0 0 2 2 6 3 4.09
Th 18 32 21 10 19 17 16 19 15 21 24 22 23.93
Sample S3L9A S3L12C S3L12M S3L12F S3L16C S3L16M PR2 PR3 PR4 PR5 PR6
SiO2 60.87 61.90 62.20 56.39 62.34 62.39 65.80 62.40 60.00 62.60 62.80
TiO2 1.13 0.93 0.87 0.77 0.93 0.90 0.80 1.00 0.90 0.90 0.80
Al2O3 15.53 15.16 15.05 13.67 15.29 15.16 15.40 15.60 16.60 16.20 15.30
FeO 5.50 5.13 5.21 9.97 4.88 5.01 3.90 4.50 4.20 4.20 4.30
MnO <.1 <.1 <.1 0.30 <.1 <.1 <.1 <.1 3.50 <.1 <.1
MgO 1.84 1.28 1.35 1.16 1.39 1.36 1.10 1.50 1.20 1.60 1.20
CaO 4.15 3.10 3.28 4.68 3.15 3.27 3.20 3.90 2.40 2.60 3.70
Na2O 4.15 3.10 3.28 4.68 3.15 3.14 3.90 3.50 3.30 3.60 3.60
K2O 3.22 3.37 3.43 3.25 3.44 3.46 PR2 PR3 PR4 PR5 PR6
P2O5 3.72 4.56 4.25 3.82 4.42 4.34 4.30 4.70 4.60 4.70 4.30
Total 1.00 0.62 0.71 0.58 0.67 0.67 0.70 0.90 0.50 0.60 0.70
Ba 100.00 100.00 100.00 100.00 100.00 100.00 100.00 100.00 100.00 100.00 100.00
Rb 479.75 281.36 263.48 316.84 380.68 322.99 19.35 36.53 46.22 65.95 90.15
Sr 1249.02 876.94 791.12 1013.65 1167.3 1042.07 1144.8 1139.5 1333.66 1296.8 1272.90
Zr 738.15 680.59 636.42 778.23 813.23 787.94 681.43 768.38 609.26 809.27 770.63
Pb 29.41 15.51 29.91 23.74 17.15 17.75 26.88 37.12 71.88 36.95 28.86
Y 18.20 10.28 10.49 15.00 13.06 13.29 11.22 11.76 21.74 13.57 11.51
Nb 67.56 65.25 69.21 59.39 51.73 51.77 58.86 65.11 56.71 48.93 65.25
U 2.20 1.63 2.31 2.16 1.73 1.98 5.15 1.74 1.80 6.68 3.21
Th 24.10 21.82 23.60 26.13 19.55 20.08 33.32 25.84 21.74 35.72 12.59

High Potash Volcanic Rocks and Pyroclastic Deposits of Damavand Volcano …
165
Dy, Ho) and HREE (Er, Tm, Yb, Lu) [Fig.9 b & c].
Rayneh and Karam-Poshteh Pyroclastic deposits are
enriched in Tb, but is notable depleted in Gd and Lu
compared to Malar pyroclastic deposits.
The trace element data of volcanic rocks and
pyroclastic deposit samples are plotted versus SiO2 and
against one another [Fig. 10]. Incompatible LILE (Rb,
Ba and Sr) together with Th have not shown broad
enrichment as a function of increasing SiO2 content.
However there is considerable variation in the
concentrations of these elements at a given value of
SiO2, particularly Rb, Ba, Th and Zr. Pyroclastic
deposits plots as a distinct cluster in comparison with
volcanic rocks. Pyroclastic deposits are enriched in Rb,
Ba Th, Zn and Zr in comparison to the volcanic rocks.
Mallar pyroclastic deposits as the youngest explosive
eruptions has the highest content of the above elements
in comparison to the Rayneh and Karam-Poshteh
pyroclastic deposits [Fig. 10]. Ce, Sr and Y show
considerable scatter.
Zr data show two distinct groups for volcanic rocks
and pyroclastic deposits. Volcanic rocks with the
majority having high Zr with 100 to 300 ppm and the
pyroclastic deposits have Zr contents which are
intermediate between 500 to 900 ppm.
A comparison between geochemistry of the volcanic
rocks and pyroclastic deposits show that the
geochemistry can be contrasted. LREE (La, Ce, Hf, Pr)
show scattered variations with SiO2. Damavand
pyroclastic deposits are typically enriched in LREE but
show a large range in LREE. Mallar deposits as the
youngest pyroclastic phase of Damavand is
anomalously enriched in LREE (with the exception of
Pr) compared to Karam-Poshteh and Rayneh
pyroclastic deposits. The same trend can be observed
with MREE (with the exception of Tb). In both trace
Table 3. Representative rare earth elementdata of volcanic rocks and pyroclastic deposits from Damavand volcano. Sample S4N4F S4N4Li S4N3ASH S5N2F S3N2AS S3N2F S3N3C S3N3M S3N3F S3N3Li S3N4C S1R1 PR2 PR3 PR4 PR5 PR6
La 80.69 73.25 43.35 74.60 70.95 76.29 87.89 90.45 98.80 92.20 82.44 62.33 28.34 36.73 61.74 54.50 44.92
Ce 116.69 125.58 120.03 98.02 67.59 100.47 105.67 169.71 75.40 51.42 63.38 62.36 48.31 70.96 140.98 99.40 78.63
Pr 11.40 10.89 7.96 11.66 9.67 14.12 13.79 13.83 13.79 13.06 12.44 10.22 7.98 8.39 11.24 9.97 9.10
Nd 67.78 61.47 57.94 36.06 56.04 47.38 52.64 64.36 73.19 66.33 61.35 61.10 32.12 36.47 57.11 48.25 36.46
Sm 7.16 6.44 6.17 4.13 5.36 4.96 5.76 6.46 7.08 6.92 5.91 5.92 3.28 4.30 6.38 5.77 4.36
Eu 2.22 1.93 1.88 1.07 1.69 1.52 1.60 1.97 2.27 2.37 2.18 1.66 1.01 1.02 2.03 1.59 1.21
Gd 2.53 2.58 2.47 1.70 2.08 1.78 2.13 2.37 2.44 2.65 2.42 2.53 2.24 2.24 2.60 2.40 2.28
Tb 1.66 1.72 1.67 1.28 1.26 1.47 1.20 1.55 1.61 1.59 1.51 1.34 1.47 1.45 1.51 1.57 1.39
Dy 1.48 3.12 2.66 1.66 3.24 2.96 4.00 4.03 4.62 4.72 4.29 1.66 1.17 1.18 4.72 1.80 1.06
Ho 0.59 0.59 0.55 0.44 0.66 0.45 0.94 0.77 0.78 0.69 0.67 0.59 0.62 0.57 0.63 0.58 0.64
Er 2.45 2.56 2.34 1.72 1.75 2.02 1.73 2.21 2.30 2.37 2.36 2.45 1.95 2.06 2.47 2.34 1.94
Tm 0.21 0.22 0.20 0.14 0.17 0.14 0.18 0.19 0.19 0.22 0.20 0.21 0.19 0.18 0.21 0.20 0.19
Yb 1.95 1.87 1.68 1.46 1.64 1.78 1.83 1.94 1.94 1.98 1.98 1.95 1.51 1.55 2.13 1.75 1.65
Lu 0.17 0.18 0.17 0.12 0.14 0.12 0.14 0.16 0.16 0.18 0.16 0.17 0.15 0.15 0.17 0.16 0.16
Sample S1N8M S1N8F S1N8Li S2N2C S2N2M S2N2F S2N2Li S2N1ASH S3N4M S3N4F S4N4C S4N4M S2R5 S2R6 S2R7 PR1 S2R2C
La 61.67 47.10 61.01 86.68 89.16 91.09 73.25 89.34 85.83 75.77 75.77 100.85 38.78 30.34 35.52 37.77 58.36
Ce 125.95 94.32 124.87 174.40 184.97 177.45 147.96 175.14 164.37 148.71 148.71 208.52 75.40 51.42 63.38 62.36 116.90
Pr 10.57 8.75 11.10 15.07 14.07 13.50 10.89 13.07 12.15 11.77 11.77 13.24 8.73 8.49 8.34 8.51 9.74
Nd 51.17 44.62 50.39 65.47 65.82 64.99 57.94 57.19 60.64 59.06 59.06 67.78 41.52 35.42 33.84 34.83 48.36
Sm 5.27 5.13 6.13 7.21 6.64 6.71 6.17 5.66 5.59 5.51 5.51 7.16 4.53 3.98 4.05 3.50 5.14
Eu 1.65 1.42 1.90 2.00 2.28 1.99 1.88 1.58 1.67 1.66 1.66 2.22 1.11 1.08 1.09 1.01 1.62
Gd 2.57 2.39 2.76 2.42 2.48 2.40 2.47 1.88 2.14 2.17 2.17 2.53 2.36 2.42 2.23 2.15 2.18
Tb 1.62 1.49 1.69 1.52 1.58 1.66 1.67 1.59 1.32 1.33 1.33 1.66 1.55 1.59 1.33 1.02 1.42
Dy 2.23 2.79 3.36 3.77 3.95 4.19 2.66 3.44 3.70 2.79 2.79 1.48 2.13 1.38 1.36 1.69 2.84
Ho 0.57 0.54 0.61 0.94 0.76 0.66 0.55 0.73 0.64 0.63 0.63 0.59 0.59 0.62 0.59 0.62 0.55
Er 2.40 2.11 2.61 2.25 2.19 2.24 2.34 2.16 1.94 1.93 1.93 2.45 2.12 2.05 2.02 1.41 2.21
Tm 0.22 0.21 0.22 0.21 0.19 0.19 0.20 0.15 0.18 0.18 0.18 0.21 0.19 0.21 0.19 0.18 0.18
Yb 2.00 1.88 2.09 1.80 1.87 1.80 1.68 1.43 1.71 1.88 1.88 1.95 1.74 1.62 1.70 1.51 1.70
Lu 0.18 0.17 0.19 0.16 0.17 0.16 0.17 0.12 0.14 0.15 0.15 0.17 0.16 0.17 0.16 0.15 0.15

Vol. 28 No. 2 Spring 2017 M. Mortazavi. J. Sci. I. R. Iran
166
element categories (LILE and LREE) the Mallar
pyroclastic deposits with few minor exceptions shows
the most enrichment.
Results and Discussion
Variations in the Major and trace element
compositions of Damavand rocks and pyroclastic
deposits are difficult to explain by fractional
crystallization mechanism. An interesting observation
is that K and Rb are well correlated only in Mallar
pyroclastic deposits [Fig. 10]. The only major phase
that might discriminate between K and Rb is biotite and
the variations are consistent with K being significantly
more compatible than Rb [16]. Zr data [Fig. 10] show
that there are two groups of pyroclastic deposits with
high Zr content (600 to 900 ppm in given SiO2 content
of 60%) and volcanic rocks as a low Zr group (100 to
300 ppm in given SiO2 content of 60%). Scatter of
several trace elements in plots against SiO2 and
incompatible trace elements (Zn, Ba, Th, Ce and Sr),
also suggests that the petrogenesis is more complex
than a simple fractionation process from a single
composition parent. High K, Ba and Rb content in both
volcanic rocks and pyroclastic deposits could be due to
enrichment of these elements in the source. Rb, Ba may
be accepted in the plagioclase and biotite which have
structures large enough to accommodate Ba [9].
Figure 10. Trace elements variation diagrams for pyroclastic deposits of Damavand Volcano. Symbols are the same as Fig.15.
Figure 11. Variation diagrams of lavas and pyroclastic deposits compositions (plotted as the same symbols as Fig. 7) to illustrate
possible magma evolution by crystal fractionation. Al2O3 (a), CaO (b) are plotted against SiO2. Compositions of the main crystal
phases are plotted: plagioclase (open squares) and pyroxene (open circles).Other symbols are as the as Fig.7.

High Potash Volcanic Rocks and Pyroclastic Deposits of Damavand Volcano …
167
Diagrams of mineral composition are used to test
whether fractionational crystallization might have
evolved. Al2O
3 and CaO content in, plagioclase and
pyroxene and bulk composition of whole rock were
plotted against SiO2 [Fig. 11a & b]. The trend suggest
that evolution of trachyandesitic lavas and pyroclastic
deposits might not be explained by simple fractionation
but there is not enough mineral composition data
available on Damavand lavas and pyroclastic deposits.
Tectonic-environment diagrams are only valid for
primitive rocks, and the Damavand rocks are highly
differentiated. Relatively high Th and Low Y contents
can be intemperate as crustal contamination.
Differentiation and contamination processes of
Damavand rocks make uncertainty about the plotting
areas in the above discriminant diagrams. Presence of
magnetite and apatite imply fractionation processes
have been involved and is responsible for considerable
scatter in trace element characteristics. Fractionation
vectors [Fig. 12 a, b and c] suggest that parental
magmas probably had lower Nb/Y ratios, while
providing little constraint on parental Ti/Y ratios.
Davidson et al (2004)[4] show that basalts from the
region, which might represent parental magmas, do
have lower Nb/Y ratios and plot closer to the within-
plate fields.
Volcanic rocks and pyroclastic deposits contain high
Nb content (50-80) which is much higher than
sebduction related magma and volcanic arc rocks.
Geochemistry data also show no apparent trends
through time and distinct similarity can be observed
between Damavand trachyandesits with the same rocks
from interaplate magma setting. Field observation such
as limitation of magmatism in region suggest that
decompression melting and local hotspot formation
could be investigate in Damavand.
Acknoladgments
The author would like to thank Steve Sparks for his
very useful comments. The research was partly funded
by Ministry of Sciences, Research and Technology of
Iran.
References
1. Allenbach P. Geologie und petrologie des Damavand und
seiner umgeurg (Zentral-Elburz), Iran.Phd.Theses.
Geologisches Institut, ETH Zurich, Mittellung. 63, 114p.
(1963).
2. Allenbach P. Geology and Petrography of Damavand and
its environment (Central Alborz), Iran, Geological Survey
Figure 12. Geochemical affinity of Damavand pyroclastic deposits. (a): Hf-Th-Ta triangular diagram after [19], (b): K2O-TiO2-
P2O5 triangular diagram, (c): Ti/Y vs. Nb/Y discriminant diagram after [14], with effects of fractionation of modal phases; ap:
apatite, cpx: clinopyroxene, MT: magnetite and amp: amphibole.

Vol. 28 No. 2 Spring 2017 M. Mortazavi. J. Sci. I. R. Iran
168
of Iran Report, 27p. (1970).
3. Darvishzadeh A., and Mordi M. Fall differentiation in
pyroclastic fall deposits of Damavand Volcano. Journal of
Science(Persian ), 23 (1): 31-46 (1997) .
4. Davidson J., Hassanzadeh J., Stockli D.F., Bashukooh B.,
Turrin B., and Panamouz A. The geology of Damavand
volcano, Alborz Mountains, northern Iran. GSA Bulletin
116 (1): 16-29 (2004).
5. Emami M.H. Damavand Volcano and its Probable
Activity. Geological Survey of Iran, 559 p. (1989).
6. Galland O., Hallot E., Cobbold P.R., Ruffet G., and
Bremond d’Ars J. Volcanism in a compressional Andean
setting: a structural and geochronological study of Tromen
volcano (Nequen Province, Argentina). Tectonics, 26 (4):
1-24 (2007).
7. Gill j. B. Orogenic Andesite and Plate Tectonics. Springer,
Berlin, Heidelberg, 87p. (1981).
8. Jackson J., Priestley K., Allen M., and Berberian M.
Active Tectonics of the South Caspian Basin. J. Geophys.
Res, 148 (2): 214-245 (2002).
9. Mason B., and Moore C.B. The structure and composition
of the Earth. Principles of geochemistry, 344p. (1982).
10. Miyashiro A. Volcanic rock series in island arcs and
active continental margins. Earth Sci. Rev, 274 (4): 321-
355 (1974).
11. Mohamadi L. Petrography, Geochemistry and
Petrogenesis of the Youngest lava of Damavand Volcano,
MSc. Theses, Earth Sciences Research Center, 132p.
(2016).
12. Mortazavi M., Sparks R.S.J. and Amigo A. Evidence for
Recent Large Magnitude Explosive Eruptions at
Damavand Volcano, Iran with Implications for Volcanic
Hazards, J.Sci.I.R.Iran 20 (3): 253-264 (2009).
13. Mortazavi M. The Youngest Pyroclastic Activity of
Damavand Volcano, an Example of Sub-Pillinian
Eruption with Stratospheric Level of Volcanic Plum.
Geo.Sci 23 (89): 155-164 (2013).
14. Pearce J.A. Role of sub-continental lithosphere in magma
genesis at active continental margins. In: continental
basalts and mantle xenoliths, Springer, Berlin, 230-249
(1982).
15. Peccerillo A., and Taylor S. R. Geochemistry of Eocene
calc alkali volcanic rock from the Pegues L’abbe. Contrib.
mineral. Petr.58 (1): 63-81 (1976).
16. Sisson T. W. Hornblende-melt trace-element partitioning
measured by ion microprobe. Chem. Geol, 117 (1): 331-
344 (1994).
17. Sun S. and McDonough W. Chemical and isotopic
systematic of oceanic basalts: Implication for mantle
composition and processes. Geol. Soc, 42 (1): 313-345
(1989).
18. Tatar M., Jackson J., Hatzfeld D., and Bergmen E. The
2004, May 28 Beladeh earthquake (Mw 6.2) in the Alborz,
Iran: overthrusting the South Caspian Basin margin,
partitioning of oblique convergence, and seismic hazard of
Tehran. J. Geophys. Res, 170 (1): 249-261 (2007).
19. Wood D. A. The application of a Th Hf Ta diagram to
problems of tectonomagmatic classification and to
establishing the nature of crustal contamination of basaltic
lavas of the British Tertiary volcanic province. Earth
Planet. Sci. Lett, 50 (1): 11-30 (1980).