HIGH PERFORMANCE STRUCTURAL LIGHTWEIGHT CONCRETE...
116
HIGH PERFORMANCE STRUCTURAL LIGHTWEIGHT CONCRETE UTILIZING NATURAL PERLITE AGGREGATE AND PERLITE POWDER A THESIS SUBMITTED TO THE GRADUATE SCHOOL OF NATURAL AND APPLIED SCIENCES OF MIDDLE EAST TECHNICAL UNIVERSITY BY HASAN ESER IN PARTIAL FULLFILLMENT OF THE REQUIREMENTS FOR THE DEGREE OF MASTER OF SCIENCE IN CIVIL ENGINEERING FEBRUARY 2014
Transcript of HIGH PERFORMANCE STRUCTURAL LIGHTWEIGHT CONCRETE...

HIGH PERFORMANCE STRUCTURAL LIGHTWEIGHT CONCRETE
UTILIZING NATURAL PERLITE AGGREGATE AND PERLITE POWDER
A THESIS SUBMITTED TO
THE GRADUATE SCHOOL OF NATURAL AND APPLIED SCIENCES
OF
MIDDLE EAST TECHNICAL UNIVERSITY
BY
HASAN ESER
IN PARTIAL FULLFILLMENT OF THE REQUIREMENTS
FOR
THE DEGREE OF MASTER OF SCIENCE
IN
CIVIL ENGINEERING
FEBRUARY 2014

ii

iii
Approval of the thesis:
HIGH PERFORMANCE STRUCTURAL LIGHTWEIGHT CONCRETE
UTILIZING NATURAL PERLITE AGGREGATE AND PERLITE POWDER
submitted by HASAN ESER in partial fulfillment of the requirements for the degree
of Master of Science in Civil Engineering Department, Middle East Technical
University by,
Prof. Dr. Canan Özgen _______________
Dean, Graduate School of Natural and Applied Sciences
Prof. Dr. Ahmet Cevdet Yalçıner _______________
Head of Department, Civil Engineering
Assoc.Prof. Dr. Lutfullah Turanlı _______________
Supervisor, Civil Engineering Dept., METU
Examining Committee Members:
Prof. Dr. Mustafa Tokyay _______________
Civil Engineering Dept., METU
Assoc. Prof. Dr. Lutfullah Turanlı _______________
Civil Engineering Dept., METU
Assoc. Prof. Dr. Afşin Sarıtaş _______________
Civil Engineering Dept., METU
Asst. Prof. Dr. Çağla Meral _______________
Civil Engineering Dept., METU
Dr. Okan Cengiz _______________
Expert, TUBITAK
Date: 04.02.2014

iv
I hereby declare that all information in this document has been obtained and
presented in accordance with academic rules and ethical conduct. I also declare
that, as required by these rules and conduct, I have fully cited and referenced all
material and results that are not original to this work.
Name, Last name : Hasan Eser
Signature :

v
ABSTRACT
HIGH PERFORMANCE STRUCTURAL LIGHTWEIGHT CONCRETE
UTILIZING NATURAL PERLITE AGGREGATE AND PERLITE POWDER
Eser, Hasan
M.Sc., Department of Civil Engineering
Supervisor: Assoc. Prof. Dr. Lutfullah Turanlı
February 2014, 96 pages
Structural Lightweight Concrete is generally made by using artificial lightweight
aggregates such as expanded clay, shale and slate. However, rapidly increasing fuel
prices in recent decades and corresponding increase in the production costs of these
aggregates have renewed the interest in natural lightweight aggregates such as pumice,
scoria, rhyolite and perlite.
This study investigates the mechanical properties and durability characteristics of
high-performance lightweight concretes utilizing natural perlite aggregate and perlite
powder in comparison to those of high-strength normal weight concrete of similar
specific strength (structural efficiency). For this purpose, three concrete mixtures have
been designed, namely high-strength lightweight concrete (HSLWC), self-compacting
high strength lightweight concrete (SCLWC) and high-strength normal weight
concrete (HSNWC). An extensive testing program was conducted on concrete
specimens to determine fresh properties such as slump, slump flow, unit weight, air
content and setting time; hardened properties such as compressive strength, splitting
and flexural tensile strength, modulus of elasticity and thermal coefficient of
expansion; durability characteristics such as rapid chloride-ion penetrability,
resistance to aggressive chemical solutions and freezing-thawing resistance.

vi
The results have shown that natural perlite aggregate and perlite powder can be
satisfactorily utilized in the production of self-compacting lightweight concrete with
28-day compressive strengths up to 50 MPa. It is also shown that perlite aggregate
containing high performance lightweight concretes have generally superior or at least
similar durability performance to that of high-strength normal weight concrete of
similar specific strength.
Keywords: high-performance concrete, self-compacting lightweight concrete,
structural lightweight concrete, durability, natural perlite.
vii
ÖZ
HAM PERLİT AGREGASI VE PERLİT TOZU KULLANILARAK YAPILAN
YÜKSEK PERFORMANSLI TAŞIYICI HAFİF BETON
Eser, Hasan
Yüksek Lisans, İnşaat Mühendisliği Bölümü
Tez Yöneticisi: Doç. Dr. Lutfullah Turanlı
Şubat 2014, 96 sayfa
Taşıyıcı hafif beton genellikle genleştirilmiş kil, şist ve arduvaz gibi yapay hafif
agregalar kullanılarak yapılır. Ancak, son on yıllarda hızla artan yakıt fiyatlarına
paralel olarak bu agregaların üretim maliyetlerinin artması, süngertaşı, lav cürufu,
riyolit ve perlit gibi doğal hafif agregalara olan ilgiyi arttırmıştır.
Bu çalışma, doğal perlit agregası ve perlit tozu içeren yüksek performanslı taşıyıcı
hafif betonlar ile benzer özgül dayanımdaki (yapısal verimlilikteki) yüksek dayanımlı
normal ağırlıklı betonların mekanik özelliklerini ve kalıcılıcık karakteristiklerini,
karşılaştırmalı olarak incelemektedir. Bu amaçla üç tip beton karışımı hazırlanmıştır:
yüksek dayanımlı hafif beton (HSLWC), kendiliğinden yerleşen yüksek dayanımlı
hafif beton (SCLWC) ve yüksek dayanımlı normal ağırlıklı beton (HSNWC). Bu
betonların, çökme, çökme akışı, birim ağırlık, hava oranı ve priz süresi gibi taze
özellikleri; basınç dayanımı, yarma ve eğilme gerilmesi dayanımı, elastisite modülü
ve doğrusal ısıl genleşme katsayısı gibi sertleşmiş özellikleri; hızlı klor iyonu
geçirgenliği, agresif kimyasal solüsyonlara karşı dayanıklılığı ve donma-çözülme
direnci gibi kalıcılık özellikleri kapsamlı bir şekilde incelenmiştir.

viii
Çalışma sonuçları, doğal perlit agregası ve perlit tozu kullanılarak 28-günlük basınç
dayanımı 50 MPa’ya ulaşan kendiliğinden yerleşen hafif beton üretilebileceğini
göstermiştir. Ayrıca, perlit agregası içeren yüksek performanslı hafif betonların,
benzer özgül dayanımdaki yüksek dayanımlı normal ağırlıklı betonlardan, genellikle,
üstün ya da en azından yakın kalıcılık performansı gösterdiği ortaya konulmuştur.
Anahtar kelimeler: yüksek performanslı beton, kendiliğinden yerleşen hafif beton,
taşıyıcı hafif beton, kalıcılık, doğal perlit.

ix
To My Family

x
ACKNOWLEDGMENTS
I would like to express sincere gratitude to my supervisor Assoc. Prof. Dr. Lutfullah
Turanlı, for his guidance, recommendations and endless support throughout all the
stages of this thesis.
I am very thankful to Assoc. Prof. Dr. Afşin Sarıtaş for his valuable comments and
suggestions.
Special thanks to my friend Research Assistant M. Kemal Ardoğa for his valuable
support and assistance.
I would like to thank all the staff of Materials of Construction Laboratory, especially
Mr. Cuma Yıldırım for his kind help with the experiments.
I would also like to thank ER-PER Madencilik Müteahhitlik Ltd. Şti, BAŞTAŞ Hazır
Beton Sanayi ve Ticaret A.Ş. and Sika Yapı Kimyasalları A.Ş. for the supply of the
materials used in this research. This research is also financially supported by METU
Office of Revolving Funds Project: 2012-03-03-02-05.
Finally, I would like to thank my family for their never-ending encouragement, support
and patience.

xi
TABLE OF CONTENTS
ABSTRACT ................................................................................................................. v
ÖZ .............................................................................................................................. vii
ACKNOWLEDGMENTS ........................................................................................... x
TABLE OF CONTENTS ............................................................................................ xi
LIST OF TABLES .................................................................................................... xiv
LIST OF FIGURES .................................................................................................... xi
LIST OF ABBREVIATONS .................................................................................... xix
CHAPTERS
1. INTRODUCTION ................................................................................................... 1
1.1. General .............................................................................................................. 1
1.2. Objectives and Scope ........................................................................................ 2
2. BACKGROUND AND LITERATURE REVIEW .................................................. 5
2.1. History of Structural Lightweight Concrete ...................................................... 5
2.1.1. Ancient Applications .................................................................................. 5
2.1.2. Modern Applications .................................................................................. 6
2.2. Properties of Lightweight Aggregates ............................................................... 8
2.2.1. Definition .................................................................................................... 8
2.2.2. Classification .............................................................................................. 8
2.2.3. Internal Structure of Lightweight Aggregates .......................................... 10
2.2.4. Particle Shape and Surface Texture .......................................................... 10
2.2.5. Specific Gravity ........................................................................................ 10
2.2.6. Bulk Density ............................................................................................. 10
xii
2.2.7. Grading ..................................................................................................... 11
2.2.8. Water Absorption Capacity ....................................................................... 12
2.3. Classification of Lightweight Concrete ........................................................... 12
2.3.1. Classification of Lightweight Aggregate Concrete ................................... 13
2.4. Production of Structural Lightweight Concrete ............................................... 14
2.4.1. Mix Design Considerations ....................................................................... 14
2.4.2. Mixing, Placing, Finishing and Curing ..................................................... 16
2.5. Engineering Properties of Structural Lightweight Concrete ........................... 17
2.5.1. Compressive Strength ............................................................................... 17
2.5.2. Tensile Strength ........................................................................................ 18
2.5.3. Elastic Modulus and Poisson Ratio ........................................................... 20
2.5.4. Bond Strength and Development Length .................................................. 20
2.5.5. Abrasion Resistance .................................................................................. 21
2.5.6. Shrinkage .................................................................................................. 21
2.5.7. Creep and Fatigue ..................................................................................... 22
2.5.8. Thermal Properties .................................................................................... 23
2.5.9. Specific Strength ....................................................................................... 24
2.6. Durability Characteristics of Structural Lightweight Concrete ....................... 25
2.7. Economy of Structural Lightweight Concrete ................................................. 27
2.8. Recent Studies on High Performance Lightweight Concrete .......................... 29
2.8.1. High Strength Lightweight Concrete ........................................................ 29
2.8.2. Self-Compacting Lightweight Concrete ................................................... 33
3. EXPERIMENTAL STUDY ................................................................................... 39
3.1. Experimental Program ..................................................................................... 39
3.2. Material Properties .......................................................................................... 40
3.2.1. Portland Cement ........................................................................................ 40
3.2.2. Perlite Powder ........................................................................................... 41

xiii
3.2.3. Natural Perlite Aggregate ......................................................................... 43
3.2.4. Limestone Aggregate ................................................................................ 45
3.2.5. Superplasticizer ......................................................................................... 46
3.3. Experimental Procedures ................................................................................. 46
3.3.1. Preparation of Concrete Specimens .......................................................... 46
3.3.2. Tests on Fresh Concrete ............................................................................ 47
3.3.3. Tests on Hardened Concrete ..................................................................... 53
3.3.4. Durability Tests on Hardened Concrete.................................................... 59
4. RESULTS AND DISCUSSION ............................................................................ 63
4.1. Mix Design and Fresh Properties .................................................................... 63
4.2. Hardened Properties ........................................................................................ 66
4.2.1. Compressive Strength, Density and Specific Strength ............................. 66
4.2.2. Splitting and Flexural Tensile Strength .................................................... 68
4.2.3. Elastic Modulus ........................................................................................ 68
4.2.4. Linear Coefficient of Thermal Expansion ................................................ 72
4.3. Results of Durability Tests .............................................................................. 75
4.3.1. Rapid Chloride Ion Penetrability .............................................................. 75
4.3.2. Specimens in Aggressive Chemical Solutions ......................................... 77
4.3.3. Specimens Exposed to Freezing-Thawing Cycles .................................... 87
5. CONCLUSIONS .................................................................................................... 89
6. RECOMMENDATIONS ....................................................................................... 91
REFERENCES ........................................................................................................... 93

xiv
LIST OF TABLES
TABLES
Table 2.1. Maximum dry loose bulk density requirements of lightweight aggregates
for structural concrete (ASTM C330) ........................................................................ 11
Table 2.2. Grading requirements for lightweight aggregate for structural concrete
(ASTM C330) ............................................................................................................ 11
Table 2.3. Transportation cost analysis for lightweight and normal weight concrete
(ACI Committee 213, 2003) ....................................................................................... 28
Table 3.1. Properties of the CEM I 42.5 R type Portland cement .............................. 40
Table 3.2. Properties of the perlite powder ................................................................ 41
Table 3.3. Compressive strength of mortar cubes utilizing perlite powder as pozzolan
.................................................................................................................................... 42
Table 3.4. Physical properties of natural perlite aggregate ........................................ 43
Table 3.5. Physical properties of limestone aggregate ............................................... 45
Table 3.6. Technical properties of ViscoCrete SF-18 ................................................ 46
Table 3.7. Recommended slumps for various types of construction (ACI Committee
211, 2004) ................................................................................................................... 48
Table 3.8. Slump-flow classes (EFNARC, 2005) ...................................................... 49
Table 3.9. Viscosity classes (EFNARC, 2005) .......................................................... 49
Table 3.10. Visual stability index (ASTM C1611) .................................................... 50
Table 3.11. Correction factor for compressive strength results (ASTM C39) ........... 54
Table 3.12. Qualitative assessment of chloride ion penetrability (ASTM C1202) .... 59
Table 4.1. Mix proportions and fresh properties ........................................................ 63
Table 4.2. Compressive strength, density and specific strength ................................ 66
Table 4.3. Splitting and flexural tensile strength ....................................................... 68

xv
Table 4.4. Modulus of elasticity, compressive strength and density ......................... 69
Table 4.5. The change in gauge length of the specimens in thermal expansion test . 72
Table 4.6. The coefficients of thermal expansion (mm/mm/oC) ................................ 72
Table 4.7. Chloride ion penetrability of concrete specimens ..................................... 75
Table 4.8. Compressive strength of the specimens exposed to freezing-thawing
cycles .......................................................................................................................... 88

xvi
LIST OF FIGURES
FIGURES
Figure 2.1. Stolmen Bridge, Norway (ESCSI, 2010) ................................................... 7
Figure 2.2. Heidrun Tension Leg Platform, North Sea (ESCSI, 2010) ........................ 7
Figure 2.3. Lightweight aggregate spectrum (Mehta & Monteiro, 2006) .................... 9
Figure 2.4. The movement of moisture in external and internal curing (Castro, De la
Varga, Golias, & Weiss, 2010) .................................................................................. 17
Figure 2.5. Creep of moist-cured lightweight concrete with respect to compressive
strength (ACI Committee 213, 2003) ......................................................................... 22
Figure 2.6. Creep of steam-cured lightweight concrete with respect to compressive
strength (ACI Committee 213, 2003) ......................................................................... 23
Figure 2.7. Historical development of structural efficiency of concrete (ACI
Committee 213, 2003) ................................................................................................ 24
Figure 2.8. Microstructure of self-compacting concrete with natural pumice
aggregate (Topçu & Uygunoğlu, 2010) ..................................................................... 36
Figure 2.9. Frequency bar chart for slump-flow of self-compacting lightweight
mixtures (Papanicolaou & Kaffetzakis, 2011) ........................................................... 37
Figure 2.10. Frequency bar chart for 28-day compressive strength of self-compacting
lightweight mixtures (Papanicolaou & Kaffetzakis, 2011) ........................................ 37
Figure 2.11. Relationship between binder content and specific strength (Papanicolaou
& Kaffetzakis, 2011) .................................................................................................. 38
Figure 2.12. Frequency bar chart for specific strength of self-compacting lightweight
mixtures (Papanicolaou & Kaffetzakis, 2011) ........................................................... 38
Figure 3.1. Strength activity index of perlite powder versus time ............................. 42
Figure 3.2. Gradation curve of perlite aggregate ....................................................... 44
Figure 3.3. ASR expansion of perlite aggregate as determined by ASTM C1260. ... 44

xvii
Figure 3.4. Gradation curve of limestone aggregate .................................................. 45
Figure 3.5. Slump cone and measurement of slump (Erdoğan, 2005) ....................... 48
Figure 3.6. Illustration of visual stability index (ASTM C1611) ............................... 50
Figure 3.7. Type B air-meter with vertical air chamber (ASTM C231) .................... 52
Figure 3.8. Concrete setting time testing apparatus ................................................... 53
Figure 3.9. Splitting tension test and stress distribution diagram (Mehta & Monteiro,
2006) .......................................................................................................................... 54
Figure 3.10. Shear and moment diagrams of CPL and TPL ...................................... 55
Figure 3.11. Beam specimen for thermal expansion experiment ............................... 58
Figure 3.12. Measurement of thermal expansion of concrete specimens .................. 59
Figure 3.13. Storage of Concrete Specimens in Aggressive Chemical Solutions ..... 61
Figure 4.1. Slump flow measurement on SCLWC .................................................... 65
Figure 4.2. The development of compressive strength in the concrete specimens .... 67
Figure 4.3. Stress-strain curves up to 40% of ultimate stress (28 days) .................... 69
Figure 4.4. Stress-strain curves up to 40% of ultimate stress (90 days) .................... 70
Figure 4.5. Change in gauge length with temperature change (HSLWC) ................. 73
Figure 4.6. Change in gauge length with temperature change (SCLWC) ................. 73
Figure 4.7. Change in gauge length with temperature change (HSNWC) ................. 74
Figure 4.8. RCPT, total charges passed vs. time (28 days) ........................................ 76
Figure 4.9. RCPT, total charges passed vs. time (90 days) ........................................ 76
Figure 4.10. Change in compressive strength of HSLWC specimens stored in
magnesium sulfate solution ........................................................................................ 77
Figure 4.11. Change in compressive strength of SCLWC specimens stored in
magnesium sulfate solution ........................................................................................ 78
Figure 4.12 Change in compressive strength of HSNWC specimens stored in
magnesium sulfate solution ........................................................................................ 78
Figure 4.13. Surface deterioration of HSLWC specimens stored in magnesium
sulfate solution ........................................................................................................... 79

xviii
Figure 4.14. Surface deterioration of SCLWC specimens stored in magnesium sulfate
solution ....................................................................................................................... 79
Figure 4.15. Surface deterioration of HSNWC specimens stored in magnesium
sulfate solution ........................................................................................................... 80
Figure 4.16. Change in compressive strength of HSLWC specimens stored in sodium
bicarbonate solution ................................................................................................... 81
Figure 4.17. Change in compressive strength of SCLWC specimens stored in sodium
bicarbonate solution ................................................................................................... 81
Figure 4.18. Change in compressive strength of HSNWC specimens stored in sodium
bicarbonate solution .................................................................................................. 82
Figure 4.19. Surface deterioration of HSLWC specimens stored in sodium
bicarbonate solution and interior of concrete tested by phenolphthalein ................... 82
Figure 4.20. Surface deterioration of SCLWC specimens stored in sodium
bicarbonate solution and interior of concrete tested by phenolphthalein ................... 83
Figure 4.21. Surface deterioration of HSNWC specimens stored in sodium
bicarbonate solution and interior of concrete tested by phenolphthalein ................... 83
Figure 4.22. Change in compressive strength of HSLWC specimens stored in
sulphuric acid solution ............................................................................................... 84
Figure 4.23. Change in compressive strength of SCLWC specimens stored in
sulphuric acid solution ............................................................................................... 85
Figure 4.24. Change in compressive strength of HSNWC specimens stored in
sulphuric acid solution ............................................................................................... 85
Figure 4.25. Surface deterioration of HSLWC specimens stored in sulphuric acid
solution ....................................................................................................................... 86
Figure 4.26. Surface deterioration of SCLWC specimens stored in sulphuric acid
solution ....................................................................................................................... 86
Figure 4.27. Surface deterioration of HSNWC specimens stored in sulphuric acid
solution ....................................................................................................................... 87

xix
LIST OF ABBREVIATIONS
ACI : American Concrete Institute
ASR : Alkali-Silica Reaction
ASTM : American Society for Testing and Materials
EFNARC : The European Federation of Specialist Construction Chemicals and
Concrete Systems
EN : European Norms (Standards)
HSLWC : High-Strength Lightweight Concrete
HSNWC : High-Strength Normalweight Concrete
LA : Limestone Aggregate
LWC : Lightweight Concrete
NWC : Normalweight Concrete
PA : Natural Perlite Aggregate
RCPT : Rapid Chloride Permeability Test
SCLWC : Self-Compacting High-Strength Lightweight Concrete
USACE : U.S. Army Corps of Engineers
w/b : water-to-binder ratio
w/c : water-to-cement ratio
w/cm : water-to-cementitious materials ratio

xx

1
CHAPTER 1
INTRODUCTION
1.1. General
High-performance concrete is broadly defined as the concrete which possess one or
more properties superior than that of conventional concrete. These properties may
include high workability, high strength, high elastic modulus, low permeability, high
durability or volume stability, etc. (Kosmatka, Kerkhoff, & Panarese, 2003).
Nevertheless, many of these performance characteristics have one point in common,
which is low w/b ratio (generally below 0.45). Therefore, some researchers define
high performance concrete as “low w/b ratio concrete with optimized aggregate-binder
ratio to control its volume stability and which receives adequate water curing” (Aitcin,
2008, p. 333). This definition looks very much like a recipe for durable concrete.
Indeed, durability is a key factor for high performance and more important than
strength alone to provide a longer service life.
Referring back to broad definition of high performance concrete, high strength
concrete and self-compacting concrete can be classified as high-performance concrete
since they have superior properties over conventional concretes. For example, the
former has high strength and the latter has high workability. Similarly, self-compacting
high strength lightweight concrete, which combines high workability, high strength
and low density is also an example of high performance concrete.
Structural lightweight concrete is generally made by using artificial lightweight
aggregates and usually requires higher binder contents than its normal weight
counterparts in order to reach structural strength levels. In last few decades, rapidly
increasing fuel prices caused the production costs of cement and artificial lightweight
aggregates to increase, both of which are burnt in large kilns in production phase.
Resultantly, the pursuit of lowering production costs has renewed the interest in

2
utilization of natural lightweight aggregates and pozzolans in lightweight concrete
production.
Currently, there are many studies on structural lightweight concrete majority of which
are focusing on those with artificial lightweight aggregates. However, only a limited
number of studies exist with a focus on natural lightweight aggregates and even less
with a focus on natural perlite aggregate. Besides, there is no recorded study on self-
compacting high strength lightweight concrete with natural perlite aggregate and
perlite powder. The literature also lacks the investigation of mechanical properties and
durability characteristics of structural lightweight concretes in comparison to those of
normal weight concretes of similar specific strength (a.k.a. structural or strength
efficiency). In many cases, it is the specific strength of concrete rather than strength
itself which determines its suitability for a particular application. Therefore, a
comparison of concrete properties at similar specific strength is more logical than a
comparison at similar strength.
1.2. Objectives and Scope
There are several objectives of this thesis. First is to design a high strength lightweight
concrete with natural perlite aggregate by using reasonable cement contents. Second
is to design a self-compacting high strength lightweight concrete with natural perlite
aggregate and perlite powder. Finally the third is to compare mechanical properties
and durability characteristics of these high performance lightweight concretes with
those of high-strength normal weight concrete at similar specific strength.
Within the scope of this thesis, an extensive testing program was conducted on
concrete specimens to determine fresh properties such as slump, slump flow, unit
weight, air content and setting time; hardened properties such as compressive strength,
splitting and flexural tensile strength, modulus of elasticity and coefficient of thermal
expansion; durability characteristics such as rapid chloride-ion penetrability,
resistance to some aggressive chemical solutions (sulphuric acid, magnesium sulfate,
sodium bicarbonate) and freezing-thawing resistance.
This thesis consists of six chapters. Chapter 1 introduces the research topic and
objectives of this study. Chapter 2 provides background information about structural
lightweight concrete and presents a literature review of recent studies on high-strength
lightweight concretes and self-compacting lightweight concretes. Chapter 3 presents

3
experimental program, briefly summarizes testing procedures and related issues. The
detailed properties of materials used for the designed concretes are also provided in
this chapter. Chapter 4 presents the experimental results and discusses findings in
detail. Chapter 5 concludes the thesis by highlighting the findings of the research and
finally Chapter 6 includes suggestions about further research topics.

4

5
CHAPTER 2
BACKGROUND AND LITERATURE REVIEW
2.1. History of Structural Lightweight Concrete
2.1.1. Ancient Applications
Known history of the lightweight concrete starts more than 2 thousand years ago in
the Roman Empire. The most significant examples of that time were the Port of Cosa,
the Pantheon Dome and the Coliseum (ACI Committee 213, 2003).
The Port of Cosa was built on the west coast of Italy, in 273 B.C. The designers of the
port were aware of the fact that lightweight aggregates were more convenient to use in
marine structures. Instead of using locally available aggregates (beach sand and gravel)
for the construction, the builders have brought natural lightweight aggregates (pumice
and scoria) from the volcanic resources located at 40 km away. The harbor consists of
four piers, which had resisted the forces of nature except the surface abrasion for
almost 2 thousand years and it is now abandoned only due to siltation (ACI Committee
213, 2003).
The construction of the Pantheon was completed in 27 B.C. It has a doom with a
diameter of 43.3 m which was the highest record for almost 2 thousand years. The
builders used the lightweight aggregates of varying densities in descending order from
the base to the top of the doom. In other words, higher density aggregates were used
near the base where the stresses are higher; and lower density aggregates were used
near the top where the stresses are lower. When the doom was first constructed, it had
a metal cover which was soon removed to be used for another structure. Until it was
covered with a lead roof recently, it had been exposed to the forces of nature for
hundreds of years (Holm & Bremner, 2000). Even today, the Pantheon is still in use
for spiritual purposes (ACI Committee 213, 2003).

6
The Coliseum, which is an ancient amphi-theater of massive size with a 50 thousand
seating capacity, was constructed in 75 to 80 A.D. The foundation of the Coliseum
was made of a lightweight concrete utilizing crushed volcanic lava as aggregate.
Similarly, the aggregates used in its walls were made of porous, crushed bricks. The
spaces and the vaults between the walls were made of porous-tufa cut stone (ACI
Committee 213, 2003).
2.1.2. Modern Applications
The use of lightweight aggregates after the Romans was limited. This was changed
when manufactured lightweight aggregates became commercially available in 20th
century (ACI Committee 213, 2003). In 1918, Stephen J. Hyde, a ceramic engineer,
patented the process of producing lightweight aggregates through heating and
expanding shale, clay or slate in a rotary kiln. At first, the expanded aggregates were
used in the construction of concrete ships for U.S. fleet. Later, expanded aggregates
started to be used for civilian construction sector.
The first commercial plant for expanded aggregate production was founded in Kansas,
in 1920. In 1923, Dan Servey initiated the first production of lightweight concrete
masonry units. In 1929, the use of lightweight concrete jumped to high rise
construction. 14 additional story were added to the existing 14-story building of South
Western Bell Telephone Office by using lightweight concrete (Holm & Bremner,
2000).
Starting from the second half of the 20th century, many multistory buildings were
constructed by using structural lightweight concrete. Examples are 42-story Prudential
Life Building (Chicago) with lightweight concrete floors and 18-story Statler Hilton
Hotel (Dallas) with all lightweight concrete frame and flat plate floors (ACI
Committee 213, 2003).
Today, the applications of structural lightweight concrete extended not only to high-
rise buildings but also bridges and marine structures. Stolmen Bridge and Heidrun
Tension Leg Platform are significant examples of recent applications.

7
Stolmen Bridge (Figure 2.1) was built in Norway in 1998. It has a main span length of
301 m and total length of 467 m, which is world record (2000) for free-cantilever
concrete bridges. The 184 m portion in the middle of the main span was constructed
with high-strength lightweight concrete. In the construction of the Stolmen Bridge,
1600 m3 lightweight concrete was used. The 28-day mean compressive cube strength
was 70.4 MPa and the mean density of 28-day water cured specimens was 1940 kg/m3
(ESCSI, 2010).
Figure 2.1. Stolmen Bridge, Norway (ESCSI, 2010)
Figure 2.2. Heidrun Tension Leg Platform, North Sea (ESCSI, 2010)

8
Heidrun Tension Leg Platform (Figure 2.2) was built in 1995 at Heidrun field of the
North Sea, where water depth is 345 m. It is the largest floating concrete structure
carrying the largest deck load recorded (2000). In the construction of the Heidrun
Tension Leg Platform, 65700 m3 lightweight concrete was used. Job specifications
required a compressive strength more than 70 MPa and a maximum density of 1950
kg/m3 for cast in place concrete and 2000 kg/m3 for slipformed concrete (ESCSI,
2010).
2.2. Properties of Lightweight Aggregates
2.2.1. Definition
Aggregates with an oven-dry particle density less 2000 kg/m3 or an oven-dry loose
bulk density less than 1200 kg/m3 are called as lightweight aggregates according to
EN206-1:2000. ASTM C330 also defines a maximum limit for the bulk density, which
is 1120 kg/m3 and 880 kg/m3 for fine and coarse lightweight aggregate, respectively.
2.2.2. Classification
Lightweight aggregates are divided into two categories according to their sources:
1. Natural Lightweight Aggregates
2. Manufactured(Synthetic) Lightweight Aggregates
Natural lightweight aggregates are obtained by processing volcanic rocks. Pumice,
scoria, tuff and perlite are some of the examples which fall in this category. Pumice is
a light colored porous glass with elongated voids. Scoria is a dark colored porous glass
with spherical voids. Tuff is a porous glass formation of consolidated volcanic ash.
Perlite is a porous glass with a high silica content. It generally contains 2-5% water
(Mehta & Monteiro, 2006).
Synthetic lightweight aggregates are expanded forms of materials such as clay, shale,
slate, perlite and vermiculite, produced by heat treatment, generally around 1000oC.
The materials are either reduced to desired size before calcination or crushed after the
calcination process. The expansion results from the entrapment of gases, which are
generated during heat treatment, inside the processed material. The use of initially
pelletized materials in heat treatment process produces spherical aggregate particles
with a semi-impervious coating having 12-30% lower water absorption capacity than
the particles produced of unpelletized material. Therefore, coated particles are

9
preferable from workability point of view, however they are more expensive than
uncoated ones (Neville & Brooks, 2010).
An interesting point to discuss is that perlite can expand up to 20 times (Aşık, 2006)
and vermiculite can expand up to 30 times (Neville, 2003) of its uncalcined volume
when heat treated. Resultantly, expanded perlite and vermiculite have a very low
density and strength and used for insulation purposes. On the other hand, lightweight
aggregates which have relatively higher densities such as expanded shale, clay and
slate are used for structural lightweight concrete.
In Figure 2.3, lightweight aggregate spectrum showing unit weight of various
lightweight aggregates and corresponding unit weight of concretes is given.
Figure 2.3. Lightweight aggregate spectrum (Mehta & Monteiro, 2006)

10
2.2.3. Internal Structure of Lightweight Aggregates
Lightweight aggregates have cellular or porous internal structure and resultantly have
low specific gravity. In structural lightweight aggregates, these pores are uniformly
distributed in relatively crackless vitreous material and its size varies between 5 and
300 m. Surface pores are permeable and easily fill by exposure to moisture in a few
hours. Interior pores are less permeable. Saturation of the interior pores progresses
very slowly and can take months. A certain fraction of interior pores are disconnected,
thus remains unsaturated for many years (Holm & Bremner, 2000).
2.2.4. Particle Shape and Surface Texture
The particle shape and surface texture of aggregates may significantly vary with the
source of the aggregate and method of production (Holm & Bremner, 2000). The
particles may have cubical, rounded, angular or irregular shape. The surface texture of
the particles may be smooth with fine pores or rough and irregular with large pores.
Workability, binder content, water requirement, fine-to-coarse aggregate ratio are
directly affected by the particle shape and surface texture of the aggregates.
2.2.5. Specific Gravity
As previously mentioned, lightweight aggregates are lighter than normal weight
aggregates due to porous internal structure. The specific gravity of lightweight
aggregates is practically about 1/3 to 2/3 of normal weight aggregates. Contrary to
normal weight aggregates, fine particles of lightweight aggregates have higher specific
gravity than coarse particles from the same source. This is mainly due to elimination
of larger pores during crushing (Neville & Brooks, 2010). The amount of difference
between the specific gravity of fine and coarse particles varies with the method of
production (ACI Committee 213, 2003).
2.2.6. Bulk Density
Bulk density of lightweight aggregates are measured in dry-loose form and it is
fundamentally proportional to specific gravity for same grading and particle shape. For
different particle shapes, for example, dry-loose bulk density of angular and rounded
particles of same specific gravity may show 80 kg/m3 or more difference (ACI
Committee 213, 2003). In Table 2.1, maximum limits for dry-loose bulk density of
structural lightweight aggregates are given.

11
Table 2.1. Maximum dry loose bulk density requirements of lightweight aggregates
for structural concrete (ASTM C330)
Size Designation Maximum Dry Loose
Bulk Density (kg/m3)
Fine aggregate 1120
Coarse aggregate 880
Combined fine and coarse aggregate 1040
2.2.7. Grading
The fact that specific gravity of lightweight aggregates increases with the decreasing
particle size contrary to normal weight aggregates, necessitates modification on the
grading requirements stated in ASTM C33, in order to fit same volumetric distribution
of materials retained on each sieve. This modified gradation is given in ASTM C330,
as shown in Table 2.2. The manufacturers generally stock aggregates in a number of
standard sizes such as coarse, intermediate and fine, rather than sieve by sieve
categorization. By combining fractions of commercially available sizes, grading
requirements can be met.
Table 2.2. Grading requirements for lightweight aggregate for structural concrete
(ASTM C330)

12
2.2.8. Water Absorption Capacity
The 24 hour water absorption capacity of lightweight aggregates vary between 5 to
25% by dry mass depending on the pore system of the aggregate, whereas it is less
than 2% for most of the normal weight aggregates (ACI Committee 213, 2003). For
lightweight aggregates of satisfactory quality, absorption capacity is generally under
15% (Neville & Brooks, 2010). Absorption capacity and rate of absorption is
especially important for mix design calculations to correctly establish w/c ratio, which
controls workability, strength and permeability characteristics of the concrete. The mix
design considerations related to water absorption will be discussed in detail in
subchapter 2.4.
2.3. Classification of Lightweight Concrete
According to method of production, lightweight concretes are divided into three
(Neville & Brooks, 2010):
a) Utilizing aggregates with low specific gravity: lightweight aggregate
concrete
b) Introducing large voids within concrete or mortar body: aerated, cellular,
foamed or gas concrete
c) Utilizing only coarse aggregates to provide large interstitial voids: no-fines
concrete
In all of the methods above, the lightness of the concrete is achieved by introducing
voids into system, whether by porous aggregates or voids in mortar, or interstitial voids
between coarse aggregates. It may be argued that increase in porosity of a material is
accompanied by strength reduction. For example, this could be problematic for
structural concrete where high strength is necessary. On the other hand, the reduction
in thermal conductivity due to increased porosity is advantageous for insulating
concrete, where high strength is not required. Therefore, the performance assessment
of lightweight concretes should be based on its area of application.
The scope of this thesis covers only lightweight aggregate concrete, classification of
which is discussed in next section.

13
2.3.1. Classification of Lightweight Aggregate Concrete
ACI Committee 213 (1987) classifies lightweight aggregate concrete under three
categories, which are low density concrete, moderate strength concrete and structural
concrete:
Low density concrete is made by highly expanded aggregates such as expanded perlite
and vermiculite. Its 28 day air dry unit weight is generally less than 800 kg/m3 and its
compressive strength ranges between 0.69 and 6.89 MPa. Owing to its low thermal
conductivity, it is used for insulation purposes.
Moderate strength concrete is made by natural lightweight aggregates such as pumice
and scoria. Its 28 day air dry unit weight is generally less than 1440 kg/m3 and its
compressive strength ranges between 6.89 and 17.24 MPa. It is mainly used as fill
concrete.
Structural Lightweight Concrete is generally made by expanded forms of shale, clay,
slate, slag or fly ash aggregate. Its 28 day air dry unit weight is generally between 1140
and 1850 kg/m3, and its compressive strength should be higher than 17.2 MPa.
According to new definition by ACI Committee 213 (2003), structural lightweight
concrete is the one with an air-dry equilibrium density between 1120 and 1920 kg/m3,
and having a 28-day compressive strength higher than 17 MPa. In the case of a 28-day
compressive strength of 40 MPa or higher, it is defined as high-strength lightweight
concrete.
In the State of Art Report by U.S. Army Corps of Engineers (USACE), another
definition for high strength lightweight concrete is given. According to this report,
lightweight concretes having compressive strength higher than 35 MPa are defined as
high strength provided that maximum equilibrium density should be less than 2000
kg/m3 (Holm & Bremner, 2000).
The European Standard EN-206-1:2000 also have a definition for lightweight
concrete. In this standard, maximum density for lightweight concrete is defined as
2000 kg/m3 in oven dry condition. This corresponds approximately to 2050 kg/m3 in
air dry condition. In addition, this standard defines high strength limit as 50 MPa.
14
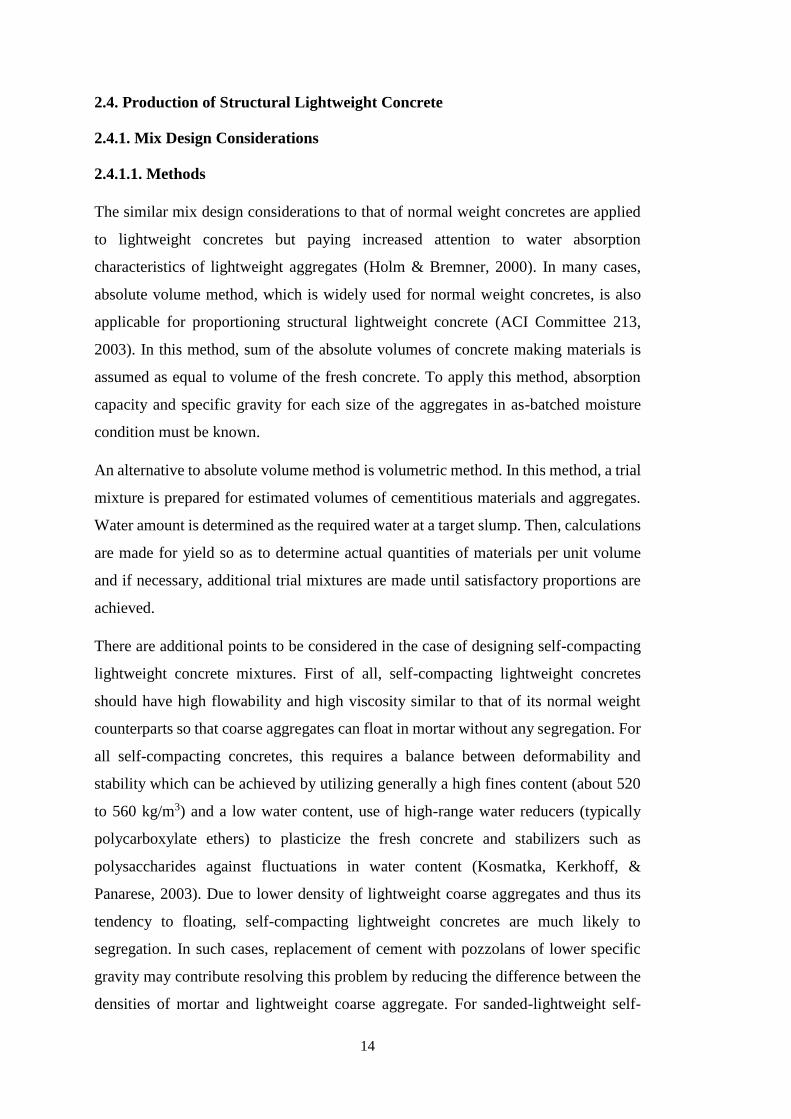
2.4. Production of Structural Lightweight Concrete
2.4.1. Mix Design Considerations
2.4.1.1. Methods
The similar mix design considerations to that of normal weight concretes are applied
to lightweight concretes but paying increased attention to water absorption
characteristics of lightweight aggregates (Holm & Bremner, 2000). In many cases,
absolute volume method, which is widely used for normal weight concretes, is also
applicable for proportioning structural lightweight concrete (ACI Committee 213,
2003). In this method, sum of the absolute volumes of concrete making materials is
assumed as equal to volume of the fresh concrete. To apply this method, absorption
capacity and specific gravity for each size of the aggregates in as-batched moisture
condition must be known.
An alternative to absolute volume method is volumetric method. In this method, a trial
mixture is prepared for estimated volumes of cementitious materials and aggregates.
Water amount is determined as the required water at a target slump. Then, calculations
are made for yield so as to determine actual quantities of materials per unit volume
and if necessary, additional trial mixtures are made until satisfactory proportions are
achieved.
There are additional points to be considered in the case of designing self-compacting
lightweight concrete mixtures. First of all, self-compacting lightweight concretes
should have high flowability and high viscosity similar to that of its normal weight
counterparts so that coarse aggregates can float in mortar without any segregation. For
all self-compacting concretes, this requires a balance between deformability and
stability which can be achieved by utilizing generally a high fines content (about 520
to 560 kg/m3) and a low water content, use of high-range water reducers (typically
polycarboxylate ethers) to plasticize the fresh concrete and stabilizers such as
polysaccharides against fluctuations in water content (Kosmatka, Kerkhoff, &
Panarese, 2003). Due to lower density of lightweight coarse aggregates and thus its
tendency to floating, self-compacting lightweight concretes are much likely to
segregation. In such cases, replacement of cement with pozzolans of lower specific
gravity may contribute resolving this problem by reducing the difference between the
densities of mortar and lightweight coarse aggregate. For sanded-lightweight self-

15
compacting concrete, it is also beneficial to replace the normal-weight fine aggregates
with lightweight sand.
2.4.1.2 Effect of Absorption Capacity and Rate of Absorption
For lightweight aggregates with high absorption capacity (10-20%), the relationship
between strength and w/c ratio cannot be efficiently established for lightweight
concrete mix design since it is difficult to determine how much of the mixing water
will be absorbed by aggregate and even more difficult when the fact that absorption
can continue for several weeks is considered (Mehta & Monteiro, 2006). Therefore,
instead of w/c based estimation of compressive strength, cement content at a specified
slump value is more logical for mix design purposes.
Another concern is related to rate of absorption. At the time of mixing, if aggregate is
in dry condition, it will quickly absorb water and workability of mix will drop
correspondingly. This can be solved by mixing the aggregate with at least one-half of
the mixing water before the addition of binding medium (Neville & Brooks, 2010).
However, this solution have both positive and negative consequences. The absorbed
water in the aggregate, which is not immediately available for hydration, will provide
continued hydration -internal curing- after external curing period has ended (Holm &
Bremner, 2000). On the other hand, it will increase concrete density and reduce
thermal insulation (Neville & Brooks, 2010).
2.4.1.3. Effect of Air Entrainment
Likewise normal weight concrete, air entrainment contributes to durability of
lightweight concrete by reducing permeability and increasing freezing-thawing
resistance. In addition to durability improvements, it also improves workability by
reducing water requirement at a specified slump. Thus, it reduces tendency to bleeding
and segregation. The reduction in water requirement will also reduce w/c ratio, which
resultantly compensate, to an extent, the strength reduction accompanied by air-
entrainment. The reduction in strength due to air-entrainment will also be less than that
of normal weight concrete because of elastic compatibility between lightweight
aggregate and binder phase (Holm & Bremner, 2000). It is a common practice to use
air-entrainment in lightweight concrete regardless of durability concerns (ACI
Committee 213, 2003).

16
2.4.2. Mixing, Placing, Finishing and Curing
To achieve the planned volume of fresh concrete and avoid slump loss during
transport, prewetting of lightweight aggregates must be applied before adding other
constituents into mixer. However, the saturation of lightweight aggregates cannot be
fully achieved, unless prewetting is done by means of pressurized water. Therefore,
the measured fresh density of lightweight concrete is approximately 100-120 kg/m3
lower than the theoretical fresh density (Neville, 2003).
Avoiding segregation is the most important concern in handling and placing of
concrete. For satisfactory placement of lightweight concrete; workable fresh mixture
with a minimum water content, equipment capable of swiftly moving the concrete,
proper consolidation and quality workmanship are required (ACI Committee 213,
2003). A well-designed lightweight concrete mixture generally requires less effort for
placing and finishing than normal weight concrete. For example, a slump of 50-75 mm
could be sufficient to obtain similar workability in normal weight concrete mixture
with a slump of 100-125 mm (Mehta & Monteiro, 2006).
Overvibration of lightweight concrete can drive heavier mortar to downward, which is
required at the surface for finishing operations. Therefore, excessive vibration or
working of lightweight concrete should be avoided. For satisfactory finishing of
lightweight concrete floors, finishing operations should start after free surface bleeding
water is evaporated. Use of magnesium, aluminum or other quality finishing tools are
also recommended (ACI Committee 213, 2003).
Followed by completion of finishing operations, curing should be started immediately.
However, until bleeding is stopped, membrane-forming curing compounds should not
be used (Holm & Bremner, 2000). Lightweight aggregate concretes have more
tolerance to inadequate curing than normal weight concretes, due to internal curing
provided by absorbed water in lightweight aggregates. Internal curing is more
important for high performance concrete mixtures containing pozzolan, particularly
when w/cm is less than 0.45. This is because, relatively impermeable nature of low
w/cm mixtures avoids external curing moisture to penetrate into concrete (ACI
Committee 213, 2003). This phenomenon has been illustrated in Figure 2.4.

17
Figure 2.4. The movement of moisture in external and internal curing (Castro, De la
Varga, Golias, & Weiss, 2010)
2.5. Engineering Properties of Structural Lightweight Concrete
2.5.1. Compressive Strength
In general, the compressive strength of structural lightweight concrete is affected by
similar factors to that of normal weight concretes such as water-cement ratio, cement
content, air content, curing etc. The differences are only due to the properties of the
lightweight aggregate and its interaction with the binding phase. Therefore, the effect
of aggregate related concepts such as elastic compatibility, maximum strength ceiling
and contact zone should be comprehended.
2.5.1.1. Elastic Compatibility
Concrete can be considered as a two-phase material, namely the combination of mortar
and coarse aggregate. Mortar phase includes fine aggregate, cement, water, admixtures
and air. In lightweight aggregate concrete, elastic modulus of these two phases are
much closer to each other when compared to normal weight concrete, which results in
a relatively more homogeneous stress distribution and reduced stress concentration.
Contrary to normal weight concrete, the addition of air-entrainment in structural

18
lightweight concrete will further increase the elastic compatibility of these phases by
reducing the stiffness of the mortar phase. This fact explains why the strength
reduction accompanied by air-entrainment is generally less significant in lightweight
concrete than in normal weight concrete (Holm & Bremner, 2000).
2.5.1.2. Maximum Strength Ceiling
The term “strength ceiling” can be defined as the point at which increase in the content
or quality (w/b) of the binder yields to only minor improvements in concrete strength.
In other words, at strength ceiling of a concrete, it is the strength of coarse aggregate
or quality of the transition zone which will determine the maximum strength of the
concrete (Holm & Bremner, 2000). There are two methods of increasing maximum
strength ceiling, which are reducing maximum aggregate size and incorporating
pozzolans in concrete. Firstly, as the size of the aggregate decreases, the porosity of
the aggregate also decreases and resultantly the strength of the aggregate increases.
Secondly, using supplementary cementitious materials in concrete results in
densification of transition zone through pozzolanic reaction. Therefore, it is a common
practice to limit maximum aggregate size and to use pozzolan in high strength
lightweight concretes.
2.5.1.3. Contact Zone
The contact zone in lightweight aggregate concretes are improved due to several
reasons. First of all, the surface of lightweight aggregate exposed to high temperatures
either in production plants or naturally during volcanic activity yields in pozzolanic
reactivity at transitional zone. Secondly, surface roughness of lightweight aggregates
provide better bonding between cement paste and aggregate phases (Holm & Bremner,
2000). Thirdly, cement paste can penetrate into aggregate’s surface pores and further
enhances the bond between two phases (Al-Khaiat & Haque, 1999). These physical
and chemical interactions between cement paste and aggregate influences the overall
strength of lightweight aggregate concrete.
2.5.2. Tensile Strength
In general, tensile strength of concrete is considered as a function of compressive
strength. However, this assumption do not take into account neither the strength and
surface characteristics of aggregate nor the moisture content of concrete and its

19
distribution. The effect of moisture condition and its distribution is more pronounced
while determining the splitting tensile strength of lightweight aggregate concrete.
According to ASTM C496, splitting tensile test is applied on lightweight concrete
specimens which undergo 7 days of moist curing followed by 21 days of air-drying at
50% relative humidity. On the other hand, specimens of normal weight concrete is
tested in moist condition after continuous moist curing. For normal weight concrete,
testing specimens in moist condition gives more conservative results than testing in
air-dry condition. However, for lightweight concrete, this is vice versa. The reason of
this distinction is that moisture loss progresses slowly into the interior zones of
lightweight concrete members and creates tensile stresses at the exterior zones, thus
reduces the tensile resistance to external loading. Therefore, the tensile strength of
lightweight concrete specimens that undergo some drying before testing show better
correlation with field behaviour (Holm & Bremner, 2000).
Shear, torsion, anchorage, bond strength, and crack resistance are also related to tensile
strength, which is determined by tensile strength of the coarse aggregate and mortar as
well as the strength of the bond between these phases (Holm & Bremner, 2000). In
normal weight concrete, when mortar matrix cracks, strong and intact normal weight
coarse aggregates will continue to provide post-elastic strain capacity and resist
splitting. This is almost the same for lightweight concretes with normal strength levels
(20-35 MPa), where tensile strength and elastic rigidity of mortar and coarse aggregate
phases are relatively close. However, in high strength lightweight concrete, mortar
matrix is much stronger than the coarse aggregate. Resultantly, there may be only a
slight contribution to post elastic strain capacity by lightweight coarse aggregate.
Therefore, the correlations based on tensile strength in design codes which are
normally established for normal weight concrete may not be valid for high strength
levels of lightweight concrete due to its relatively lower post elastic strain capacity. It
will be safer to limit the maximum strength levels for which the ACI 318 requirements
govern shear, tension, torsion, development lengths, and seismic parameters to
concrete compressive strengths no greater than 35 MPa unless compressive testing
programs conducted on concretes with specific combinations of aggregates prove
adequate performance at higher strength levels (Holm & Bremner, 2000).

20
Tensile and shear strength of lightweight concretes may be assumed to vary from 75
to 85 percent that of normal weight concrete, for all-lightweight and sanded
lightweight concrete respectively (Holm & Bremner, 2000).
The flexural strength test is another indirect method to determine tensile strength of
concrete. Hoff (1992) reported that flexural strength of high strength lightweight
concretes was approximately 2/3 and 3/2 of the splitting tensile strength respectively
for dry cured and moist cured specimens (as cited in Holm & Bremner, 2000).
2.5.3. Elastic Modulus and Poisson Ratio
Elastic modulus of concrete is governed by the elastic modulus of each constituents
and their fractions in the mixture. Elastic modulus of lightweight concrete is lower
than that of normal weight concrete, mainly due to lower rigidity of lightweight
aggregates. It generally varies from 50 to 75 percent that of normal weight concrete at
the same strength. Although there are some formulas suggested to estimate modulus
of elasticity, actual results may deviate up to 25 percent due to variations in moisture
content, aggregate type, etc. (Holm & Bremner, 2000).
Testing programs by resonance methods (Reichard, 1964) have shown that Poisson’s
ratio of lightweight concrete to be affected slightly by age, strength and aggregate type
and varies from 0.16 to 0.25 (as cited in ACI Committee 213, 2003). Testing programs
by static method also yielded in similar values of Poisson’s ratio (ACI Committee 213,
2003). Generally, Poisson’s ratio is assumed as 0.20 for practical design purposes.
2.5.4. Bond Strength and Development Length
Structural lightweight concrete has lower bond-splitting and post-elastic strain
capacity due to lower aggregate strength compared to normal weight concrete (Holm
& Bremner, 2000). This difference is more pronounced at higher strength levels.
Therefore, design codes generally requires longer development lengths for structural
lightweight concretes. For example, ACI 318 suggests to increase development length
by a factor of 1.3 for structural lightweight concretes with unspecified splitting tensile
strength. However, this increase may not be sufficient where closely spaced and larger
diameter prestressing strands are used. Testing programs are advised for use of high
strength lightweight concrete in special structures such as long span bridges and major
offshore platforms (ACI Committee 213, 2003).

21
2.5.5. Abrasion Resistance
The strength, hardness and toughness of the cement paste, aggregates and bond
between them determines the abrasion resistance of the concrete. Most of the structural
lightweight aggregates are formed by solidified glassy material, hardness of which
corresponds approximately to quartz on Moh’s scale of hardness (hardness number 7).
On the other hand, due to porous internal structure, impact resistance of lightweight
aggregates are less than that of most of the normal weight aggregates. Structural
lightweight concretes used on bridge decks exposed to heavy traffic load including
trucks have shown satisfactory performance comparable to that of normal weight
concretes, though, it may be necessary to set some limitations in applications where
steel-wheeled vehicles are used (Holm & Bremner, 2000).
2.5.6. Shrinkage
Concrete shrinkage in general, is governed by shrinkage characteristics of cement
paste, internal restraint provided by aggregate, aggregate volume ratio and ambient
humidity and temperature. Aggregate properties such as particle shape and absorption
capacity also affect the shrinkage by affecting the water requirement of the mixture.
In general, structural lightweight concrete has slightly higher shrinkage than that of
the normal weight concrete with similar cement paste volume, due to lower stiffness
of lightweight aggregates. On the other hand, shrinkage strain develops slowly in
lightweight concrete and reaching an equilibrium condition takes more time due to
internal curing (Holm & Bremner, 2000).
Curing methodology has a significant effect on drying shrinkage of lightweight
concrete. Specimens cured with 1 day of steam and 6 days moist curing before
exposure in laboratory conditions show approximately 20 percent less shrinkage strain
than the standard 7-day moist-cured specimens (Holm & Bremner, 2000).
As stressed by Kulka and Polivka (1978), shrinkage and creep of concrete in real
structures is much smaller than laboratory specimens. For example, when designing a
lightweight concrete bridge, the shrinkage and creep values were reduced from the
laboratory test results approximately 15-20 percent due to the size effect of the
member, 10-20 percent due to the ambient humidity, and 10-15 percent due to the

22
reinforcement, which corresponds approximately 50 percent reduction at total (as cited
in Mehta & Monteiro, 2006).
2.5.7. Creep and Fatigue
Creep characteristics of a concrete is mainly determined by aggregate characteristics,
cement paste volume fraction, curing method, age of concrete at the start of loading
and the ratio of applied stress to strength and to a lesser extent, by other factors such
as air-entrainment, specimen or member size and ambient humidity (Holm & Bremner,
2000). Creep can either be beneficial for the cases where stress concentrations are
reduced by transfer of stress through creep, or detrimental by causing excessive
deflections, prestress loss and loss of camber (ACI Committee 213, 2003).
As inferred from Figure 2.5 and 2.6, specifying higher design strength values and
preferring steam curing to moist curing are very effective ways of reducing the creep
of structural lightweight aggregate concrete.
Figure 2.5. Creep of moist-cured lightweight concrete with respect to compressive
strength (ACI Committee 213, 2003)

23
Figure 2.6. Creep of steam-cured lightweight concrete with respect to compressive
strength (ACI Committee 213, 2003)
There are several studies that investigated the fatigue behaviour of lightweight
concrete. Gray and McLaughlin (1961) have reported that fatigue characteristics of
lightweight concrete is similar to that of normal weight concrete and do not vary
considerably despite the large variations in strength (as cited in Holm & Bremner,
2000). Hoff (1994), after reviewing many studies conducted throughout North
America and Europe, concluded that fatigue performance of high strength lightweight
concrete is similar to that of high strength normal weight concrete and frequently
provides longer service life under fatigue (as cited in Holm & Bremner, 2000).
2.5.8. Thermal Properties
The coefficient of thermal expansion is governed by expansion characteristic of
aggregates, volume proportions of constituents and moisture content of the concrete
(Holm & Bremner, 2000). In general, the coefficient of thermal expansion of
lightweight concrete is lower than that of normal weight concrete (Neville, 2003).
Depending on the type of the aggregate used, the coefficient of thermal expansion of
lightweight aggregate concrete varies from 7 ×10⁻⁶ to 11 ×10-6 mm/mm/oC. In
comparison, the coefficient of thermal expansion for normal weight concrete varies
from 6 ×10⁻⁶ to 9×10⁻⁶ mm/mm/oC for those with limestone aggregates and 9×10⁻⁶ to
13 ×10-6 mm/mm/oC for those with siliceous aggregates (ACI Committee 213, 1987).
24
It can be inferred that concretes with siliceous aggregates have a tendency to show
greater expansion than those with limestone.
Thermal conductivity of structural lightweight concrete is about one half of normal
weight concrete due to porous nature of lightweight aggregates. Replacement of
normal weight sand with lightweight fine aggregates significantly reduces the thermal
conductivity of sanded-lightweight concrete. For example, typical thermal
conductivity of concretes with all expanded clay aggregate is about 2/3 of the concretes
with expanded clay coarse aggregate with natural sand (Mehta & Monteiro, 2006).
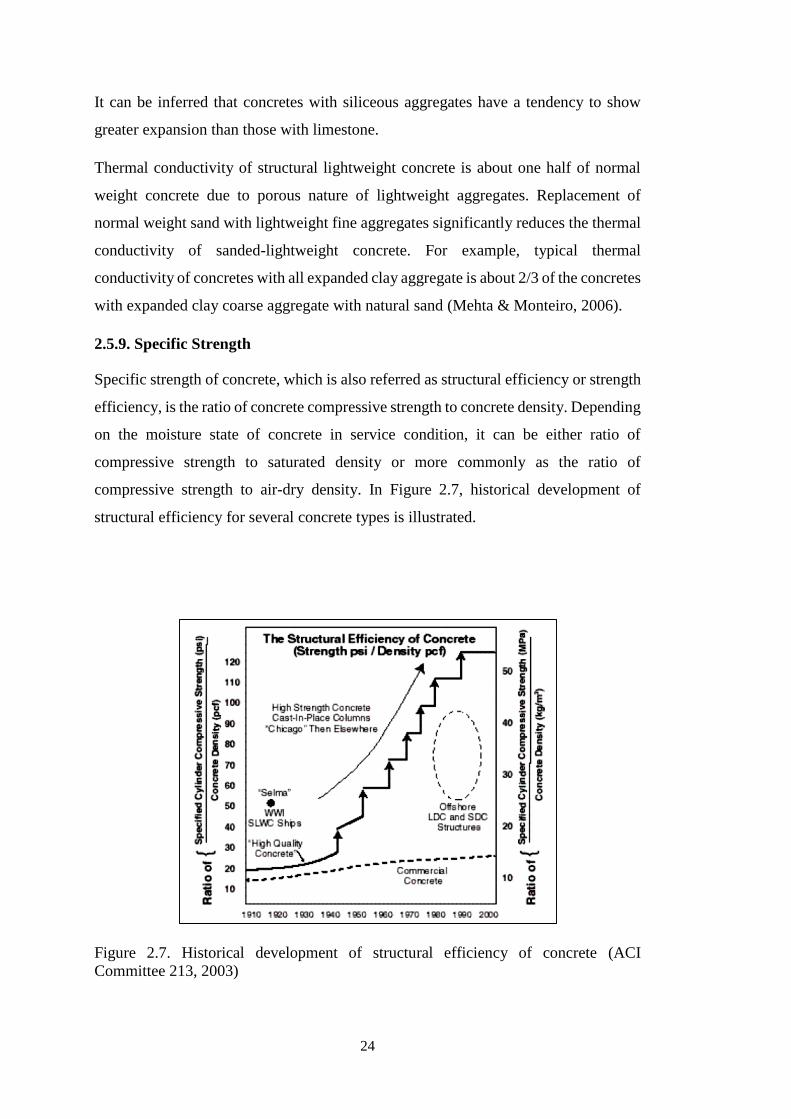
2.5.9. Specific Strength
Specific strength of concrete, which is also referred as structural efficiency or strength
efficiency, is the ratio of concrete compressive strength to concrete density. Depending
on the moisture state of concrete in service condition, it can be either ratio of
compressive strength to saturated density or more commonly as the ratio of
compressive strength to air-dry density. In Figure 2.7, historical development of
structural efficiency for several concrete types is illustrated.
Figure 2.7. Historical development of structural efficiency of concrete (ACI
Committee 213, 2003)

25
As shown in the Figure 2.7, structural lightweight concretes have been highly efficient
compared to that of commercial normal weight concrete from past to present. For
example, the structural efficiency of lightweight concrete used in USS Selma, which
is a ship built in World War I, was only reached almost 40 years after by high strength
normal weight concretes. Structural efficiency of concrete has been significantly
improved since 1950s, mainly due to use of new generation high range water-reducing
admixtures and high-quality pozzolans such as fly ash, metakaolin and silica fume
although the first major breakthrough is by use of lightweight aggregates in concrete
ships (ACI Committee 213, 2003). Today, structural efficiency of lightweight concrete
lies between commercial concrete and high-strength concrete.
2.6. Durability Characteristics of Structural Lightweight Concrete
As with normal weight concrete, durability of the structural lightweight concrete is
directly affected by its permeability. In general, concrete permeability is affected by
many factors such as w/b ratio, cement type, curing, maturity of concrete, etc. The
permeability of concrete as a whole is considerably higher than that of its components,
namely the mortar matrix and coarse aggregates. According to Mehta (1986), this is
mainly the result of microcracks caused by the elastic mismatch between these
components responding differently to temperature changes, service loads and volume
changes due to chemical reactions within concrete (as cited in ACI Committee 213,
2003).
Due to similar rigidities of mortar matrix and lightweight coarse aggregate (elastic
compatibility), there are reduced number of microcracks observed in contact zone of
lightweight concrete compared to that of normal weight concrete, which in turn results
in lower permeability. In addition to this, hygrol equilibrium and pozzolanic reaction
are two factors also contributing to improvement of the contact zone in lightweight
concrete (ACI Committee 213, 2003).
Hygrol equilibrium can be defined as a state at which aggregate surface and mortar
matrix have similar water concentration. In normal weight concrete, mixing water
accumulates on the surface of the dense aggregate (wall effect) and increases local
water-cement ratio, causing porous matrix at the contact zone. In contrast, porous
surface of lightweight aggregate allows water transfer and thus avoids accumulation

26
of water on aggregate surface. Therefore, hygrol equilibrium is reached and formation
of weak zones caused by differential water concentration are prevented.
The pozzolanic reaction between silica rich surface of lightweight aggregate and
calcium hydroxide formed by the hydration of Portland cement increases the density
and strength of the interfacial transition zone.
For all these reasons, the contact zone in lightweight concrete is superior to that of
normal weight concrete (ACI Committee 213, 2003) and thus less permeable. It should
also be remembered that pore system in lightweight aggregates is generally
discontinuous, therefore porosity of lightweight aggregates does not influence the
permeability of concrete (Neville, 2003).
Since the permeability of the structural lightweight concrete is low, its durability to
aggressive chemical solutions is usually quite satisfactory (Mehta & Monteiro, 2006).
Sulfate containing groundwater and chlorides in sea water are some examples of the
aggressive chemical solutions. Seawater also contains sulfates, however productions
of sulfate attack are soluble in sea water due to presence of chlorides. Therefore,
sulfates in seawater do not cause deleterious levels of expansion (Holm & Bremner,
2000).
Corrosion of reinforcement in concrete can be either induced by chlorides and carbon
dioxide. Presence of these ions lowers the pH of the concrete pore solution, which
causes loss of protective layer on steel reinforcement. Due to low permeability of
lightweight concrete, chloride penetration into concrete is limited. On the other hand,
carbon dioxide in air can diffuse into concrete through the pores in lightweight
aggregate (Neville, 2003) and can cause carbonation induced corrosion. For that
reason, it is often required to increase the thickness of the cover by an additional 10
mm (Neville & Brooks, 2010).
Another durability concern for concretes is alkali-aggregate reaction. There is no
reported case of deleterious alkali-aggregate reaction in lightweight concrete with
natural or manufactured lightweight aggregate (Holm & Bremner, 2000).
Nevertheless, ACI Committee 213 (2003) recommends testing of natural aggregates
against any potential for alkali-aggregate reaction or having a record of satisfactory
service history.

27
Freezing-thawing resistance of structural lightweight concrete is superior to that of
normal weight concrete provided that aggregates are unsaturated before mixing
(Neville & Brooks, 2010). This performance is generally attributed to the porous
structure of lightweight aggregates which act as pressure relief zones for increasing
hydraulic pressure as the water freezes (Harrison, Dewar, & Brown, 2001). Air
entrainment is especially beneficial when aggregates are close to saturation. Air-
entrained lightweight concrete shows similar resistance against freezing-thawing
action to that of air-entrained normal weight concrete (Mehta & Monteiro, 2006).
Fire resistance of structural lightweight concrete is also superior to that of normal
weight concrete due to lower thermal conductivity, lower coefficient of thermal
expansion and inherent thermal stability of aggregates which have already been
subjected to very high temperatures during production (ACI Committee 213, 1987).
However, this resistance is significantly reduced for lightweight concretes with low
permeability in the case of having aggregates with high as-batched water contents
(ACI Committee 213, 2003). This is because, upon exposure to fire, the water in these
aggregates will vaporize but will not easily leave the concrete due to low permeability
and thus increase the steam pressure within and finally results in spalling. In offshore
oil platforms where there is risk of intense hydrocarbon fires, this problem clearly
requires a solution.
Jensen at al. (1995) reported that even relatively low temperatures between 100 and
300oC may cause significant amount of reduction in compressive strength and elastic
modulus of high-strength lightweight concretes and added that spalling depends
largely on the moisture content. They also suggested that inclusion of 0.1 to 0.2 percent
polypropylene fibers in lightweight concrete mixture results in significant reduction of
spalling for lightweight concretes (as cited in Holm & Bremner, 2000). Reduction in
spalling is attributed to release of steam pressure through the conduits developed by
the melting of the polypropylene fibers (ACI Committee 213, 2003).
2.7. Economy of Structural Lightweight Concrete
The high production costs of expanded lightweight aggregates increase the unit price
of structural lightweight concrete. On structural level, however, lightweight aggregate
concrete is generally cost efficient and provides significant economic advantages. The

28
relatively high structural efficiency of structural lightweight concrete results in smaller
member sizes and reduction in reinforcement requirement due to reduced dead load
and corresponding reduction in seismic forces. The transportation cost of precast
lightweight concrete members is also significantly less than that of normal weight
concrete and this is the reason why the major applications of structural lightweight
concrete throughout the world is by using precast elements (Mehta & Monteiro, 2006).
Two examples of transportation cost analysis are given in Table 2.3.
Table 2.3. Transportation cost analysis for lightweight and normal weight concrete
(ACI Committee 213, 2003)
Since the 1970s, rapidly increasing fuel costs has begun to out-market the
manufactured lightweight aggregates by increasing production costs and rearoused the
interest in natural lightweight aggregates with satisfactory quality (Mehta & Monteiro,
2006). The researches on using natural lightweight aggregates such as rhyolite, perlite
and pumice, etc. in structural concrete production are now started to be carried out
throughout the world.

29
2.8. Recent Studies on High Performance Lightweight Concrete
2.8.1. High Strength Lightweight Concrete
Al-Khaiat and Haque (1999) have compared the strength and durability characteristics
of structural lightweight concrete and normal weight concrete under various curing
conditions. They designed two lightweight concretes utilizing artificial aggregates and
one normal weight concrete with crushed quartz aggregates. The nominal compressive
strength of lightweight concretes were 35 and 50 MPa (referred as LWC35 and
LWC50, respectively). The nominal compressive strength of the normal weight
concrete was also 50 MPa (referred as NWC50). All three mixtures had a slump of
about 9 cm. Fresh densities were approximately 1800 kg/m3 and 2350 kg/m3 for
lightweight concretes and normal weight concrete, respectively. Four different curing
regimes were applied on specimens, which are 1-day (no curing after removal of
molds), 3-day (water curing for 2 days after removal of molds), 7-day (water curing
for 6 days after removal of molds) and full curing (water curing till testing). After
curing periods had ended, the specimens were moved and stored at an exposure site
near sea and their strength parameters and durability characteristics such as water
permeability, depth of carbonation, sulfate concentration and chloride penetration
were investigated throughout 270 days. The authors underlined that to achieve same
strength levels with normal weight concrete, lightweight mixture requires 10-20%
more binder content. The results have also shown that LWC50 with 7-day curing
regime has shown better strength development at 90-days than its continuously cured
counterparts. The authors, by citing a previous work by Bamforth (1987), attributed
this to “better densification of the interfacial transition zone due to absorption of
aggregates”. As the moisture near the surface of the concrete begins to evaporate, the
absorbed water within lightweight aggregates are released and promotes hydration at
interior zones where external curing moisture cannot penetrate. Another conclusion
which can be inferred from the study was that duration of curing period is more
effective on the durability of lightweight concretes than that of normal weight ones.
As the curing period extended, water penetration, depth of carbonation and chloride
content of lightweight specimens were reduced more than that of normal weight
concretes.
Chia and Zhang (2002) compared the water permeability and chloride penetrability of
high-strength lightweight concretes with high-strength normal weight concretes. For

30
this purpose, they designed three series of mixtures. In each series, there were two
mixtures one of which was lightweight and the other was normal weight concrete. Both
have same binder content and w/b ratio while the only difference was the type of coarse
aggregates used, namely crushed granite and expanded clay. First series have w/c ratio
of 0.55 and 400 kg/m3 cement, second have w/c ratio of 0.35 and 470 kg/m3 cement
and the third have w/c ratio of 0.35 and 421 kg/m3 cement and 47 kg/m3 silica fume.
The results have shown that water permeability of lightweight concrete in first series
was lower than that of normal weight concrete. However, in second and third series,
water permeability of normal and lightweight concrete was similar. This was attributed
to the enhanced the quality of the mortar matrix due to reduction in w/b ratio from 0.55
to 0.35. In the light of these results, the authors concluded that that the quality of mortar
is more dominant on controlling the water permeability than the type of aggregate
used. The results also showed that the chloride permeability was reduced from first
series to third series, with increasing mortar matrix quality for both normal and
lightweight concrete mixtures and in each series chloride permeability of lightweight
and normal weight concretes were similar. The authors concluded that at equal strength
levels, lightweight concrete is expected to have higher resistance to water and chloride
permeability, considering the lower strength but similar permeability performance of
lightweight concretes compared to that of normal weight concretes in each series.
Chi et al. (2003) investigated the effect of aggregate properties and w/b ratio on the
compressive strength and elastic modulus of lightweight concrete. Three types of fly-
ash lightweight coarse aggregates differing in particle strength were used in the
experiment. For each type, three series of concrete were cast with w/c ratios of 0.3, 0.4
and 0.5. Furthermore, each w/c series were divided into subseries with differing
coarse-to-total aggregate volume fraction (18, 24, 30 and 36%). The compressive
strength of the specimens varied roughly between 25 and 45 MPa while elastic
modulus values were between 15 and 25 GPa. The results were predictable. The
compressive strength and elastic modulus of the specimens increased with the
increasing aggregate particle strength, decreasing w/c ratio and decreasing coarse-to-
total aggregate volume fraction. The study has shown that aggregate properties and
w/c ratio significantly affects the compressive strength and elastic modulus. The
researchers also concluded that when coarse-to-total aggregate volume fraction is

31
18%, strength and elastic modulus are governed by w/c ratio and the effect of
aggregate properties are insignificant.
Kayali and Zhu (2005) compared the chloride induced reinforcement corrosion of
high-strength lightweight concrete (LWHS) with moderate strength normal weight
concrete (MS) and high-strength normal weight concrete (HS). The 35th day
compressive of HS and LWHS was about 70 MPa, whereas MS was only about 30
MPa. The reinforced slabs made of each type of the concretes were exposed to 2%
chloride solution for more than 15 months and chloride ion ingress, corrosion
potentials, corrosion current density and electrical resistivity were monitored
throughout this duration. The results showed that the chloride ion concentration at the
level of rebars were the lowest in LWHS and followed respectively by HS and MS.
Half-cell potential values of LWHS were more negative than MS and accompanied by
insignificant corrosion current, thus attributed to high impermeability and lack of
oxygen in the LWHS slabs. The electrical resistivity of HS and LWHS were similarly
very high and remained almost unaltered with time. On the other hand, the electrical
resistivity of MS was much lower and further decreased with time. The researchers
attributed the superior performance of LWHS to its impermeable dense matrix and
porous lightweight aggregates which are thought to act as reservoirs for chloride
solution.
Mouli and Khelafi (2008) studied the effects of using pozzolan on some mechanical
properties of lightweight aggregate concrete. The lightweight aggregates used in the
study obtained from the natural deposits in Algeria. The pozzolan used in the study
was obtained by grinding same lightweight aggregates to a fineness of 4200 cm2/g. For
assessing the effect of pozzolans, six mixtures with a total binder content of 400 kg/m3
were designed. First mixture was the control group containing only cement as binder.
In other mixtures, cement was replaced with pozzolan by 10, 20, 30, 40 and 50%,
respectively. The compressive strength, splitting and flexural tensile strength of the
specimens were monitored throughout 1 year. The results showed that specimens with
20% pozzolan showed higher compressive, splitting and flexural tensile strength than
reference specimens at all ages starting from 7-days to 365 days. The authors
underlined that increase in splitting and flexural tensile strength may increase the
service life of concrete by reducing cracking tendency. The specimens containing 30%
pozzolan achieved higher compressive strength than that of reference specimens at 90

32
days. The specimens containing 40% and 50% pozzolan showed lower compressive
strength than reference specimens at all ages. Therefore, authors suggested not to use
high pozzolan contents unless low heat of hydration or durability is concerned.
Shannag (2011) conducted a study to assess the effect of pozzolan addition on fresh
and hardened properties of lightweight concrete utilizing volcanic tuff as lightweight
aggregate. For this purpose, binary and ternary lightweight concrete mixtures were
prepared with fly ash and silica fume. Total binder and water content of the mixtures
were fixed to 400 kg/m3 and 250 kg/m3, respectively. The aggregate content and type
were identical in all mixtures. The 28th day compressive strength of designed concretes
varied roughly from 20 to 45 MPa and air-dry densities were less than 2000 kg/m3.
The results showed that the lightweight concrete with 15% silica fume developed the
highest compressive strength and elastic modulus with an increase of 57% and 14%
over reference specimen, respectively. This was attributed to the improvement of
contact zone by pozzolanic reactivity and filler effect. In the scope of the study, the
researcher also plotted and evaluated the complete stress-strain diagram of the
specimens under compression. The stress-strain diagrams of the structural lightweight
concretes were similar to that of typical normal weight concretes. However, it was
stated that the strain capacity of lightweight concrete specimens were comparably
higher.
In a study by Kabay and Aköz (2012), the effect of aggregate prewetting methods on
properties of lightweight concrete was investigated. For this purpose, the researches
designed two series of sanded lightweight mixtures with cement contents of 350 kg/m3
and 500 kg/m3. The lightweight aggregates (pumice) were prewetted before batching
by three different methods, namely pre-soaking, water-soaking and vacuum-soaking.
Firstly, in pre-soaking method, lightweight aggregates and pre-soak water, which
corresponds to 1 hour absorption capacity of the aggregates, are introduced in to a
mixer and allowed to rest for half an hour. During this resting period, aggregates are
mixed three times for “homogenization”. This is followed by batching and casting
procedures in which aggregates are assumed to absorb water for an additional 30
minutes. Secondly, in water-soaking method, lightweight aggregates are simply
immersed in water for 24 hours. Then, these wet aggregates are spread on sieves for
drying of surface water. Thirdly, in vacuum-soaking method, aggregates are placed in
to a container and the air in container is evacuated by means of a pump until the

33
pressure inside is reduced to -650±10 mm Hg. Then, the container is filled with water
and aggregates are allowed to rest for 10 minutes. After the resting period, wet
aggregates are spread on sieves for drying of surface moisture. The experimental
results have shown that the slump of concretes with water-soaked and vacuum soaked
aggregates were close to each other and higher than those with pre-soaked. This was
attributed to lower fresh density of concretes with pre-soaked aggregates. This is
because the pre-soaked aggregates are relatively less saturated than water-soaked and
vacuum soaked aggregates, their density in batch condition is also lower and so as the
fresh density of resulting concretes. The study has also shown that the compressive
strength of the concretes with water-soaked and vacuum-soaked aggregates were
approximately 20% higher than that of concretes with pre-soaked aggregates in series
containing 350 kg/m3 cement. On the other hand, this difference was reduced to 7% in
series with 500 kg/m3 cement. The authors attributed this to reduced lightweight
aggregate content in these series. The drying shrinkage of concretes with water-soaked
and vacuum soaked aggregates were also lower than those with pre-soaked aggregates.
This was attributed to internal curing provided by relatively higher absorbed water
content of water-soaked and vacuum-soaked aggregates. The authors concluded that
concretes with water-soaked and vacuum-soaked aggregates show better overall
performance. It was also underlined that water-soaking is advantageous when
economy is concerned while vacuum-soaking is favorable for its considerably shorter
application time.
2.8.2. Self-Compacting Lightweight Concrete
Yanai et al. (1999; as cited in Papanicolaou & Kaffetzakis, 2011) have studied on self-
compacting lightweight concrete utilizing artificial perlite and coal ash aggregates.
The study showed that by adjusting lightweight aggregate content and water-to-
powder ratio of the mixtures, self-compacting concretes with good flowability and
segregation resistance can be designed. It was concluded that using higher density
lightweight aggregates enhances flowing and filling properties of fresh mixtures and
increases the strength of hardened concrete. The researchers attributed this result to
the reduction of density difference between aggregates and paste.
In an extensive study conducted by Müller and Haist (2004; as cited in Papanicolaou
& Kaffetzakis, 2011), self-compacting concretes with densities varying from 1500

34
kg/m3 to 2000 kg/m3 were designed by using expanded clay coarse aggregates. The
fresh densities was adjusted by replacement of normal weight sand with expanded clay
or bottom ash sand. The authors stressed that to achieve self-compactness,
minimization of density difference is not adequate. The rheological performance of the
mixtures should also be optimized such that its yield stress and plastic viscosity will
be low enough to sustain high flowability and de-aeration, but also high enough to
avoid segregation.
Hwang and Hung (2005), as an alternative to ACI 211.2, have developed a new mix
design method for proportioning self-compacting lightweight concrete mixtures,
which is called as densified mixture design algorithm (DMDA). DMDA is based on
the assumption that optimum values of physical properties will be achieved when the
constituents are densely packed. To achieve this, DMDA try to reduce interstitial voids
between aggregates by arranging the relative proportions of aggregates, cement and
pozzolans. The primary purpose of using pozzolans in this method is to reduce
interstitial voids rather than its utilization as a cement replacement material. By using
DMDA, the researchers managed to produce self-compacting lightweight concretes
with slumps and slump flow spreads between 230-270 mm and 550-650 mm,
respectively. The 28th compressive strength values varied roughly between 30 and 50
MPa. They also investigated the chloride penetration and electrical resistance of the
designed concretes and concluded that the denser packing of the aggregates and
resultant reduction in cement paste volume lowers permeability and increases
electrical resistance.
Lo et al. (2007) compared the workability characteristics and mechanical properties of
normal weight self-compacting concrete (SCC) and lightweight self-compacting
concrete with expanded shale aggregates (SCLWC) at same binder content and similar
compressive strength. Seven mixtures were prepared for each group (SCC and
SCLWC) and the binder content for both groups varied between 500 and 650 kg/m3.
To achieve similar compressive strength at same binder content; w/b ratio and cement
replacement percentage of self-compacting lightweight concrete mixtures were
respectively set to 0.30 and 30% compared to 0.40 and 50% for its normal weight
counterpart. The slump flow and L-box test results were similar for SCLWC and SCC
mixtures. The authors suggested that increasing the binder content more than 550
kg/m3 is not effective for further improving filling and passing abilities of mixtures

35
although the fluidity is increased. The compressive strength results varied from 40 to
60 MPa with increasing binder content. The results have also shown that elastic
modulus of SCLWC was approximately 80% of SCC at similar strength and the
density of SLWC mixtures was around 75% of SCC.
Uygunoğlu and Topçu (2009), have investigated the thermal expansion of self-
compacting concretes with limestone and pumice aggregate at elevated temperatures.
According to this study, the coefficient of thermal expansion of self-compacting
lightweight concrete containing pumice aggregate has been found to be significantly
less than that of its limestone containing normal weight counterpart. This was
attributed to reduced internal thermal stresses due to porous structure of pumice
aggregate. The authors also suggested use of air-entraining agents in self-compacting
mixtures with limestone aggregates to reduce its thermal expansion.
Kim et al. (2010) studied the effect of replacing normal weight coarse aggregates with
lightweight aggregates on the fresh and hardened properties of self-compacting
concrete. For this purpose, two types of lightweight coarse aggregates with different
densities were used in the experiment and nine mixtures with constant w/c ratio and
fine-to-total aggregate volume ratio were designed. First mixture was the control group
which consists of all-normal weight aggregate. Four groups utilized the lightweight
coarse aggregates manufactured from rhyolite powder and the remaining four groups
utilized the lightweight aggregates obtained from recycled sludge by 25, 50, 75 and
100 percent of the total coarse aggregate content. The study has shown that as the
density of lightweight coarse aggregate decreases, the flowability increases but the
mixture becomes more liable to segregate.
Topçu and Uygunoğlu (2010) investigated the effect of aggregate type on hardened
properties of self-compacting concrete such as compressive and tensile strength,
elastic modulus, abrasion resistance and thermal conductivity. Four types of
aggregates used in the study were limestone and natural lightweight aggregates
pumice, volcanic tuff and diatomite. Five mixtures were prepared by using each type
of the aggregates with different w/b ratio and superplasticizer dosage but with similar
powder content about 550-600 kg/m3. It was reported that self-compacting concrete
with diatomite aggregates had shown the highest slump-flow. This was attributed to
fact that coarse aggregate content of diatomite containing concretes was the lowest

36
among all other types. It was also stated that regardless of the aggregate type, increase
in w/b ratio results in larger slump-flow spreads due to consequent reduction in yield
strength of the fresh mixture. Pumice containing self-compacting concrete had the
highest compressive strength and lowest unit weight among other lightweight
mixtures, although its particle strength was weaker than tuff. The superior performance
of pumice containing concrete was attributed to strong interlocking between cement
paste and porous surface of the pumice (Figure 2.8). Another conclusion drawn from
the study was that both self-compacting normal and self-compacting lightweight
concretes have higher thermal conductivity than their ordinary counterparts, which
was, by authors, attributed to high powder contents of self-compacting mixtures.
Figure 2.8. Microstructure of self-compacting concrete with natural pumice aggregate
(1: aggregate, 2: cement paste matrix) (Topçu & Uygunoğlu, 2010)
In a state of art report by Papanicolaou and Kaffetzakis (2011), the self-compacting
lightweight mixtures reported in 16 scientific papers, which are published between
1999 and 2010, were analyzed. The slump-flow ranges and 28th day compressive
strengths of these mixtures are statistically shown in Fig 2.9 and 2.10, respectively.

37
Figure 2.9. Frequency bar chart for slump-flow of self-compacting lightweight
mixtures (Papanicolaou & Kaffetzakis, 2011)
Figure 2.10. Frequency bar chart for 28-day compressive strength of self-compacting
lightweight mixtures (Papanicolaou & Kaffetzakis, 2011)
From these charts, it can be concluded that half of the self-compacting lightweight
mixtures showed slump flows between 600 and 700 mm and about 60% of these
concretes can be considered as high strength lightweight concrete as their compressive
strengths are higher than 40 MPa.

38
Figure 2.11 and 2.12 illustrates the specific strength and its relation to binder content,
respectively. By analyzing these charts together, it can be inferred that average specific
strength is about 25×10-3 MPa / (kg/m3) and generally achieved with a total binder
content of 500-600 kg/m3.
Figure 2.11. Frequency bar chart for specific strength of self-compacting lightweight
mixtures (Papanicolaou & Kaffetzakis, 2011)
Figure 2.12. Relationship between binder content and specific strength (Papanicolaou
& Kaffetzakis, 2011)

39
CHAPTER 3
EXPERIMENTAL STUDY
3.1. Experimental Program
The aim of the experimental study conducted in this thesis was to design high
performance lightweight concretes and to compare their mechanical properties and
durability characteristics with normal weight concrete of similar specific strength.
For this purpose, three different concrete mixtures were prepared. These mixtures were
designed such that the 28th day specific strength of these concretes would be
comparable. The aim here was to set a reference point for the comparison of the test
results.
First mix was proportioned as a high strength lightweight concrete utilizing natural
perlite as both coarse and fine aggregate. Second mix was proportioned as a self-
compacting high-strength lightweight concrete utilizing high volume perlite powder
as pozzolan and natural perlite as both coarse and fine aggregate. Third mix was
proportioned as a high strength normal weight concrete with limestone aggregate.
In the course of this study, following properties of concrete were investigated:
- Fresh properties such as slump, slump flow, unit weight and setting time;
- Hardened properties such as compressive strength, splitting tensile
strength, flexural tensile strength, elastic modulus and thermal coefficient
of expansion;
- Durability characteristics such as resistance to rapid chloride ion
penetration, aggressive chemical solutions and freezing-thawing cycles.

40
3.2. Material Properties
3.2.1. Portland Cement
In the experiments throughout this study, CEM I 42.5 R type Portland cement was
used. The chemical composition, physical properties and compressive strength of
mortar cubes made by using this cement are as shown in Table 3.1.
Table 3.1. Properties of the CEM I 42.5 R type Portland cement
CEM I 42.5 R type PC
Chemical Composition*, %
CaO 63.91
SiO2 20.23
Al2O3 5.15
Fe2O3 3.22
MgO 1.40
SO3 2.81
K2O 0.57
Na2O 0.15
Cl- 0.001
LOI 2.45
IR 0.25
Physical Properties*
Specific Gravity 3.16
Blaine Fineness, cm2/g 3443
Initial Set, min 120
Final Set, min 175
Compressive Strength** (MPa)
3-days 32.9
7-days 44.8
28-days 57.0 *As provided by the quality-control department of Limak Çimento, Ankara. ** Specimens were prepared and tested in accordance with ASTM C109.

41
3.2.2. Perlite Powder
The perlite used in this study was supplied from the natural resources at Erzincan-
Mollaköy. The perlite powder was obtained by grinding of natural perlite sand (sized
up to 2 mm) in a ball-mill (D=42 cm, L=45 cm) until approximately 80% of the ground
material can pass through 45µm sieve, when wet sieved. In each grinding session, 10
kg of perlite sand introduced into mill. Grinding media were small steel balls and
cylinders of various sizes. Perlite sand to grinding media ratio was 1:7 by mass.
Grinding time varied from 3 hours to 3 hours and 15 minutes. The chemical
composition, physical properties and strength activity index of the perlite powder is
given in Table 3.2.
Table 3.2. Properties of the perlite powder
Perlite Powder
Chemical Composition*, %
SiO2 70.96
Al2O3 13.40
Fe2O3 1.16
MgO 0.28
CaO 1.72
Na2O 3.20
K2O 4.65
LOI 3.27
Physical Properties
Specific Gravity 2.38
Blaine Fineness, cm2/g 4267
Passing 45µm, % 82
Strength Activity Index**, %
7-days 85.5
28-days 91.3 * As taken from Aşık (2006). ** Strength activity index was determined in accordance with ASTM C311.
Table 3.3 illustrates the compressive strength of the mortar cubes prepared by using
perlite powder as pozzolan for different percentages of replacement and throughout 1
year duration.

42
Table 3.3. Compressive strength of mortar cubes utilizing perlite powder as pozzolan
%
replacement
Compressive Strength (MPa)
3-days 7-days 28-days 90-days 180-days 360-days
0 32.9 44.8 57.0 61.8 64.6 66.4
20 27.8 38.3 52.0 59.4 62.0 64.2
30 22.7 30.9 45.6 51.8 54.7 58.8
40 16.5 23.3 38.2 43.9 47.8 54.1
50 14.0 20.3 31.2 37.5 45.3 50.4
In Figure 3.2, the change in strength activity index of perlite powder with respect to
time and replacement level is shown. The strength activity development for mortar
cubes with 20% and 30% replacement almost levels at 90 days. On the other hand, for
mortar cubes with 40% and 50% replacement, strength activity development continues
even after 180 days. It can also be inferred from the graph that there is a significant
drop in the rate of strength activity development for mortar cubes with 50%
replacement after 180 days. This may be attributed to deceleration of the pozzolanic
reactions due to exhaustion of calcium hydroxide by high volume perlite powder.
Figure 3.1. Strength activity index of perlite powder versus time
40
50
60
70
80
90
100
0 30 60 90 120 150 180 210 240 270 300 330 360
SA
I(%
)
Time (days)
20% replacement 30% replacement 40% replacement 50% replacement

43
3.2.3. Natural Perlite Aggregate
The perlite aggregate used in the study was brought to laboratory in five commercial
sizes (perlite sand in sizes of 0-2 mm, 0-3 mm, 0-4 mm and coarse perlite aggregate in
sizes of 4-8 mm, 8-12 mm) as supplied by ER-PER. Physical properties of the perlite
aggregate were provided in Table 3.4.
Table 3.4. Physical properties of natural perlite aggregate
Aggregate Size (mm) 0-2 0-3 0-4 4-8 8-12
Dry-Loose Unit Weight ( kg/m3) 1286 1288 1322 1025 1002
Oven Dry Specific Gravity 2.09 2.06 1.99 1.89 1.93
Saturated-Surface Dry Specific Gravity 2.21 2.18 2.15 2.00 2.04
Water Absorption Capacity (%) - 72 hr. 5.45 5.64 7.79 6.14 5.59
No.200 Sieve - % Passing 10.44 11.64 8.75 - -
Los Angeles Abrasion (%) - - - 49.7
Gradation curves of perlite aggregate for each commercial size are shown in Figure
3.3. In the production of high performance lightweight concretes, a combined
gradation was used, which consists of 0-4 mm, 4-8 mm and 8-12 mm sized aggregates
with fractions of 55%, 25% and 20% by mass, respectively. This gradation falls within
the limits stated for combined lightweight aggregates in ASTM C330 and its curve can
also be seen in Figure 3.3.

44
Figure 3.2. Gradation curve of perlite aggregate
Alkali-silica reactivity of the perlite aggregate as determined by ASTM C1260 is
shown in Figure 3.4. As it can be seen from the Figure 3.3, corresponding expansion
is well under the maximum limit defined by ASTM standards (0.1%).
Figure 3.3. ASR expansion of perlite aggregate as determined by ASTM C1260.
0
10
20
30
40
50
60
70
80
90
100
0.1 1 10
% P
assi
ng
Maximum Aggregate Size (mm)
0-2 mm 0-3 mm 0-4 mm
4-8 mm 8-12 mm Chosen Gradation
ASTM C330-Lower Limit ASTM C330-Upper Limit
0.00
0.02
0.04
0.06
0.08
0.10
0 1 2 3 4 5 6 7 8 9 10 11 12 13 14
% E
xp
ansi
on
Time (days)

45
3.2.4. Limestone Aggregate
The limestone aggregate used in the study was brought to laboratory in three
commercial sizes (0-5 mm, 5-15 mm, 15-25 mm) as supplied by BAŞTAŞ. Physical
properties of the limestone aggregate are provided in Table 3.5.
Gradation curves of limestone aggregate for each commercial size are shown in Figure
3.5. In the production of high strength normal weight concrete, a combined gradation
was used, which consists of 0-5 mm, 5-15 mm and 15-25 mm sized aggregates with
fractions of 57%, 23% and 20% by mass, respectively. The curve of this gradation can
also be seen in Figure 3.5.
Table 3.5. Physical properties of limestone aggregate
Aggregate Size (mm) 0-5 5-15 15-25
Dry-Rodded Unit Weight ( kg/m3) 1880 1549 1534
Oven Dry Specific Gravity 2.59 2.67 2.71
Saturated-Surface Dry Specific Gravity 2.65 2.69 2.72
Water Absorption Capacity (%) - 24 hr. 2.27 0.53 0.33
No.200 Sieve - % Passing 9.57 - -
Los Angeles Abrasion (%) - 26
Figure 3.4. Gradation curve of limestone aggregate
0
10
20
30
40
50
60
70
80
90
100
0.1 1 10
% P
assi
ng
Maximum Aggregate Size (mm)
0-5 mm 5-15 mm 15-25 mm Chosen Gradation

46
3.2.5. Superplasticizer
In the production of all concretes within the scope of this thesis, a high performance
superplasticizer (ViscoCrete SF-18) was used at a dosage of 0.4% of the binding
medium by mass. The technical properties of this admixture are given in Table 3.6.
Table 3.6. Technical properties of ViscoCrete SF-18 (Sika, 2007)
Chemical Base Modified polycarboxylate based polymer
Density 1.10±0.02 g/cm3, 20oC
pH 3-7
Freezing Point -10oC
Soluble in Water
Chloride Ion Content, % Max. 0.1%
3.3. Experimental Procedures
3.3.1. Preparation of Concrete Specimens
For the mixing of concrete-making materials, the instructions given in ASTM C192,
the product manual of the superplasticizer and the absorption characteristics of
lightweight aggregates have been taken into account while determining the mixing
procedure.
The procedure of mixing have been summarized below:
1. Aggregates and one half of the mixing water were introduced into mixer.
2. Mixer was started to rotate.
3. Aggregates were allowed to absorb water for 3 minutes duration as the mixer
continues to rotate, in order to decrease slump loss due to water absorption.
4. Cementitious materials were introduced into mixer.
5. As recommended in the manual of the superplasticizer, ingredients were
allowed to mix for an additional 60 seconds before the addition of the
remaining half of the mixing water and the superplasticizer dispersed in it.

47
6. Then, the remaining half of the mixing water and the superplasticizer dispersed
in it were introduced into the mixer gradually.
7. Mixing was continued until homogeneity of the fresh concrete was ensured.
After mixing, two types of molds were used for casting. First one is for cylindrical
specimens of 200 mm in length and 100 mm in diameter. Second one is for prism
specimens of 75x75x320 mm size.
The molds were filled in two equal layers and each layer was compacted. For the
compaction of the specimens, concrete vibrator was used; except for the specimens of
self-compacting lightweight concrete which already has, as its name implies, self-
compacting ability.
After consolidation, excess concrete was struck off and finishing was done by the help
of a trowel. Followed by finishing, the specimens were covered with a moist-burlap to
avoid evaporation of water. The specimens were removed from the molds 24 hours
after casting and stored in potable water at 23±2oC till testing.
3.3.2. Tests on Fresh Concrete
3.3.2.1. Slump Test (ASTM C143)
Workability can be defined as an ability of fresh concrete to transport, place, compact
and finish without any harmful segregation. It is a composite property that consists of
consistency and cohesiveness. Consistency is, in simple words, the fluidity of a fresh
mixture; and cohesiveness is the stability of the fresh mixture, in other words,
resistance to bleeding and segregation.
Due to ease of testing, both in the field and in the laboratory, slump test is widely used
in measuring the consistency of the fresh concrete. It is also suitable for checking
batch-to-batch uniformity of ready-mixed concrete (Mehta & Monteiro, 2006).
To measure the slump in accordance with ASTM C143, a sample of fresh concrete is
taken and placed in a slump cone (Figure 3.6) in three approximately equal layers.
Each layer is tamped 25 times by using a rod before another layer is introduced into
the mold. When the mold is filled, the excess concrete is struck off by rolling motion
of the rod. Then, the mold is removed vertically. Afterwards, slump is measured as the
vertical distance between the top of the mold and the top of the sample.

48
Figure 3.5. Slump cone and measurement of slump (Erdoğan, 2005)
Required slump value can vary from one type of the construction to another. Table 3.7
shows the recommended slumps for various types of construction for structural
lightweight aggregate concrete.
Table 3.7. Recommended slumps for various types of construction (ACI Committee
211, 2004)
Types of construction Slump (mm)
Beams and reinforced walls 100 25
Building columns 100 25
Floor slabs 75 25
3.3.2.2. Slump-flow (ASTM C1611)
Slump-flow test is a test method to measure the consistency of self-compacting
concrete. The procedure of this test is very similar to that of the slump test except that
no tamping is applied to the sample in the mold and the mold can be used either upright
or inverted. Additionally, test should be performed on a level and nonabsorbent surface
moistened with a damp towel. When the mold is removed vertically, fresh concrete is
allowed to spread. When flowing is stopped, flow is calculated as the average of the
largest spread (d1) and the spread that is perpendicular to largest spread (d2).

49
Slump-flow = (d1+d2)/2 (Equation 3.1)
In European Guidelines for Self-Compacting Concrete (EFNARC, 2005), slump-flow
classes for a range of applications have been defined. This classification is shown in
Table 3.8.
Table 3.8. Slump-flow classes (EFNARC, 2005)
Class Slump-flow (mm)
SF1 550-650
SF2 660-750
SF3 760-850
SF1 class is favorable in housing slabs, tunnel linings, piles and deep foundations,
whereas SF2 class is applicable to walls and columns. SF3 class is appropriate for
vertical applications in very congested structures, complex shaped structures and for
filling operations under formwork (EFNARC, 2005).
During slump flow test, viscosity can also be evaluated by the T500 time. It is the time
passing between the removal of mold and the spread of the fresh concrete reaches to
500 mm. It is also useful for checking batch-to-batch uniformity of SCC, together with
slump-flow. Viscosity classes defined by T500 time are given in Table 3.9.
Table 3.9. Viscosity classes (EFNARC, 2005)
Class T500 (s)
VF1 ≤ 2
VF2 > 2

50
VF1 is suitable for heavily reinforced sections. It has also self-levelling ability and
good surface finishing. On the other hand, it may have a tendency to bleeding and
segregation. VF2 has improved segregation resistance but likely to have problems with
surface finishing (e.g. blow holes) (EFNARC, 2005).
In ASTM C1611, it is stated that stability of self-compacting concrete can be evaluated
by visual inspection. Furthermore, a visual stability index (VSI) is given to classify the
stability of self-compacting concrete (Table 3.10). In Figure 3.7, fresh concrete spreads
corresponding to each VSI value have also been illustrated.
Table 3.10. Visual stability index (ASTM C1611)
VSI Value Criteria
0 Highly Stable No evidence of segregation and bleeding
1 Stable No evidence of segregation, slight bleeding as a sheen
2 Unstable A slight mortar halo < 10 mm and/or aggregate pile
3 Highly Unstable Large mortar halo > 10 mm and/or large aggregate pile
Figure 3.6. Illustration of visual stability index (ASTM C1611)
VSI = 0 VSI = 1
VSI = 2 VSI = 3

51
3.3.2.3. Density (ASTM C138)
In this test, a steel container of a known volume is filled with freshly mixed concrete
in three approximately equal layers. Then, the same consolidation practice in slump
test is utilized. Each layer is rodded 25 times. During rodding 2nd and 3rd layer, rod is
penetrated approximately 2.5 cm into previous layer. After the container is filled,
excess concrete is struck off. Then, the container filled with fresh concrete is weighed
(Mc). Knowing the self-mass (Mm) and volume of the container (Vm), density of the
concrete can be calculated as follows:
Density = (Mc – Mm) / Vm (Equation 3.2)
3.3.2.4. Air Content (ASTM C231)
To measure the air content of freshly mixed concrete, the pressure method is used in
accordance with ASTM C231. Although this method is more suitable for concretes
with relatively dense aggregates, it is still being used for concretes with relatively
lighter aggregates like natural perlite. To apply this test method, there are two types of
air-meters as stated in ASTM C231, namely Type A and Type B. In this study, Type
B air-meter (Figure 3.8) was used.
In Type B air-meter, there is a known value of air in air chamber at a known pressure
and an unknown volume of air in the fresh concrete, which is placed in measuring
bowl by the same consolidation practice in slump test. By using the testing procedures
given in ASTM C231, these two air volumes are equalized. The pressure at which this
equalization occurs is converted in terms of percentage air and can be read from the
pressure gauge.
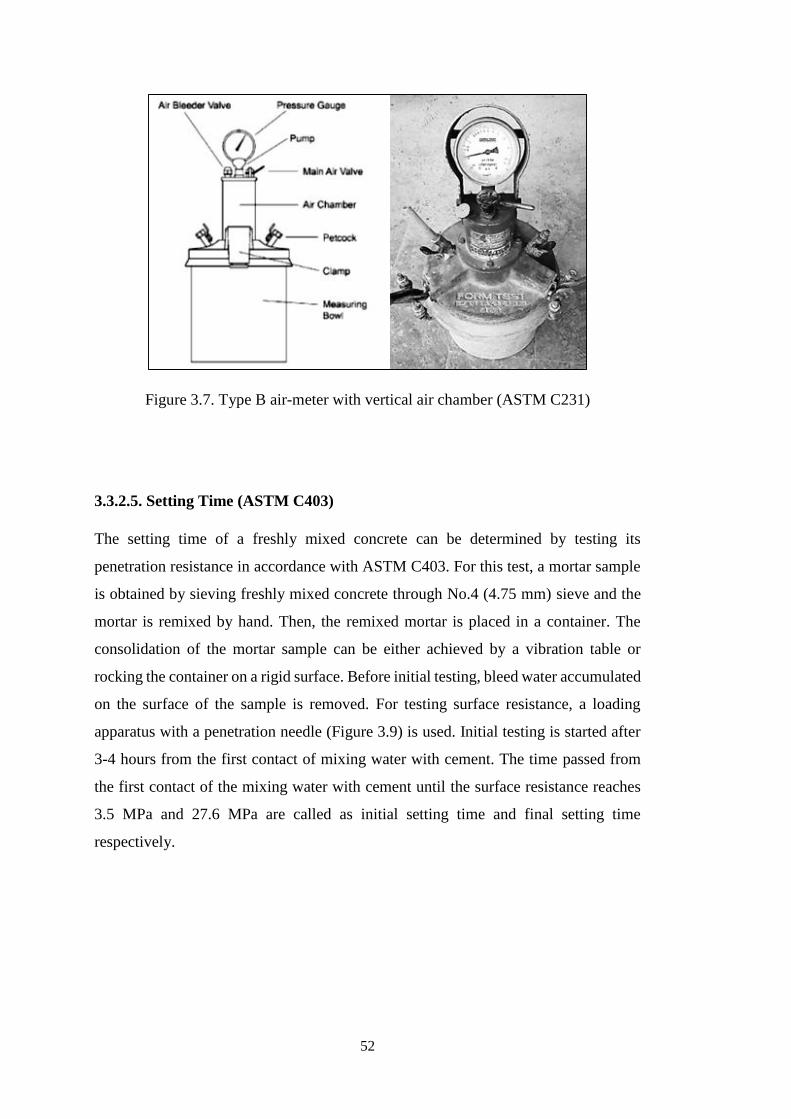
52
Figure 3.7. Type B air-meter with vertical air chamber (ASTM C231)
3.3.2.5. Setting Time (ASTM C403)
The setting time of a freshly mixed concrete can be determined by testing its
penetration resistance in accordance with ASTM C403. For this test, a mortar sample
is obtained by sieving freshly mixed concrete through No.4 (4.75 mm) sieve and the
mortar is remixed by hand. Then, the remixed mortar is placed in a container. The
consolidation of the mortar sample can be either achieved by a vibration table or
rocking the container on a rigid surface. Before initial testing, bleed water accumulated
on the surface of the sample is removed. For testing surface resistance, a loading
apparatus with a penetration needle (Figure 3.9) is used. Initial testing is started after
3-4 hours from the first contact of mixing water with cement. The time passed from
the first contact of the mixing water with cement until the surface resistance reaches
3.5 MPa and 27.6 MPa are called as initial setting time and final setting time
respectively.

53
Figure 3.8. Concrete setting time testing apparatus
3.3.3. Tests on Hardened Concrete
3.3.3.1. Compressive Strength (ASTM C39)
The compressive strength of the cylindrical specimens was determined in accordance
with ASTM C39. Until the testing day, the specimens were stored in water bath at
23±2oC. After the removal of specimens from the water bath, both ends of the
specimens are sawed and capped by a sulphur compound. Then, the specimens were
loaded at a constant loading rate of 0.25±0.05 MPa/s. Three specimens of a kind were
tested at each testing day and the average of these three results were determined as the
compressive strength.
To assess the compressive strength results correctly, there were two considerations
taken into account. Firstly, as stated in ASTM C39, the compressive strength results
should be multiplied by a correction factor if L/D ratio is less than or equal to 1.75
(Table 3.11). Secondly, in the same standard, the acceptable range of individual
cylinder strengths for 20x10cm cylindrical specimens are determined as 9% and 10.6%
for 2 cylinders and 3 cylinders, respectively. Any misleading results, which are beyond
this range, are omitted.

54
Table 3.11. Correction factor for compressive strength results (ASTM C39)
3.3.3.2. Splitting Tensile Strength (ASTM C496)
This test is an indirect method for determining the tensile strength of concrete. In this
test, cylindrical specimens are loaded along their length and this resultantly creates
tensile stresses on the plane of loading and compression around loading points. This
test method and related stress distribution diagram are illustrated in Figure 3.10.
Figure 3.9. Splitting tension test and stress distribution diagram (Mehta & Monteiro,
2006)
Splitting tensile strength can be calculated via following formula.
st = 2P/LD (Equation 3.3)
P: compressive load at failure
L: length of cylindrical specimen
D: diameter of cylindrical specimen
L/D 1.75 1.50 1.25 1.00
Correction Factor 0.98 0.96 0.93 0.87

55
3.3.3.3. Flexural Strength (ASTM C78)
Another indirect method to determine the tensile strength of concrete is flexural
strength test, which is applied on beam specimens. Flexural strength can be either
determined by third point loading method as in ASTM C78 or center point loading
method as in ASTM C293.
In this study, third point loading method was used since it has some advantages over
center point loading. In third point loading, the portion between loading points is
exposed only to bending moment and this shear-free moment exists over this entire
portion, where the fracture generally occurs. Resultantly, fracture will be due to only
tensile stresses induced by bending moment. However, in center point loading, only
the loading point has no shear. Therefore, if a specimen does not fracture at loading
point –which is generally the case-, the fracture will be due to both shear and bending
moment. This can be better comprehended by studying the shear and bending moment
diagrams of center point loading (CPL) and third-point loading (TPL), which are given
in Figure 3.11.
Figure 3.10. Shear and moment diagrams of CPL and TPL

56
The formula given below is used in calculating flexural strength of a concrete beam
exposed to third point loading, if the tested beam fractures within the portion between
the loading points.
ft = PL / bd2 (Equation 3.4)
P: load at fracture as shown by the testing machine
L: span length
b: average width of the specimen at the fracture
d: average depth of the specimen at the fracture
3.3.3.4. Elastic Modulus (ASTM C469)
Elastic modulus of concrete is an important property especially for designing structural
members. It is used in computing the strain at a known stress value. Physically, elastic
modulus can be defined as the resistance of a material to elastic deformation.
Mathematically, it is the slope of the linear portion (elastic region) in a stress-strain
diagram of a material.
In this study, the elastic modulus of the cylindrical concrete specimens were
determined in accordance with ASTM C469. This method assumes, up to 40% of
ultimate stress level, the slope of stress-strain diagram of a concrete specimen is linear.
Therefore, the specimens are loaded up to this stress level and change in length of the
specimens during loading period are monitored by means of a displacement sensor.
Then, the longitudinal deformation is converted to longitudinal strain and the stress-
strain curve is drawn.
According to ASTM C469, elastic modulus can be calculated by two data points of
known stress-strain values. In other words, the standard calculates the chord modulus
of elasticity (Equation 3.5). Actually, a more accurate determination of elastic
modulus, may be to find the slope of the linear portion of the stress-strain curve
obtained by a continuous data acquisition system, rather than a result based on only
two data points.

57
E = (S2 – S1) / (ε2 – ε1) (Equation 3.5)
E: chord modulus of elasticity (MPa)
S2: stress equal to 40% of ultimate stress (MPa)
S1: stress at ε1 strain (MPa)
ε2: longitudinal strain at S2 stress
ε1: longitudinal strain of 0.000050
It should also be noted that specimens are loaded at least twice and the first loading
data is not used in elastic modulus calculations. This is because first loading is
essentially for seating of gauges (ASTM C469/C469M-10, 2010).
For this study, the specimens were loaded and unloaded 3 times and elastic modulus
values were determined from the slope of stress-strain curve derived from the last two
loading cycles. In each test, three specimens were used and the elastic modulus values
were calculated from the average.
3.3.3.5. Linear Coefficient of Thermal Expansion
To determine the linear coefficient of thermal expansion of concrete specimens, the
procedure given below was followed for beam specimens:
1. Specimens were removed from water bath and allowed to dry in an oven at
110±5oC for 24 hours before the testing day.
2. On testing day, specimens were removed from the oven and allowed to cool
to room temperature.
3. Then, pins were glued on two consecutive long sides of each specimen. The
pins are placed so as to provide a gauge length of 25 cm for measuring the
change in length (Figure 3.12).
4. Afterwards, the specimens were put in an oven at 25oC and allowed to
remain for 1 hour.
5. Immediately after the removal of the specimens from the oven, length
measurements were taken by means of an electronic measuring device
(Figure 3.13).
6. Steps 4&5 were repeated for the temperatures of 40, 55 and 70oC.

58
7. The scatter diagram of the length versus the temperature change was drawn.
Then, the best fitting line was drawn, the slope of which gives the change
in length per degree (L/T).
8. The linear coefficient of thermal expansion (change in unit length per
degree) was calculated by dividing the slope of the best fitting line by initial
gauge length at 25oC (Equation 3.6).
α = (L/L0)/T = (L/T)/L0 (Equation 3.6)
α: linear coefficient of thermal expansion
(L/T): slope of the best fitting line
L0: average gauge length at 25oC, as determined from the graph
Figure 3.11. Beam specimen for thermal expansion experiment

59
Figure 3.12. Measurement of thermal expansion of concrete specimens
3.3.4. Durability Tests on Hardened Concrete
3.3.4.1. Rapid Chloride Permeability Test (ASTM C1202)
In this study, rapid chloride permeability test (RCPT) was conducted in accordance
with ASTM C1202. For this test, 50±3 mm thick slices of 95-100 mm diameter
cylinder specimens are used. Throughout a 6-hour duration, 60V dc is applied to the
ends of specimen, one of which is in contact with sodium hydroxide solution and the
other is in contact with sodium chloride solution. Amount of electrical current passing
through the specimen is recorded. At the end of the test, the total charge passed through
the specimen is used in assessing the resistance of concrete specimens to chloride ion
penetration. Table 3.12 illustrates the qualitative assessment of chloride ion
penetrability.
Table 3.12. Qualitative assessment of chloride ion penetrability (ASTM C1202)
Charge Passed (coulombs) Chloride Ion Penetrability
>4000 High
2000-4000 Moderate
1000-2000 Low
100-1000 Very Low
<100 Negligible

60
Before assessing the chloride ion penetrability according to Table 3.12, for the tested
specimens having a diameter size other than 95 mm, total charges passed through the
specimen should be adjusted by using the following formula.
Qs = Qx × (95/x)2 (Equation 3.7)
Qs: charge passed through standard specimen (95 mm diameter)
Qx: charge passed through non-standard specimen
x: diameter of non-standard specimen (mm)
As stated in ASTM C1202, the results of two tests on the concrete samples from the
same batch should not differ more than 42% and 51% for single-operator and multi-
laboratory precision, respectively. Considering this large amount of variation,
although it is not defined as obligatory by the standard, testing chloride penetrability
on more than one specimen could provide more reliable results. The chloride
penetrability results in the scope of this thesis are based on the average of at least two
specimens.
3.3.4.2. Durability in Aggressive Chemical Solutions
To assess the resistance of the concrete specimens to sulfate attack, carbonation and
acid attack, magnesium sulfate, sodium bicarbonate and sulphuric acid solutions were
prepared respectively and the specimens were immersed in these solutions at the age
of 28 days (Figure 3.14). Magnesium sulfate solution was 0.352 M. This molarity
value was taken from ASTM C1012. The molarity of sodium bicarbonate solution was
also 0.352 M, and it was based on a previous study by Bakharev et al (2001) to model
ground water with high concentrations of carbonate ions, in other words, carbonated
water. The pH value of sulphuric acid solution was determined as 1.0, which
corresponds approximately to 1% sulphuric acid solution. This acid and corresponding
pH value was chosen to model acid attack on concrete in sewers. The solutions were
stored at room temperature. To provide a steady severity level of deterioration,
solution-to-specimens volume ratio was fixed to 2.0 and the solutions were renewed
monthly for first six months of exposure. The durability of the specimens in these

61
aggressive chemical solutions was monitored by visual inspection and compressive
strength tests till the age of 9 months. The compressive strength tests were conducted
after 1, 3, 5 and 8 months of exposure.
Figure 3.13. Storage of concrete specimens in aggressive chemical solutions
3.3.4.3. Freezing-Thawing Resistance (ASTM C666)
Testing procedure of freezing-thawing resistance of the specimens was adapted from
ASTM C666, procedure A. The cylindrical concrete specimens at the age of 28 days
were placed in a climate cabin after sawing of the both end of the specimens. At the
bottom of the specimens, a water level of 1 cm was maintained throughout the
experiment. Concrete specimens were subjected to 300 cycles of rapid freezing and
thawing and the durability is assessed by testing of the compressive strength of the
specimens after 100 and 300 cycles of exposure. According to ASTM C666, during
freezing-thawing cycles, temperature of the specimens should be changed from 18oC
to -4oC in freezing and -4oC to 18oC in thawing. These temperature values were
approximately achieved for the specimens, when the temperature of the climate cabin
used in this experiment was lowered from 35oC to -25oC in 2.5 hours in the freezing
phase and was raised from -25oC to 35oC in 1.5 hours in the thawing phase.

62

63
CHAPTER 4
RESULTS AND DISCUSSION
4.1. Mix Design and Fresh Properties
As stated earlier, within the scope of this thesis, three types of concretes were designed.
These are high-strength lightweight concrete (HSLWC), self-compacting high-
strength lightweight concrete (SCLWC) and high-strength normal weight concrete
(HSNWC). The mix proportions and fresh properties are as shown in Table 4.1.
Table 4.1. Mix proportions and fresh properties
Mix Proportions (kg/m3)
Concrete Type HSLWC SCLWC HSNWC
Cement 315 274 308
Perlite Powder - 274 -
Water 100 127 140
0-4 mm PA / 0-5 mm LA (SSD) 875/0 749/0 0/1135
4-8 mm PA / 5-15 mm LA (SSD) 392/0 335/0 0/450
8-12 mm PA / 15-25 mm LA (SSD) 312/0 267/0 0/391
Superplasticizer 1.26 2.19 1.23
w/cm 0.32 0.23 0.45
Theoretical Fresh Density (kg/m3) 1996 2029 2425
Fresh Properties
Measured Fresh Density (kg/m3) 1915 1950 2373
Air Content (%) 4.2 2.2 2.2
Slump (cm) 4 - 9
Slump Flow (cm) - 77 -
Slump Flow Class - SF3 -
Visual Stability Index (VSI) - 1-Stable -
T500 (sec) - ≤ 2 -
Viscosity Class - VF1 -
Setting Time
Initial Set (hr:min) 5:30 4:00 4:30
Final Set (hr:min) 9:30 7:00 7:30

64
As shown in the table above, HSLWC and HSNWC has similar cement contents.
SCLWC has approximately 35-40 kg/m3 less cement content when compared to
HSLWC and HSNWC, however it also contains perlite powder as pozzolan and when
its total binder content is considered, it almost doubles the binder content of the other
two types of concretes. SCLWC can also be named as self-compacting high volume
pozzolan concrete since 50% of its binding medium is pozzolan.
It is hard to define an exact w/c ratio for lightweight concretes, since the absorption
capacity of lightweight aggregates are high and the water absorption can continue for
several weeks. Nevertheless, using the 3-days absorption capacity data of perlite
aggregates, w/cm ratios have been estimated. It was found that HSLWC has w/c ratio
of 0.32 and SCLWC has a w/cm ratio of 0.23. These ratios may seem to be relatively
low, however to obtain high strength lightweight concretes, it is a necessity. Unlike
lightweight aggregate concretes, the determination of w/c ratio for concretes with
normal weight aggregates are more accurate and reliable. HSNWC was designed with
a w/c ratio of 0.45.
To enhance the workability of the fresh mixtures, a superplasticizer admixture was
used at a dosage of 0.4% of the binding medium. Although the slump of the HSLWC
was 4 cm, it was within the recommended range defined by ACI Committee 211.
During the casting of the concrete in the laboratory, it was also observed to require a
fair compacting effort and was placed in to the molds as comfortably as HSNWC,
slump of which was 9 cm.
The assessment of the workability of SCLWC was done by several observations on its
slump flow. Slump flow of the SCLWC was measured as 77 cm and T500 time was
under 2 seconds, which corresponds to slump flow class SF3 and viscosity class VF1,
respectively. When this two data is considered together, it may be expected to have a
tendency to bleeding and segregation. However, when it was evaluated by visual
stability index, it was found to be stable (VSI = 1), with only a slight bleeding as a
sheen (Figure 4.1).

65
Figure 4.1. Slump flow measurement on SCLWC
Air contents of HSLWC, SCLWC and HSNWC were found to be 4.2, 2.2 and 2.2%,
respectively. Since no air-entraining agents was used, these values are due to entrapped
air voids. Relatively higher air-content of HSLWC may be attributed to porous nature
of perlite aggregate. If so, similar air-content may be expected in SCLWC, which is
also made of perlite aggregate. However, this is not the case. Due to self-consolidation
property of SCLWC, these entrapped air voids are relatively better eliminated and
resulted in a lower air content.
As expected, the measured fresh densities of the concretes were lower than the
theoretical fresh densities. This is mainly because the calculations are based on specific
gravities of aggregates in SSD condition. In fact, in batching, the aggregates are in dry-
state and they cannot totally absorb the water to full absorption capacity during mixing.
Resultantly, when the concrete densities are measured, the pores in aggregates are not
fully saturated; and some part of the water thought to be absorbed by aggregates,
remains in the mixture. Thus, the measured fresh densities are lower than the
theoretical ones. The difference between theoretical and measured fresh densities is
around 80 kg/m3 for HSLWC and SCLWC whereas it is 50 kg/m3 for HSNWC.
Initial and final setting time of the concretes produced are also given in Table 4.1. The
shortest setting time is measured for SCLWC, which has the highest binder content

66
and lowest w/b ratio. HSLWC and HSNWC has similar binder contents. Although
HSLWC has lower w/c, it has the longer setting time. This can be explained by initially
high w/c ratio of HSLWC. The high amount of water calculated to be absorbed by
lightweight aggregates, cannot be fully and instantly absorbed. Thus, w/c ratio of
HSLWC at fresh state is possibly much higher than calculated and responsible for
longer setting time.
4.2. Hardened Properties
4.2.1. Compressive Strength, Density and Specific Strength
As stated previously, the mix proportions are determined such that 28th day specific
strengths of all three designed concrete types would be comparable. Since the concrete
in structural applications is generally air-dry in service condition, specific strength
calculations are based on air-dry density of the specimens. In Table 4.2, compressive
strength, specific strength, unit weight of the designed concretes in saturated surface
dry (SSD), air-dry (AD) and oven-dry (OD) condition have been provided.
Table 4.2. Compressive strength, density and specific strength
Compressive Strength (MPa)
Age
(days) HSLWC SCLWC HSNWC
7 39.5 36.9 49.7
28 43.7 50.9 54.9
56 47.0 52.6 57.3
90 47.7 55.8 57.6
120 48.0 59.4 57.9
180 52.9 64.6 59.5
270 57.6 66.9 62.7
Density (kg/m3)
Moisture
Condition HSLWC SCLWC HSNWC
SSD 1939 2017 2416
AD 1881 1983 2376
OD 1849 1928 2327
Specific Strength (MPa/(tons/m3))
Moisture
Condition HSLWC SCLWC HSNWC
AD 23.2 25.7 23.1
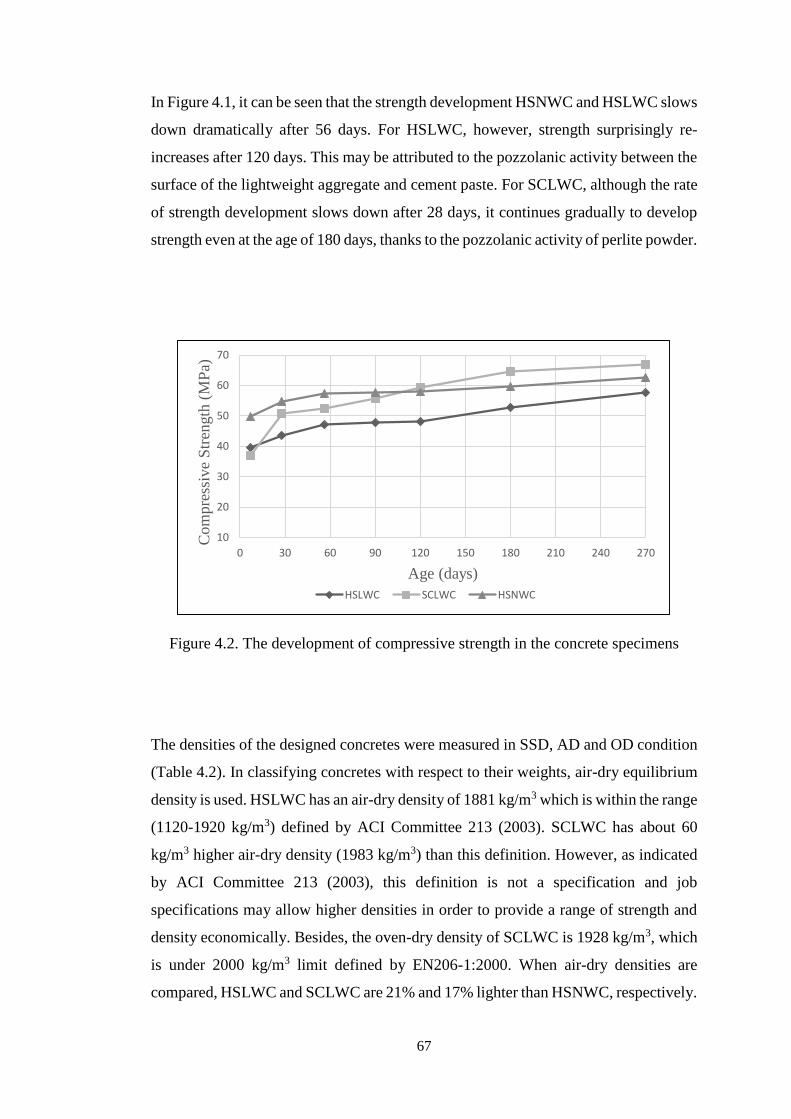
67
In Figure 4.1, it can be seen that the strength development HSNWC and HSLWC slows
down dramatically after 56 days. For HSLWC, however, strength surprisingly re-
increases after 120 days. This may be attributed to the pozzolanic activity between the
surface of the lightweight aggregate and cement paste. For SCLWC, although the rate
of strength development slows down after 28 days, it continues gradually to develop
strength even at the age of 180 days, thanks to the pozzolanic activity of perlite powder.
Figure 4.2. The development of compressive strength in the concrete specimens
The densities of the designed concretes were measured in SSD, AD and OD condition
(Table 4.2). In classifying concretes with respect to their weights, air-dry equilibrium
density is used. HSLWC has an air-dry density of 1881 kg/m3 which is within the range
(1120-1920 kg/m3) defined by ACI Committee 213 (2003). SCLWC has about 60
kg/m3 higher air-dry density (1983 kg/m3) than this definition. However, as indicated
by ACI Committee 213 (2003), this definition is not a specification and job
specifications may allow higher densities in order to provide a range of strength and
density economically. Besides, the oven-dry density of SCLWC is 1928 kg/m3, which
is under 2000 kg/m3 limit defined by EN206-1:2000. When air-dry densities are
compared, HSLWC and SCLWC are 21% and 17% lighter than HSNWC, respectively.
10
20
30
40
50
60
70
0 30 60 90 120 150 180 210 240 270
Com
pre
ssiv
e S
tren
gth
(M
Pa)
Age (days)
HSLWC SCLWC HSNWC

68
The specific strength values of the designed concretes were found to be 23.2, 25.7 and
23.1 MPa/(tons/m3) for HSLWC, SCLWC and HSNWC, respectively. Although, the
specific strength of SCLWC was found to be relatively higher than planned, it is still
comparable with the other two types of concretes.
4.2.2. Splitting and Flexural Tensile Strength
Table 4.3 illustrates the splitting and flexural tensile strength of the designed concretes
at the age of 28 and 90 days. It was found that the splitting tensile strength and flexural
tensile strength of HSLWC and SCLWC are approximately 1-2 MPa less than those
of HSNWC at similar specific strength. It can also be inferred from the results that
there is no significant tensile strength development between 28 and 90 days, except
for the splitting tensile strength of HSNWC and the flexural tensile strength of
HSLWC.
Table 4.3. Splitting and flexural tensile strength
Splitting Tensile Strength (MPa)
Age
(days) HSLWC SCLWC HSNWC
28 3.5 4.2 4.3
90 3.7 4.3 5.2
Flexural Tensile Strength (MPa)
Age
(days) HSLWC SCLWC HSNWC
28 5.1 6.0 8.0
90 5.9 6.1 8.0
4.2.3. Elastic Modulus
The elastic modulus of the designed concretes at the age of 28 and 90 days is given in
Table 4.4. There is no significant change between 28th and 90th days. The elastic
modulus of HSLWC and SCLWC corresponds approximately to 50% and 60% that of
HSNWC, respectively. The lower elastic modulus of lightweight concretes are
attributed to lower stiffness of natural perlite aggregates.

69
Table 4.4. Modulus of elasticity, compressive strength and density
Elastic Modulus (GPa)
Age
(days) HSLWC SCLWC HSNWC
28 22.2 26.0 44.9
90 22.2 25.9 42.5
Compressive Strength, MPa(psi)
Age
(days) HSLWC SCLWC HSNWC
28 43.7(6338) 50.9(7382) 54.9(7962)
90 47.7(6918) 55.8(8093) 57.6(8354)
Density, kg/m3 (lb/ft3)
Moisture
Condition HSLWC SCLWC HSNWC
AD 1881(117) 1983(124) 2376(148)
In Figures 4.3 and 4.4, the stress-strain curves of HSLWC, SCLWC and HSNWC up
to 40% of corresponding ultimate stress are given. Each line represents the average of
3 specimens.
Figure 4.3. Stress-strain curves up to 40% of ultimate stress (28 days)
ESCLWC,28 = 22.2 GPa
ESCLWC,28 = 26.0 GPaEHSNWC,28 = 44.9 GPa
0
5
10
15
20
25
0.0000 0.0001 0.0002 0.0003 0.0004 0.0005 0.0006 0.0007 0.0008 0.0009
Com
pre
ssiv
e S
tres
s (M
Pa)
Strain (mm/mm)
HSLWC SCLWC HSNWC

70
Figure 4.4. Stress-strain curves up to 40% of ultimate stress (90 days)
The experimental results were also compared with ACI 318, Norwegian Standard and
CEB-FIP formulas for elastic modulus estimation.
According to ACI 318, elastic modulus of the concretes up to 41 MPa compressive
strength and having a unit weight between 90 lb/ft3 (1442kg/m3) and 155 lb/ft3
(2483kg/m3) can be calculated by using the following formula:
Ec = 33 x wc1.5 x fc
0.5 (Equation 4.1)
wc: air-dry unit weight (lb/ft3)
fc: 28 days compressive strength (psi)
Though HSLWC and SCLWC have higher compressive strength than 41 MPa, if the
formula is applied:
For HSLWC; Ec = 33 x 1171.5 x 63380.5 = 3324825 psi = 22.9 GPa vs. 22.2 GPa (exp.)
For SCLWC; Ec = 33 x 1241.5 x 73820.5 = 3915015 psi = 27.0 GPa vs. 26.0 GPa (exp.)
ESCLWC,90 = 22.2 GPa
ESCLWC,90 = 25.9 GPaEHSNWC,90 = 42.5 GPa
0
5
10
15
20
25
0.0000 0.0001 0.0002 0.0003 0.0004 0.0005 0.0006 0.0007 0.0008 0.0009 0.0010
Com
pre
ssiv
e S
tres
s (M
Pa)
Strain (mm/mm)
HSLWC SCLWC HSNWC

71
These results show that ACI 318 formula overestimates the modulus of elasticity by
only about 3% for HSLWC and SCLWC.
Norwegian Standards have also a formula for elastic modulus of high strength
lightweight concretes with a compressive strength between 60 and 100 MPa (Neville,
2003, p. 704):
Ec = 9.5 x fc0.3 x (/2400)1.5 (Equation 4.2)
fc: 28 days compressive strength (MPa) : density of concrete (kg/m3)
Although HSLWC and SCLWC have lower compressive strength than 60 MPa, if the
formula is applied:
For HSLWC; Ec = 9.5 x 43.70.3 x (/2400)1.5 = 20.5 GPa vs. 22.2 GPa (exp.)
For SCLWC; Ec = 9.5 x 50.90.3 x (/2400)1.5 = 23.2 GPa vs. 26.0 GPa (exp.)
As can be seen from the results, Norwegian Standard formula underestimates the
modulus of elasticity by 8 and 11% for HSLWC and SCLWC, respectively.
None of the formulas above is for the strength range of HSLWC and SCLWC.
Nevertheless, ACI 318 formula yields to quite accurate estimations, considering the
error was only about 3 percent.
CEB-FIP Model Code (1990) formula quite accurately estimates elastic modulus of
HSNWC, with an error of 2 percent only. According to this model, for normal-weight
aggregates, elastic modulus can be calculated by the following formula:
Ec = α x 104 x (fc) 1/3 (Equation 4.3)
fc: 28 days compressive strength (MPa)
α, for dense limestone: 1.2 (Mehta & Monteiro, 2006, p. 92).
For HSNWC; Ec = 1.2 x 104 x (54.9)1/3 = 45607 MPa = 45.6 GPa vs. 44.9 GPa (exp.)

72
4.2.4. Linear Coefficient of Thermal Expansion
Table 4.5 shows the change in gauge length of the specimens with the change in the
temperature. For each type of the concrete, two specimens of each having two gauges
were tested. Using the measurements given in Table 4.5, scatter diagrams (Figure 4.5-
4.7) were drawn. Then using Equation 3.6, the linear coefficients of thermal expansion
were calculated (Table 4.6).
Table 4.5. The change in gauge length of the specimens in thermal expansion test
T (oC) Gauge
#
Gauge Length (mm)
HSLWC SCLWC HSNWC
25
1 250.055 250.066 250.053
2 250.066 250.066 250.058
3 250.069 250.067 250.059
4 250.071 250.068 250.060
40
1 250.078 250.087 250.078
2 250.091 250.090 250.082
3 250.095 250.094 250.083
4 250.097 250.095 250.084
55
1 250.106 250.120 250.105
2 250.122 250.120 250.106
3 250.122 250.121 250.109
4 250.126 250.124 250.110
70
1 250.139 250.153 250.134
2 250.145 250.154 250.137
3 250.153 250.155 250.137
4 250.158 250.163 250.138
Table 4.6. The linear coefficients of thermal expansion (mm/mm/oC)
HSLWC SCLWC HSNWC
7.45 x 10⁻⁶ 7.95 x 10⁻⁶ 7.01 x 10⁻⁶

73
Figure 4.5. Change in gauge length with temperature change (HSLWC)
(L/T) = 0.001862
L0 = 250.063933
α = (L/T)/L0 = 0.001862/250.063933= 7.45 x 10⁻⁶ mm/mm/oC for HSLWC.
Figure 4.6. Change in gauge length with temperature change (SCLWC)
L/T = 0.001862
250.040
250.060
250.080
250.100
250.120
250.140
250.160
250.180
10 20 30 40 50 60 70 80
Gau
ge
Len
gth
(mm
)
Temperature (oC)Gauge Measurements
L/T = 0.001988
250.040
250.060
250.080
250.100
250.120
250.140
250.160
250.180
10 20 30 40 50 60 70 80
Gau
ge
Len
gth
(mm
)
Temperature(oC)
Gauge Measurements

74
(L/T) = 0.001988
L0 = 250.064192
α = (L/T)/L0 = 0.001988/250.064192 = 7.95 x 10⁻⁶ mm/mm/oC for SCLWC.
Figure 4.7. Change in gauge length with temperature change (HSNWC)
(L/T) = 0.001752
L0 = 250.056408
α = (L/T)/L0 = 0.001752/250.056408 = 7.01 x 10⁻⁶ mm/mm/oC for HSNWC.
Normally, lightweight concretes are expected to have lower linear coefficient of
thermal expansion than its normal weight counterparts, however the results have
shown that thermal expansion of HSLWC and SCLWC is slightly higher than
HSNWC. This may be attributed to the mineralogy of the aggregates. It is known that
siliceous aggregates generally have higher thermal expansion than limestone
aggregates. If perlite containing HSLWC and SCLWC are compared with each other,
HSLWC has lower linear coefficient of thermal expansion. This may be attributed to
higher air content of HSLWC, which results in lower internal thermal stresses.
L/T = 0.001752
250.040
250.060
250.080
250.100
250.120
250.140
250.160
250.180
10 20 30 40 50 60 70 80
Gau
ge
Len
gth
(mm
)
Temperature(oC)Gauge Measurements

75
4.3. Results of Durability Tests
4.3.1. Rapid Chloride Ion Penetrability
The results of rapid chloride ion penetrability tests have been tabulated in Table 4.7.
At the age of 28 days, HSLWC has low penetrability and SCLWC has very low
penetrability. On the other hand HSNWC has moderate penetrability.
Table 4.7. Chloride ion penetrability of concrete specimens
Charges Passed(coulombs) - Chloride Ion Penetrability
Age(days) HSLWC SCLWC HSNWC
28 1486 Low 800 Very Low 3696 Moderate
90 767 Very Low 271 Very Low 3054 Moderate
These results are as expected. The highest binder content and lowest w/cm ratio of
SCLWC among the other two, yielded to the lowest penetrability. The effect of
pozzolanic activity also have a major part in this result.
Although HSLWC and HSNWC has similar binder content, HSLWC has a lower
penetrability because of several reasons such as lower w/c ratio, disconnected porous
nature of perlite aggregate and pozzolanic activity in contact zone.
At the age of 90 days, the chloride ion penetrability of HSLWC was reduced by half
and penetrability of SCLWC was reduced to one-third. However, there was only about
20% reduction in the penetrability of HSNWC.
In Figures 4.8 and 4.9, total charges passed versus time during the RCPT have been
illustrated for 28 days and 90 days, respectively.

76
Figure 4.8. RCPT, total charges passed vs. time (28 days)
Figure 4.9. RCPT, total charges passed vs. time (90 days)
0
500
1000
1500
2000
2500
3000
3500
4000
0 60 120 180 240 300 360
Ch
arges
Pas
sed
(co
ulo
mb
)
Time (min)
HSLWC SCLWC HSNWC
0
500
1000
1500
2000
2500
3000
3500
0 60 120 180 240 300 360
Char
ges
Pas
sed (
coulo
mb)
Time (min)
HSLWC SCLWC HSNWC

77
4.3.2. Specimens in Aggressive Chemical Solutions
4.3.2.1. Magnesium Sulfate Solution
The change in the compressive strength of the specimens stored in 0.352 M MgSO4
solution is as shown in the figures from 4.10 to 4.12, separately for each type of the
concrete. The line representing the control group and the line representing the
specimens in the magnesium sulfate solution almost coincides in all graphs. This
means that HSLWC, SCLWC and HSNWC are equally resistant to sulfate attack when
the change in compressive strength is considered.
Figure 4.10. Change in compressive strength of HSLWC specimens stored in
magnesium sulfate solution
0
10
20
30
40
50
60
70
0 30 60 90 120 150 180 210 240 270
Com
pre
ssiv
e S
tren
gth
(M
Pa)
Age (days)
HSLWC-control HSLWC-0.352M Magnesium Sulphate Solution

78
Figure 4.11. Change in compressive strength of SCLWC specimens stored in
magnesium sulfate solution
Figure 4.12 Change in compressive strength of HSNWC specimens stored in
magnesium sulfate solution
0
10
20
30
40
50
60
70
80
0 30 60 90 120 150 180 210 240 270
Com
pre
ssiv
e S
tren
gth
(M
Pa)
Age (days)
SCLWC-control SCLWC-0.352M Magnesium Sulphate Solution
0
10
20
30
40
50
60
70
80
0 30 60 90 120 150 180 210 240 270
Com
pre
ssiv
e S
tren
gth
(M
Pa)
Age (days)
HSNWC-control HSNWC-0.352M Magnesium Sulphate Solution

79
In Figures 4.13 to 4.15, surface deterioration of the specimens stored in magnesium
sulfate solution have been illustrated. It can be concluded that surface deterioration of
HSLWC and SCLWC is relatively higher than HSNWC.
Figure 4.13. Surface deterioration of HSLWC specimens stored in magnesium sulfate
solution
Figure 4.14. Surface deterioration of SCLWC specimens stored in magnesium sulfate
solution

80
Figure 4.15. Surface deterioration of HSNWC specimens stored in magnesium sulfate
solution
4.3.2.2 Sodium Bicarbonate Solution
Carbonation does not cause harmful deterioration of concrete, however it reduces the
pH of concrete pore solution. For reinforced concrete, this causes passive layer to lost,
which protects rebars from corrosion. On the other hand, carbonation have several
positive consequences such as increase in surface hardness and strength and reduced
surface permeability of concrete. This is mainly because, as calcium hydroxide
carbonates and turns into calcium carbonate, it occupies larger volume and fills the
pores in concrete.
In figures from 4.16 to 4.18, the change in the compressive strength of the specimens
stored in 0.352M NaHCO3 solution is as presented, separately for each type of the
concrete. There is no significant increase in strength for none of the concretes stored
in the solution since all concretes are sufficiently impermeable and interior zones are
unaffected. This was shown by phenolphthalein test and shown that pH was still higher
than 9.5 so that it still gives pink colour when applied on to concrete. On the other
hand, it is visually observed that surface of the specimens in carbonate solution has
become less porous and smoother due to surface carbonation. In Figures 4.19 to 4.21,
the carbonation on the surface the specimens stored in sodium bicarbonate solution
and interior zones tested by phenolphthalein have been illustrated.

81
Figure 4.16. Change in compressive strength of HSLWC specimens stored in sodium
bicarbonate solution
Figure 4.17. Change in compressive strength of SCLWC specimens stored in sodium
bicarbonate solution
0
10
20
30
40
50
60
70
0 30 60 90 120 150 180 210 240 270
Com
pre
ssiv
e S
tren
gth
(M
Pa)
Age (days)
HSLWC-control HSLWC-0.352M Sodium Bicarbonate Solution
0
10
20
30
40
50
60
70
80
0 30 60 90 120 150 180 210 240 270
Com
pre
ssiv
e S
tren
gth
(M
Pa)
Age (days)
SCLWC-control SCLWC-0.352M Sodium Bicarbonate Solution
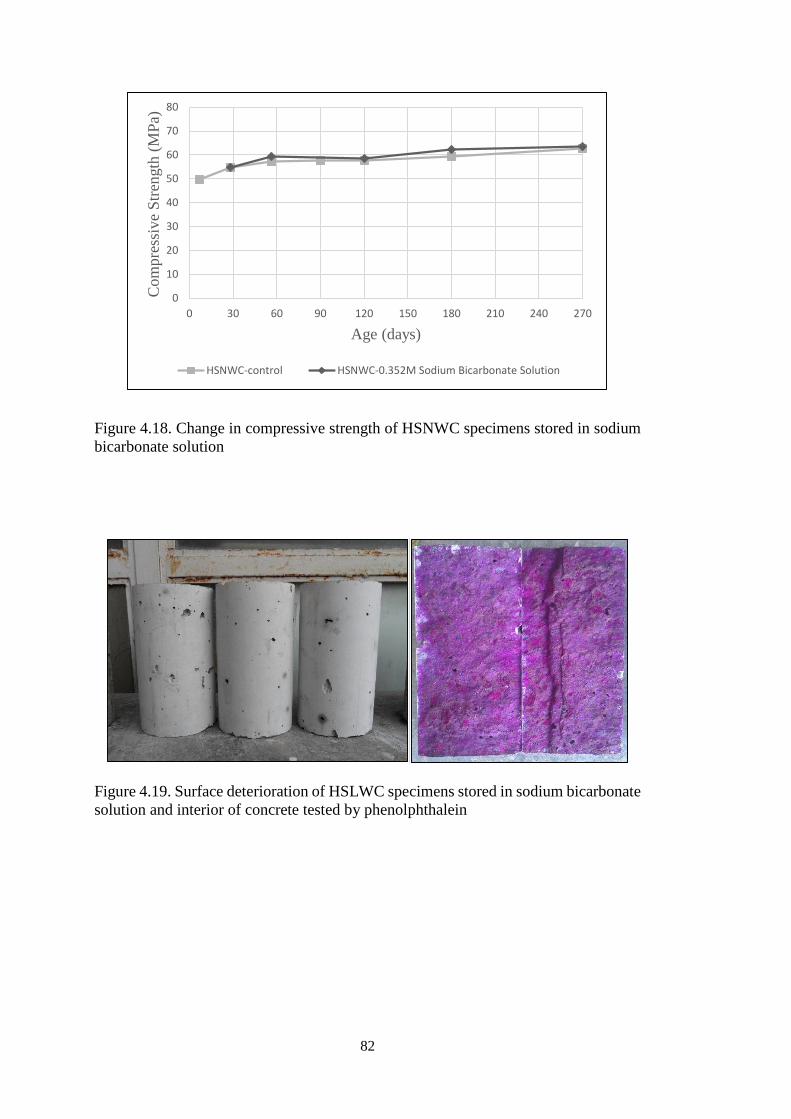
82
Figure 4.18. Change in compressive strength of HSNWC specimens stored in sodium
bicarbonate solution
Figure 4.19. Surface deterioration of HSLWC specimens stored in sodium bicarbonate
solution and interior of concrete tested by phenolphthalein
0
10
20
30
40
50
60
70
80
0 30 60 90 120 150 180 210 240 270
Com
pre
ssiv
e S
tren
gth
(M
Pa)
Age (days)
HSNWC-control HSNWC-0.352M Sodium Bicarbonate Solution

83
Figure 4.20. Surface deterioration of SCLWC specimens stored in sodium bicarbonate
solution and interior of concrete tested by phenolphthalein
Figure 4.21. Surface deterioration of HSNWC specimens stored in sodium bicarbonate
solution and interior of concrete tested by phenolphthalein
4.3.2.3. Sulphuric Acid Solution
The change in the compressive strength of the specimens stored in 1% H2SO4 solution
(pH=1) is given in figures from 4.22 to 4.24, separately for each type of the concrete.
As it can be seen from the graphs, the line representing the control group and the line
representing the specimens in the sulphuric acid solution almost coincides for the first
three months of exposure. After that point specimens started to show loss in

84
compressive strength. At the age of 9 months, percentage loss in the compressive
strengths compared to control specimens were 12, 14, 0.4 percent, respectively for
HSLWC, SCLWC and HSNWC. It can be concluded that HSNWC is more durable to
sulphuric acid than HSLWC and SCLWC. Nevertheless, when it is independently
evaluated, HSLWC and SCLWC can also be considered durable since their
compressive strengths under such aggressive conditions are still higher than the 28-
day compressive strengths, namely the compressive strengths at the start of the
exposure.
Figure 4.22. Change in compressive strength of HSLWC specimens stored in sulphuric
acid solution
0
10
20
30
40
50
60
70
0 30 60 90 120 150 180 210 240 270
Com
pre
ssiv
e S
tren
gth
(M
Pa)
Age (days)
HSLWC-control HSLWC-1% Sulphuric Acid Solution

85
Figure 4.23. Change in compressive strength of SCLWC specimens stored in sulphuric
acid solution
Figure 4.24. Change in compressive strength of HSNWC specimens stored in
sulphuric acid solution
0
10
20
30
40
50
60
70
80
0 30 60 90 120 150 180 210 240 270
Com
pre
ssiv
e S
tren
gth
(M
Pa)
Age (days)
SCLWC-control SCLWC-1% Sulphuric Acid Solution
0
10
20
30
40
50
60
70
80
0 30 60 90 120 150 180 210 240 270
Com
pre
ssiv
e S
tren
gth
(M
Pa)
Age (days)
HSNWC-control HSNWC-1% Sulphuric Acid Solution

86
In Figures 4.25 to 4.27, surface deterioration of the specimens stored in sulphuric acid
solution have been illustrated. It can be seen that the surface of all concretes have been
deteriorated. In addition, for HSLWC and SCLWC, a weak cover formation was
observed. The thickness of this deteriorated cover had been reached to 4 mm at the end
of 8 months of exposure. This corresponds to 15% reduction in load bearing area,
which is parallel to strength reduction (12-14%) observed in these specimens.
Figure 4.25. Surface deterioration of HSLWC specimens stored in sulphuric acid
solution
Figure 4.26. Surface deterioration of SCLWC specimens stored in sulphuric acid
solution
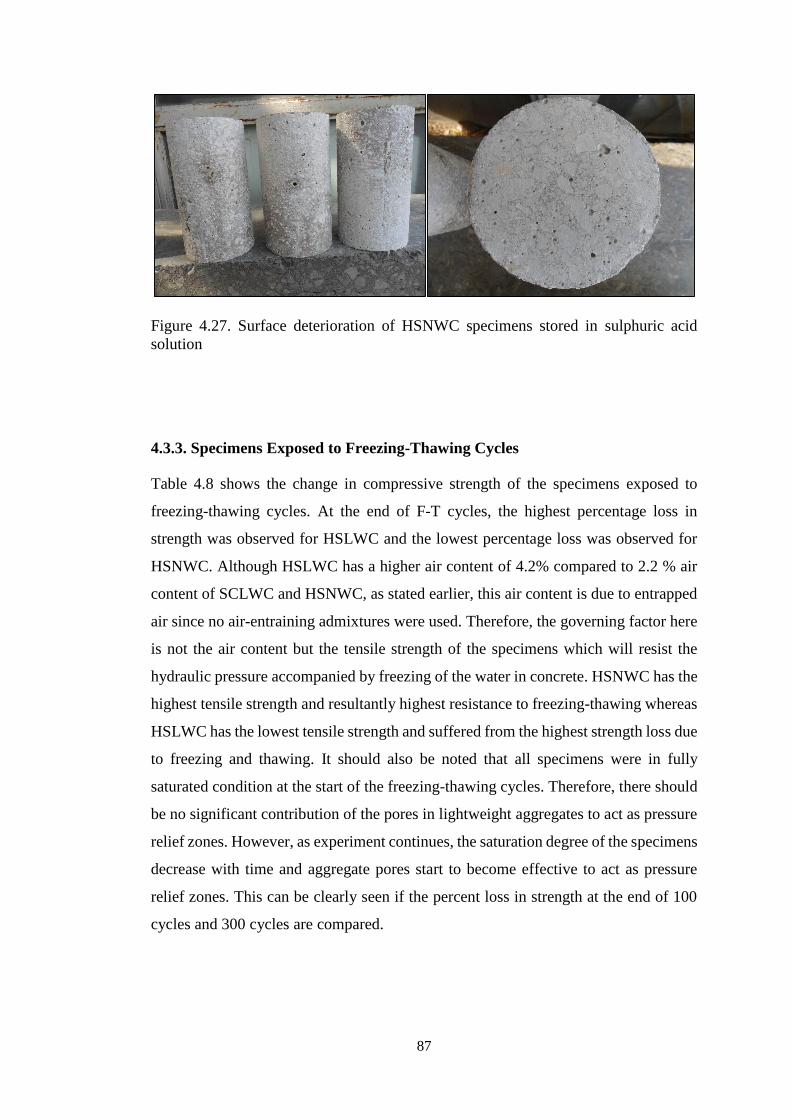
87
Figure 4.27. Surface deterioration of HSNWC specimens stored in sulphuric acid
solution
4.3.3. Specimens Exposed to Freezing-Thawing Cycles
Table 4.8 shows the change in compressive strength of the specimens exposed to
freezing-thawing cycles. At the end of F-T cycles, the highest percentage loss in
strength was observed for HSLWC and the lowest percentage loss was observed for
HSNWC. Although HSLWC has a higher air content of 4.2% compared to 2.2 % air
content of SCLWC and HSNWC, as stated earlier, this air content is due to entrapped
air since no air-entraining admixtures were used. Therefore, the governing factor here
is not the air content but the tensile strength of the specimens which will resist the
hydraulic pressure accompanied by freezing of the water in concrete. HSNWC has the
highest tensile strength and resultantly highest resistance to freezing-thawing whereas
HSLWC has the lowest tensile strength and suffered from the highest strength loss due
to freezing and thawing. It should also be noted that all specimens were in fully
saturated condition at the start of the freezing-thawing cycles. Therefore, there should
be no significant contribution of the pores in lightweight aggregates to act as pressure
relief zones. However, as experiment continues, the saturation degree of the specimens
decrease with time and aggregate pores start to become effective to act as pressure
relief zones. This can be clearly seen if the percent loss in strength at the end of 100
cycles and 300 cycles are compared.

88
Table 4.8. Compressive strength of the specimens exposed to freezing-thawing cycles
#
cycles
HSLWC SCLWC HSNWC
c (MPa) % loss
in c
c (MPa) % loss
in c
c (MPa) % loss
in c Ctrl F-T Ctrl F-T Ctrl F-T
0 43.7 - - 50.9 - - 54.9 - -
100 46.2 43.3 6.3 51.9 49.6 4.4 56.4 53.7 4.8
300 47.5 43.8 7.8 54.6 51.2 6.2 57.5 54.6 5.0

89
CHAPTER 5
CONCLUSIONS
The conclusions from the experimental study conducted in this thesis can be listed as
below:
1. Natural perlite aggregate can be satisfactorily utilized in the production of
high-performance lightweight concretes with 28-day compressive strengths up
to 50 MPa.
2. Self-compacting high-strength lightweight concretes of good workability
characteristics can be produced by using natural perlite aggregate and high
volume (50%) perlite powder as pozzolan.
3. To achieve similar specific strength to that of high strength normal weight
concrete, high strength lightweight concrete with natural perlite aggregate
requires similar cement contents (about 300 kg/m3).
4. At similar specific strength, high performance lightweight concretes with
natural perlite aggregate is about 20% lighter than high-strength normal weight
concrete.
5. At similar specific strength, elastic modulus of high performance lightweight
concretes with natural perlite aggregate is about 50-60% of high-strength
normal weight concrete with limestone aggregate and this was attributed to
lower stiffness of lightweight aggregates. It has also shown that ACI 318
formula for elastic modulus estimation is applicable to structural lightweight
concretes with natural perlite aggregates.
6. The linear coefficient of thermal expansion of high-performance lightweight
concretes with natural perlite aggregate was found to be slightly higher than
that of high-strength normal weight concrete with limestone aggregate. This
was attributed to the fact that thermal expansion of concretes with siliceous
aggregates have tendency to show greater expansion than those with limestone

90
aggregates. Although the perlite aggregate is porous and thus expected to have
lower expansion, it was concluded that its chemical structure was more
dominant in determining its expansion characteristics.
7. The chloride permeability of self-compacting high-strength lightweight
concrete with natural perlite aggregate and perlite powder was found to be only
about 20 and 10% of high-strength normal weight concrete of similar specific
strength at 28 and 90 days, respectively. Similarly, high-strength lightweight
concrete with natural perlite aggregate has a permeability corresponds to about
50 and 25% of high-strength normal weight concrete at 28 days and 90 days,
respectively. This superior performance of these lightweight concretes was
mainly attributed to improved contact zone due to several factors including
lower w/b ratio, internal curing and pozzolanic activity.
8. High-performance lightweight concretes with natural perlite aggregate and
high-strength normal weight concrete were found to be similarly durable
against magnesium sulfate attack when the change in compressive strength
compared to control specimens is considered. However, the surface
deterioration of these lightweight concretes in magnesium sulfate solution were
found to be higher than that of limestone containing high-strength normal
weight concrete.
9. Perlite containing high-performance lightweight concretes have been found to
suffer considerably higher surface deterioration than that of limestone
containing high strength normal weight concrete when exposed to sulphuric
acid attack and a formation of a weak cover were observed on the surface of
the specimens. This deteriorated and easily scrapable cover corresponds about
15% reduction in cross-sectional area of perlite containing concrete specimens,
which is parallel to the percent loss in compressive strength of these specimens
(12-14%).
10. At similar specific strength, the resistance to freezing-thawing cycles of high-
performance lightweight concretes was found to be slightly lower than that of
high-strength normal weight concrete. Since no air-entraining agent was used
in the designed concretes, this result was attributed to the higher tensile
strength of the normal weight concrete which resists the hydraulic pressure due
to freezing of water in concrete.

91
CHAPTER 6
RECOMMENDATIONS
As evidenced by the findings in this study, there is a great potential especially for self-
compacting lightweight concrete with natural perlite aggregate and perlite powder.
Considering this potential, it can be beneficial in future studies on natural perlite
aggregate to concentrate on self-compacting lightweight concrete rather than
conventional lightweight concrete. Further research topics may include the following:
1. The mechanical properties and durability of perlite containing lightweight
concretes may be studied for different binder contents and w/c ratios.
2. Ternary lightweight mixtures containing silica fume, fly-ash, metakaolin, etc.
may be designed to improve mechanical properties and durability
characteristics.
3. Concrete members in structures such as columns and beams are normally
confined by reinforcements. The perlite containing lightweight concrete
specimens confined by spiral reinforcements can be studied to realistically
predict its structural performance.
4. The thermal conductivity and fire resistance of perlite containing lightweight
concretes may be investigated.

92

93
REFERENCES
ACI Committee 211. (2004). Standard Practice for Selecting Proportions for
Structural Lightweight Concrete(ACI 211.2-98). Farmington Hills, Michigan:
American Concrete Institue.
ACI Committee 213. (1987). Guide for Structural Lightweight-Aggregate
Concrete(ACI 213R-87). Farmington Hills, Michigan: American Concrete
Institue.
ACI Committee 213. (2003). Guide for Structural Lightweight-Aggregate
Concrete(ACI 213R-03). Farmington Hills, Michigan: American Concrete
Institue.
ACI Committee 318. (1999). Building Code Requirements for Structural
Concrete(ACI 318-99) and Commentary(ACI 318R-99). Farmington Hills,
Michigan: American Concrete Institute.
Aitcin, P.-C. (2008). Binders for Durable and Sustainable Concrete. New York:
Taylor & Francis.
Al-Khaiat, H., & Haque, N. (1999). Strength and durability of lightweight and normal
weight concrete. Journal of Materials in Civil Engineering, 11, 231-235.
ASTM C1012/C1012M-12. (2012). Standard Test Method for Length Change of
Hydraulic-Cement Mortars Exposed to a Sulfate Solution. West
Conshohocken, PA: ASTM International.
ASTM C109/C109M-11b. (2012). Standard Test Method for Compressive Strength of
Hydraulic Cement Mortars (Using 2-in. or [50-mm] Cube Specimens). West
Conshohocken, PA: ASTM International.
ASTM C1202-12. (2012). Standard Test Method for Electrical Indication of
Concrete's Ability to Resist Chloride Ion Penetration. West Conshohocken,
PA: ASTM International.
ASTM C1260-07. (2007). Standard Test Method for Potential Alkali Reactivity of
Aggregates (Mortar-Bar Method). West Conshohocken, PA: ASTM
International.
ASTM C138/138M-12. (2012). Standard Test Method for Density (Unit Weight),
Yield, and Air Content (Gravimetric) of Concrete. West Conshohocken, PA:
ASTM International.
ASTM C143/C143M-10a. (2010). Standard Test Method for Slump of Hydraulic-
Cement Concrete. West Conshohocken, PA: ASTM International.

94
ASTM C1611/C1611M-09b. (2009). Standard Test Method for Slump Flow of Self-
Consolidating Concrete. West Conshohocken, PA: ASTM International.
ASTM C192/C192M-07. (2007). Standard Practice for Making and Curing Concrete
Test Specimens in the Laboratory. West Conshohocken, PA: ASTM
International.
ASTM C231/C231M-10. (2010). Standard Test Method for Air Content of Freshly
Mixed Concrete by the Pressure Method. West Conshohocken, PA: ASTM
International.
ASTM C293/C293M-10. (2010). Standard Test Method for Flexural Strength of
Concrete (Using Simple Beam with Center-Point Loading). West
Conshohocken, PA: ASTM International.
ASTM C311-11b. (2012). Standard Test Methods for Sampling and Testing Fly Ash
or Natural Pozzolans for Use in Portland-Cement Concrete. West
Conshohocken, PA: ASTM International.
ASTM C33/C33M-11a. (2011). Standard Specification for Concrete Aggreggates.
West Conshohocken, PA: ASTM International.
ASTM C330/330M-09. (2010). Standard Specification for Lightweight Aggregates for
Structural Concrete. West Conshohocken, PA: ASTM International.
ASTM C39/39M-12a. (2012). Standard Test Method for Compressive Strength of
Cylindrical Concrete Specimens. West Conshohocken, PA: ASTM
International.
ASTM C403/C403M-05. (2005). Standard Test Method for Time of Setting of
Concrete Mixtures by Penetration Resistance. West Conshohocken, PA:
ASTM International.
ASTM C469/C469M-10. (2010). Standard Test Method for Static Modulus of
Elasticity and Poisson's Ratio of Concrete in Compression. West
Conshohocken, PA: ASTM International.
ASTM C496/C496M-11. (2011). Standard Test Method for Splitting Tensile Strength
of Cylindrical Concrete Specimens. West Conshohocken, PA: ASTM
International.
ASTM C666/C666M-03. (2008). Standard Test Method for Resistance of Concrete to
Rapid Freezing and Thawing. West Conshohocken, PA: ASTM International.
ASTM C78/C78M-10. (2010). Standard Test Method for Flexural Strength of
Concrete (Using Simple Beam with Third-Point Loading). West
Conshohocken, PA: ASTM International.
Aşık, M. (2006). Structural Lightweight Concrete with Natural Perlite Aggregate and
Perlite Powder. MSc Thesis, Middle East Techical University, Department of
Civil Engineering, Ankara.

95
Bakharev, T., Sanjayan, J. G., & Cheng, Y. -B. (2001). Resistance of alkali-activated
slag concrete to carbonation. Cement and Concrete Research, 31, 1277-1283.
Castro, J., De la Varga, I., Golias, M., & Weiss, W. (2010). Extending Internal Curing
Concepts to Mixtures Containing High Volumes of Fly Ash. Concrete Bridge
Conference: Achieving Safe, Smart & Sustainable Bridges. Phoenix, Arizona.
Chi, J. M., Huang, R., Yang, C. C., & Chang, J. J. (2003). Effect of aggregate
properties on the strength and stiffness of lightweight concrete. Cement &
Concrete Composites, 25, 197-205.
Chia, K. S., & Zhang, M.-H. (2002). Water permeability and chloride penetrability of
high-strength lightweight aggregate concrete. Cement and Concrete Research,
32, 639-645.
EFNARC. (2005). European Guidelines for Self-compacting Concrete. Retrieved
2013, from The European Federation of Specialist Construction Chemicals
and Concrete Systems Web Site:
http://efnarc.org/pdf/SCCGuidelinesMay2005.pdf
EN206-1. (2000). Concrete - Part 1: Specification, performance, production and
conformity. Brussels: European Committee for Standardization.
Erdoğan, T. Y. (2005). Materials of Construction. Ankara: METU Press.
ESCSI. (2010). Structural Lightweight Concrete-Featured Projects. Retrieved 2013,
from Expanded Shale, Clay and Slate Institute Web Site:
http://www.escsi.org/ContentPage.aspx?id=275
Harrison, T. A., Dewar, J. D., & Brown, B. V. (2001). Freeze-thaw resisting concrete
- its achievement in UK. London: Construction Industry Research and
Information Association.
Holm, T. A., & Bremner, T. W. (2000). State-of-art-report on high-strength, high-
durability structural low-density concrete for applications in severe marine
environments. U.S. Army Corps of Engineers, Engineer Research and
Development Center.
Hwang, C.-L., & Hung, M.-F. (2005). Durability design and performance of self-
consolidating lightweight concrete. Construction and Building Materials, 19,
619-626.
Kabay, N., & Aköz, F. (2012). Effect of prewetting methods on some fresh and
hardened properties of concrete with pumice aggregate. Cement & Concrete
Composites, 34, 503-507.
Kayali, O., & Zhu, B. (2005). Chloride induced reinforcement corrosion in lightweight
aggregate high-strength fly ash concrete. Construction and Building Materials,
19, 327-336.

96
Kim, Y. J., Choi, Y. W., & Lachemi, M. (2010). Characteristics of self-consolidating
concrete using two types of lightweight coarse aggregates. Construction and
Building Materials, 24, 11-16.
Kosmatka, S. H., Kerkhoff, B., & Panarese, W. C. (2003). Design and Control of
Concrete Mixtures (14th ed.). Skokie, Illinois, USA: Portland Cement
Association.
Lo, T. Y., Tang, P. W., Cui, H. Z., & Nadeem, A. (2007). Comparison of workability
and mechanical properties of self-compacting lightweight concrete and normal
self-compacting concrete. Materials Research Innovations, 11, 45-50.
Mehta, P. K., & Monteiro, P. J. (2006). Concrete: Microstructure, Properties and
Materials (3rd ed.). New York: McGraw-Hill.
Mouli, M., & Khelafi, H. (2008). Performance characteristics of lightweight aggregate
concrete containing natural pozzolan. Building and Environment, 43, 31-36.
Neville, A. M. (2003). Properties of Concrete (4th ed.). Harlow, England: Prentice
Hall.
Neville, A. M., & Brooks, J. J. (2010). Concrete Technology (2nd ed.). Harlow,
England: Prentice Hall.
Papanicolaou, C. G., & Kaffetzakis, M. I. (2011). Lightweight Aggregate Self-
Compacting Concrete: State-of-the-Art & Pumice Application. Journal of
Advanced Concrete Technology, 9(1), 15-29.
Shannag, M. J. (2011). Characteristics of lightweight concrete containing mineral
admixtures. Construction and Building Materials, 25, 658-662.
Sika. (2007). Sika ViscoCrete-SF 18 High Performance Superplasticizer. Product Data
Sheet, Sika Yapı Kimyasalları A.Ş., İstanbul. Retrieved 2013, from
http://tur.sika.com/dms/getredirect.get/tr01.webdms.sika.com/123
Topçu, İ. B., & Uygunoğlu, T. (2010). Effect of aggregate type on properties of
hardened self-consolidating lightweight concretes. Construction and Building
Materials, 24, 1286-1295.
Uygunoğlu, T., & Topçu, İ. B. (2009). Thermal expansion of self-consolidating normal
and lightweight aggregate concrete at elevated temperature. Construction and
Building Materials, 23, 3063-3069.