High Performance Computation Tools for Real-Time Security ...
19
High Performance Computation Tools for Real-Time Security Assessment IEEE PES GM 2014, Washington, DC Metro Area, July 27-31, 2014 Panel Session: Faster than Real-time Dynamics Simulation 1 Alberto Del Rosso, PhD Electric Power Research Institute
Transcript of High Performance Computation Tools for Real-Time Security ...

High Performance Computation Tools for Real-Time Security Assessment
IEEE PES GM 2014, Washington, DC Metro Area, July 27-31, 2014
Panel Session: Faster than Real-time Dynamics Simulation
1
Alberto Del Rosso, PhD
Electric Power Research Institute

2
DOE Award # DE-OE0000628Project Objective and Outcome
• Develop a set of new algorithms and computational approaches for improving situational awareness and support operator decision making by means of: real-time assessment of system dynamic performance
operational security risk
• Outcomes: Computational approach for ultra-fast power-system dynamic
simulation
Mathematical algorithms for synchrophasor-based and hybrid DSA
Specification for advanced visualization software
Outcomes are expected to set a foundation for a new generation of real-time Dynamic Security Assessment tools

3
Wide-area situational awareness
Measurements give us current
system states:
For true situation awareness we
need to know;
Where the edge is
How close to the edge we can
safely (reliably) operate
Where would the states be during
& after the next contingency
Decision support tool should provide:• A succinct view of the current status of the
power system• “look-ahead” capability based on “what-if”
scenarios
Courtesy of Mahendra Patel
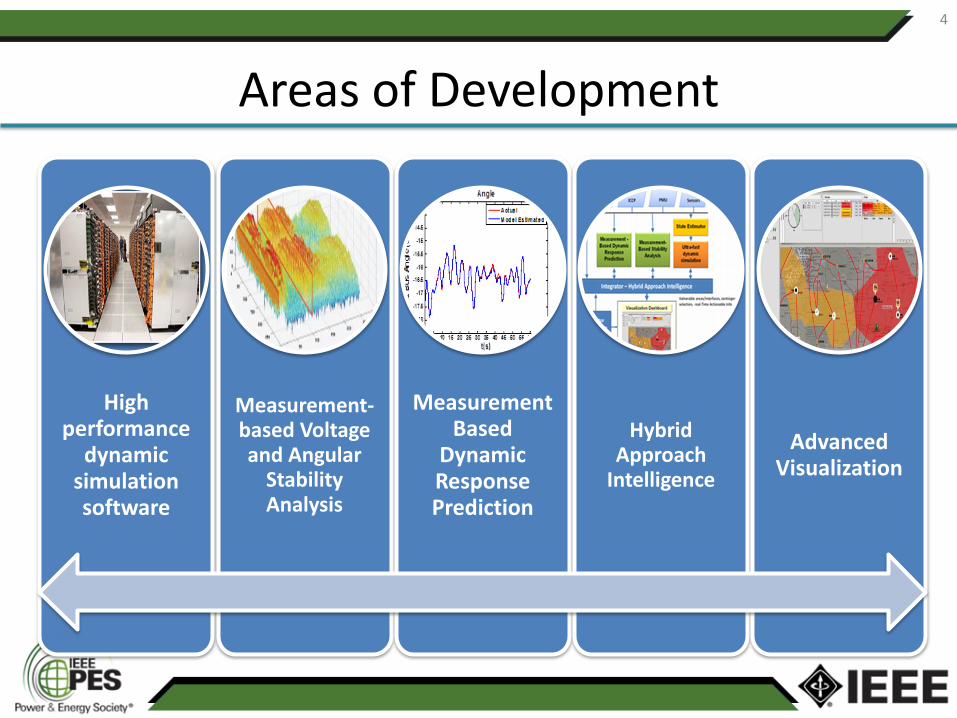
Areas of Development
4
High performance
dynamic simulation software
Measurement-based Voltage and Angular
Stability Analysis
Measurement Based
Dynamic Response Prediction
Hybrid Approach
Intelligence
Advanced Visualization

Project Participants and Responsibilities
5
Project ManagementEPRI
Development of High
Performance Dynamic
Simulation Software
Lead: LLNL
Development of
Measurement-Based
Tools
Lead: UTK
Integration of
Simulation-Based and
Measurement-Based
ToolsLead: EPRI
Development of
Visualization Interface
Lead: Alstom Grid
Southern CompanyAmerican Electric Power (AEP)PJM InterconnectionTennessee Valley Authority (TVA)
Utility/ISO Participants
EPRI: Electric Power Research InstituteLLNL: Lawrence Livermore National LaboratoryUTK: University of Tennessee Knoxville

Project Team
6
• Alberto Del Rosso, PM (EPRI)
• Evangelos Farantatos (EPRI)
• Navin Bhatt (EPRI)
• Liang Min (LLNL)
• Carol Woodward (LLNL)
• Steve Smith (LLNL)
• Chaoyang Jing (eMIT)
• Kai Sun (UTK)
• Yilu Liu (UTK)
• Jay Giri (Alstom Grid)
• Manu Parashar (Alstom Grid)
• Jiawei Ning (Alstom Grid)

Technical Approach
7

High Performance Dynamic Simulation Software
8
Improvement of EPRI’s Extended Transient Midterm Simulation Program (ETMSP)
Identified bottlenecks
Parallelization of contingencies
Speedup of single contingency simulation
• Replace ETMSP’s Linear Solver with SuperLU_MT
• Use variable time step integration algorithm
• Reduce time due to Input/Output

9
Parallel Contingency Analysis
Total Runtime (s)
Number of Cores Average Min Max StdDev
64 1915 1774 2275 184
128 1062 891 1480 211
256 658 469 960 189
512 477 286 869 187
1024 384 183 610 129
2048 324 193 490 96
4096 200 123 417 105
Would take ~20.4 hours on sequential machine
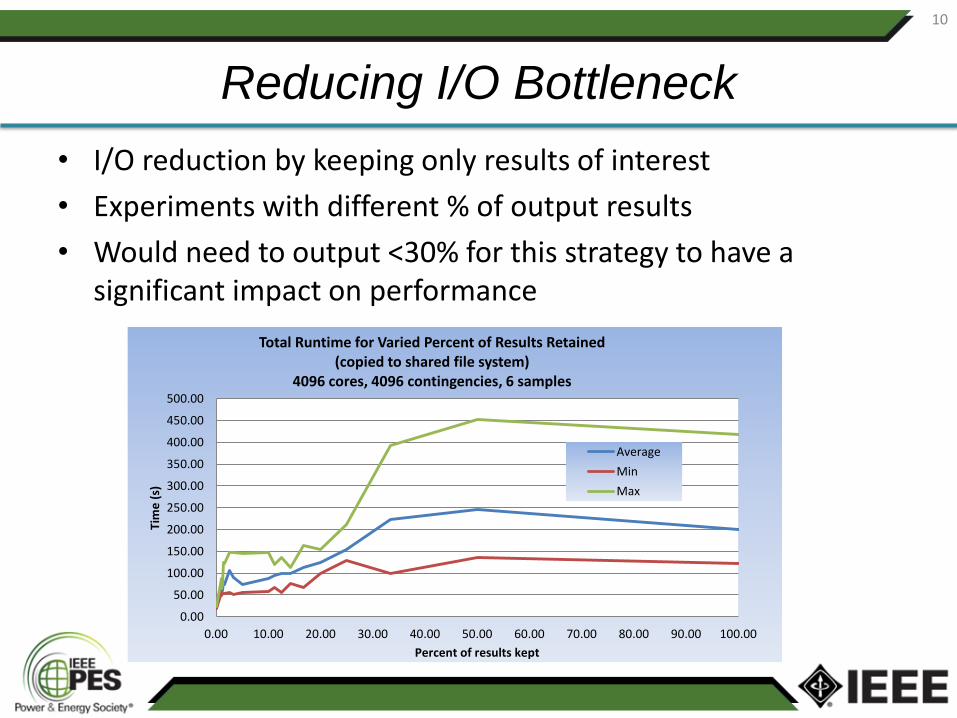
• I/O reduction by keeping only results of interest
• Experiments with different % of output results
• Would need to output <30% for this strategy to have a significant impact on performance
10
Reducing I/O Bottleneck
0.00
50.00
100.00
150.00
200.00
250.00
300.00
350.00
400.00
450.00
500.00
0.00 10.00 20.00 30.00 40.00 50.00 60.00 70.00 80.00 90.00 100.00
Tim
e (
s)
Percent of results kept
Total Runtime for Varied Percent of Results Retained(copied to shared file system)
4096 cores, 4096 contingencies, 6 samples
Average
Min
Max

11
Variable Time Step Integrator
• Applied Adams-Bashforth-Moulton predictor-corrector control for differential variables
• Step sizes chosen to minimize truncation error for differential variables
Step Size Scheme Time (s)
Fixed Step 21.0
Variable Step 8.8
Speedup 59% for 10s
simulation on the
25,000 bus test case

12
Thread-parallelization of Sparse Linear Solver
• Test results on 25,000 bus system
• No advantage when limited number of buses is monitored
• Reason: SuperLU_MT does full backward substitution. ETMSP does only partial backward substitution
• Linear solver takes only 10% of overall CPU time
Number of Monitored Buses
Original Solver(sec)
SuperLU_MT with 4 Threads (sec)
200 0.8 9.66
2000 4.32 9.69
20,000 10.23 9.71

Measurement-based Voltage Stability Assessment
Load Area
Source line
Source line
Load AreaMerge all lines to be one
Thevenin equivalent (1+1 buses)
New multi-terminal network equivalent (N+M buses)1. Measure V & S at all boundary buses
2. Equivalent with details on different transfer paths
3. Real time estimation for E and Z’s
4. Direct transfer limit calculation for each path
1max 1 1 2 1 2
2max 2 1 2 1 2
( , , , , , )
( , , , , , )
L L T
L L T
P f E Z Z Z Z Z
P f E Z Z Z Z Z
Thevenin approach:• Inaccurate due to
merging all tie lines
Tight coupling between tie lines (small
|ZT|)
Weak coupling between tie lines (large
|ZT|)Comparison
New approach: • accurate total limit• estimates the limit for
each line
N=1
M=2
14
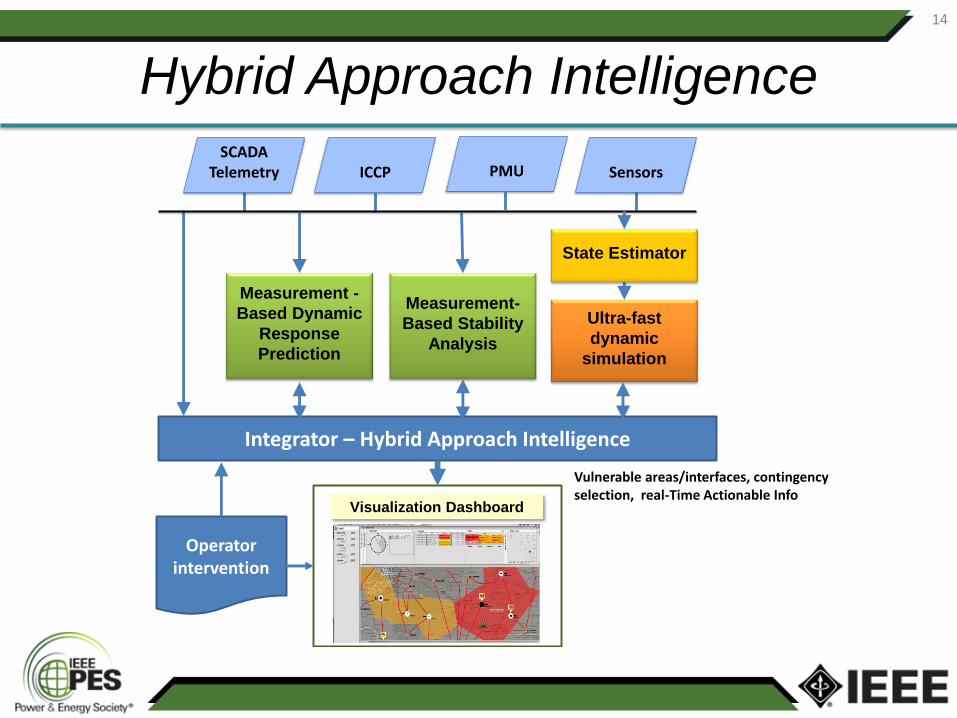
Hybrid Approach Intelligence
SensorsSCADA
Telemetry PMUICCP
Vulnerable areas/interfaces, contingency selection, real-Time Actionable Info
Measurement -
Based Dynamic
Response
Prediction
Measurement-
Based Stability
Analysis
Ultra-fast
dynamic
simulation
Integrator – Hybrid Approach Intelligence
Visualization Dashboard
Operator intervention
State Estimator
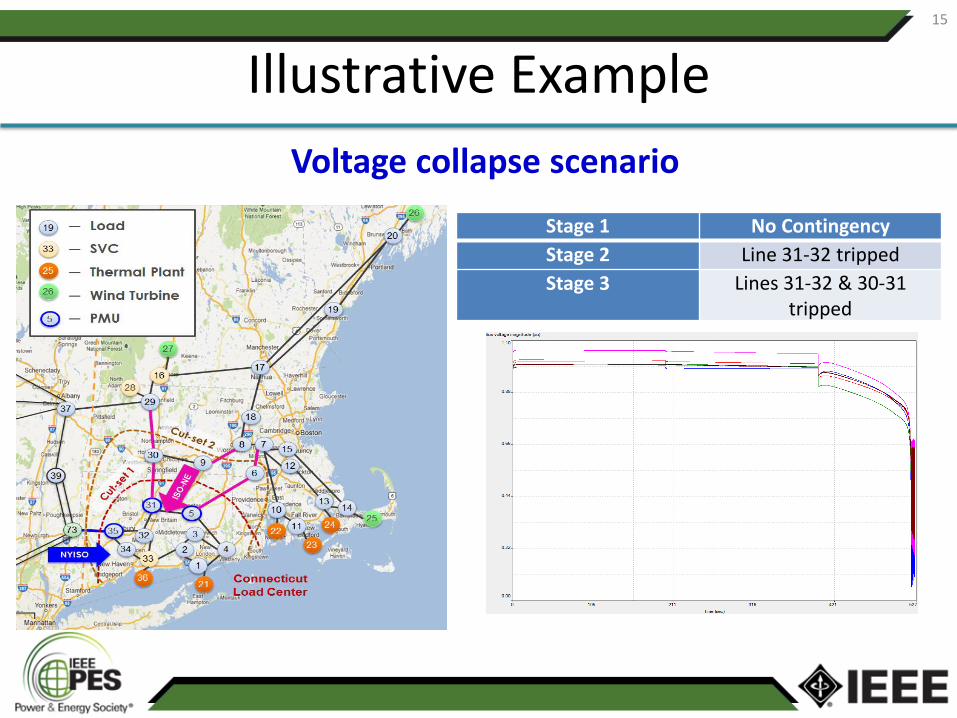
Illustrative Example15
Stage 1 No Contingency
Stage 2 Line 31-32 tripped
Stage 3 Lines 31-32 & 30-31 tripped
Voltage collapse scenario

Illustrative Example16
Stage 1
Stage 2

Illustrative Example
17
Stage 3
Effect of remedial action

• Need for tools to improve situational awareness and operator support decision making
• Existing DSA tools:– Mainly based on simulations
– Not capable to fully respond to operators needs
• High-performance computing technology is accessible
• Improved synchrophasor-based algorithms developed
• A sound approach:
combine measurement-based algorithms with simulation-based tools and advanced visualization
18
Concluding Remarks

Thank you!
19