High-order harmonic generation in rare gases with an ...
13
High-order Harmonic-generation In Rare-gases With An Intense Short-pulse Laser Wahlström, Claes-Göran; Larsson, Jörgen; Persson, Anders; Starczewski, T; Svanberg, Sune; Salieres, P; Balcou, P; L'Huillier, Anne Published in: Physical Review A (Atomic, Molecular and Optical Physics) DOI: 10.1103/PhysRevA.48.4709 1993 Link to publication Citation for published version (APA): Wahlström, C-G., Larsson, J., Persson, A., Starczewski, T., Svanberg, S., Salieres, P., Balcou, P., & L'Huillier, A. (1993). High-order Harmonic-generation In Rare-gases With An Intense Short-pulse Laser. Physical Review A (Atomic, Molecular and Optical Physics), 48(6), 4709-4720. https://doi.org/10.1103/PhysRevA.48.4709 Total number of authors: 8 General rights Unless other specific re-use rights are stated the following general rights apply: Copyright and moral rights for the publications made accessible in the public portal are retained by the authors and/or other copyright owners and it is a condition of accessing publications that users recognise and abide by the legal requirements associated with these rights. • Users may download and print one copy of any publication from the public portal for the purpose of private study or research. • You may not further distribute the material or use it for any profit-making activity or commercial gain • You may freely distribute the URL identifying the publication in the public portal Read more about Creative commons licenses: https://creativecommons.org/licenses/ Take down policy If you believe that this document breaches copyright please contact us providing details, and we will remove access to the work immediately and investigate your claim. Download date: 14. Nov. 2021
Transcript of High-order harmonic generation in rare gases with an ...

LUND UNIVERSITY
PO Box 117221 00 Lund+46 46-222 00 00
High-order Harmonic-generation In Rare-gases With An Intense Short-pulse Laser
Wahlström, Claes-Göran; Larsson, Jörgen; Persson, Anders; Starczewski, T; Svanberg,Sune; Salieres, P; Balcou, P; L'Huillier, AnnePublished in:Physical Review A (Atomic, Molecular and Optical Physics)
DOI:10.1103/PhysRevA.48.4709
1993
Link to publication
Citation for published version (APA):Wahlström, C-G., Larsson, J., Persson, A., Starczewski, T., Svanberg, S., Salieres, P., Balcou, P., & L'Huillier,A. (1993). High-order Harmonic-generation In Rare-gases With An Intense Short-pulse Laser. Physical ReviewA (Atomic, Molecular and Optical Physics), 48(6), 4709-4720. https://doi.org/10.1103/PhysRevA.48.4709
Total number of authors:8
General rightsUnless other specific re-use rights are stated the following general rights apply:Copyright and moral rights for the publications made accessible in the public portal are retained by the authorsand/or other copyright owners and it is a condition of accessing publications that users recognise and abide by thelegal requirements associated with these rights. • Users may download and print one copy of any publication from the public portal for the purpose of private studyor research. • You may not further distribute the material or use it for any profit-making activity or commercial gain • You may freely distribute the URL identifying the publication in the public portal
Read more about Creative commons licenses: https://creativecommons.org/licenses/Take down policyIf you believe that this document breaches copyright please contact us providing details, and we will removeaccess to the work immediately and investigate your claim.
Download date: 14. Nov. 2021

PHYSICAL REVIEW A VOLUME 48, NUMBER 6 DECEMBER 1993
High-order harmonic generation in rare gases with an intense short-pulse laser
C.-G. Wahlstrom, J. Larsson, A. Persson, T. Starczewski, and S. SvanbergDepartment of Physics, Lund Institute of Technology, S-221 00 Lund, Sweden
P. Salieres, Ph. Balcou, and Anne L'HuillierService des Photons, Atomes et Molecules, Commissariat a I'Energie Atomique,
Batiment 522, Centre d'Etudes de Saclay, gIIgI Gif sur Y-vett-e, France(Received 17 June 1993)
We present experimental studies of high-order harmonic generation in the rare gases performedwith a short-pulse titanium sapphire laser operating at 794 nm in the 10 —10 W/cm range. Theharmonic yields generated in neon and in argon are studied for all orders as a function of the laserintensity. They vary erst rather steeply, in the cutoff region, then much more slowly in the plateauregion, and, Bnally, they saturate when the medium gets ionized. The dependence of the high-orderharmonic cutoff with the laser intensity in neon and argon is found to be lower than that predictedin single-atom theories. We observe high-order harmonics in argon and xenon (up to the 65th and45th, respectively) at 10 W/cm, which we attribute to harmonic generation from ions. We alsoshow how the harmonic and fundamental spectra get blueshifted when the medium becomes ionized.
PACS number(s): 42.65.Ky, 32.80.Rm
I. INTRODUCTION
High-order harmonic generation in gases is one of themost promising ways of producing short-pulse coherentradiation in the soft-x-ray range. The generation of ener-getic photons by frequency conversion in rare-gas mediahas now been demonstrated in several laboratories, forexample, in Saclay (135th harmonic of a 1053 nm Nd-glass laser [1]),in Stanford (109th harmonic of a 806 nmTi-sapphire laser [2]), and in Tokyo (25th harmonic of a248 nm KrF laser [3,4]). Many lasers have been used toproduce harmonics, from short-wavelength excimer lasers[3,5,4, visible dye lasers [6,7], to infrared Nd-glass sys-tems [1,8—10]. Among the "state-of-the-art" lasers welladapted for the eKcient production of harmonics andtheir utilization, the titanium sapphire (Ti-S) laser de-veloped recently in Stanford [11] stands out. They haveshort pulse durations, 100—200 fs, relatively long wave-lengths (800 nm), high repetition rates (10 Hz), andbroad tunability. The Grst harmonic generation experi-ments performed with a Ti-sapphire laser system [2,4,12]have indeed shown that very short wavelengths could begenerated in a gas of neon (or helium) atoms, the short-est being about 7 nm, i.e. , 170 eV corresponding to the109th harmonic of 806 nm [2].
In a low-frequency high-intensity regime, the harmonicspectrum presents a characteristic behavior: it falls off forthe first few harmonics, then exhibits a pLateau extend-ing sometimes to more than 150 eV [1,2]. The plateauends up by a rather sharp cutoff. One of the most inter-esting questions concerns the extension of the plateau.By performing time-dependent calculations for a numberof atomic systems in various conditions of laser intensityand frequency, Krause, Schafer, and Kulander [13] pre-dicted that the width of the plateau varies as Ip + 3Up,where I„ is the ionization energy and U„= e E /4mtu
the ponderomotive energy, i.e. , the cycle-averaged oscilla-tion energy of a free electron in the field. e and m are thecharge and mass of the electron, E is the field strength,and u is the laser frequency. The same law can also befound by using simpler models such as the b-function po-tential model employed by Becker and co-workers [14,2].Some insight into the physical meaning of this formulahas recently been given by Schafer, Kulander, and. Krause[15] and by Corkum [16], using a quasiclassical approach.In this model, electrons first tunnel through the barrierformed by the atomic potential and the laser field [17,18].Their subsequent motion in the Geld is treated classically.Only those electrons that return to the nucleus can emitharmonics by recombining to the ground state. The max-imum kinetic energy acquired by the electrons from thefield when they return to the nucleus is 3.2Up, so thatthe maximum emitted energy is I„+3 2Up close to theprediction of [13]. Thus, harmonic generation in a low-
frequency high-intensity regime can be understood as athree-step process: tunnel ionization followed by accel-eration of the electron in the field and scattering by theatomic potential leading to recombination back to theground state.
Recently we have presented [19] an experimental studyof the harmonic generation cutoff law using a short-pulseTi-sapphire laser system. Systematic measurements ofthe harmonic generation yields in neon have been per-formed. The experimental cutoff energy was found to belower than that predicted in single-atom theories [13,14].To understand this effect, we have investigated the inhu-ence of propagation [20,21] and in particular of focusingon the cutoff energy, using single-atom dipole momentsobtained from a simple quantum-mechanical theory ofharmonic generation valid in the tunneling limit. In atight focusing limit, i.e. , when the length of the mediumis larger than the coherence length induced by focusing,
1050-2947/93/48(6}/4709(12)/$06. 00 48 4709 1993 The American Physical Society

4710 C.-G. WAHLSTROM et al.
propagation in the nonlinear medium lowers the exten-sion of the harmonic plateau in a significant way, fromI„+3.2U„ to approximately I„+2U„ for the high har-monics.
In the present paper, we give a full account of theexperimental part of Ref. [19]. We present systematicexperimental studies of harmonic generation not only inneon as described in [19],but also in the other rare gases,in xenon, argon, and helium. The production of the high-order harmonics is investigated over a broad spectralrange from 15 to 150 eV (the limits of our spectrometer),in various focusing conditions, and over a broad range ofintensities (10 —10 W/cm ), both below the satura-tion due to ionization and above it. We use ionizationrates Ineasured in the same experimental chamber, atlower pressure, to check our determination of the focusedintensity. The harmonic generation yield is studied for allorders (from the 13th to the 79th in neon and to the 35thin argon) as a function of the laser intensity. The use of along focal length (2 m) allows us to optimize the numberof photons produced in neon and to study the harmonicyields below saturation with a large dynamical range. Inxenon and argon at high laser intensity (10 W/cm ),we see much higher-order harmonics than expected fromthe cutofr' law, which we attribute to harmonic genera-tion in ions. Finally, we show how the harmonic andfundamental spectra get blueshifted (broadened on theblue side) as the medium becomes ionized.
The paper is organized as follows: In Sec. II, we de-scribe the laser system and the experimental apparatus.The main results of this work which consist of systematicstudies of intensity dependences in neon and argon arepresented in Sec. III and discussed in Sec. IV. Finally,in Sec. V, we present measurements performed above thesaturation intensity in xenon and argon. We summarizein Sec. VI.
II. DESCRIPTION OF THE EXPERIMENT
A. Laser system
The laser used in this experiment is the new Ti-sapphire terawatt laser system at the Lund High PowerLaser Facility. This system is based on chirped pulse am-plification and has unique properties of broad tunability,short-pulse width, high peak power, and high repetitionrate (10 Hz). A schematic diagram of the laser is givenin Fig. l.
The oscillator, generating 10 nJ, 100 fs seed pulses,is a Kerr-lens mode-locked Ti-S laser (Coherent Mira)pumped by an argon-ion laser. The seed pulses arestretched to 260 ps in a grating stretcher before beingelectro-optically injected (at 10 Hz repetition rate) intoa regenerative amphfier (RGA). In the RGA, the pulsesmake 24 passes through a Ti-S crystal pumped by thefrequency doubled output from a Nd: YAG laser (whereYAG denotes yttrium aluminum garnet). The amplifi-cation of the RGA is about 10, with output energies ofabout 10 mJ.
After expanding the beam to a diameter of about 8mm, the pulses are further amplified in a linear four-
8.4W
LaserMIRA 900Oscillator
lf 10 nJ, 100 fs
GratingStretcher
1I 2 nJ, 260 ps
Nd: YAG 65mJ Regenerativela~e~
~
Amphfier
ll 10 mJ, 260 ps600mJ
750mJMulti-PassAmplifier
Nd YAGlaser
1~ 450 m J, 260 ps
Gratingcompressor
)r 250 mJ, &150 fs
FIG. l. Schematic diagram of the laser.
pass Ti-S amplifier. This amplifier, consists of a singleTi-S crystal, pumped at 10 Hz with up to about 1.4 Jof frequency doubled Nd: YAG radiation. The pulse en-ergy after amplification can be varied continuously be-tween about 10 and 450 mJ by varying the amount ofpump energy to the final amplifier. Before temporallyrecompressing the pulses, the beam is further expandedto a diameter of 50 mm. Due to bandwidth narrowingand additional group velocity dispersion picked up duringthe amplification, the final pulse width after compressionis longer than that of the oscillator pulse. The passagethrough the double-pass grating compressor gives rise toa 40% energy loss. The best characteristics of the finaloutput from this 10 Hz system are 150 fs, 250 mJ, 1.5TW, a wavelength between 760 and 840 nm, with a 9nm spectral width at 800 nm. In the experiments de-scribed in this paper, the laser was operated at a fixedwavelength, around 794 nm. The peak wavelength of theoscillator was actually set to 792 nm, but in addition tothe spectral narrowing in the amplification chain (mainlyin the RGA), there is also a slight redshift of about 2 nm.The pulse width, as will be discussed below, was about250 fs.
B. XUV spectrometer
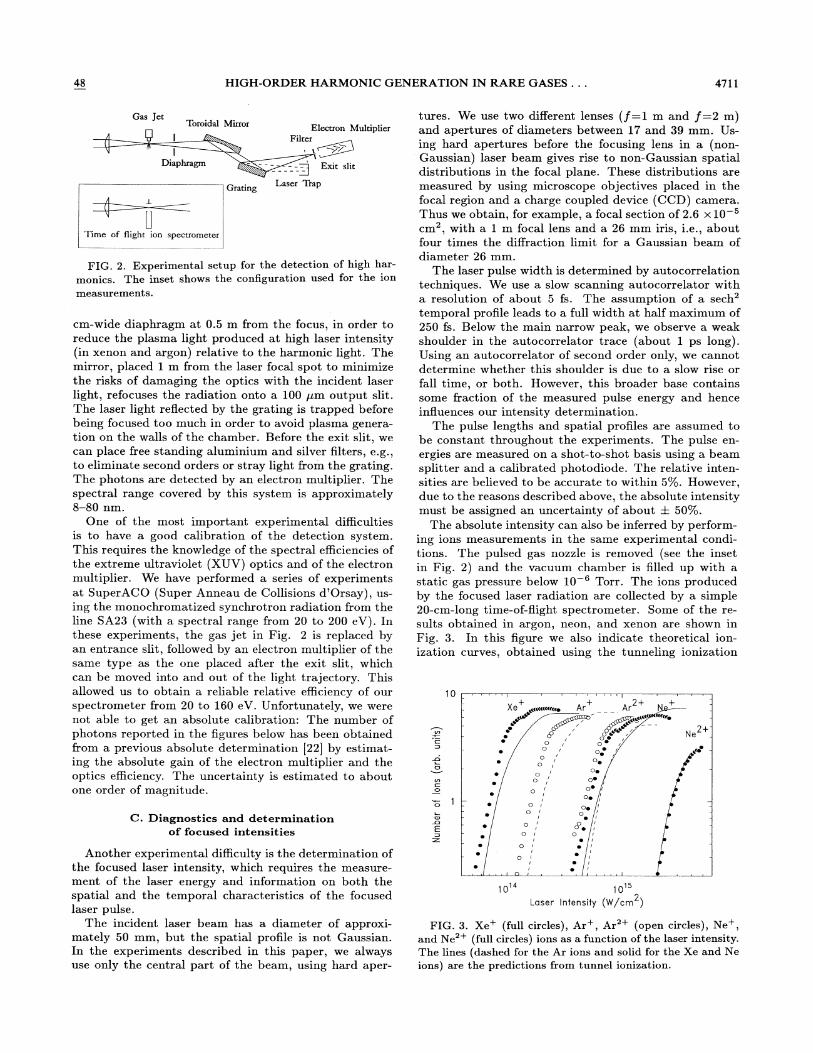
The spectrometer built up in Saclay for the generationand detection of harmonics is schematically described inFig. 2. The laser is focused just below the nozzle of apulsed gas jet by a f=l m or f=2 m lens. The densityof gas in the interaction volume could be varied, but wastypically about 20 Torr (7 x 10 atoms/cms). The lightis analyzed on axis by a monochromator consisting ofa toroidal mirror and a 700 grooves/mm plane grating(Jobin Yvon), both coated with gold. In order to opti-mize the collection efIiciency, we image directly the laserfocus, without entrance slit. However, we have added a 1
HIGH-ORDER HARMONIC GENERATION IN RARE GASES. . . 4711
Gas JetToroidal Mirror lectron Multiplier
Exit slit
Laser TrapGrating
Time of flight ion spectrometer
FIG. 2. Experimental setup for the detection of high har-
monics. The inset shows the configuration used for the ion
measurements.
cm-wide diaphragm at 0.5 m from the focus, in order toreduce the plasma light produced at high laser intensity(in xenon and argon) relative to the harmonic light. Themirror, placed 1 m from the laser focal spot to minimizethe risks of damaging the optics with the incident laserlight, refocuses the radiation onto a 100 pm output slit.The laser light reflected by the grating is trapped beforebeing focused too much in order to avoid plasma genera-tion on the walls of the chamber. Before the exit slit, wecan place free standing aluminium and silver filters, e.g. ,to eliminate second orders or stray light from the grating.The photons are detected by an electron multiplier. Thespectral range covered by this system is approximately8—80 nm.
One of the most important experimental diKcultiesis to have a good calibration of the detection system.This requires the knowledge of the spectral eKciencies ofthe extreme ultraviolet (XUV) optics and of the electronmultiplier. We have performed a series of experimentsat SuperACO (Super Anneau de Collisions d'Orsay), us-ing the rnonochromatized synchrotron radiation from theline SA23 (with a spectral range from 20 to 200 eV). Inthese experiments, the gas jet in I"ig. 2 is replaced byan entrance slit, followed by an electron multiplier of thesame type as the one placed after the exit slit, whichcan be moved into and out of the light trajectory. Thisallowed us to obtain a reliable relative eKciency of ourspectrometer from 20 to 160 eV. Unfortunately, we werenot able to get an absolute calibration: The number ofphotons reported in the figures below has been obtainedfrom a previous absolute determination [22] by estimat-ing the absolute gain of the electron multiplier and theoptics efficiency. The uncertainty is estimated to aboutone order of magnitude.
tures. We use two different lenses (f=l m and f=2 m)and apertures of diameters between 17 and 39 mm. Us-ing hard apertures before the focusing lens in a (non-Gaussian) laser beam gives rise to non-Gaussian spatialdistributions in the focal plane. These distributions aremeasured by using microscope objectives placed in thefocal region and a charge coupled device (CCD) camera.Thus we obtain, for example, a focal section of 2.6 x 10cm, with a 1 m focal lens and a 26 mm iris, i.e. , aboutfour times the difFraction limit for a Gaussian beam ofdiameter 26 mm.
The laser pulse width is determined by autocorrelationtechniques. We use a slow scanning autocorrelator witha resolution of about 5 fs. The assumption of a sechtemporal profile leads to a full width at half maximum of250 fs. Below the main narrow peak, we observe a weakshoulder in the autocorrelator trace (about 1 ps long).Using an autocorrelator of second order only, we cannotdetermine whether this shoulder is due to a slow rise orfall time, or both. However, this broader base containssome fraction of the measured pulse energy and henceinfluences our intensity determination.
The pulse lengths and spatial profiles are assumed tobe constant throughout the experiments. The pulse en-ergies are measured on a shot-to-shot basis using a beamsplitter and a calibrated photodiode. The relative inten-sities are believed to be accurate to within 5'%%uo. However,due to the reasons described above, the absolute intensitymust be assigned an uncertainty of about + 50%.
The absolute intensity can also be inferred by perform-ing ions measurements in the same experimental condi-tions. The pulsed gas nozzle is removed (see the insetin Fig. 2) and the vacuum chamber is 611ed up with astatic gas pressure below 10 Torr. The ions producedby the focused laser radiation are collected by a simple20-cm-long time-of-flight spectrometer. Some of the re-sults obtained in argon, neon, and xenon are shown inFig. 3. In this figure we also indicate theoretical ion-ization curves, obtained using the tunneling ionization
10
2+e
C. Diagnostics and determinationof focused intensities
Another experimental difhculty is the determination ofthe focused laser intensity, which requires the measure-ment of the laser energy and information on both thespatial and the temporal characteristics of the focusedlaser pulse.
The incident laser beam has a diameter of approxi-mately 50 mm, but the spatial profile is not Gaussian.In the experiments described in this paper, we alwaysuse only the central part of the beam, using hard aper-
10'4 10"Laser Infensity (W/crn )
2
FIG. 3. Xe+ (full circles), Ar+, Ar + (open circles), Ne+,and Ne + (full circles) ions as a function of the laser intensity.The lines (dashed for the Ar ious and solid for the Xe and Neions) are the predictions from tunnel ionization.

4712 C.-G. WAHLSTROM et al. 48
formula of Ammosovsov, Delone, and Krainov [18,23]. Dueto the long focal length used and thean e small acceptance
ng e o e time-of-flight spectrometer (limited by a 5
o ec a o t e ions produced (in particular the singly
also ex lains whp y the dynamical range in these ex eri-cance. is
ments is not more than aboutin ese experi-
We obtaina ou two orders of magnitude.
e o tain an excellent agreement between the exmental results a du s and the theoretical predictions if we shift
e ween t e experi-
our intensity by a factor of 25%%u. Th' h' ' 'in0. is s ift is well within
four experimental error bar on the d te e ermination of theocuse intensity.
B. Stu y of the extension of the plateauas a function of intensity
10'
H11
I
Xenon(o)
x40
-10H21
InFi. 5'g. , we show the number of photons in ar on a
a in ensities see the figure caption). The number
III. EXPERIMENTAL RESULTS
A. Harmonic spectra
10 'E
H39
10 4 ] I . I i I
In Fi ~ 4 w hg. , we show typical spectra obtained in xenon,argon, and helium with the 1 m lens. Thesobtained b movin
m ens. ese spectra arey movmg the grating in steps of 0.5 A. and b
averaging the signal over 30 shot l'
g p ss o s, on y accepting pulseswithin a narrow energy window. Thwin ow. e instrumental reso-lution is approximately 0.5 A. In contrast with previousmeasurements performed with le wi onger-pulse lasers ~1] the
in Fig. 4. However, due to the ae recorded width is a complex function of the h
spectral width.c ion o e armonic
The spectra in Xe and Ar have been obtained at ver
saturation intencm much a
in ensi ies for these gases (see Fig. 3~. Thedecrease in the harmonic d t 'b t' '
sharis ri u ion is not ver shar
armonic in xenon in th'armoinc at a higher intensity) and up to the 65th har-
monic in argon. We will come back to thac o e interpretationese igher-order harmonics in Sec. V A. The signal-
to-noise ratio is extremely hi h for the '3monies ~10 in argon 10 in x
nm in e an 25noise o served in the region below 40 nm Xnm in argon is due to stra li ht frnm
's ray ig rom the grating arising
rom e very intense low-order harm~ ~
armonics. ™e use ofaluminium Alters reduces thlow
uces is noise, which comes fromower-energy ultraviolet light.
The spectrum recorded in helium e tm ex en s to muchor er wavelengths, down to about 8
the do a ou nm. In this case
e decrease observed from the 81st hof our s ectro
e s armonic is the cutoKo our spectrometer [1]. Below 10 nm, both theof the ratin a
o e responseg a ing and the reBectivity of gold with wh' h
optics are coated do wi w ic the
ated, decrease quite rapidl thua rather shar instru
i y, us inducing
background is due to overlap of the harmonic eaks'
this spectral region.
70 60 50 40Wavelength (nm)
30 20
10'I
Argon(b)
x10
10H33
10 'E
H65
50 40 30Wavelength (nm)
20 10
:H51He]ium(c)
C)oCL
10
H93
10 4
14I
12Wavelength (nm)
10
FIG. 4. Harmon'armonic spectra in (a) Xe (b) Ae, r, and (c) He.r intensity is approximately 10 W/cm

48 HIGH-ORDER HARMONIC GENERATION IN RARE GASES. . . 4713
09 O O O~
—10o 7(3
~ 10
E 10
104
103
Q,
a
O-
S
Argon(a)
l (W/cm')o 3 4x10i4~ 1.7x10'4
1.0x10'4
10 15 20 25Harmonic Order
I
30I
35
of photons is calculated by taking into account the spec-tral response of the monochromator, assuming a constantwidth (equal to the instrumental width of 0.5 A) for allorders. This leads to an overestimation of the high-orderharmonics relative to the (broader) low-order ones. Theerror, however, is estimated to be less than a factor of 3.
The spectra exhibit the characteristic plateau and cut-off features, apart from the neon spectrum obtained atthe highest intensity. The latter shows no cutoff, becauseof the limitation of our spectrometer towards short wave-lengths. As the intensity increases, the strength of theharmonics in the plateau slowly increases and more har-monics join the plateau. This is true up to the saturationintensity, at which the medium ionizes. This intensity isestimated to be about 2.5 x 10i W/cm in argon and8 x 10 W/cm in neon (see Fig. 3). The spectra atthe highest intensity in Figs. 5(a) and 5(b) have beenobtained just above the saturation intensity for the twogases.
The ionization cross section of argon exhibits a Cooper
minimum at about 48 eV [24,25]. The harmonic strengthis proportional to the probability for the electron to re-combine to the ground state and therefore to the 6.eld-free ionization cross section [15,16,19]. The harmonicspectra obtained with a Nd-glass laser system [1] andwith a shorter pulse (120 fs) Ti-sapphire laser [26] indeedshow a minimum at the 41st harmonic of the Nd-glasssystem (a/ = 1.17 eV) and at the 31st harmonic of theTi-S laser (a/ = 1.54 eV). The spectrum obtained at thehighest intensity in Fig. 5(a) shows a structure aroundthe 29th —31st harmonic, whic we believe to be a trace ofthis Cooper minimum. Unfortunately, in our experimen-tal conditions, the medium ionizes before the harmonicsin the Cooper minimum region reach the plateau.
The precise determination of the cutoff energy in thesespectra is not easy, because the cutofF is not sharp, es-pecially at high laser intensity. We have used anothermethod, based on the study of the harmonic yields as afunction of the laser intensity [2]. The harmonic strengthvaries much more rapidly with the laser intensity in thecutofF region than in the plateau. It exhibits a markedchange of slope (in a logarithmic scale) as it goes from thecutoff to the plateau. This is illustrated in Fig. 6, show-ing the variation with intensity of the 15th harmonic inargon. Each data point corresponding to one energy binrepresents an average of over 100 shots. The circle indi-cates the intensity at which the 15th harmonic joins theplateau. The curve saturates at higher laser intensity(above 2 x 10 W/cm ), when the medium ionizes (seeFig. 3).
In Fig. 7(a)—7(e), we plot the harmonics obtained inneon from the 19th to the 79th. The use of a very longfocal length (2 m) allows us to have a good dynamicalrange of almost four orders of magnitude. The harmon-ics appear successively as the intensity increases. Thisis not true for the low-order ones, from the 13th to the19th, which appear at approximately the same laser in-tensity (10 W/cm ). The harmonic strength varies firstrather rapidly with the laser intensity in the cutoff region.
10
10
CO
C)
c 10~ 5
5
Q
b -/'yP k-k
0OY)
k -k-gO j
'O O q
I
Neon(b)
i (W/cm')7.8x10'4
o 4.5x10'4~ 2.2x10'4
1.1 x10'4k A
/ II
/ 1L
k
10
~ -~
t
t'i
O
E10
1010
I
20I
30 40 50Harmonic Order
I
60I
70 80
106
FIG. 5. Number of photons as a function of the harmonicorder: (a) argon, the intensities are 3.4 x 10 W/cm (opencircles)& 1.7 x 10 W/cm (full squares), and 10 W/cm(open triangles); (h) neon, the intensities are 7.8 x 10W/cm (full triangles), 4.5 x 10 W/cm (open circles), 2.2x 10 W/cm (full squares), and 1.1 x 10 W/cm (opentriangles).
1014
Laser intensity (W/cm )
4 && IO
FIG. 6. Number of photons at the 15th harmonic in argonas a function of the laser intensity.

4714 C.-G. %'AHLSTROM et al. 48
Then they reach the plateau and exhibit a much slowerdependence with the laser intensity. As the harmonic or-der increases, the variation in the cutofF region becomesmore rapid and the variation in the plateau slower. Forexample, the 35th harmonic varies approximately as Iin the cutofF region and as I in the plateau.
In Fig. 8, we plot the harmonics obtained in argon from
the 19th to the 35th. The intensity dependences are sim-ilar to those obtained in neon for the lowest-order har-monics. Note the drop of the numbers of photons at the29th and 31st harmonics, corresponding to the positionof the Cooper minimum (see the above discussion). Thehighest-order harmonics (31st, 33rd, and 35th) appearat a higher laser intensity, above saturation (2.5 x10 4
10
o 10CL
10
04444
4~4
4
4
4
00
0Q
p0
1010'4
4 Q
31 o 41 ~ 514 71
61
2 3 4 5 6 7 8 10Laser Intensity (W/cm )
2
I I I I 1 I I I
OOQQOOOOOQpppp
OppOP
Neon OO
pp(a) op 444
Q F4444440 ~ OOO 04
0 F44 pp ~Dppp 444 oOQO ~
O 44 pP ~44 OpppppO 44 O 444 ppp4 0 44 Q0
~4
Op ~ p
4 0 40 Q
Q O ~21
o 10
o
10
10
I I I I I
~44~4
444~ 44
~4OO OOOOO4 Qpp
~44ppp
OOO
Neon 0
00OQ
0
0
Opp ~4OQ 444O 4
0 ~44444 QO 4
OQQ pop 4Qp 44 ~
pp4 Q Oppp
Q 0p4 Q0
p
44
~444 0
0~44 0
23
00
0O
Q
0
4 0 Q
~4
O
2 3 4 5 6 7 8 10Laser Intensity (W/cm )
2
10
CA
—10o 5o
Q
10 — ~QO
475
F4444444~4
Neon ~4
(c)QOOOQ
4 QPO 444Op ~44
44 QOO 444 444~ op OOOO Op0
0 4 OP pp~ 0 44 Qp gp44444 Q Q
4 Q p ~O4 Q0 0 44 4
4 0Q ~ 0
04 4 ~ Q
0 00 4 0
106
—105o
O
o~ 10E
4
QOp ~Pan&0 F48
~ 04 0
Q
Q~ 00
0p0
0
on ~44
~44 ~44~44oooo~4 ppP
44 OOOOQQO ~44
ppp
~4 pp ~ QQQOOQO
4 Q44 Qp Qp
4~4 p 4
~4 0~ Q44 p 4
,
- 25
10
1014
35 o 454
O 4
55Q 65
2 6 7 8 10Laser Intensity (W/cm )
2
27
10
1014
370
~ ~ 77
57 67
2 6 7 8 10Laser Intensity (W/cm )
2
I I I I I I I
QppppOOOO
1O'— Oppp
Qp 444e) Qp 4440 444
p 444pQ 4
OQPO 4 pppp ~O 4 OOOO 4444 '4
O ~ ppP 4444Qp ~ pp 44 ppp
OOOO 44 Qp ~ pp~ OpppppQ Qp pp QQ
p0 44 p Q
o0 4 04 ~4 0
Op 0 ~Qp0 0
Q ~ ~ pp 40 ~ Q
pp ~ Q Q
10 — o ~ 7919
4
69
Neon
o 10
o- 1O4
00
Q
3949 59102
1014
2 3 4 5 6 7 8 10Laser Intensity (W/cm )
FIG. 7. Number of photons in neon as a function of the laser intensity: (a) harmonics 21,31,41,51,61,71; (h) harmonics23 33 43 53 63 73. (c) harmonics 25,35,45,55,65,75; (d) harmonics 27,37,47,57,67,77; (e) harmonics 19,29,39,49,59,69,79.

HIGH-ORDER HARMONIC GENERATION IN RARE GASES. . . 4715
I I I
10QP
~00000 ~ooooooo0 ~oo
po ~oo0 oo
Argon
10 ~ 0~000 o oooooooo0 0
0 ~ 0 ~ 000000 o o oo
0 ~ 000 00 o
o 0o o o 310 0~ o p (g(R
9 o ~..w&21 o 0 ooo~o 0 ~ooooo Q
o ~ o ~ 0 ooo ~o pQ
o 0 O 0 ~ 0~ ~ Qp
25 27 o 29 ooo oI
o I I I \
c) 107
10
1014
Laser Intensity (W/cm )2
8x IOi4
FIG. 8. Number of photons in argon as a function of thelaser intensity from the 19th to the 35th harmonic.
10'
W/cm2). They vary quite slowly with the laser intensity.In Fig. 9, we compare the intensity dependences of
the 15th harmonic in xenon, argon, and neon. We haveadjusted the horizontal and vertical scales to make thethree curves coincide at low intensity. The intensity de-pendences are very similar for the three gases. The maindifFerence is the position of the saturation intensity, rel-ative to the intensity at which the harmonic joins theplateau. In xenon, the medium ionizes before the 15thharmonic reaches the plateau. In argon, there is approx-imately a factor of 2 ~ 5 between the two intensities. Fi-nally, in neon, the saturation intensity is barely reachedand the plateau grows over almost one order of magni-tude in intensity. Below saturation, the three curves areremarkably similar, which seems to point out to a weakatomic dependence in this low-frequency high-intensityregime.
IV. STUDY OF THE CUTOFF LAW
A. Results in neon
In Fig. 10, we report the position of the change of slopeobserved in the intensity dependences (see Fig. 7) for allof the harmonics in neon from the 13th to the 79th. Weexpress the intensity in units of the ponderomotive en-ergy U„= 5.9 x 10 i I (with I, the laser intensity, inW/cm ). The vertical scale on the right is the harmonicorder, the one on the left is the harmonic photon energy.There are two ways to read this plot: It gives the po-sition of the cutofF intensity for a given harmonic, i.e. ,the intensity at which the harmonic reaches the plateau.It also gives the maximum energy of the plateau (cut-off energy) for a given intensity. The first conclusion isthat the points corresponding to the harmonics higherthan the 27th are aligned. A linear regression gives acutofF law equal to 21+ 2.4U„. For comparison, we showthe single-atom prediction 21.6 + 3.2U& in dashed line.The cutofF law determined experimentally is significantlylower than that predicted by the single-atom results. Ifwe use the intensity determination obtained by compar-ing our ion measurements to tunnel ionization predic-tions, the experimental intensity is increased by a factorof 25%, which gives an even lower cutoff' law, equal to 21+ 1.9U„. Although our experimental uncertainty on thelaser intensity does not allow us to say unambiguouslythat the measured cutofF is lower than the single-atomprediction, there is a strong indication, based on the ionmeasurements, that it is indeed the case.
B. Results in argon
We have performed the same analysis in argon and theresults are shown in Fig. 11. The cutofF energy for the ar-gon harmonics below the 29th varies as 10+ 2.4U&. Theionization energy in argon is equal to 15.8 eV. Again,
10-1 15th Harmonic 125 80
C$310
O
~ 10
10
~ogggtccoJ4-~qo~
oo~
osooo
~ P~PIPPPP&PgP~APE
po-'co'
Q es
ceo
~P
oo Ne~ Ar~ Xe
100—
75
25 — ~
----- 21.6 + 3.2 Up21 + 2 4'~ Experimental data
— 60Ci
C)
40 o
— 20
10I
I I I I I
2
Laser Intensity
I I I I I I I
4 5 678 10(arb. units)
I I I I
15 25 35Ponderomotive energy (eV)
FIG. 9. Comparison of the intensity dependences of the15th harmonic in Xe (full squares), Ar (full circles), and Ne
(open circles).
FIG. 10. CutofF energy in neon as a function of the pon-deromotive energy. The solid line is a linear best Gt: 21 +2.4U„, the dashed line is the prediction of the single-atomresponse 21.6 + 3.2U„.

4716 C.-G. WAHLSTROM et al. 48
60
50—Argon
//
//
//
//
//
~ — 35
— 30
40 25 2
20 o
20-'/
1516 + 3 2 Up10 + 2 4 Up
~ Experimental data — 10
100
I I
10 15 20Ponderomotive energy (eV)
I
25 30
FIG. 11. CutofF energy in argon as a function of the pon-deromotive energy. The solid line is a linear best fit: 10 +2.4U„, the dashed line is the prediction of the single-atomresponse 16 + 3.2U„.
A possible origin for this lower cutoff is the effect ofpropagation in a tight focusing geometry. In Ref. [19],we examine in detail phase-matching effects in this low-frequency high-intensity regime. We have performed se-ries of calculations in various geometries in order to il-lustrate the difference between a loose and a tight ge-ometry for the intensity dependence of the cutoff en-ergy. We refer the reader to [19] for more details aboutthe calculations and the comparison between theory andexperiment. Brie8y, the physical idea is the following.In a tight focusing geometry, phase matching dependsstrongly on the variation of the polarization with inten-sity [21]. When this variation is rapid, as is the case inthe cutoff region, the polarization is mostly concentratedclose to the focus, with maximum cancellation effects be-tween the fields created before and after the focus, andconsequently, poor phase matching. When the variationof the polarization with intensity is slow, the volume ofemitting dipoles is more important, the near-field pro6. legets distorted, the cancellation effects are reduced, andphase matching is much more eKcient.
Consider how a given harmonic varies with the laserintensity, in the single-atom response and in the many-atom response. There are three intensity regions.
(i) The peak intensity is lower than the intensity atwhich the harmonic reaches the plateau in the single-
these experimental results indicate that the measuredcutoff law is lower than the one predicted in the single-atom response (shown in dashed line). The reason whythe coordinate at the origin seems to be lower than theexpected 16 eV is not clear at present. It could simplybe due to the experimental inaccuracy. The cutoff en-ergy saturates for the harmonics beyond the 29th simplybecause the medium becomes ionized before these highharmonics reach the plateau. The saturation intensityis equal to 2.5 x10 W/cm, which corresponds to aponderomotive energy of 15 eV from which the pointsdeviate from the 10 + 2.4U~ line.
C. Discussion
atom response. Then, the microscopic harmonic emissionvaries rapidly with the laser intensity. Phase matchingis poor, but stays approximately constant. The variationwith intensity of the macroscopic emission follows thatof the single-atom response.
(ii) The peak intensity is higher than that needed forthe harmonic (emitted by a single atom) to be in theplateau, but there is a significant part of the interactionvolume that experiences a lower intensity, correspond-ing to the cutoff region for the single-atom response. Inthis intensity region, the microscopic emission rate variesmore slowly and exhibits oscillations [2,19,27]. In con-trast, phase matching increases rapidly, because the vol-ume contributing to the emission increases.
(iii) The peak intensity is such that most of the volume
experiences an intensity corresponding to the plateau re-
gion for the single-atom response. Both the microscopicemission and the contribution of phase matching varyslowly with the laser intensity.
Consequently, if the geometry is of the tight focusingtype, the change of slope in the intensity dependenceof the harmonic strength will occur at a higher inten-sity in the many-atom response than in the single-atomresponse, when both the single-atom emission rate andthe contribution of phase matching vary slowly with in-tensity. In other words, at a given intensity, the cutoffenergy will be lower in the many-atom response than inthe single-atom response.
Focusing becomes a limitation to harmonic generationwhen the geometrical coherence length (L, h) is compa-rable or smaller than the length of medium L. The coher-ence length for qth-order harmonic generation can be ap-proxirnated by the simple expression L, ~ = orb j2(q —1),where b is the laser confocal parameter. Calculationsperformed in Ref. [19] in neon for our experimental con-ditions (i.e. , a confocal parameter 6 estimated to 1.3 cmand an interaction length L of 1 mm) show that the cutoffenergy shifts from I„+3.2U„ to about I„+2U„when L, hbecomes smaller than 0.7L, i.e., from the 29th harmonic.The results of these calculations are consistent with ourexperimental data, especially when using the intensitydetermined from the ion measurements. They explainthe lower cutoff for the high harmonics such that the ge-ometry is of the tight focusing type and also the higherslope observed for the lower-order harmonics (generatedin a loose geometry).
The results obtained in argon (see Fig. 11) are morediKcult to explain, since the lower cutoff is observed forthe lowest orders, such that the beam is rather loosely fo-cused. The change of geometry coincides with the ioniza-tion of the medium. We think that a better understand-ing of these results could only be achieved by performingmore complete calculations on this particular atomic sys-tern. The existence of the Cooper minimum makes thedetermination of the cutoff energy more diKcult, at leastfor a certain range of intensities.
V. HARMONIC CENKRATIONIN AN IONIZED MEDIU M
Finally, we have studied the generation of harmonicsin xenon and argon at very high intensity, such that the

HIGH-ORDER HARMONIC GENERATION IN RARE GASES. . . 4717
medium is significantly ionized. Our aim was twofold:to observe harmonic generation from ions and to mea-sure the deformation of the spectral profile (blueshift) ofthe fundamental and of the harmonics in parallel as afunction of intensity and gas pressure.
A. Harmonic generation from ions
H1110 0 O
108 III ~ ~ Argon
~ 10
~10
E 10'
104
Q=3.2 08
Xenon
Q=3.2
H45H65~ ~ I I ~ ~ ~ ~ ~ ~ ~
10 30 50Photon
I I
70Energy (eV)
I
90
FIG. 12. Harmonic spectra in Xe (open symbols) and inAr (full circles) at about 10 W/cm . The position of thesingle-atom cuto8' energy at the saturation intensities for thetwo rare gases is indicated by the arrow with the label o. = 3.2.
In Fig. 12, we show spectra obtained in Xe (open cir-cles) and Ar (full circles) at about 10 5 W/cm, using the1 m lens. The figure uses several sets of data taken in thesame conditions, including in particular those shown inFigs. 4(a) and 4(b), which explains why there are some-times two points corresponding to the same harmonic.The open triangles correspond to data points in xenonobtained at a slightly higher laser intensity (estimated to2 x 10 W/cm ).
The positions of I„+3 2Up at the saturation intensi-ties determined experimentally for the two rare gases (seeFig. 3) are indicated in the figure. The second plateausobserved both in xenon and in argon up to the 45th andto the 65th harmonics, respectively, extend far beyondthe cutoff expected for the harmonic emission from a sin-gle neutral atom (and a fortiori for the emission from theneutral medium). The intensity is higher than the sat-uration intensity for Xe+ and Ar+ ions (see Fig. 3) andtherefore high enough for the generation of harmonicsfrom these ions. Note that the levels of the two plateausdier by almost five orders of magnitude. This comesfrom the reduced eKciency in the single-ion response[13,28] and from the poorer phase matching in ionizedmedia, influenced by the free electron dispersion.
We have not studied this harmonic emission in moredetails, because of the low signal-to-noise ratio [see Fig.4(a) and 4(b)]. These high-order harmonics could onlybe observed in a certain window of intensity and gaspressure (20 Torr). Varying the intensity, density, fo-cus position, etc. leads to a decrease in the signal-to-noise ratio and the disappearance of those high-order
harmonics. This is also why no second cutoff was de-tected. However, we think that the existence of theseharmonics at a fairly high intensity can only be under-stood by invoking the contribution of ions (and possiblyof multiply charged ions in the xenon case). Althoughharmonic generation from ions has been observed previ-ously using high-frequency lasers (KrF) [3—5,13,28], thispaper presents evidence for emission from ions with alow-frequency laser, with possibilities of producing muchhigher photon energies.
B. Blueshift of the fundamental
The shift towards shorter wavelengths of a short-pulselaser focused into a gaseous medium has been observedpreviously in a cell geometry (at a much higher pressure)[29] and also in a gas jet, in a very similar configuration[2]. It has been discussed in several theoretical papers[21,30]. The blueshift originates from the free electronscreated during the laser pulse, which induce a variationof the refractive index [21],
27ccbni (r, z, t) = — JV, (r, z, t),
where cu denotes the laser frequency and JV, (r, z, t) theelectron density. The time variation of the index (i.e.of the phase) leads to a spectral blueshift of the funda-mental field. The space variation of the index leads todefocusing of the beam [31,30], so that the peak inten-sity in vacuum is never reached in a dense medium. Theprecise calculation of the blueshift at a given intensityrequires us to perform a complete propagation calcula-tion including not only the phase modulation induced byionization but also these refraction effects which reducethe efFective intensity in the medium. However, the ex-pected blueshift can be estimated simply by the followingexpression (CGS units),
A e2 dA',1 2' mc3 dt
At saturation, we can approxiinate dJV, /dt by JVp/7',where JVo is the initial atomic density and w is the laserpulse width. In our experimental conditions (20 Torr, A
= 794 nm, L = 1 mm), the expected blueshift is 2 nm.In the experiment, the spectrum of the fundamental is
recorded after the interaction with the nonlinear medium,by using some of the light scattered in the chamber, fur-ther guided through an optical Aber and lens coupledto an f=27 cm Acton spectrometer. The output of thespectrometer is imaged onto an optical multichannel an-alyzer and detected by a gated, image intensified, 1024channel diode array. In Fig. 13, we show the spectra ofthe fundamental (integrated over 200 laser shots) at threedifferent laser intensities, 6.5 x 10 W/cm, 1.1 x 10W/cm (just above the saturation intensity of xenon),and 2.3 x 10i W/cm2. The pressure in the xenon gasjet is 20 Torr. The spectrum taken at the lowest inten-sity is similar to the spectra taken without gas, even athigh intensity. The observed structures are reproducibleand exist without gas. The spectra exhibit a net shift

4718 C.-G. WAHLSTROM et aI.
1.0—
0.8
1 ~ 2I
Xenonl (W/cm')
14
C3
0.6OO~ 0.4O
E 0.2
0—785
I
790I I
795Wavelength (nm)
800
0.8
—0.6CL
o 0.4
g 0,2
052 ~ 4 52.7 53.0
Wavelength (nm)53.3
FIG. 13. Normalized spectra of the fundamental beam af-ter interacting with a 20 Torr gas jet of xenon. The intensitiesare 6.5 x 10 W/cm (dot-dashed line), 1.1 x 10 W/cm(solid line), and 2.3 x 10 W/cm (dashed line) .
FIG. 14. Normahzed spectral profiles of the 15th harmonicin xenon at 20 Torr. The intensities are 6.5 x 10 W/cm(dot-dashed line), 1.1 x 10 W/cm (solid line), and 2.3 x10 W/cm (dashed line).
towards short wavelengths, equal to 2 nm for the high-est intensity one, in good agreement with the previousestimation. This value is also very close to the resultobtained by Macklin, Kmetec, and Gordon [2] in neoninstead of xenon, but otherwise similar conditions.
C. Blueshift of the harmonics
The spectral shift of the harmonics originates from thevariation of the refractive index at frequency q~ and fromthe spectral shift of the fundamental. The latter is simplyhi~ = hAi/q (bar~ = qRui), whereas the shift inducedby the propagation of the harmonics in the medium [seeEqs. (1) and (2)] is 8%~ = 8Ai/q (8m~ = hei/q) [21,32].The eKect of the free electrons is much smaller than theefFect of the shift of the fundamental field for the highharmonics and one expects the shift of the harmonicsto be equal to the ratio of the fundamental shift by theprocess order.
Our XUV spectrometer, with no entrance slit and a100 pm output slit, does not allow us to measure thetrue spectral distribution of the individual harmonics.However, thanks to the short-laser-pulse duration, thelinewidth of the lower-order harmonics becomes notice-ably greater than the experimental width imposed by theXUV spectrometer (0.5 A). We can therefore study thevariation of the spectral width and shift of these har-monics with the laser intensity or gas pressure and wecan correlate the shift of the harmonics to that of thefundamental.
In Fig. 14, we show the spectral profiles of the 15thharmonic in xenon obtained at the same intensities andpressure as in Fig. 13. At the lowest intensity, the har-monic width at half maximum is 1.7 A. As the intensityis increased, the profile broadens significantly (2.3 A at1.1 x 10 W/cm, 3 A. at 2.3 x 10 W/crn ) and thecentral wavelength shifts. The blueshift of 1.5 A. betweenthe spectral profiles from the lowest to the highest inten-sity is consistent with the one observed on the fundamen-
1.2
0.8
Xenon 1.1x10' W/cm Pressure0 Torr0 Torr0 Torr
—0.6
0.4
~ 0.2
0—52.4 52.7 53.0
Wavelength (nm)53.3
FIG. 15. Normalized spectral profiles of the 15th harmonicin xenon at 20 Torr (dot-dashed line), 30 Torr (solid line), and40 Torr (dashed line). The intensity is 1.1 x 10 W/cm .
tal. Note that the harmonic profile at highest intensity isnot broad enough to include the original unshifted wave-length.
The spectral width of the harmonics can be estimatedby the diA'erence between the measured value and the0.5 A spectral resolution of the instrument. This givesspectral widths varying from 1.2 A. at the lowest intensityto 2.5 A at the highest. By comparison, lowest-orderperturbation theory predicts a width of about 1.7 A. forthe 15th harmonic (for a 9 nm fundamental width).
In Fig. 15, we compare the spectral profiles of the 15thharmonic in xenon, at the same laser intensity (1.1 x10 4 W/cm ) at three pressures, 20 Torr, 30 Torr, and40 Torr. The width of the harmonic is almost constant.The increase of gas pressure alone induces no addition-nal spectral broadening, only a global displacement ofthe profile. The blueshift depends linearly on the initialatomic density, which is exactly verified from this result.
Finally, we present in Fig. 16 the spectral profiles of

48 HIGH-ORDER HARMONIC GENERATION IN RARE GASES. . . 4719
10
10
CL
———7.5.
— — — 2.
10—3
the 9th harmonic in argon at several intensities (see figurecaption) and at a 20 Torr pressure. The spectral profilebroadens to the blue side of the spectrum and its centralwavelength shifts to shorter wavelengths as the intensityincreases. The shift of the blue side is still consistent withwhat can be inferred from the blueshift measurements ofthe fundamental beam. In contrast to the 15th harmonicin Xe, the profile always extends to the unshifted wave-length on the red side.
Both spatial and temporal effects [33] can affect sig-nificantly the shift and broadening of the spectral lineshape as a function of the laser intensity. In the spatialdomain, the amount of blueshift is more important onaxis, where the intensity varies more rapidly, than awayfrom it. In the time domain, the amount of blueshift de-pends on whether or not the harmonic is predominantlycreated at the beginning of the laser pulse (with littleionization and consequently a small spectral distortionof the fundamental) or later in the pulse. This leads toa complex intensity-dependent spectral shift and broad-ening of the harmonic line shape, strongly dependent onthe variation with intensity of the nonlinear polarization,in the region of the saturation intensity. In particular,the spectral distortion of the harmonics should dependon whether the harmonic has reached the plateau regimeat saturation. This could explain the difference betweenthe results shown in Fig. 14 and in Fig. 16. As shown inFig. 9, the 15th harmonic in xenon belongs to the cut-off region up to the saturation intensity whereas there isa large intensity range before saturation where the 9thharmonic in argon belongs to the plateau regime, witha slow intensity dependence. Consider the generation ofthe 9th harmonic at a peak intensity above saturation.The harmonic starts being generated early in the pulse,before significant ionization takes place, and therefore atan unshifted wavelength. It is also generated later in thepulse, when the intensity reaches the saturat;ion intensityand therefore at a blueshifted wavelength. This leads toa rather large and regular broadening of the spectral pro-file, which, if we forget about the spatial effects, could be
10—4
87.0 87.5 88.0 88.5Wavelength (nm)
FIG. 16. Normalized spectral profiles of the 9th harmonicin argon at 20 Torr. The intensities are 1.6 x 10 W/cm(dashed line), 2.4 x 10 W/cm (dot-dashed line), 3.2 x 10W/cm (double-dot-dashed line), 5.2 x 10 W/cm (solidline), and 7.6 x 10 W/cm (long-dash —short-dashed line).
interpretated as a frequency chirp of the harmonic beam.This cannot occur in the 15th harmonic in xenon, becausethe plateau regime is not reached before saturation (Fig.9). In that case, harmonic generation takes place pre-dominantly at saturation intensity and the harmonic ismuch more uniformly shifted.
We have performed additional measurements for other(low-order) harmonics, in different conditions of pressureand intensity. Our conclusion is that these results con-firm that the harmonics are spectrally shifted when thegaseous medium gets ionized. The spectral shift simplyfollows that of the fundamental. This effect begins justbelow the saturation intensity for the rare gases studied( 10 W/cm in xenon and 2.5 x 10 W/cm in argon) .
VI. SUMMARY
Using a high-repetition rate, short-pulse Ti-sapphirelaser system, we have performed systematic studies ofhigh harmonic generation in noble gases. By investigat-ing the intensity dependences of the yields of the differentharmonics, insight has been obtained regarding the for-mation of the characteristic plateau and the extent of thisplateau as a function of the laser intensity.
At low intensity, the harmonics are in the cutoff regionand their strength vary rapidly with the laser intensity.As the intensity increases, the harmonics join the plateauone after the other. The rate of variation with intensityof a given harmonic changes suddenly from the cutoffregion (rapid variation) to the plateau region (slow vari-ation, similar for all of the harmonics). Finally, the sat-uration intensity for ionization is reached and the yieldsof all harmonics saturate. For the high harmonics, thecutoff energy, i.e. , the photon energy of the highest har-monic in the plateau, is found to increase linearly withlaser intensity. The constant of proportionality, however,is smaller than that that predicted in the single-atom re-sponse. This effect is probably due to propagation effectsin the tight focusing regime, which applies for the highharmonics.
In xenon and argon exposed to laser intensities muchabove the saturation intensities for ionization, we haveobserved harmonics well above the theoretical cutoff forthe single-atom emission. The highest harmonics in thesespectra, up to the 45th in Xe and 65th in Ar, are prob-ably due to the contribution of ions. This is evidencefor harmonic emission from ions using a low-frequencylaser. It opens ways for reaching very short-wavelengthcoherent radiation [13].
Ionization of the nonlinear medium leads to time-dependent changes in the refractive index. This causes aspectral broadening and a blueshift of the laser radiationpropagating through the medium. The spectral broaden-ings and shifts of the harmonics generated in the ionizingmedium are found to be proportional to the broadeningand shift of the fundamental laser radiation. Complexspatial and temporal effects may be suspected, whichwould deserve a detailed theoretical investigation.

4720 C.-G. WAHLSTROM et al.
ACKNOWLEDGMENTS
We are grateful to M. Lewenstein, K. C. Kulander, andK. J. Schafer for numerous discussions concerning theseexperimental results, to T. Auguste for his help concern-ing ADK tunnel ionization rates, to D. Cubaynes, 3.— M.
Bizeau, and P. Morin for their help in the calibrationof our spectrometer at LURE, and to M. Bougeard, E.Caprin, and A. Sanchez for their skilled technical assis-tance. Financial support from the Swedish National Sci-ence Research Council, the Swedish Council for Planningof Research, and the Wallenberg Foundation is gratefullyacknowledged.
[1] A. L'Huillier and Ph. Balcou, Phys. Rev. Lett. 70, 774,(1993).
[2] J. J. Macklin, J. D. Kmetec, and C. L. Gordon III, Phys.Rev. Lett. 70, 766 (1993).
[3] N. Sarukura, K. Hata, T. Adachi, R. Nodomi, M. Watan-abe, and S. Watanabe, Phys. Rev. A 43, 1669 (1991).
[4] K. Kondo, N. Sarukura, K. Sajiki, and S. Watanabe,Phys. Rev. A 47, R2480 (1993).
[5] Y. Akiyama, K. Midorikawa, Y. Matsunawa, Y. Nagata,M. Obara, H. Tashiro, and K. Toyoda, Phys. Rev. Lett.69, 2176 (1992).
[6] K. Miyazaki and H. Sakai, J. Phys. B 25, L83 (1992).[7] Ph. Balcou, A. S. L. Gomes, C. Cornaggia, L. A. Lompre,
and A. L'Huillier, J. Phys. B 25, 4467 (1992).[8] J. K. Crane, M. D. Perry, S. Herman, and R. W. Falcone,
Opt. Lett. 17, 1256 (1992).[9] M. E. Faldon, M. H. R. Hutchinson, J. P. Marangos,
J. E. MuKett, R. A. Smith, J. W. G. Tisch, and C. G.Wahlstrom, J. Opt. Soc. Am B 9, 2094 (1992).
[10] J. W. G. Tisch, R. A. Smith, M. Ciarrocca, J. P. Maran-gos, and M. H. R. Hutchinson (unpublished).
[11] J. D. Kmetec, J. J. Macklin, and J. F. Young, Opt. Lett.16, 1001 (1991).
[12] K. Miyazaki (private communication).[13] J. L. Krause, K. J. Schafer, and K. C. Kulander, Phys.
Rev. Lett. 68, 3535 (1992).[14] W. Becker, S. Long, and J. K. McIver, Phys. Rev. A 41,
4112 (1990).[15] K. J. Schafer, K. C. Kulander, and J. L. Krause (private
communication).[16] P. B. Corkum, Phys. Rev. Lett. 71, 1994 (1993).[17] L. V. Keldysh, Zh. Eksp. Teor. Fiz. 47, 1945 (1964) [Sov.
Phys. —JETP 20, 1307 (1965)]; F. Faisal, J. Phys. B 6,L312 (1973); H. R. Reiss, Phys. Rev. A 22, j 786 (1980).
[18] M V Ammosov, N. B. Delone, and V. P. Krainov, Zh.Eksp. Teor. Fiz. 91, 2008 (1986) [Sov. Phys. —JETP 64,1191 (1986)].
[19] A. L'Huillier, M. Lewenstein, P. Salieres, Ph. Baicou, M.Ivanov, J. Larsson, and C.-G. Wahlstrom, Phys. Rev. A48, R3433 (1993).
[20] A. L'Huillier, K. J. Schafer, and K. C. Kulander, J. Phys.B 24, 3315 (1991).
[21] A. L'Huillier, Ph. Balcou, S. Candel, K. J. Schafer, andK. C. Kulander, Phys. Rev. A 46, 2778 (1992).
[22] X. F. Li, A. L'Huillier, M. Ferray, L. A. Lompre, G. Main-fray, and C. Manus, Phys. Rev. A $9, 5751 (1989).
[23] T. Auguste, P. Monot, L. A. Lompre, G. Mainfray, andC. Manus, J. Phys. B 25, 4181 (1992).
[24] J. W. Cooper, Phys. Rev. 128, 681 (1962)[25] G.V. Marr and J.B. West, At. Data Nucl. Data Tables
18, 497 (1976).[26] J. J. Macklin (private communication).[27] J. L. Krause, K. J. Schafer, and K. C. Kulander, Phys.
Rev. A 45, 4998 (1992).[28] H. Xu, X. Tang, and P. Lambropoulos, Phys. Rev. A 46,
R2225 (1992).[29] M. C. Downer, W. M. Wood, and J. L. Trisnadi, Phys.
Rev. Lett. 65, 2832 (1990).[30] S. C. Rae and K. H. Burnett, Phys. Rev. A 46, 1084
(1992).[31] T. Auguste, P. Monot, L. A. Lompre, G. Mainfray, and
C. Manus, Opt. Commun. 89, 145 (1992).[32] S. C. Rae and K. H. Burnett, J. Phys. B 26, 1509 (1993).[33] S. C. Rae and K. H. Burnett (unpublished).


![i .] APPROXIMATING HARMONIC FUNCTIONS 499€¦ · APPROXIMATING HARMONIC FUNCTIONS 499 THE APPROXIMATION OF HARMONIC FUNCTIONS BY HARMONIC POLYNOMIALS AND BY HARMONIC RATIONAL FUNCTIONS*](https://static.fdocuments.net/doc/165x107/5f0873ba7e708231d42214c2/i-approximating-harmonic-functions-499-approximating-harmonic-functions-499-the.jpg)