High-dimensional Prognosis: Developing a gene signature ...
24
1 High-dimensional Prognosis: Developing a gene signature from a very large number of potential predictors Ulrich Mansmann IBE, LMU München [email protected]
Transcript of High-dimensional Prognosis: Developing a gene signature ...

1
High-dimensional Prognosis:
Developing a gene signature from a very large number of potential predictors
Ulrich MansmannIBE, LMU München

2
Is it important to decipher the heterogeneity of "normal karyotype AML"?
Almost half of adult acute myelogenous leukemia (AML) is normal cytogenetically, and this subgroup shows a remarkable heterogeneity of genetic mutations at the molecular level and an intermediate response to therapy.
The finding of recurrent cytogenetic abnormalities has influenced, in a primary way, the understanding and treatment of leukemias. Yet "normal karyotype AML" lacks such obvious abnormalities, but has a variety of prognostically important genetic (submicroscopic) abnormalities.
NPM1 and FLT3 mutations are established factors which influence prognosis.
Is it possible to detect patterns of genetic activities with strong influence on prognosis additional to theknown genetic mutations?
Oncologists need improved tools for selecting treatments for individual patients.
Metzeler KH et al. (2008) Blood

3
What can be done? • There is hardly any guidance from the biologists how to disentangle cellular
processes with regard to their effects on the disease course → black box
• There is no established cellular paradigm of certain tumors which can berepresented in a prognostic system.
• There is no thorough statistical experience which algorithm should be usedwhen developing a prognostic gene signature.
• There is a lot of arbitrariness in setting up a specific strategy for the project.
• Principles which shield the data analyst from failing are not common knowledge.
• Biotechnologies with different concepts can produce data.
MutationsCopy number changes
TranslocationsExpression profile
Prognosis
4
What is a gene signature?
1. A set of genes
2. An algorithm which transforms measured gene expression into a prognosticstatement.
In general, the gene set is published and no information is available about the algorithm.
People generally ignore the algorithm and have not a clear perception on the nature of the algorithm.

5
Project road map
Developing the gene signature
Applying it to new patients
Functional interpretation
• Normalization
• Preprocessing of data: yes/no/which
• Choice of prognostic algorithm
• How to avoid overfitting?
• Complexity of algorithm and measurementprocess
• Normalization
• Interpretation in terms of the disease process
• What are useful strategies

6
Elementary blunders to be avoided:
• Lack of specification of the process used to derive the model. Without suchspecification, it is difficult to judge the appropriateness of the process→ reproducible statistics
• Small sample sizes: the importance of having an adequate number ofsubjects is still not well understood.
• Do not use a convenience sample, use a typical clinical patient populationwith delineated patient selection criteria.

7
Validation
Justice AC, Covinsky CE, Berlin JA (1999) Assessing theGeneralizability of Prognostic Information, Ann Intern Med. 1999;130:515-524.
The purpose of validation is that the procedure is fit for purpose.

8
Normalisation
A specific step to remove systematic bias which are inherent to the production of microarray data.
Broad question: How do we compare results across chips?Focused goal: Getting numbers (quantifications) from one chip to mean the
same as numbers from another chip.
• Normalization acts on a group of arrays. Derived gene signatures are only validwithin the normalization setting.
• Information on the normalization process has to be communicated to allow futuredata to be put into the context of the normalization which is the basis of thederived gene signature.
• In general, this information is not communicated in published gene signaturepapers. People only communicate the gene set.

9
Normalisation

10
Preprocessing
Procedures used in reducing an unmanageably high set of molecular data to a more manageable, but still perhaps quite large, number of (summary) features to be used in further development:
• Metagenes (Mike West): Collapse genes with similar expression profilesto an artificial metagene by K-means
• Univariate Tests
• Use genes with large variability
• Use of subject knowledge
• and much more …
In general researcher do not see preprocessing as part of the prognostic research. But, they have profound effect on the later high-level analyses.

11
High-level analyses: Choice of central algorithm
Use algorithms with inbuilt regularization features:
• Elastic nets: combination of ridge and lasso regressionZou, Hastie (2005) JRSS B, 67:301-320Practical algorithms for Cox-Regression and GLMs by J. Goemanhttp://cran.r-project.org/web/packages/penalized/index.html
• PCA: Semi-Supervised Methods to Predict Patient Survival from GeneExpression DataBair E, Tibshirani R (2004) PLoS Biol. 2:E108.

12
Internal validation: How to avoid overfitting?
• The algorithm is a composite procedure.There is a lag of understanding how the components influence each other aswell as influence the quality of the final result.
• The choice of its elements is quite subjective and arbitrary.
• Need of a multi-layer cross-validation approach:
1.) Determination of internal model parameters2.) Selection from a set of suitable algorithms3.) Validating the chosen candidate

13
Optimal (unique) gene signatures?
RASHOMON AND THE MULTIPLICITY OF GOOD MODELSLeo Breiman (2001) Statistical Modeling: The Two Cultures, Statistical Science, 16: 199–231
…We showed that, in fact, the resulting set of genes is not unique; it is strongly influenced by the subset of patients used for gene selection. Many equally predictive lists could have been produced from the same analysis. Three main properties of the data explain this sensitivity: (1) many genes are correlated with survival; (2) the differences between these correlations are small; (3) the correlations fluctuate strongly when measured over different subsets of patients.
Liat Ein-Dor, Itai Kela, Gad Getz, David Givol, Eytan Domany (2005) Bioinformatics, 21: 171–178
Knowledge about the disease processes is too sparse to propose acomprehensive model.
It is necessary to compare the predictive quality of competing prognostic models.
Large data sets: Most gene signatures are developed with less than 300 patients. Large trials are on the way.

14
Choice of strategy
Reanalysis of Huang et al. (2003) Lancet, 361:1590–1596
Ruschhaupt et al. (2004) SAGMB, Vol. 3, Article 37
SVM – support vector machineRF – Random forrestPAM – shrunken centroidsPLR – penealized logistic regressionBBT – Bayesian binary trees
M – metagenes, method for dimensionreduction
Patient without recurrencePatient with recurrence

15
External validation: Transportability
Training data:HGU 133 A&B163 patients(Munich)
Validation data (I):HGU 133 plus79 patientsdifferent study(Munich)
Validation data (II):HGU 133 A&B 64 patientsdifferent study gorup(Cleveland)
No convenience samples!
Metzeler KH et al. (2008) Blood

16
External validation: Transportability
Overall survival Overall survival
Validation data (I):HGU 133 plus79 patientsdifferent study(Munich)
Validation data (II):HGU 133 A&B 64 patientsdifferent study gorup(Cleveland)
Metzeler KH et al. (2008) Blood

17
Functional interpretation
Biological information on features of the disease process is hidden in the gene signature.
Naïve interpretation may not be helpful:
… The connection between the metagene predictors and genes for interferons is intriguing in view of the role of interferons as mediators of the antitumour response and the fact that many genes involved in T-cellfunction (TCRA, CD3D, IL2R, MHC) are also included within the group that predict lymph-node metastasis.
Huang et al. (2003), The Lancet, 361: 1590-1596
More systematic approach:Hummel et al. (2008) Association between a Prognostic Gene Signature and Functional Gene Sets, Bioinformatics and Biological Insights.
18
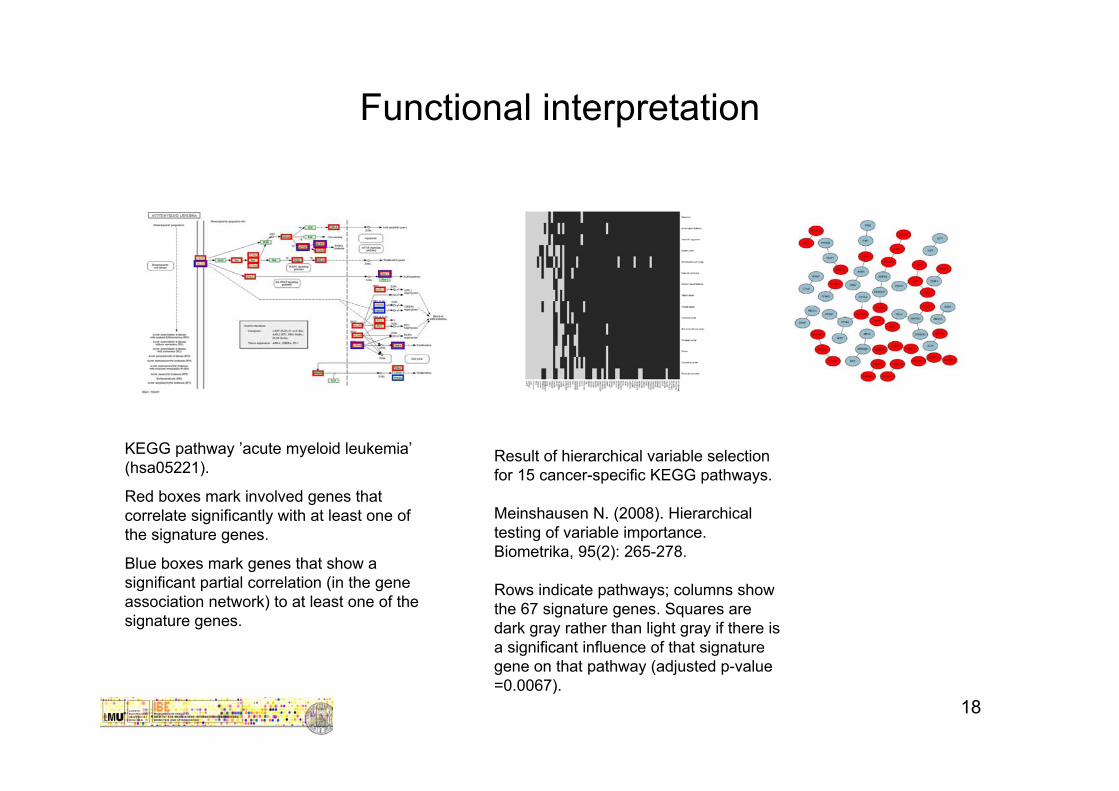
Functional interpretation
KEGG pathway ’acute myeloid leukemia’ (hsa05221).
Red boxes mark involved genes that correlate significantly with at least one of the signature genes.
Blue boxes mark genes that show a significant partial correlation (in the gene association network) to at least one of the signature genes.
Result of hierarchical variable selectionfor 15 cancer-specific KEGG pathways.
Meinshausen N. (2008). Hierarchical testing of variable importance. Biometrika, 95(2): 265-278.
Rows indicate pathways; columns showthe 67 signature genes. Squares aredark gray rather than light gray if there isa significant influence of that signaturegene on that pathway (adjusted p-value=0.0067).

19
Statistical Modeling: The Two Cultures
Breiman L (2001) Statistical Science, 16:199–231
There are two cultures in the use of statistical modeling to reach conclusions from data. One assumes that the data are generated by a given stochastic data model. The other uses algorithmic models and treats the data mechanism as unknown.
• The primary goal is not interpretability, but accurate information for a specificpurpose.
• Interpretability is a way of getting information. But a model does not have tobe simple to provide reliable information about the relation between predictorand response variables.
• There are measures which quantify predictive quality. Competing predictivetools can be compared. Predictive practice for a specified purpose can beimproved.

20
Reproducible statistical analysesRuschhaupt M, Huber W, Poustka A, Mansmann U. (2004) A compendium to ensure computational reproducibility in high-dimensional classification tasks. Stat Appl Genet Mol Biol. 3:Article 37.
There is a tendency to accept seemingly realistic computational results, as presented by figures and tables, without any proof of correctness.
Leisch / Rossini (2003) Chance, 16:41-46
• In statistics, the ability to document both programming language coding aswell as mathematical thought is critical to understandable, explainable, andreproducible data analysis.
• Publishing results in the traditional paper based way in a journal hides toomuch information. Compendia can provide the insights needed to plan future projects.
• For a scientist planning a prognostic study on a molecular signature thecompendium offers a complete framework for the design, analysis andreporting of the study. A compendium allows sensitivity analyses of a givenproblem and improves the ideas to plan new project steps.

21
How to report data?
• High ranked journals request authors to publish their microarray data.
• Two prominent repositories: GeneOmnibus (NIH), ArrayExpress (EBI)
• There are several ncAML prognostic studies with microarrays reported
• Data in repository are deficient:
- deficient ZIP files
- no original microarray data (only normalized version)
- no relevant clinical data (established prognostic factors)
• Data in repositories are useless for validation purpose.
• Direct contact to study groups is needed.

22
Transfer programs for gene signatures in clinical prognosis
• Simon R. Development and validation of therapeutically relevant multi-gene biomarkerclassifiers, Journal of the National Cancer Institute 97:866-7, 2005.
• Simon R. Bioinformatics in cancer therapeutics hype or hope? Nature Clinical PracticeOncology 2:223, 2005.
• Simon R. Roadmap for Developing and Validating Therapeutically Relevant GenomicClassifiers J Clin Oncol.2005; 23: 7332-7341
• Dupuy A, Simon R. Critical Review of Published Microarray Studies for CancerOutcome and Guidelines on Statistical Analysis and Reporting, Journal Nat. Cancer Inst, 99:147-157

23
Superstitions
• The gene signature is the direct image of the biological reality governing adisease process.
• Forget about the algorithm, the gene set is the focus!I can build a prognostic tool from the gene set, but it will be different from the toolwhich was the starting point! The algorithms are not compared!
• The proposed signature is optimal
• Heuristic dimension reduction does not bias the gene signature
• Forget about standard prognostic factors! Microarray information is enough!

24
Summary • The association between patient characteristics and outcome must be expressed
through an explicite algorithm.
• Awareness for the complex algorithmic task is needed.
• Comparing the results between different algorithmic strategies helps to gainconfidence in the proposed solution of the complex task.
• The functional interpretation of a gene signature is a complex statistical task ofits own. No experience does exist sofar how to proceed.
• Need to compare the predictive quality of competing proposals.
• There is enough methodological guidance to produce a credible candidate as starting point for a transfer into clinical use
• Need to delineate transfer programs for complex gene signatures into clinicalprognosis. Transfer the prognostic finding to an easily to use routine technologyand demonstrate reproducibility.
• Need for Phase III prognostic studies which assess the benefit of using thesignatures to adapt individual treatment.