High Agricultural Commodity Prices: What Are the...
50
Order Code RL34474 High Agricultural Commodity Prices: What Are the Issues? Updated May 29, 2008 Randy Schnepf Specialist in Agricultural Policy Resources, Science, and Industry Division
Transcript of High Agricultural Commodity Prices: What Are the...

Order Code RL34474
High Agricultural Commodity Prices: What Are the Issues?
Updated May 29, 2008
Randy SchnepfSpecialist in Agricultural Policy
Resources, Science, and Industry Division

High Agricultural Commodity Prices: What Are the Issues?
Summary
Prices for nearly all major U.S. agricultural program crops — corn, barley,sorghum, oats, wheat, rice, and soybeans — have exhibited extreme price volatilitysince mid-2007, while rising to record or near-record levels in early 2008. Severalinternational organizations have announced that the sharply rising commodity pricesare likely to have dire consequences for the world’s vulnerable populations,particularly in import-dependent, less developed nations. In the United States, highcommodity prices have pushed farm income to successive annual records and havesharply lowered government farm program costs, but they have also stoked theflames of food price inflation and have raised costs for livestock producers and foodprocessors. In addition, high, unexpectedly volatile prices have increased the riskand costs associated with grain merchandising. In particular, they have dramaticallyincreased the cost of routine hedging activities (i.e., pricing commodities forpurchase, delivery, or use at some future date) at commodity futures exchanges and,as a result, have diminished “forward contracting” opportunities for grain and oilseedproducers who are eager to take advantage of record high market prices.
For some crops (particularly for wheat and rice), the price increases are likelyto be relatively short-term in nature and are due to weather-related crop shortfalls inmajor producer and consumer countries, a weak U.S. dollar that has helped sparklarge increases in U.S. exports, a bidding war among major U.S. crops for land in themonths leading up to spring planting in 2008, and the often perverse price effectsresulting from international policy responses by several major exporting andimporting nations to protect their domestic markets. Assuming a return to normalweather, these factors will likely self-correct within two growing seasons as globalsupplies are replenished and prices moderate. For coarse grains (corn, sorghum,barley, oats, and rye), oilseeds, and oilseed products (e.g., vegetable oil and meal),the price increases have also been due to strong, sustained demand deriving from twosources: robust income growth in developing countries (e.g., China and India), whichhas contributed to increased demand for meat products and the feed grains needed toproduce that meat; and growing agricultural feedstock demand to meet largeincreases in government biofuel-usage mandates or goals in the United States, theEuropean Union, and other countries.
Market analysts, including the United Nations’ Food and AgriculturalOrganization (FAO), are predicting record global grain and oilseed production in2008 in response to the high market prices. However, given the overall strength indemand growth, most market analysts predict that when commodity supplieseventually recover and prices moderate from current high levels, the new equilibriumprices will be significantly higher than has traditionally been observed duringperiods of market balance.
This report examines the causes, consequences, and outlook for prices of themajor U.S. program crops, and provides references for more detailed information.It will be updated as events warrant.

Contents
Introduction . . . . . . . . . . . . . . . . . . . . . . . . . . . . . . . . . . . . . . . . . . . . . . . . . . . . . . 1Global Food Crises Declared by United Nations . . . . . . . . . . . . . . . . . . . . . . 3Not All Commodities Are Equal . . . . . . . . . . . . . . . . . . . . . . . . . . . . . . . . . . 4High Prices: A Case of Deja Vu . . . . . . . . . . . . . . . . . . . . . . . . . . . . . . . . . . 4
U.S. and Global Stocks Near Historic Lows for Several Crops . . . . . . . . . . . . . . . 5
Many Commodity Price Records Established in 2008 . . . . . . . . . . . . . . . . . . . . 11Several Futures Prices Set All-Time Highs . . . . . . . . . . . . . . . . . . . . . . . . 11U.S. Farm Prices Projected Record High for Several Crops . . . . . . . . . . . . 15International Index of Export Prices Record High . . . . . . . . . . . . . . . . . . . . 16
Factors Behind the High Prices . . . . . . . . . . . . . . . . . . . . . . . . . . . . . . . . . . . . . . 17Widespread Weather-Related Crop Shortfalls . . . . . . . . . . . . . . . . . . . . . . . 17Strong Economic Growth in Developing Countries . . . . . . . . . . . . . . . . . . 18Declining Investment in Agricultural Productivity . . . . . . . . . . . . . . . . . . . 18Weak U.S. Dollar Lowers Cost of U.S. Exports . . . . . . . . . . . . . . . . . . . . . 18Government Biofuels Policy . . . . . . . . . . . . . . . . . . . . . . . . . . . . . . . . . . . . 19Foreign Government Policies to Limit Exports . . . . . . . . . . . . . . . . . . . . . . 22High Energy Costs . . . . . . . . . . . . . . . . . . . . . . . . . . . . . . . . . . . . . . . . . . . . 24Macroeconomic Linkages Reinforce Price Rises . . . . . . . . . . . . . . . . . . . . 25
Implications of High Commodity Prices . . . . . . . . . . . . . . . . . . . . . . . . . . . . . . . 26U.S. Farm Income Record High . . . . . . . . . . . . . . . . . . . . . . . . . . . . . . . . . . 26Lower Government Farm Program Outlays . . . . . . . . . . . . . . . . . . . . . . . . . 26Crop Insurance Premiums Costs Surge in 2008 . . . . . . . . . . . . . . . . . . . . . . 27Sharply Higher Feed Costs . . . . . . . . . . . . . . . . . . . . . . . . . . . . . . . . . . . . . . 28Futures Market Dilemma . . . . . . . . . . . . . . . . . . . . . . . . . . . . . . . . . . . . . . . 28Expanded, More Intensive Agricultural Production . . . . . . . . . . . . . . . . . . 30Converting Conservation Acres to Production . . . . . . . . . . . . . . . . . . . . . . 31Rising Food Price Inflation Impacts Consumer Budgets . . . . . . . . . . . . . . . 32High Prices Hurt International Food Aid Prospects . . . . . . . . . . . . . . . . . . . 36
Farm Commodity Market Outlook . . . . . . . . . . . . . . . . . . . . . . . . . . . . . . . . . . . 37Positive Short-Run Outlook, Especially for Food Crops . . . . . . . . . . . . . . . 37Long-Term Outlook Hinges on Productivity Gains . . . . . . . . . . . . . . . . . . . 39
U.S. and International Policy Response . . . . . . . . . . . . . . . . . . . . . . . . . . . . . . . . 39U.S. Industry Groups Decry Rising Costs of Grain as an Input . . . . . . . . . . 40U.S. Congressional Action . . . . . . . . . . . . . . . . . . . . . . . . . . . . . . . . . . . . . . 41Immediate International Food Crises Response . . . . . . . . . . . . . . . . . . . . . . 43Long-Term Agricultural Productivity Response . . . . . . . . . . . . . . . . . . . . . 44Possible World Trade Organization (WTO) Implications . . . . . . . . . . . . . . 45
List of Figures
Figure 1. Monthly International Export Prices for Corn, Wheat, and Rice: January 1990 to May 2008 . . . . . . . . . . . . . . . . . . . . . . . . . . . . . . . . . . . . . . . 2
Figure 2. U.S. Season Average Farm Prices for Corn, Soybeans, Wheat, and Rice: 1960/1961 to 2008/2009 . . . . . . . . . . . . . . . . . . . . . . . . . . . . . . . . 2
Figure 3. All Wheat: U.S. Season-Average Farm Price vs. End-of-Year Stocks-to-Use Ratio . . . . . . . . . . . . . . . . . . . . . . . . . . . . . . . . . . . . . . . . . . . . 8
Figure 4. Corn: U.S. Season-Average Farm Price vs. End-of-Year Stocks-to-Use Ratio . . . . . . . . . . . . . . . . . . . . . . . . . . . . . . . . . . . . . . . . . . . . 8
Figure 5. Barley: U.S. Season-Average Farm Price vs. End-of-Year Stocks-to-Use Ratio . . . . . . . . . . . . . . . . . . . . . . . . . . . . . . . . . . . . . . . . . . . . 9
Figure 6. Soybeans: U.S. Season-Average Farm Price vs. End-of-Year Stocks-to-Use Ratio . . . . . . . . . . . . . . . . . . . . . . . . . . . . . . . . . . . . . . . . . . . . 9
Figure 7. Rice: U.S. Season-Average Farm Pricevs. End-of-Year Stocks-to-Use Ratio . . . . . . . . . . . . . . . . . . . . . . . . . . . . . . . . . . . . . . . . . . . 10
Figure 8. Cotton: U.S. Season-Average Farm Price vs. End-of-Year Stocks-to-Use Ratio . . . . . . . . . . . . . . . . . . . . . . . . . . . . . . . . . . . . . . . . . . . 10
Figure 9. Rough Rice July 2008 Futures Contract Sets All-Time High of $24.85 per 100 lbs. on April 23, 2008 . . . . . . . . . . . . . . . . . . . . . . . . . . . . . 13
Figure 10. Corn July 2009 Futures Contract Sets All-Time High of $6.77 per bushel on May 9, 2008 . . . . . . . . . . . . . . . . . . . . . . . . . . . . . . . . . . . . . . 13
Figure 11. 11-Month Moving Average of Price Volatility Index for Corn and Wheat Futures Prices Since 1980 . . . . . . . . . . . . . . . . . . . . . . . . . . . . . . . . 14
Figure 12. U.N. FAO Agricultural Export Price Index: 1990 to 2008 . . . . . . . . 17Figure 13. The U.S. Dollar Has Steadily Weakened Against the Euro,
the Canadian Dollar, and the Australian Dollar Since 2001 . . . . . . . . . . . . 19Figure 14. Energy Costs: Annual Average Prices Since 1975 for Gasoline,
Diesel, and Crude Oil . . . . . . . . . . . . . . . . . . . . . . . . . . . . . . . . . . . . . . . . . . 25Figure 15. Food Price Index: Month-to-Month Change vs. 11-Month
Moving Average (11-mo MA) . . . . . . . . . . . . . . . . . . . . . . . . . . . . . . . . . . . 33
List of Tables
Table 1. Summary of Global and U.S. Ending Stocks for 2007/2008 and 2008/2009 . . . . . . . . . . . . . . . . . . . . . . . . . . . . . . . . . . . . . . . . . . . . . . . . . . . 6
Table 2. Futures Contract Price Highs, Selected Commodities and Months, vs. the Recent Five-Year Average Farm Price (AFP) . . . . . . . . . . . . . . . . . 12
Table 3. U.S. Farm (or Wholesale) Prices: Projected vs. the Previous Five-Year Average and Prior Record . . . . . . . . . . . . . . . . . . . . . . . . . . . . . . 16
Table 4. FAPRI Projections of U.S. Biofuel Policy Impacts . . . . . . . . . . . . . . . 22

1 Note that all data are in metric tons unless otherwise stated. These prices are from “WorldFood Situation website,” Food and Agricultural Organization (FAO), United Nations, at[http://www.fao.org/es/esc/en/index.html].2 An additional source for more detailed market and policy information for major programcrops may be found at the online briefing rooms maintained by the Economic ResearchService (ERS) of USDA, available at [http://www.ers.usda.gov/briefing].
High Agricultural Commodity Prices: What Are the Issues?
Introduction
Since late 2007, U.S. and international markets for major grains and oilseedshave experienced a period of tight supplies, strong demand, and high prices not seensince the mid-1990s (Figures 1 and 2). While agricultural commodity prices rosesharply during 2007, they jumped precipitously in early 2008. For example, exportprices for the world’s two major food crops — wheat and rice, rose by 81% and 21%,respectively, during 2007, but have surged even higher in early 2008. Wheat prices(HRW No. 2, f.o.b., U.S. Gulf ports) rose 44% between November 2007 and March2008 — rising from $334.6 per ton to $481.5 — before falling back in April andMay.1 Rice export prices (100% Grade B, f.o.b. Bangkok) have more than doubledsince November 2007, rising from $358.3 per ton to $1,020 in late May 2008 — anincrease of nearly 185%.
This report identifies the predominant factors behind the 2007/2008-crop-yearmarket conditions for major agricultural commodities, with a focus on U.S. farmprogram crops. In addition, it briefly discusses how higher, more volatile commodityprices have impacted farm incomes, government farm programs, hedging activities,the livestock and food processing sectors, food prices, and the international foodsecurity situation. It reviews both the near- and longer-term commodity priceoutlook, and finally, it discusses various viewpoints and policy options that havebeen suggested as possible responses to the perceived causes and consequences ofthe unusually high commodity prices.
Because supply and demand circumstances vary widely across these crops —particularly in terms of their seasonality, their price elasticity, and the derived natureof their end products — readers are encouraged to review the brief commodityoverviews provided in CRS Report RL33204, Price Determination in AgriculturalCommodity Markets: A Primer, for background information on the underlying natureof the different commodity markets.2

CRS-2
1 9 9 0 1 9 9 5 2 0 0 0 2 0 0 5 2 0 1 0
0
2 0 0
4 0 0
6 0 0
8 0 0
1 0 0 0
S o u r c e : U . N . F A O , I n t e r n a t i o n a l C o m m o d i t y P r i c e s . R i c e : T h a i 1 0 0 %G r a d e B , f . o . b . B a n g k o k ; W h e a t : U . S . N o . 2 , H a r d R e d W i n t e r , G u l f ;C o r n : U . S . N o . 2 Y e l l o w , G u l f .
C o r n
R i c e
W h e a t
Figure 1. Monthly International Export Prices for Corn, Wheat, andRice: January 1990 to May 2008
1 9 6 0 1 9 7 0 1 9 8 0 1 9 9 0 2 0 0 0 2 0 1 0
0
5
1 0
1 5
2 0
S o u r c e : N A S S a n d W A O B , W A S D E , U S D A .
C o r n
R i c e
W h e a t
S o y b e a n s
Figure 2. U.S. Season Average Farm Prices for Corn, Soybeans,Wheat, and Rice: 1960/1961 to 2008/2009

CRS-3
3 For more information on the international food crisis, see CRS Report RL34478, RisingFood Prices and Global Food Needs: The U.S. Response, by Charles Hanrahan.4 “WFP Letter of Appeal to Government Donors to Address Critical Funding Gap,” WFPNews Room, March 20, 2008, at [http://www.wfp.org/].5 “UN Chief: Food Crisis in Now Emergency,” by Edith M. Lederer, Breitbart.com,April 14, 2008, at [http://www.breitbart.com/article.php?id=D901PT181&show_article=1].6 “Food Price Crisis Imperils 100 Million in Poor Countries, Zoellick Says,” The WorldBank , News Release, April 14, 2008, at [http://www.worldbank.org/html/extdr/foodprices/].7 Crop Prospects and Food Situation report, No. 2, April, 2008, FAO, U.N., at [http://www.fao.org/giews/english/cpfs/index.htm].8 “Food Crisis Is Depicted as ‘Silent Tsunami’,” by Kevin Sullivan, Washington Post, April23, 2008.
Global Food Crises Declared by United Nations
While the high market prices have been a boon for producers and owners ofagricultural commodities, they represent a drastically worsening food securityoutlook for low-income households, particularly those in poor, import-dependentcountries.3 A global crisis was signaled when, on March 20, 2008, Josette Sheeran,the executive director of the United Nations’ World Food Program (WFP), issued anappeal for $500 million from donor countries to close an immediate gap in theWFP’s normal food distribution commitments resulting from rising commodityprices.4 This was followed on April 14, 2008, by a warning from U.N. SecretaryGeneral Ban Ki-moon that a rapidly escalating global food crisis had reachedemergency proportions and threatened to wipe out seven years of progress in the fightagainst poverty.5 World Bank president Robert B. Zoellick announced that the surgein food prices could push 100 million people living in low-income countries intodeeper poverty.6 That same month the U.N.’s Food and Agricultural Organization(FAO) identified 37 countries in food crisis requiring external assistance — 21 ofthem in Africa.7 Then, on April 22, 2008, barely a month after her firstannouncement, executive director Sheeran announced that the WFP’s operationfunding gap had now risen to $755 million, up from the earlier estimate of $500million, due to continuing increases in commodity prices since mid-March.8
In addition to global food security concerns, higher commodity prices havestoked the flames of food price inflation and its potentially deleterious effect onlower-income households while raising costs for livestock feeders and foodprocessors. Because the rising prices have been associated with unexpectedly largeprice volatility, they also have increased the risk and costs of grain merchandising allalong the marketing chain. Finally, the high, volatile commodity prices havedramatically increased the cost of routine hedging activities (i.e., pricingcommodities for purchase, delivery, or use at some future date) at commodity futuresexchanges and thereby diminished “forward contracting” opportunities for grain andoilseed producers who are eager to take advantage of record high market prices.
CRS-4
9 For a brief description of these earlier periods, see “Global Grain Markets in 1996: Shadesof 1972-74?” by Pete Riley, Agricultural Outlook, September 1996, pp. 2-6.
Not All Commodities Are Equal
The specific circumstances leading to high market prices — e.g., weather-related supply shortfalls, unexpected surges in demand, market-distortinggovernment policies — vary in important ways for each of the major U.S. programcrops. For wheat, a combination of international weather-related crop failures overthe past two years that has resulted in historically low U.S. and global stock levelsis the primary impetus behind high prices. Government policies by several keyforeign producers to limit exports in favor of domestic markets also have contributedto higher prices. For coarse grains and oilseeds, a combination of growing demandbolstered by rapid income growth in developing markets and government biofuelspolicies are the key drivers. For rice, government policies by several major riceexporting countries since late 2007 to limit exports followed by panic buying on thepart of several import-dependent rice buyers, most notably the Philippines, are theprimary catalysts. For cotton, where global supplies remain relatively abundant, thegeneral “bull market” mentality that currently dominates global markets for nearlyall commodities has likely been a major contributor to what are otherwise unusuallyhigh prices given cotton’s current supply and demand balance.
Of course, no single event or circumstance fully explains high prices for anysingle commodity. Global economic growth, in general, reinforces demand for allagricultural commodities. Lack of sustained investment in the agricultural sectordiminishes long-term productivity potential, dampens producer incentives, andcontributes to the slow erosion of food supply availability. High prices for one cropspill over into markets for other crops that compete for the same agricultural land.A ban on rice or wheat exports by one country ripples through all commodity marketsthat compete for the consumer’s food budget. And, as a backdrop, record oil priceshave raised costs all along the various commodity marketing chains from field tokitchen table.
High Prices: A Case of Deja Vu
The last period of similarly high commodity prices occurred in the 1995-1996period, when several years of government stock reductions were followed by anunusual combination of global supply-reducing weather events and stronginternational demand.9 However, current commodity market conditions for majorU.S. farm program crops — which have occurred simultaneously with dramatic pricerises in coffee, cocoa, and tea markets, as well as in non-agricultural markets (e.g,petroleum, gold, silver, platinum, copper, aluminum, iron ore, and coal) — appearmore reminiscent of the 1972-1974 period, when increasing inflation, gasolineshortages, and fears of widespread resource depletion appeared to place constraintson economic growth and food production.

CRS-5
10 For more information, see CRS Report RS21970, The U.S. Farm Economy.
In the current farm commodity bull market, global stocks-relative-to-use ratiosfor vegetable oils and several grain crops are projected to reach historic lows by mid-2008 (Table 1). As a result, commodity prices in both cash and futures markets haveapproached or surpassed historic highs (Tables 2 and 3) while exhibiting heightenedsensitivity to crop prospects across the globe this year. This sensitivity has translatedinto record price volatility in agricultural markets. The full consequences ofhistorically high, but unpredictably volatile, commodity prices are only beginning toemerge, but clearly they have raised the cost of doing business and such costs havenot been spread evenly among market participants.
On the positive side, high commodity prices have contributed to record U.S.farm income in 2007 and the outlook for even higher returns in 2008, whiledramatically reducing government outlays for price-contingent commodityprograms.10 On the other hand, the outlook for sustained high commodity prices hascontributed to the concerns of the U.S. livestock sector and food processors about thecontinued timely availability of grain and oilseed supplies, and the impact such highinput prices have had on their profitability. Historic high price levels and volatilityhave sharply increased the costs of routine hedging activities of commercialelevators, grain merchandisers, and food processors. In addition, as commodityprices have risen in tandem with food prices, consumers from low-incomehouseholds and import-dependent nations have expressed concerns, often in the formof riots, about food price inflation, domestic and international food aid, and theability of agricultural producers to meet projections for continued strong demandgrowth.
U.S. and Global Stocks Near Historic Lows for Several Crops
U.S. and global stocks for several major U.S. program commodities areexpected to be at or near historically low levels — particularly when measured as ashare of total usage — prior to the next harvest this coming summer and fall of 2008(Table 1 and Figures 3-8). For example, global end-of-year stocks for coarse grainsand wheat are projected to drop by mid-2008 to the lowest levels since 1977, whileending stocks of total grains (i.e., rice, wheat, and coarse grains combined) fall to thelowest level since 1981. More importantly, their respective stocks-to-use ratios areall projected to reach record lows. Similarly, the stocks-to-use ratios for global cornand vegetable oils are projected to be the tightest since the early 1970s. Global ricestocks, as well as the stocks-to-use ratio, are projected up slightly from the previousyear at 77.2 million tons and 18.2% in 2007/2008. However, the previous year’sstocks-to-use ratio of 18.1% was the lowest since 1976. Current rice stock levelsrepresent a halving of available supplies from the year 2000, when global endingstocks peaked at 147.1 million tons.

CRS-6
Table 1. Summary of Global and U.S. Ending Stocks for 2007/2008 and 2008/2009
Commodity
2008/2009 2007/2008
EndingStocks
Stock-to-Use
Ratio Ending StocksStock-to-Use
Ratio
MillionTons %
MillionTons
Changefrom
2006/2007 %
Low-est
Since
Globala
Total Grainsc 333.8 14% 323.5 -3% 14% record
Coarse Grainsd 127.2 11% 135.0 0% 11% record
Wheat 124.0 16% 110.0 -11% 15% record
Corn 99.0 11% 109.7 4% 13% 1973
Rice 82.6 18% 78.5 4% 17% 2006e
Soybeans na na 49.0 0% 16% 2003
Cotton na na 13.4 -2% 38% 2003
Vegetable Oil na na 9.3 -1% 5% 1972
United Statesb
Total Grainsc 36.9 9% 45.6 -9% 11% 1995
Coarse Grains 23.2 7% 38.4 6% 11% 1995
Wheat 13.1 22% 6.5 -47% 10% 1946
Corn 19.4 6% 35.1 6% 11% 2003
Rice 0.5 8% 0.7 -45% 9% 1974
Soybeans na na 4.4 10% 5% 2003
Cotton na na 2.2 4% 53% 2005
Vegetable Oil na na 1.6 -3% 13% 2004
Source: USDA, PSD data base, May 2008.
Note: The 2007 crop year covers the period from the start of the 2007 harvest to the start of the 2008harvest. Thus, ending stocks for the 2007 crop represent supplies available in 2008 just prior to theharvest for the 2008 crop. Similarly, the stocks-to-use ratio for the 2007 crop is a measure of availablesupplies relative to use just prior to the harvest of the 2008 crop.
a. USDA’s PSD database for global commodities extends back to 1960; thus, “lowest on record”means the lowest data point” since 1960.
b. USDA domestic data extends back prior to 1900 for most commodities. c. Total grains include coarse grains, wheat, and rice.d. Coarse grains include corn, sorghum, barley, oats, and rye.e. Rice stocks in 2006 were the lowest since 1976.

CRS-7
11 Pipeline ranges are derived by CRS from various sources.12 For more information, see CRS Report RL33204, Price Determination in AgriculturalCommodity Markets: A Primer, by Randy Schnepf.
A certain amount of stocks at the end of the marketing year are necessary toprovide a continuous flow of grain to processors and exporters before the new cropis harvested — such stocks are referred to as pipeline supplies. Although there is nohard and fast rule on what volume of stocks represents desirable pipeline levels forthe major grain and oilseed crops, whenever stocks approach historically low levelsmarket analysts speculate about what pipeline-stock levels might be. For wheat, U.S.pipeline stocks are estimated to be in a range of 9.5 to 11 million tons (350 to 400million bushels); for corn, 10 to 12 million tons (400 to 500 million bushels); and forsoybeans, about 4 to 5.5 million tons (150 to 200 million bushels).11 WheneverUSDA ending stock projections approach these levels, market prices become verysensitive to unexpected market news and prices tend to be more volatile than duringperiods of abundant stocks.
U.S. wheat ending stocks for 2007/2008 are projected to fall to their lowest level(239 million bushels or 6.5 million tons) since 1947 — well below their pipelinerange. U.S. soybean stocks of 4.4 million tons are projected at the lower end of theirpipeline range. U.S. corn ending stocks, although projected at what would appear tobe an ample level, are low in historical global supply-to-use terms. Furthermore, themulti-year outlook for corn supplies is strongly impacted by the biofuels usagemandate in the Energy Independence and Security Act of 2007 (P.L. 110-140), whichsuggests that corn supplies will continue to tighten through 2015. Among the majorprogram crops, cotton is the principal exception, with global and U.S. ending stocksprojected at relatively abundant levels. In 2008/2009, USDA projects that globalcoarse grain stocks will continue to tighten, while wheat and rice stocks rebuildslightly on the outlook for record harvests.
Ending stocks are calculated as the difference between total supplies (beginningstocks plus production plus imports) and total disappearance (all domestic uses plusexports). As such, season-ending stocks of an annually produced commoditysummarize the effects of both supply and demand factors during the marketing year.Expected ending stocks — expressed as a ratio over expected total use — arefrequently used as an indicator of a commodity’s expected price outcome by USDAand other market observers.12 For most seasonal commodities, annual prices tend tohave a strong negative correlation with their ending stocks-to-use ratio (Figures 3-8).As a result, expectations for high stocks relative to use typically result in lowerprices, while expectations for low stocks relative to use tend to raise prices.

CRS-8
1 9 7 0 1 9 8 0 1 9 9 0 2 0 0 0 2 0 1 0
1
2
3
4
5
6
7
8
0
2 0 %
4 0 %
6 0 %
8 0 %
1 0 0 %
S o u rc e : 1 9 7 0 -2 0 0 6 :U S D A , E R S , W h e a t B r ie fin g R o o m d a ta ;2 0 0 7 :W A S D E , M a y 9 , 2 0 0 8 .
S A F P
Figure 3. All Wheat: U.S. Season-Average Farm Price vs. End-of-Year Stocks-to-Use Ratio
1 9 7 0 1 9 8 0 1 9 9 0 2 0 0 0 2 0 1 0
1
2
3
4
5
6
0
1 0 %
2 0 %
3 0 %
4 0 %
5 0 %
6 0 %
7 0 %
S o u rc e : 1 9 7 0 -2 0 0 6 :U S D A , E R S , C o rn B r ie fin g R o o m d a ta ;2 0 0 7 :W A S D E , M a y 9 , 2 0 0 8 .
S to c k s - to -u s e r a t i o
S A F P
Figure 4. Corn: U.S. Season-Average Farm Pricevs. End-of-Year Stocks-to-Use Ratio

CRS-9
1 9 7 0 1 9 8 0 1 9 9 0 2 0 0 0 2 0 1 0
0
1
2
3
4
5
6
7
0
1 0 %
2 0 %
3 0 %
4 0 %
5 0 %
6 0 %
7 0 %
S o u rc e : 1 9 7 0 -2 0 0 6 :U S D A , E R S , C o rn B rie fin g R o o m d a ta ;2 0 0 7 : W A S D E , M a y 9 , 2 0 0 8 .
S to c k s - to -u s e r a t io
S A F P
Figure 5. Barley: U.S. Season-Average Farm Pricevs. End-of-Year Stocks-to-Use Ratio
1 9 7 0 1 9 8 0 1 9 9 0 2 0 0 0 2 0 1 0
0
3
6
9
1 2
0
5 %
1 0 %
1 5 %
2 0 %
2 5 %
3 0 %
S o u rc e : 1 9 7 0 -2 0 0 6 :U S D A , E R S , S o y b e a n s B r ie fin g R o o m d a ta ; 2 0 0 7 :W A S D E , M a y 9 , 2 0 0 8 .
S to c k s - to -u s e r a t io
S A F P
Figure 6. Soybeans: U.S. Season-Average Farm Price vs. End-of-Year Stocks-to-Use Ratio

CRS-10
1 9 7 0 1 9 8 0 1 9 9 0 2 0 0 0 2 0 1 0
0
4
8
1 2
1 6
2 0
0
1 0 %
2 0 %
3 0 %
4 0 %
5 0 %
6 0 %
7 0 %
S o u rce : 1 9 7 0 -2 0 0 6 :U S D A , E R S , R ic e B rie f in g R o o m d a ta ; 2 0 0 7 :W A S D E , M a y 9 , 2 0 0 8 .
S to c k s - to -u s e r a t io
S A F P
Figure 7. Rice: U.S. Season-Average Farm Pricevs. End-of-Year Stocks-to-Use Ratio
1 9 7 0 1 9 8 0 1 9 9 0 2 0 0 0 2 0 1 0
0
2 0
4 0
6 0
8 0
0
2 0 %
4 0 %
6 0 %
8 0 %
1 0 0 %
1 2 0 %
S o u rc e : 1 9 7 0 -2 0 0 6 :U S D A , E R S , C o tt o n B r ie fin g R o o m d a ta ; 2 0 0 7 :W A S D E , M a y 9 , 2 0 0 8 ; a n d 2 0 0 8 -0 9 F A P R I 2 0 0 8 b a s e l in e .
S t o c k s - t o - u s e r a t io
S A F P
Figure 8. Cotton: U.S. Season-Average Farm Price vs. End-of-Year Stocks-to-Use Ratio

CRS-11
13 For more information on agricultural futures exchanges, see CRS Report RL33204, PriceDetermination in Agricultural Commodity Markets: A Primer.14 CBOT daily futures contract price quotes are available at [http://www.cbot.com].
Many Commodity Price Records Established in 2008
The tight supply situation for many agricultural commodities has sparked highercommodity prices throughout the global marketing chain — farm gate, futuresmarkets, major international ports of call, wholesale distribution points, and finallyto retail prices. However, not all prices respond with the same speed and volatility.Prices for electronically-traded agricultural futures market contracts respond almostinstantaneously to new market information. In contrast, farm prices are weighted bymarkets — a large share of which occur immediately after harvest, when prices aregenerally at their lowest point of the season — and often respond more to local ratherthan international market conditions. Wholesale and export market prices fallsomewhere between farm and futures market prices in terms of their responsivenessto changing conditions.
Several Futures Prices Set All-Time Highs
Unlike cash markets which deal with the immediate transfer of goods, a futuresexchange provides the facilities for buyers and sellers to trade commodity futurescontracts — that is, contracts to buy (or sell) a specified volume of a commodity,subject to detailed quality conditions, at a fixed price for potential physical delivery(or acquisition) at some future date. Commodity futures exchanges are importantbarometers of commodity price movements — both the general level as well as thevolatility — because they function as a central exchange for domestic andinternational market information. Market participants are able to respond with buyor sell orders within seconds upon receiving new information. As a result, futurescontract prices react almost instantaneously to new information regarding commoditysupply and demand expectations. This futures market activity (e.g., price, volume,open interest) is then reported electronically by the major exchanges through theirown news media, as well as through national and international news media.13 As aresult of this transparency, futures exchanges have served two critical roles — pricediscovery and risk management — in facilitating the marketing of agriculturalcommodities.
The market circumstances of the first few months in 2008 have clearlymanifested themselves in the commodity futures exchanges, where prices for manycommodities have hit historic all-time highs (Table 2). For example, at the ChicagoBoard of Trade (CBOT), prices for nearby futures contracts for corn, wheat,soybeans, soybean oil, and rice reached all-time highs in early March 2008.14 Cornand rice contracts have remained particularly active, pushing to new contract highson almost a daily basis during April and into May (Figures 9 and 10).

CRS-12
Table 2. Futures Contract Price Highs, Selected Commoditiesand Months, vs. the Recent Five-Year Average Farm Price (AFP)
CommodityFutures
Exchangesa UnitContract:
Month / YR DateIntra-day
High Priceb5-Year AFPd
Wheat: HRS MGEX bushels March 08 2/25/08 $25.00c $3.70
May 08 2/27/08 $19.00
Previous high May 96 5/10/96 $7.32
Wheat: HRW KCBOT bushels March 08 2/27/08 $13.70c $3.54
May 08 2/27/08 $13.70
Previous high May 96 4/26/96 $7.44
Wheat: SRW CBOT bushels March 08 2/27/08 $13.35 $3.28
May 08 2/27/08 $13.50c
Previous high July 96 3/20/96 $7.50
Corn CBOT bushels March 08 3/11/08 $5.72 $2.22
May 08 5/9/08 $6.27
July 09 5/9/08 $6.77c
Previous high July 96 7/12/96 $5.55
Soybeans CBOT bushels March 08 3/3/08 $15.71 $6.03
May 08 3/3/08 $15.86
July 08 3/3/08 $15.95c
Previous high July 73 6/5/73 $12.90
Soybean oil CBOT pounds March 08 3/3/08 $0.708 $0.236e
May 08 3/3/08 $0.708
March 09 3/3/08 $0.721c
Previous high October 74 10/1/74 $0.510
Soybean meal CBOT short ton March 08 3/3/08 $385.70 $193.6e
May 08 3/3/08 $392.90
July 08 3/3/08 $393.00
Previous high July 73 6/5/73 $451.00
Rice CBOT cwt March 08 3/13/08 $19.55 $6.81
May 08 4/23/08 $24.46
July 08 4/23/08 $24.85c
Previous high March 97 1/31/97 $12.45
Source: Futures contract prices are reported daily by the various futures exchanges and reprinted inthe Wall Street Journal; farm prices are from NASS, USDA; and cash prices are from AMS, USDA.
a. MGEX = Minneapolis Grain Exchange; KCBOT=Kansas City Board of Trade; andCBOT=Chicago Board of Trade; cwt = hundredweight (i.e., 100 lbs.).
b. Record price for each contract month with the exception of the July soybean meal futures contract.c. Record price: any futures contract month for this commodity at this exchange as of May 27, 2008.d. Simple average of monthly farm prices received for the five-year period 2002/2003 through
2006/2007.e. Simple average of monthly cash prices; Decatur, Illinois.

CRS-13
Note: Futures market price data is presented as weekly price ranges with the left tick representing theweek’s opening price and the right tick representing the week’s final settlement price.
Note: Futures market price data is presented as weekly price ranges with the left tick representing theweek’s opening price and the right tick representing the week’s final settlement price.
Figure 9. Rough Rice July 2008 Futures Contract Sets All-Time Highof $24.85 per 100 lbs. on April 23, 2008
Figure 10. Corn July 2009 Futures Contract Sets All-Time High of$6.77 per bushel on May 9, 2008
CRS-14
15 The price volatility index is a measurement of the day-day change in price. It is expressedas a percentage and computed as the annualized standard deviation of the percentage changein daily price.16 Chicago Mercantile Exchange (CME) Group, Datamine, Historical Volatility Measures,[http://www.cmegroup.com/].
1 9 8 0 1 9 8 5 1 9 9 0 1 9 9 5 2 0 0 0 2 0 0 5
0
1 0
2 0
3 0
4 0
0
1 0
2 0
3 0
4 0
5 0
S o u r c e : C h i c a g o M e r c a n t i l e E x c h a n g e ( C M E ) G r o u p , d a t a m i n e ,H i s t o r i c a l P r i c e V o l a t i l i t y ; [ w w w w . c m e g r o u p . c o m / ] .
W h e a t
C o r n
P r i c e V o l a t i l i t y I n d e x ( % )
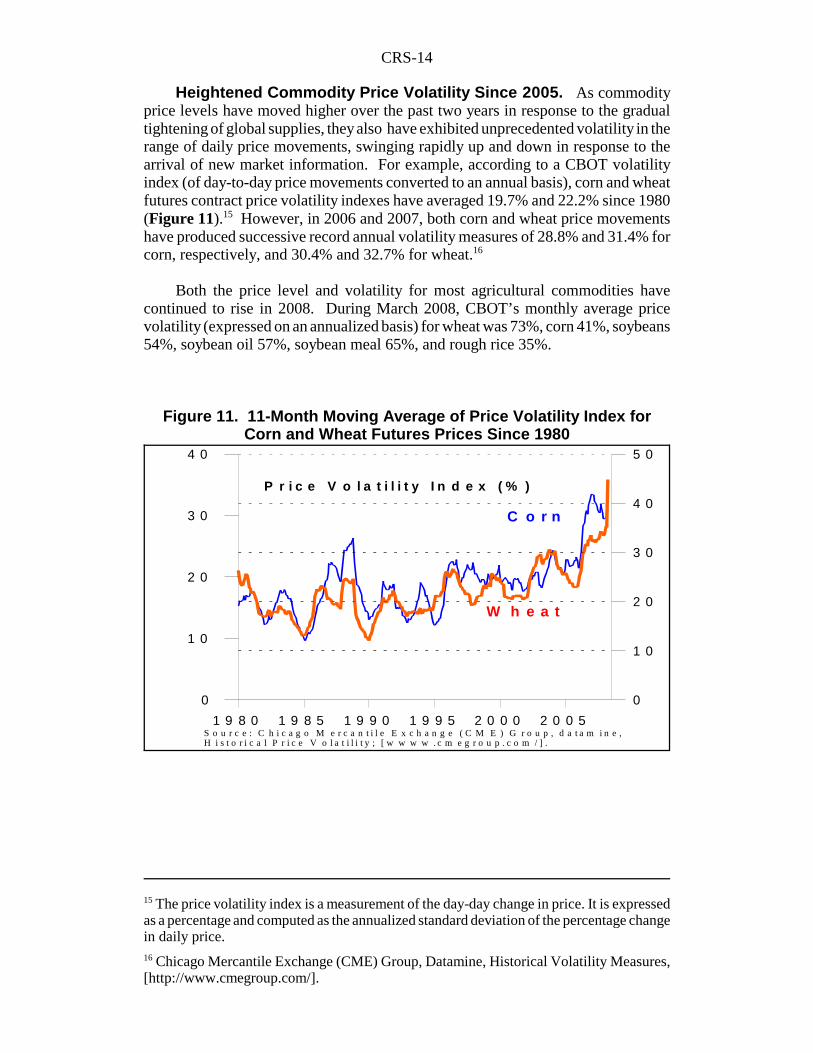
Figure 11. 11-Month Moving Average of Price Volatility Index forCorn and Wheat Futures Prices Since 1980
Heightened Commodity Price Volatility Since 2005. As commodityprice levels have moved higher over the past two years in response to the gradualtightening of global supplies, they also have exhibited unprecedented volatility in therange of daily price movements, swinging rapidly up and down in response to thearrival of new market information. For example, according to a CBOT volatilityindex (of day-to-day price movements converted to an annual basis), corn and wheatfutures contract price volatility indexes have averaged 19.7% and 22.2% since 1980(Figure 11).15 However, in 2006 and 2007, both corn and wheat price movementshave produced successive record annual volatility measures of 28.8% and 31.4% forcorn, respectively, and 30.4% and 32.7% for wheat.16
Both the price level and volatility for most agricultural commodities havecontinued to rise in 2008. During March 2008, CBOT’s monthly average pricevolatility (expressed on an annualized basis) for wheat was 73%, corn 41%, soybeans54%, soybean oil 57%, soybean meal 65%, and rough rice 35%.

CRS-15
U.S. Farm Prices Projected Record High for Several Crops
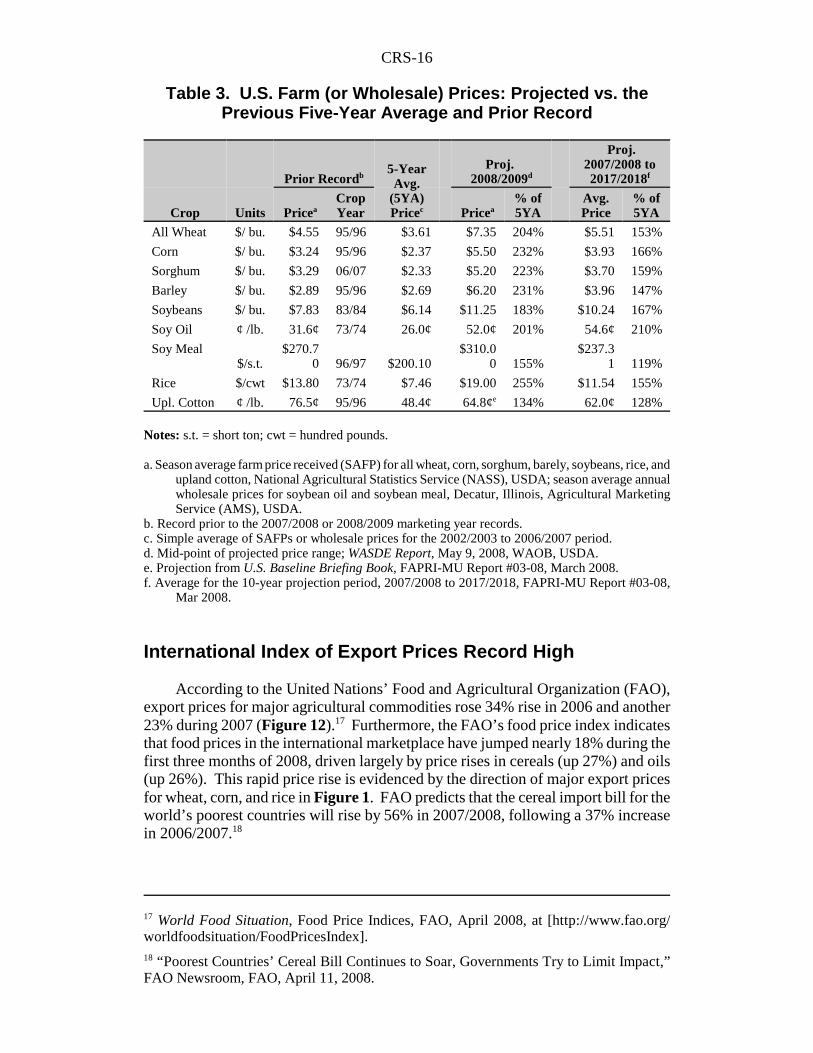
As a result of the commodity price increases of the past several months, USDAis projecting record high season-average farm prices for nearly all of the majorprogram crops — wheat, rice, corn, sorghum, barley, soybeans, and soybean products(soybean oil and soybean meal) — for the current 2007/2008 crop year, while farmprices for rice are expected to be the highest since 1973 (Table 3). Prices for minoroilseeds (e.g., sunflower and rapeseed), oats, and hay crops also are projected toapproach or surpass previous record highs. Furthermore, USDA expects therelatively tight U.S. and international market conditions to prevail through 2008 aswell and generate still higher farm prices in the 2008/2009 marketing year.
USDA’s farm price estimates are weighted by monthly marketings. Since alarge portion of each crop is marketed within two to three months of harvest, whenseasonal prices are generally at their lowest level, the season average farm price(SAFP) is weighted downward by a large volume of lower-priced early marketings.Also, USDA reports farm prices on a monthly basis, not daily like the majorcommodity futures exchanges. As a result, the monthly farm prices reported byUSDA do not exhibit the same degree of volatility as that of the futures pricesreported in the news media. For examples, see the discussion in the earlier sectionon futures contract prices and compare the record futures contract prices for themajor program crops reported in Table 2 with the farm prices reported in Table 3.
Although the establishment of record highs for grain and oilseed program cropsis noteworthy, the extent to which the 2008/2009 prices deviate from both theaverage prices of the preceding five-year period and the previous record SAFPs hasevoked concern and even alarm from consumer and hunger advocates. For example,the 2008/2009 corn SAFP mid-point of $5.50 per bushel is projected to be nearly132% above the previous five-year average farm price of $2.37 and about 70% abovethe previous record high $3.24 achieved in 1995/1996. Most grains and oilseeds areprojected at least 55% to 155% above the previous five-year average price. Forexample, rice is projected 155% above its five-year average. Even cotton, arelatively abundant commodity, is projected 34% above its previous five-yearaverage price.
Recent (March 2008) long-run commodity price projections from the Food andAgricultural Policy Research Institute (FAPRI) suggest that, when commoditymarkets return to equilibrium, the long-run average price for major program cropswill settle at levels that are 19% to 110% above the recent five-year average.
CRS-16
17 World Food Situation, Food Price Indices, FAO, April 2008, at [http://www.fao.org/worldfoodsituation/FoodPricesIndex].18 “Poorest Countries’ Cereal Bill Continues to Soar, Governments Try to Limit Impact,”FAO Newsroom, FAO, April 11, 2008.
Table 3. U.S. Farm (or Wholesale) Prices: Projected vs. thePrevious Five-Year Average and Prior Record
Crop Units
Prior Recordb5-YearAvg.
(5YA)Pricec
Proj. 2008/2009d
Proj.2007/2008 to2017/2018f
PriceaCropYear Pricea
% of5YA
Avg.Price
% of5YA
All Wheat $/ bu. $4.55 95/96 $3.61 $7.35 204% $5.51 153%
Corn $/ bu. $3.24 95/96 $2.37 $5.50 232% $3.93 166%
Sorghum $/ bu. $3.29 06/07 $2.33 $5.20 223% $3.70 159%
Barley $/ bu. $2.89 95/96 $2.69 $6.20 231% $3.96 147%
Soybeans $/ bu. $7.83 83/84 $6.14 $11.25 183% $10.24 167%
Soy Oil ¢ /lb. 31.6¢ 73/74 26.0¢ 52.0¢ 201% 54.6¢ 210%
Soy Meal$/s.t.
$270.70 96/97 $200.10
$310.00 155%
$237.31 119%
Rice $/cwt $13.80 73/74 $7.46 $19.00 255% $11.54 155%
Upl. Cotton ¢ /lb. 76.5¢ 95/96 48.4¢ 64.8¢e 134% 62.0¢ 128%
Notes: s.t. = short ton; cwt = hundred pounds.
a. Season average farm price received (SAFP) for all wheat, corn, sorghum, barely, soybeans, rice, andupland cotton, National Agricultural Statistics Service (NASS), USDA; season average annualwholesale prices for soybean oil and soybean meal, Decatur, Illinois, Agricultural MarketingService (AMS), USDA.
b. Record prior to the 2007/2008 or 2008/2009 marketing year records.c. Simple average of SAFPs or wholesale prices for the 2002/2003 to 2006/2007 period.d. Mid-point of projected price range; WASDE Report, May 9, 2008, WAOB, USDA. e. Projection from U.S. Baseline Briefing Book, FAPRI-MU Report #03-08, March 2008.f. Average for the 10-year projection period, 2007/2008 to 2017/2018, FAPRI-MU Report #03-08,
Mar 2008.
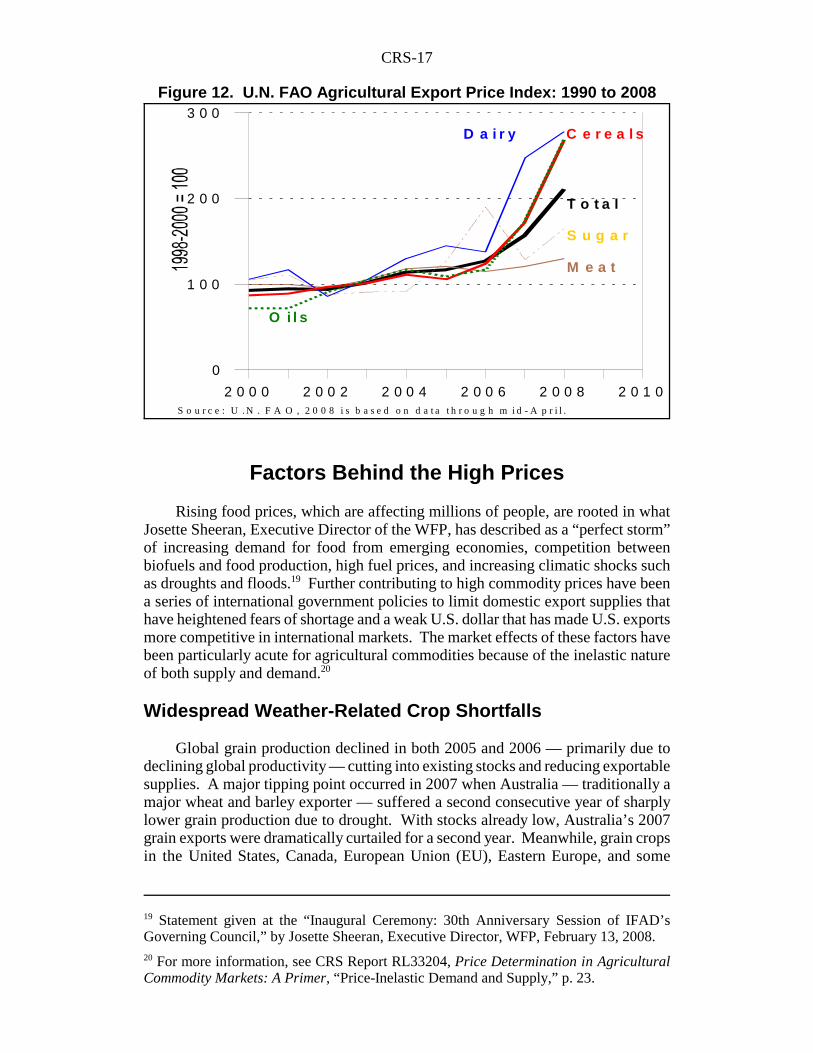
International Index of Export Prices Record High
According to the United Nations’ Food and Agricultural Organization (FAO),export prices for major agricultural commodities rose 34% rise in 2006 and another23% during 2007 (Figure 12).17 Furthermore, the FAO’s food price index indicatesthat food prices in the international marketplace have jumped nearly 18% during thefirst three months of 2008, driven largely by price rises in cereals (up 27%) and oils(up 26%). This rapid price rise is evidenced by the direction of major export pricesfor wheat, corn, and rice in Figure 1. FAO predicts that the cereal import bill for theworld’s poorest countries will rise by 56% in 2007/2008, following a 37% increasein 2006/2007.18
CRS-17
19 Statement given at the “Inaugural Ceremony: 30th Anniversary Session of IFAD’sGoverning Council,” by Josette Sheeran, Executive Director, WFP, February 13, 2008.20 For more information, see CRS Report RL33204, Price Determination in AgriculturalCommodity Markets: A Primer, “Price-Inelastic Demand and Supply,” p. 23.
2 0 0 0 2 0 0 2 2 0 0 4 2 0 0 6 2 0 0 8 2 0 1 0
0
1 0 0
2 0 0
3 0 0
S o u r c e : U . N . F A O , 2 0 0 8 i s b a s e d o n d a t a t h r o u g h m i d - A p r i l .
C e r e a l sD a i r y
T o t a l
M e a t
S u g a r
O i l s
Figure 12. U.N. FAO Agricultural Export Price Index: 1990 to 2008
Factors Behind the High Prices
Rising food prices, which are affecting millions of people, are rooted in whatJosette Sheeran, Executive Director of the WFP, has described as a “perfect storm”of increasing demand for food from emerging economies, competition betweenbiofuels and food production, high fuel prices, and increasing climatic shocks suchas droughts and floods.19 Further contributing to high commodity prices have beena series of international government policies to limit domestic export supplies thathave heightened fears of shortage and a weak U.S. dollar that has made U.S. exportsmore competitive in international markets. The market effects of these factors havebeen particularly acute for agricultural commodities because of the inelastic natureof both supply and demand.20
Widespread Weather-Related Crop Shortfalls
Global grain production declined in both 2005 and 2006 — primarily due todeclining global productivity — cutting into existing stocks and reducing exportablesupplies. A major tipping point occurred in 2007 when Australia — traditionally amajor wheat and barley exporter — suffered a second consecutive year of sharplylower grain production due to drought. With stocks already low, Australia’s 2007grain exports were dramatically curtailed for a second year. Meanwhile, grain cropsin the United States, Canada, European Union (EU), Eastern Europe, and some

CRS-18
21 For more information on GDP and population growth in the developing world, see USDAAgricultural Projections to 2017, OCE-2008-1, USDA, pp. 12-13.22 Rising Food Prices: What Should Be Done?, Joachim von Braun, International FoodPolicy Research Institute Policy Brief, April 2008.23 Ibid.24 For more information, see CRS Report RL31985, Weak Dollar, Strong Dollar: Causesand Consequences by Craig K. Elwell.
countries of the former Soviet Union were also reduced by weather conditions. Inthe EU, declining grain supplies forced livestock producers to import substantialvolumes of wheat and other feed grains for feed rations. As a result, the EU switchedfrom its traditional status as a major net exporter of grains into a net importer in2007. The cumulation of these events severely drew down global grain supplies(Table 1).
Strong Economic Growth in Developing Countries
A steadily increasing world population, boosted by robust growth in purchasingpower, especially in developing countries such as China and India, has contributedto a permanent increase in global demand for more and different kinds of food.21 Ashouseholds improve their incomes and food purchasing power, they shift theirdemand away from traditional staples and toward higher-value foods like meat anddairy products.22 This dietary shift is leading to increased demand for grains used tofeed livestock.
Declining Investment in Agricultural Productivity
Several years of under-investment in the agricultural sectors of many developingcountries have resulted in slowing or stagnant yield growth.23 This malaise hasresulted, in part, from a redirecting of international donor community funds awayform rural development and agricultural productivity. The result has beenpopulation-driven demand growth outpacing crop yields over several years anddrawing down global agricultural surplus stocks.
Weak U.S. Dollar Lowers Cost of U.S. Exports
When the U.S. dollar declines in value in international exchange marketsrelative to the currency of our export competitors (e.g., Canada, Australia, or the EU)or importing nations (e.g., Japan, Taiwan, etc.), it makes U.S. export productscheaper and, therefore, more competitive. Since January 2002, the U.S. dollar haslost over 44% of its value against the EU’s euro and the Australian dollar, and nearly37% against the Canadian dollar (Figure 13).24

CRS-19
25 Outlook for U.S. Agricultural Trade, AES-57, February 21, 2008, at [http://usda.mannlib.cornell.edu/usda/current/AES/AES-02-21-2008.pdf]. Bulk shipments include wheat, rice,feed grains, soybeans (and other oilseeds), cotton and linters, and tobacco.26 For more information, see CRS Report RL32712, Agriculture-Based Renewable EnergyProduction.
1 9 9 8 2 0 0 0 2 0 0 2 2 0 0 4 2 0 0 6 2 0 0 8
0 . 5
1
1 . 5
2
S o u r c e : M o n t h l y e x c h a n g e r a t e s , P a c i f i c a E x c h a n g e R a t e S e r v i c e .
C a n a d i a n $
A u s t r a l i a n $
E u r o
Figure 13. The U.S. Dollar Has Steadily Weakened Against the Euro,the Canadian Dollar, and the Australian Dollar Since 2001
A key result of the declining value of the U.S. dollar has been a dramatic surgein U.S. exports of agricultural products, particularly of bulk commodities. Total U.S.agricultural exports in FY2008 are estimated at a record $101 billion, includingrecord bulk shipments of $44.7 billion and 135.8 million tons.25 In terms of year-to-year export volumes, U.S. corn exports are projected up nearly 18% to a record 2.5billion bushels (63.5 million tons) in the 2007/2008 marketing year, wheat exportsare projected up 40%, sorghum exports 82%, and rice exports 23%. These recordshipments of grains and oilseeds have helped to draw down U.S. stocks and fuelhigher commodity prices.
Record exports in the face of historically high commodity prices seemssomewhat counterintuitive. However, the decline in the foreign exchange value ofthe U.S. dollar has been so dramatic that, in some cases, it has completely offset therise in commodity prices, thereby making U.S. grains and oilseed very attractive.
Government Biofuels Policy
Concerns over high oil prices, energy security and climate change haveprompted governments to take a more proactive stance towards encouraging theproduction and use of agriculture-based biofuels.26 Several countries have setstandards or targets for use of biofuels. The largest biofuels programs are in theUnited States, Brazil, and the EU. Brazil requires a minimum use of 20%-25% of

CRS-20
27 For more information, see CRS Report RL32712, Agriculture-Based Renewable Fuels,and CRS Report RL34265, Selected Issues Related to an Expansion of the Renewable FuelStandard (RFS).28 An exception to the tariff exists under the Caribbean Basin Initiative; see CRS ReportRS21930, Ethanol Imports and the Caribbean Basin Initiative.
sugar-cane-based ethanol (E20-E25) in its national gasoline supply, and hassubsidized the establishment of a national distribution network that includes pumpsfor 100% ethanol in addition to the E20-E25 blend. In addition, Brazil requires thatall diesel oil contain a 2% blend of biodiesel by 2008 rising to a 5% blend by 2013.The EU has established a goal of 5.75% of motor fuel use from biofuels by 2010,rising to 10% by 2020. The EU’s program is primarily focused on vegetable-oil-based biodiesel production. As a result of its biofuels policy, EU farm policyincentives have generally favored the expansion of rapeseed production at theexpense of wheat, barley, and other grain crops. Thailand, India, and China also haveestablished biofuel mandates that hinge on the expansion of agriculture-basedbiofuels. However, these three countries have at least temporarily suspended theirbiofuels programs in light of the current high commodity prices and global foodcrisis.
U.S. Biofuels Mandate. In the United States, the Energy Independence andSecurity Act of 2007 (EISA; P.L. 110-140) extended and substantially expanded theexisting Renewable Fuel Standards (RFS).27 The RFS is a usage requirementmandating that an increasing volume of biofuels be blended with conventional fuels.Under EISA, the RFS mandates the use of at least 9 billion gallons of biofuel in U.S.fuel supplies in 2009, but grows quickly to 20.5 billion gallons by 2015 and to 36billion gallons by 2022. The U.S. biofuels sector is also supported by a tax credit of$0.51 for every gallon of ethanol blended in the U.S. fuel supply ($1.00 per gallonof virgin-oil-based biodiesel), and an import tariff of $0.54 per gallon of importedethanol.28 In addition, several federally-subsidized grant and loan programs assistbiofuels research and infrastructure development.
Current U.S. biofuel production is almost entirely corn-based ethanol — nearly6.5 billion gallons of corn-ethanol were produced in 2007, compared with anestimated 450 million gallons of biodiesel. The RFS for corn-based ethanol iscapped at 15 billion gallons in 2015. However, additional mandates for biodiesel andfor cellulosic and other non-corn ethanol continue to expand to a total RFS of 36billion gallons by 2022. This mandate places tremendous pressures on U.S. andglobal crop production systems. This crop year (2007/2008), USDA estimates thatabout 24% of the U.S. corn crop will be used to produce ethanol; however, this shareis projected to grow to 33% next year. This rapid, “permanent” increase in corndemand has directly sparked substantially higher corn prices to bid available suppliesaway from other uses — primarily livestock feed. Higher corn prices, in turn, haveforced soybean, wheat, and other grain prices higher in a bidding war for availablecrop land.

CRS-21
29 “Rising Food Prices: Policy Options and World Bank Response,” World Bank, undatedmimeo, at [http://www.worldbank.org/].30 “The Energy Independence and Security Act of 2007: Preliminary Evaluation of SelectedProvisions,” FAPRI-MU #01-08, January 2008.31 “The Outlook for Corn Prices in the 2008 Marketing Year,” Iowa Ag Review, Spring 2008,Vol. 14, No. 2, pp. 4-5; and “Ethanol, Mandates, and Drought: Insights from a StochasticEquilibrium Model of the U.S. Corn Market,” by Lihong Lu McPhail and Bruce A.Babcock, Working Paper 08-WP 464, CARD, Iowa State University, March 2008.
This bidding war is being played out in global markets as traditional corn userssearch for alternative feed grain supplies. According to the World Bank, increasedbiofuel production has been one of the principal causes of the dramatic rise in foodprices — almost all of the increase in global corn production from 2004 to 2007 (theperiod when grain prices rose sharply) went for biofuels production in the UnitedStates.29
Economic Analysis of U.S. Biofuels Mandate. A recent study by theFood and Agricultural Policy Research Institute (FAPRI) attempts to measure thepure and joint price effects of the U.S. biofuels RFS and the tax credits (Table 4).30
FAPRI’s study suggests that implementation of EISA’s RFS (in the absence of thetax credit) will raise corn price by about 19% once the new long-run equilibrium hasbeen established. The FAPRI study also estimates that the ethanol tax credit (TC) of$0.51 per gallon (in the absence of the RFS) supports corn prices by a slightly smaller11%. Because of interactions between the two subsidies, it is estimated that jointimplementation of both the RFS and TC supports corn prices by about 20%.
Strong effects were also observed by FAPRI for other commodities, particularlysoybean oil whose wholesale price is projected 73% higher under the joint RFS-TCscenario (Table 4). A substantial portion of corn price effects are likely transmittedto the soybean market via competition for land, primarily in the Corn Belt wheresoybeans and corn are both widely grown. The biofuels price effects would alsotransmit to regions outside of the Corn Belt (where wheat, cotton, and other majorgrain and oilseeds are produced) as farmers reconfigure their planting decisions andopt for greater soybean and corn production to maximize returns.
A similar study by the Center for Agricultural Research and Development(CARD) found that, jointly, the RFS and TC supported the price of corn by a slightlysmaller 16%.31 Both of these studies found the results to be highly dependent on theprice of petroleum (or gasoline). Higher petroleum prices substitute for governmentincentives and diminish the relative impact of such incentives on corn prices. Neitherstudy evaluated the effect of the U.S. import tariff of $0.54 per gallon on importedethanol from Brazil, although the CARD study pointed out that the corn priceimpacts would be greater if the tariff on Brazilian ethanol were eliminated. Nor dideither study include the effects of the various grants and subsidized loans that havebeen made available to the U.S. biofuels sector for research and infrastructuredevelopment.

CRS-22
32 “Statement before the U.S. Senate Committee on Homeland Security and GovernmentAffairs,” Bruce Babcock, Director of CARD, Hearing on Fuel Subsidies and Impact on FoodPrices, May 7, 2008.
Table 4. FAPRI Projections of U.S. Biofuel Policy Impacts
Scenario: Projections and % Changea
UnitsNo RFSNo TC
No RFSTC
RFSNo TC
RFSTC
Production
Ethanol Bil. gal. 8.11 11.7 44% 14.1 74% 14.5 79%
Biodiesel Bil. gal. 0.23 0.51 122% 0.96 317% 0.96 317%
Price
Corn $/bu. 2.81 3.11 11% 3.33 19% 3.37 20%
Soybeans $/bu. 6.15 6.64 8% 7.21 17% 7.25 18%
Wheat $/bu. 4.03 4.19 4% 4.31 7% 4.33 7%
Soy Meal $/s.t. 179.99 166.23 -8% 138.29 -23% 137.98 -23%
Soy Oil $/lb. 26.89 34.34 28% 46.29 72% 46.64 73%
Source: “The Energy Independence and Security Act of 2007: Preliminary Evaluation of SelectedProvisions,” FAPRI-MU #01-08, January 2008.
Notes: The numbers presented in this table are the averages of the scenario projections for the 2011to 2016 period, thus, they are an estimate of the long-run equilibrium values. The “No RFS; TCextended” scenario represents FAPRI’s December 2007 baseline projections.
a. RFS = Renewable Fuel Standard; TC = Tax Credit.
CARD Director Bruce Babcock suggests that there is an important differencebetween the short-run and long-run impacts of federal biofuels policy.32 In the short-run, federal incentives encourage the construction of new ethanol plants. Once built,U.S. ethanol plants will not simply shut-down if the federal incentives disappear.Instead, they will continue to produce ethanol as long as they are able to cover theiroperating expenses. Thus, a reversal of U.S. biofuels policy will not necessarilyresult in a reversal of the ethanol sector’s impact on corn prices and commoditymarkets. In the long run, Babcock says that the impacts of federal biofuels policydepend crucially on the price of crude oil and the number of ethanol plants that getconstructed under current incentives. This is because agricultural commodity pricesand gasoline prices are now inextricably linked through existing ethanol plants andthe knowledge of how to efficiently convert corn to transportation fuel.
Foreign Government Policies to Limit Exports
Foreign government policy responses to the high commodity prices have, for themost part, had the perverse effect of reinforcing higher prices thereby contributingto, rather than alleviating, the current market supply-and-demand conditions.
CRS-23
33 Nathanial Gronewold, “Food Prices Hampering U.N. Agency’s Ability to Head Off ‘NewFace of Hunger,’” E&E News PM, April 24, 2008, at [http://www.eenews.net].34 “Japan, China, and Thailand can Solve the Rice Crisis — But U.S. Leadership is Needed,”by Tom Slayton and C. Peter Timmer, CGD Notes, Center for Global Development, May2008; [http://www.cgd.org].35 “Wheat Jumps on Supply Concerns,” Stevenson Jacobs, Washingtonpost.com, February25, 2008.36 “Argentina Suspends Wheat Exports Indefinitely,” Commodity Online, April 22, 2008.37 “Farmers’ Strike in Argentina Is Suspended for Negotiations,” by Vinod Sreeharsha andAlexei Barrionuevo, New York Times, April 3, 2008.
Since late 2007, several traditional wheat and rice exporting countries — in aneffort to ensure domestic food availability and temper rising internal inflation —have instituted policies designed to limit exports of domestic supplies. Thesepolicies, albeit implemented to dampen internal prices for domestic consumers, havehad exactly the opposite effect on international market prices, pushing them higherthan supply and demand conditions would otherwise dictate by limiting access toavailable supplies by international buyers. On April 24, 2008, the WFP claimed thatmore than 40 food-exporting countries had placed some kind of restriction or outrightban on many crop exports in an attempt to stabilize prices within their borders.33
Export bans have had a particularly acute effect in the thinly traded internationalrice market. Traditionally, less than 7% of annual global rice production enters worldmarkets. As a result, removal of even modest volumes of exportable supplies canhave profound effects. Since late 2007, four traditional exporters including Vietnam,India, China, and Egypt, (the world’s second-, fourth-, sixth-, and eighth-leading riceexporters last year), along with minor exporter Cambodia, have all set in placepolicies to limit exports. The combined effect of these bans is to remove over a thirdof available export supplies from world markets and to drive international rice pricessharply higher. The removal of these supplies was followed by panic buying by thePhilippines as it aggressively sought to acquire a share of remaining exportablesupplies.34
Similar action in the international wheat market includes both Ukraine andArgentina which, in the spring of 2007, initiated wheat export restrictions in effortsto control food price inflation. Pakistan placed taxes on wheat exports. By lateFebruary 2008, Kazakhstan officials set in place policies to slow their country’swheat export pace (via higher custom duties), also due to declining supplies.35 Bymid-April, Kazakhstan had converted its export slowdown into an outright ban.
Argentina’s government policy of banning wheat and beef exports, slowing cornexports through procedural barriers at customs, and heavily taxing exports ofsoybeans36 (both to limit exports and to raise government revenues) is particularlynoteworthy for three reasons. First, the export controls resulted in a nationwidefarmers’ strike whereby producers refused to bring to market any agriculturalproducts. Second, although the strike (after lasting three weeks) was temporarilysuspended for 30 days starting on April 3, 2008,37 in an agreement between farmersand government that essentially left the export controls in place, the uncertainty

CRS-24
38 “Argentine Soybean Output May Slip; Protests May Pause,” by Heather Walsh and ElianaRaszewski, Bloomberg News, March 19, 2008.39 Crop Prospects and Food Situation, No. 2, April 2008, FAO, U.N., at [http://www.fao.org/worldfoodsituation].40 Grain Transportation Report, Agricultural Marketing Service, USDA, April 17, 2008.41 Nathanial Gronewold, “Food Prices Hampering U.N. Agency’s Ability to Head Off ‘NewFace of Hunger’,” E&E News PM, April 24, 2008, at [http://www.eenews.net].
surrounding Argentina as a reliable export supplier resulted in a substantial amountof purchase contracts being diverted to U.S. suppliers. Thus, already huge U.S.export numbers were further bolstered by the shift in demand from Argentinean toU.S. commodities. Third, Argentina’s strict export controls have had a major impacton that country’s agricultural prospects, at least in the short run, as most marketanalysts are now predicting a significant decline in Argentina’s planted area forwheat (and possibly corn and soybeans) in 2008.38
Alternately, on the demand side, several countries that either depend on importsto meet an important share of their domestic food needs, or have large groups ofnutritionally vulnerable people, began to remove long-standing barriers to imports.39
For example, in late March 2008, India authorized duty-free imports of rice. Severalother Asian, African, Latin American, and Caribbean nations have also lowered oreliminated tariffs on a range of imported foodstuffs. In addition, many countriesfroze internal commodity prices at below market levels and issued temporary incomesubsidies to help consumers meet their food needs. While these consumer-orientedactions may be laudable, they have had the effect of increasing international demandat the same time that international supplies are being restricted.
High Energy Costs
Petroleum prices have doubled since January 2007 when the monthly spotmarket price for West Texas Intermediate (WTI) at Cushing, Oklahoma, averaged$53.70 per barrel (Figure 14). By late May, 2008, the price for WTI exceeded arecord $130 per barrel. Since gasoline, diesel fuel, and other energy products areeither directly or indirectly derived from petroleum, high petroleum prices haveincreased operating costs all along the marketing chain for agricultural inputs andoutputs, thus inflating prices everywhere. Energy-driven higher marketing costsaccumulate at the retail outlet where they translate directly into higher consumer foodprices.
High petroleum prices and strong demand for ocean shipping drove ocean ratesfor shipping bulk commodities to record levels in 2007, nearly doubling the previousrecord set in 2004, and adding to the imported cost of internationally tradedproducts.40 WFP executive director Sheeran has suggested that high oil prices maybe the single most important factor in driving up food costs because, in addition toits effect on raising energy costs throughout the marketing chain, it has boosted thepopularity of biofuels.41

CRS-25
42 “Open Market Operations,” Federal Open Market Committee, U.S. Federal ReserveBoard, at [http://www.federalreserve.gov/fomc/fundsrate.htm]; see also CRS Report 98-856,Federal Reserve Interest Rate Changes: 2000-2008, by Marc Labonte and Gail E. Makinen.
1 9 7 5 1 9 8 5 1 9 9 5 2 0 0 5
0
1
2
3
4
0
3 0
6 0
9 0
1 2 0
S o u r c e : G a s o l i n e , U n l e a d e d R e g u l a r , U . S . C i t y A v e r a g e ; D i e s e l : , N o . 2 ,R e t a i l S a l e s ; C r u d e O i l , W e s t T e x a s I n t e r m e d i a t e , C u s h i n g , O K ; E n e r g yI n f o r m a t i o n A g e n c y , D e p t o f E n e r g y .
G a s o l i n e
D i e s e l
C r u d e O i l
Figure 14. Energy Costs: Annual Average Prices Since 1975 forGasoline, Diesel, and Crude Oil
Macroeconomic Linkages Reinforce Price Rises
Several economists have stated that U.S. fiscal policies intended to stave offeconomic recession have contributed indirectly to the U.S. and global “food crises”by resulting in a weaker U.S. dollar. Between September 2007 and April 2008, theU.S. Federal Reserve’s Open Market Committee cut a key interest rate (the federalfunds rate) by 3.25 percentage points to 2%, primarily due the escalating financialcrisis related to the rise in defaults on subprime mortgages and the overall weak U.S.economy.42 Lower U.S. interest rates contribute to a decline in the value of the dollarrelative to other currencies which, in turn, contributes to higher U.S. commodityexports and higher oil prices.
Since oil is priced in U.S. dollars in international markets, a weakening dollaris generally perceived as contributing to higher oil prices via two mechanisms. First,oil exporters must raise the dollar price per barrel to retain the same level of purchasepower against appreciating non-U.S. currencies. Second, oil importers — whosecurrencies have generally strengthened against the dollar — drive the dollar price ofoil higher when they bid the same price per barrel in their own currency. Since theUnited States is the world’s largest oil importer, surging oil import costs pressure theU.S. trade deficit and ripple through the U.S. economy further slowing economicactivity. The weakening U.S. economy has impacted capital and stock market prices.As a result, the bullish commodity markets have become an attractive market formutual funds and investors seeking more profitable investment opportunities. This

CRS-26
43 “Some Blame Speculators for Worsening Global Food Crisis,” RB, Greenwire, April 24,2008.44 Nathanial Gronewold, “Commodity ‘Feedback Loop’ Fueling Price Surge,” Greenwire,March 11, 2008, at [http://www.eenews.net/Greenwire/].45 For more information, see CRS Report RS21970, The U.S. Farm Economy, by RandySchnepf.46 Ibid. Note, these farm income and government outlay projections were made in earlyFebruary 2008, and are likely to be revised — upward for farm income and downward forgovernment outlays — due to significant price rises since then. The next USDA farmincome update is scheduled for August 28, 2008.47 For more information on commodity programs, see CRS Report RL33271, FarmCommodity Programs: Direct Payments, Counter-Cyclical Payments, and Marketing Loans.
“speculative” investment money — valued in the hundreds of billions of dollars —has been accused of reinforcing rising prices.43 Some analysts suggest thatagricultural commodity markets are now playing a role traditionally reserved for goldand other precious metals — a safe haven for investors.44
Implications of High Commodity Prices
U.S. Farm Income Record High
The past six years are the six highest farm income years on record, but the pasttwo years in particular have seen significant gains from previous records.45
According to USDA’s Economic Research Service (ERS), national net farm cashincome — a key indicator of U.S. farm well-being — is expected to rise to a record$96.6 billion in 2008, over 10% above the previous year’s record ($87.6 billion) and26% above the four-year average of $76.5 billion for 2003 through 2006, all on thestrength of higher commodity prices. Farm revenue gains are expected to easilyoutpace rising input expenses (up 34% versus 29%, respectively, from the 2000-2006period average), leaving many farm communities flush with cash.
Lower Government Farm Program Outlays
In February, USDA forecast government direct payments at $13.4 billion in2008, up slightly from $12.0 billion in 2007 but well below the four-year (2003-2006) average of $17.4 billion.46 Government direct payments peaked at $24.4billion in 2005. Higher projected market prices are expected to limit payments underthe two major price-triggered programs — counter-cyclical payments (CCP), andmarketing loan benefits (loan deficiency payments, marketing loan gains, andcertificate exchange gains).47 Fixed direct payments, whose payment rates are fixedin legislation and are not affected by the level of program crop production or prices,are estimated up slightly at $5.3 billion.
USDA’s farm income and government program outlay forecasts, which werereleased in February 2008, were based on prices that persisted in late 2007.

CRS-27
48 “Selected Direct Government Payments,” U.S. Baseline Briefing Book, FAPRI-MU Report#03-08, FAPRI, March 2008, p. 59.49 Gary Schnitkey, “Crop Insurance Decisions: Why Not the Same as Last Year?” IllinoisAgriNews, Dept of Agriculture and Consumer Economics, University of Illinois, February2008.50 The base price for corn is equal to the average price during the first half of February, ofthe harvest-time (i.e., December) futures contract at the Chicago Board of Trade.51 For more information on crop insurance programs, see CRS Report RL34207, CropInsurance and Disaster Assistance: 2007 Farm Bill Issues, by Ralph Chite.
However, commodity prices have increased unexpectedly since then. In March,FAPRI released more current estimates of government direct payments for 2008/2009at $5.8 billion, down slightly from a revised forecast of $6.0 billion for 2007/2008.48
Under FAPRI’s projections, price contingent outlays on CCP and LDP are about $0.5billion, while fixed direct payments of $5.2 billion comprise the majority ofgovernment subsidy expenditures.
Crop Insurance Premiums Costs Surge in 2008
Commodity prices are a key ingredient in the formula for calculating cropinsurance premiums.49 Higher, more volatile prices lead to higher insurancepremiums, but they also provide the opportunity for producers to lock in unusuallyhigh per-acre returns. Both volatility and absolute prices levels are substantiallyhigher in 2008 than in 2007 for all major program crops.
For example, the base price for corn was $4.06 per bushel in 2007 comparedwith $5.25 in 2008 — an increase of $1.19 or 29%.50 The higher price level plus thisyear’s higher volatility (Figure 12) translate into higher crop insurance premiums.Premiums vary by crop and location, as well as the farm’s production history.However, a higher base price also means that the per acre returns being insured aresubstantially higher in 2008, especially since most crop insurance policies sold arerevenue products that allow farmers to insure a target level of revenue rather than justyields.51 Many farmers on traditionally high-yielding farms in the Corn Belt will beable to guarantee corn revenues in the $500 per acre range for a 75% coverage level.Guarantees over $600 are possible with higher coverage levels. Similar highinsurance premiums and revenue guarantees will be available for most majorprogram crops in most major producing areas.
Unlike government commodity program outlays, which decline when pricesrise, government support for federal crop insurance rises with higher prices. This isbecause the federal government subsidizes the premiums by an average of 50% to60% of the total premium, depending on the coverage level. In addition, thegovernment reimburses the insurance companies for a share of their administrativeand operating expenses incurred in delivering the crop insurance policies. Thereimbursement share of administrative and operating expenses is based on apercentage of total premiums; thus, it also rises with rising crop prices. FAPRIprojects net federal outlays (including premium subsidies, excess indemnity

CRS-28
52 “Crop Insurance,” U.S. Baseline Briefing Book, FAPRI-MU Report #03-08, FAPRI,March 2008, p. 59.53 “Farm Income and Costs: 2008 Farm Sector Income Forecast” briefing room, ERS, USDAupdated March 7, 2008; at [http://www.ers.usda.gov/Briefing/FarmIncome/]. 54 World Agricultural Supply and Demand Estimates, World Agricultural Outlook Board,USDA, May 9, 2008.55 Steven Mueson, “A Costly Link Between Food and Fuel,” Washington Post, April 30,2008.56 Letter to EPA Administrator Stephen Johnson, by Texas Governor Perry, April 25, 2008,at [http://www.governor.state.tx.us/].
payments, and administrative and delivery costs) at $4.7 billion in 2008 and at $7.1billion in 2009.52 These net outlays compare with an estimated $3.6 billion in 2007.
Sharply Higher Feed Costs
In February, ERS projected U.S. livestock feed costs for 2008 at a record $45billion, up nearly $7 billion or over 18% from the previous year’s record.53
Meanwhile, USDA projects that wholesale prices for nearly all livestock productcategories (with the exception of poultry and eggs) will decline in 2008.54 Risingfeed costs (primarily grains and protein meals) have cut into profit margins of alllivestock sectors (beef, dairy, pork, and poultry) and, in the case of hogs haverendered many operations unprofitable. For example, on April 28, 2008, Tyson Food — a major producer, distributor, and marketer of chicken, beef, and pork products— reported its first loss in six quarters and said that its corn and soybean costswould increase by $600 million in 2008.55 Texas Governor Rick Perry — whosestate is the U.S. leader in beef production and ranks in the top 10 for production ofpoultry, eggs, and dairy — has stated that rising corn prices have been particularlyharmful to Texas livestock producers. According to Governor Perry, every one-centrise in corn prices costs his state’s livestock sector over $6 million.56
The U.S. livestock sector will have to work through many issues related to thechanging nature of feed supplies as feedstock demand from biofuels productionlowers grain supplies and replaces them in part with higher protein supplies. Feedsupply logistics and feed ration composition are likely to remain unsettled for severalyears if the biofuels industry continues to expand.
Futures Market Dilemma
Because of their transparency and their traditionally strong relationship withcash markets, futures contract prices are often the primary basis for pricedetermination in many wholesale and cash markets, as well as for managing the riskassociated with the ownership (current or anticipated) of a large volume of anagricultural commodity that is actively traded on a futures exchange. However, therapid, volatile escalation in agricultural futures prices that has evolved since 2005appears to be diminishing the effectiveness of the futures market as a device for bothprice discovery and risk management. The financial demands associated with routinehedging operations (primarily in the form of increased margin requirements) have

CRS-29
57 For more information on farm risk management strategies, see “Risk ManagementStrategies” at the ERS Farm Risk Management Briefing Room, at [http://www.ers.usda.gov/Briefing/RiskManagement/Strategies.htm]. 58 “Overview of Agricultural Futures Markets For Congressional Staff ,” by John Fenton,Deputy Director for Market Surveillance, Div. of Market Oversight, CFTC, April 2, 2008.59 For example, see “The Performance of Chicago Board of Trade Corn, Soybean, andWheat Futures Contracts After Recent Changes in Speculative Limits,” by Scott H. Irwin,Philip Garcia, and Darrel L. Good, Dept. of Ag and Consumer Economics, Univ. of ILL,Urbana-Champaign, IL, May 2007, at [http://www.farmdoc.uiuc.edu/irwin/research/CBOTFuturesPerformance.pdf].
risen in tandem with commodity prices, thereby placing severe strains on marketparticipants. In addition, increasing evidence of lack of convergence between cashand futures contract prices for some commodities in some markets (observedprimarily for corn, soybeans, and wheat contracts at the CBOT) is increasing the riskof futures-price-based forward contracts for the grain buyers that offer them.
These developments are of particular concern to traditional commercial interests — such as grain and oilseed elevators, food processors, grain merchandisers, andother participants in the marketing chain for agricultural products — who are likelyto see their costs of operations rise with any decline in the efficiency of the futuresmarket. Agricultural producers are equally concerned because, as grain and oilseedbuyers refrain from offering forward contracts, producers are increasingly unable totake advantage of the current high prices. Forward contracting has traditionally beenone of the primary risk management strategies employed by U.S. producers.57 It isnot clear to what extent, if any, high commodity prices have had on the perceivedlack of convergence.
The Commodity Futures Trading Commission (CFTC), the government agencyresponsible for oversight and regulation of U.S. futures exchanges, has said that anexamination of futures trading data has yet to show any visible evidence that hedgingoperations are declining as a result of the rising financial obligations associated withhedging.58 In addition, economists have studied the emerging lack of convergencebetween cash and futures prices and have yet to identify any significant causalfactor.59 Despite any current lack of evidence, some agricultural interests affected bythese issues have accused the growing pool of speculative money that has beeninvested in agricultural futures markets in recent years of artificially increasing pricesand their volatility, and sharply raising the costs of standard hedging operations. Asa result, these parties have called for greater federal regulation and monitoring overspeculative participation in futures markets, as well as for more stringent tradinglimits on speculative funds. As a general rule, this type of speculative investment infutures markets is considered to add necessary liquidity to commodity markets.
Several other issues related to the efficient functioning of futures markets thathave emerged in recent years — for example, electronic trading and the standardpractice of raising limits on the daily movement of contract prices when prices settleat their limits — have been accused (rightly or wrongly) of aggravating the dilemmasurrounding the rising cost and declining viability of routine hedging operations inagricultural futures markets. On April 22, 2008, the CFTC held a special public

CRS-30
60 For more information, visit the CFTC website at [http://www.cftc.gov].61 “Crops Winning out over Conservation for Some Landowners,” James MacPherson,Associated Press, WashingtonPost.com, April 30, 2008.62 Acreage, National Agricultural Statistics Service (NASS), USDA, June 29, 2007. Majorprogram crops include corn, sorghum, oats, barley, winter wheat, rye, durum wheat, otherspring wheat, rice, soybeans, peanuts, sunflower, cotton, dry edible beans, potatoes,sugarbeets, canola, proso millet, hay, tobacco, and sugarcane.
“Round Table” to publicly discuss the issues confronting commodity futuresexchanges and to hear from market participants.60 While no policy positions wererecommended or adopted from the session, the Round Table represents an awarenessof the importance of the efficient functioning of agricultural futures markets to theU.S. agricultural sector and a willingness to heighten monitoring by the CFTC ofthese emerging issues.
Expanded, More Intensive Agricultural Production
Since most of the increase in demand is considered permanent, commodityprices will likely return to lower levels only through an expansion in aggregatesupply (from either domestic or foreign sources) that outpaces demand growth. This,in turn, may be accomplished by increases in either yields or cultivated area. Thestrong market price signals received by the world’s farmers during the past sixmonths are expected to engender a response in both planted area and yield per unitof planted area in 2008.
Agricultural Productivity. Yield increases generally accumulate slowly overtime via more intensive use of fertilizers, pesticides, improved seeds, and adoptionof better farming practices (which themselves are generally the product ofinvestments in research, extension, and infrastructure). The availability and cost offertilizers and chemicals can be a limiting factor on short-term yield gains.Furthermore, adoption of more intensive cultivation practices may contribute topotentially harmful environmental consequences such as possible water qualitydegradation from fertilizer and chemical runoff, and increased soil erosion.
Expanded Cropped Area. Area increases for a given crop can occur morequickly than yield increases by shifting land use among different crops, by alteringrotational tillage-fallow cultivation practices, or by bringing marginal, less-productive soils into cultivation. Land-use shifts imply winners and losers amongcrops, while altering rotational patterns and farming marginal lands all implypotentially harmful environmental consequences such as reduced wildlife habitat,lower soil fertility, increased erosion, possible water quality degradation fromnutrient and sediment loads in rural waterways, and lost carbon sequestration. Mostanalysts agree that the current high commodity prices are likely to entice somemarginal land back into production in 2008.61
In 2007, about 321 million acres were planted to the principal crops in theUnited States, of which 315 million acres were for the major program crops.62 Inaddition, 62 million acres of hay were harvested in 2007. In 2008, USDA estimates

CRS-31
63 Prospective Plantings, NASS, USDA, March 30, 2008.64 For more information on the CRP, see CRS Report RS21613, Conservation ReserveProgram: Status and Current Issues, by Tadlock Cowan.65 “USDA Announces CRP Permitted Use for Livestock Feed Needs,” USDA Press ReleaseNo. 0137.08, May 27, 3008.66 “Options for the Conservation Reserve Program,” by Bruce A. Babcock and Chad Hart,Iowa Ag Review, Spring 2008, Vol. 14, No. 2, pp. 6-7.
that about 4 million additional acres will be planted to principal crops (up 1.2%),while program crop area will expand by 6.2 million acres (up 2%).63 Thus, more thana 2-million-acre shift from minor crops to program crops is anticipated. In addition,nearly 1 million acres is expected to shift from hay to program crop area.
Converting Conservation Acres to Production
In the United States, the Conservation Reserve Program (CRP) represents themost visible bank of potential crop land available for re-entry into agriculturalproduction.64 The CRP provides payments to farmers to take highly erodible orenvironmentally sensitive cropland out of production for ten years or more toconserve soil and water resources. In February 2008, national enrollment in the CRPwas 34.6 million acres. Each year, a portion of enrolled CRP acres is eligible forrenewal or removal depending on the owner’s preferences which, in turn, are likelyinfluenced by market conditions. Farmers also have the option of paying a penaltyfor early withdrawal, but the penalty (which includes full repayment of all benefitsreceived) is generally prohibitive except in the case of recently enrolled land whichhas yet to accumulate many benefits. In March 2007, then-Secretary of AgricultureMike Johanns announced that there would be no penalty-free release of acreage fromthe CRP in 2007. USDA estimates that, in 2007, about 130,000 acres of CRP thatwere under contract were withdrawn early and were subject to penalty. SecretarySchafer has reiterated the no-penalty-free-release-of-CRP position for FY2008, buthas said that USDA will make a decision concerning FY2009 in August orSeptember 2008. However, as a partial compromise response to high feed prices,USDA announced on May 27, 2008, that more than 24 million acres of land enrolledin CRP will be eligible for use in 2008 as hay or forage after the primary nestingseason ends for grass-nesting birds.65
CRP is perceived as providing multiple environmental services — for example,critical wildlife habitat, wind and soil erosion control, wetlands protection, forestryrestoration, carbon sequestration, and water quality gains via filter strips and bufferacreage. As a result, the public interest in seeing lower crop prices via expandedcropland must be weighed against the public interest in maintaining the substantialenvironmental benefits of land in CRP.66
Between September 2007 and February 2008, 2.1 million acres opted out of theCRP as their contracts expired. Another 27.8 million acres under CRP contracts willexpire by 2010. Contracts for approximately 23 million (83%) of these acres havebeen renewed or extended. High commodity prices, however, may discourage futurere-enrollments and contract extensions. Environmental and wildlife organizations
CRS-32
67 Ibid.68 For example, see the AAGC mission statement and its letter of policy recommendationsfor USDA at [http://www.cmcmarkets.org/files/18_mission_&_prin.pdf] and [http://www.nopa.org/content/newsroom/2005/aug/081205_lettertochuckconnor_CRP.pdf].69 “Options for the Conservation Reserve Program,” by Bruce A. Babcock and Chad Hart,Iowa Ag Review, Spring 2008, Vol. 14, No. 2, pp. 6-7.70 Changing Structure of Global Food Consumption and Trade, Anita Regmi, Editor, WRS-01-1, ERS, USDA, May 2001.
are major advocates for maintenance and/or expansion of current CRP levels.Livestock groups, the milling and baking industry, and other food processors favorreducing or eliminating early-out penalties for CRP to maximize the amount of landthat is cropped.67 The Alliance for Agriculture Growth and Competitiveness(AAGC) — a group representing the beef, poultry, pork, and grain and feedindustries — has been lobbying USDA since 2005 to allow landowners to pull outof CRP contracts without penalty.68 According to the Center for AgriculturalResearch and Development (CARD), if CRP policy is unchanged, than as much as2 million acres of CRP land per year will be brought back into crop production overthe next 10 years.
CRP Policy Options. USDA’s March Prospective Plantings report estimatesabout a 2% increase in program crop planted acreage in 2008 in response to the highcommodity prices. Given that USDA’s projected year-to-year farm price increasesfor 2007/2008 range from 20% to 60% for the major program crops, economists atCARD suggest that such a low area response, if realized, implies that U.S. farmers’ability to respond to high commodity prices is constrained by a lack of viablecropland.69 As a result of this land constraint, CARD suggest that USDA consider“re-optimizing” CRP through a combination of penalty elimination and aggressiverebidding of its entire CRP holdings. By eliminating penalties on CRP contracts thatexpire in the next three years, more productive land could return to productionearlier, while the freed up CRP payment funds could be used to offer furtherprotection to the more environmentally sensitive land that offers the greatestenvironmental benefits. Similarly, CARD suggests that USDA, by rebidding itsentire CRP land portfolio, could ensure that the most vulnerable land is retainedwhile allowing less vulnerable land to return to production.
Rising Food Price Inflation Impacts Consumer Budgets
The rise in agricultural prices, combined with high energy costs, havecontributed to higher food inflation in the United States and around the world. Ingeneral, higher food price inflation impacts consumers’ dietary choices as relativeprices vary across foods that compete for food expenditure dollars.70 The overallimpact to consumers from higher food prices depends on the proportion of incomethat is spent on food: households that spend a much greater proportion of theirincome on food have less flexibility to adjust expenditures in other budget areas toaccommodate increasing food costs.

CRS-33
71 “Table 97 — Expenditures on Food, by Selected Countries, 2002,” Briefing Room: FoodCPI, Prices and Expenditures, ERS, USDA, at [http://www.ers.usda.gov/Briefing/CPIFoodAndExpenditures/]. 72 “CPI for Food Forecasts,” Briefing Room: Food CPI, Prices, and Expenditures, ERS,USDA, May 19, 2008. See also CRS Report RS22859, Food Price Inflation: What are theIssues? by Tom Capehart and Joe Richardson.73 “Table 1. Consumer Price Index for All Urban Consumers (CPI-U): U.S. city average, byexpenditure category and commodity and service group,” U.S. Dept. of Labor, BLS; asobserved on April 22, 2008.
1 9 9 0 1 9 9 3 1 9 9 6 1 9 9 9 2 0 0 2 2 0 0 5 2 0 0 8
- 0 . 6
- 0 . 2
0 . 2
0 . 6
1
S o u r c e : C R S c a l c u l a t i o n s b a s e d o n d a t a f r o m t h e U . S . D e p t . O fL a b o r , B u r e a u o f L a b o r S t a t i s t i c s .
1 1 - m o . M A
0
M o n t h l y R a t e o f C h a n g e
Figure 15. Food Price Index: Month-to-Month Change vs. 11-Month Moving Average (11-mo MA)
International comparisons of household budgetary expenditures indicate thatrich industrial nations spend 6% to 20% of their annual budgets on food comparedwith 20% to 30% for middle income countries, and 30% to nearly 80% for lowincome countries.71 These differences suggests that food price increases represent apotentially far more serious hardship for households in low income countries,particularly those nations that depend on imports for an increasing share of theirdomestic food needs.
U.S. Food Price Inflation. In the United States, food prices increased by4.2% during 2007, the highest one-year rise since 1989. USDA predicts that foodprice inflation for 2008 will be in the range of 4.5% to 5.5%.72 During the first fourmonths of 2008, the U.S. Bureau of Labor Statistics (BLS) reports that food pricesclimbed by 2.25% for an annual rate of 6.75%.73 Figure 15 displays the monthly rateof change in the BLS food price index compared with its more stable 11-monthmoving average. Since 2005, the general trend has been upward and in June 2007,the 11-month moving average reached its highest point (0.43%) since June 1990.

CRS-34
74 For example, see “The Relative Impact of Corn and Energy Prices in the Grocery Aisle,”John M. Urbanchuk, Director, LECG LLC, June 14, 2007.75 “Price Spreads from Farm to Consumer,” Briefing Room: Food Marketing System in theU.S., ERS, USDA, at [http://www.ers.usda.gov/Data/FarmToConsumer/marketingbill.htm].76 Statement by Joseph Glauber, Chief Economist of USDA, at a Hearing entitled “How AreHigh Food Prices Impacting American Families?” before the Joint Economic CommitteeU.S. Congress, May 1, 2008, p.15, at [http://www.jec.senate.gov/]. 77 Ibid.78 For more information on U.S. food assistance programs, see “Federal Spending forDomestic Assistance Programs,” in CRS Report RS22859, Food Price Inflation: What arethe Issues? by Tom Capehart and Joe Richardson.
Despite the sharp increases in commodity prices in 2007, most economists agreethat energy costs, particularly fuel prices, have played a larger role in food priceinflation than have commodity prices.74 In general, retail food prices are much lessvolatile than farm-level prices and tend to rise by a fraction of the change in farmprices. This is because the actual farm product represents only a small share of theeventual retail price (20% on average), whereas transportation, processing,packaging, advertising, handling, and other costs — all vulnerable to higher fuelprices — comprise the majority of the final sales price.75
Because food expenditures represent a relatively small share of consumerspending for most U.S. households, food price increases are absorbed relativelyeasily in the short run. On average, in 2006 U.S. households spend about 6% of theirtotal disposable personal income on food consumed at home and another 4% on foodconsumed away from home for a total food outlay of about 10.5%. 76 However, evenin a wealthy nation such as the United States, household income variations suggestthat the impact of food price inflation can vary widely and can result in painfulspending choices at the household level. In 2006, U.S. families with less than$20,000 in income spent over 20% of their after-tax income on food.77
The United States has several food assistance programs that are designed toassist households in meeting their minimum food needs.78 The two largest programs,Food Stamps and child nutrition programs, operate as entitlement programs thatmake specified payments to all qualifying beneficiaries. However, in the case ofFood Stamps the burden is upon the eligible individuals to seek out the benefits. Ingeneral, rising food prices result in higher federal spending on Food Stamps and childnutrition programs because participation expands and because the benefits undermost federal food assistance programs are indexed to some type of consumer foodbasket that would also rise with higher prices. In 2007, $33.2 billion was spent onthe Food Stamp program while the average food stamp recipient received $95.63 permonth in benefits and the average participating household received $214.69 permonth.
International Price Rises Dim Food Security Prospects. Due tomarket and trade linkages, high commodity prices ripple through internationalmarkets where impacts vary widely based on a country’s grain import dependenceand its financial ability to respond to higher commodity prices. For example, both

CRS-35
79 Shahla Shapouri and Stacey Rosen, “Energy Price Implications for Food Security inDeveloping Countries,” Food Security Assessment, 2006, GFA-18, ERS, USDA.80 International Monetary Fund, World Economic Outlook: Globalization and Inequality.October 2007. Washington.81 “Food Prices Remain High Despite Higher Output, Increased Hunger Likely in Some PoorCountries,” FAO Newsroom, FAO, U.N., May 22, 2008. For detailed information oninternational food supply and demand projections see Crop Prospects and Food Situation,No. 2, April 2008, FAO, U.N., at [http://www.fao.org/worldfoodsituation].82 Grain Transportation Report, Agricultural Marketing Service, USDA, April 10, 2008 andMay 8, 2008.83 For an example, see “Rice Dealers Hoard Lucrative Crop, Intensifying Shortage,” by RB,Greenwire, April 18, 2008.84 “Food Price Anger Sparks Protests,” Reuters News, April 21, 2008.85 “U.N. Food Agency Facing Worst Crisis, Director Says,” Nathanial Gronewold, E&ENews PM, April 22, 2008, at [http://www.eenews.net].
Japan and Mauritania are dependent on imports for a substantial portion of domesticfood needs; however, Japan has the financial means to better accommodate risingfood import prices.
Import-dependent developing country markets are put at greater food securityrisk due to the higher cost of imported commodities. Lower-income households inmany foreign markets where food imports are an important share of nationalconsumption, and where food expenses represent a larger portion of the householdbudget, may be affected quite severely by higher food prices.79 Humanitarian groupshave expressed concern for the potential difficulties that higher grain prices imply fordeveloping countries that are net food importers.80 According to the U.N.’s Food andAgricultural Organization (FAO), the grain import bill for Low-Income Food-DeficitCountries (LIFDCs) — those nations identified as the most vulnerable tointernational food price changes — is forecast to reach $169 billion in 2008, 40%more than in 2007 due to the sharp rise in international cereal prices, freight rates,and oil prices.81
In general, the cost of food imports has been compounded by bulk ocean freightrates which were record high in 2007.82 Ocean freight rates are expected to retreatslightly in 2008 as the supply of ships expands, however, the continual rise of crudeoil prices to new highs in early 2008 suggest that shipping costs are unlikely toexperience a significant decline, and could possibly rise with higher fuel costs.
The political consequences of food shortages can be severe. Since January2008, the emerging food crisis has sparked reports of hoarding and theft.83 Civilunrest over food prices have been reported around the globe including Egypt,Indonesia, the Philippines, and much of Africa (Burkina Faso, Cameroon, IvoryCoast, Mauritania, Mozambique, Senegal, and South Africa).84 In Haiti, two daysof food-price rioting toppled the prime minister.85

CRS-36
86 For more information on the international food crisis, see CRS Report RL34478, RisingFood Prices and Global Food Needs: The U.S. Response, by Charles Hanrahan.87 “Food Crisis Is Depicted As ‘Silent Tsunami’,” by Kevin Sullivan, Washington Post,April 23, 2008.88 “Food Prices Hampering U.N. Agency’s Ability to Head Off ‘New Face of Hunger’,”Nathanial Gronewold, E&E News PM, April 24, 2008, at [http://www.eenews.net].89 For more information, see CRS Report RL33553, Agricultural Export and Food AidPrograms by Charles Hanrahan.90 P.L. 480 is the principal U.S. food aid program. It is administered by USAID.
High Prices Hurt International Food Aid Prospects
Higher commodity and food prices reduce the international community’s abilityto provide food aid to other countries without additional appropriations. This isbecause most international food aid activities (the United States included) are fixedin value by annual appropriations; thus, the amount of commodities that can bepurchased declines with rising food prices.86
In 2007, the U.N.’s World Food Program (WFP) — the world’s leading sourcefor international food aid — estimated it would need $2.9 billion to cover its 2008approved project needs which included feeding 73 million people in 78 countries.However, the WFP has twice been forced to revise its operating needs assessmentbased on continually rising prices — first on March 20, when it made an emergencyappeal for an additional US$500 million , then, barely a month later on April 22,2008, when the additional funding need was raised to $755 million.87 One of thedifficulties facing the WFP is that rice suppliers that had signed earlier grain deliverycontracts with the U.N. when prices were lower were finding it more profitable to paya 5% penalty to break the contract, and then sell their rice at the current highermarket price.88
International food aid is the United States’ major response to reducing globalhunger.89 In 2006, the United States provided $2.1 billion of such assistance, whichpaid for the delivery and distribution of more than 3 million tons of U.S. agriculturalcommodities. The United States provided food aid to 65 countries in 2006, morethan half of them in sub-Saharan Africa. The U.S. Agency for InternationalDevelopment (USAID) indicated that rising food and fuel prices would result in asignificant reduction in emergency food aid in 2008. According to press reports inMarch 2008, USAID expects a $200 million shortfall in funding to meet emergencyfood aid needs. For FY2008, Congress appropriated $1.2 billion for P.L. 480 foodaid, the same as FY2007.90 For FY2009, the President’s budget again requested $1.2billion. However, in six out of ten years since 1999, supplemental funding for P.L.480 Title II food aid has been appropriated.
Since February, President Bush has been under increasing pressure frominternational hunger advocacy groups, as well as the U.S. milling and baking industryand other food industry groups, to open grain supplies held in the Bill EmersonHumanitarian Trust (BEHT) — which was estimated to hold $177 million in cashand about 33 million bushels of wheat in early 2008 — as a short-term means of

CRS-37
91 White House News Release, Office of the Press Secretary, April 14, 2008. For moreinformation on the Bill Emerson Humanitarian Trust, see CRS Report RS21234, The BillEmerson Humanitarian Trust: Background and Current Issues, by Charles Hanrahan.92 “Food Prices Remain High Despite Higher Output, Increased Hunger Likely in Some PoorCountries,” FAO Newsroom, FAO, U.N., May 22, 2008. For detailed information oninternational food supply and demand projections see Crop Prospects and Food Situation,No. 2, April 2008, FAO, U.N., at [http://www.fao.org/worldfoodsituation].93 “Burma, Cyclone Could Further Cut Back Rice Supply, FAO,” Clarisse Douaud,[http://www.foodnavigator-usa.com], May 12, 2008.94 “Kudos to Tokyo and Washington on Rice Sales — Et Tu, Thailand and India?” PeterTimmer, Global Development: Views From the Center, Center for Global Development,
(continued...)
dampening grain prices while augmenting international supplies. On April 14, 2008,President Bush directed the Secretary of Agriculture to access grain supplies from theBEHT valued at $200 million to meet emergency food aid needs abroad.91
Farm Commodity Market Outlook
Positive Short-Run Outlook, Especially for Food Crops
For some crops, the price increases are likely to be relatively short-term innature. Substantial recovery is expected to occur by late 2008, especially in wheatand rice markets, as global supplies rebuild and exporters relax their export controls.
FAO forecasts that world cereal production will expand 3.8% to a record 2.192billion tons in 2008.92 Most of the increase is expected to come from wheat with riceand coarse grains showing modest gains. If realized, FAO predicts that the expandedproduction will help to ease the current tight global cereal supply situation.However, any recovery remains weather-dependent and commodity prices are likelyto remain highly volatile until the 2008 harvests are “in the bin.”
More immediate price moderation can be achieved if government policies tolimit or ban exports of available grain and oilseed supplies are repealed. Suchexport-prohibiting policies distort international market prices in the short-run bylimiting access to export supplies, while dampening long-run productivity gains byartificially curtailing demand and thereby discouraging investments in domesticagriculture. In the international wheat market, Ukraine has already reversed its wheatexport ban, and some market analysts expect Russia and Kazakhstan to remove theirexport bans by September if good crop conditions persist.
Circumstances are also rapidly changing in the international rice market.Initially fears of shortage were compounded when Cyclone Nargis ravaged largeswaths of Burma’s secondary rice-growing regions.93 Considerable uncertaintyremains surrounding Burma’s rice situation. However, on May 19, 2008, Japan (withthe apparent endorsement of the United States) announced that it planned to export200,000 tons of rice to the Philippines “as fast as possible.”94 According to analysis

CRS-38
94 (...continued)May 19, 2008.95 “Rice Market Eases as Cambodia Lifts Ban on Exports,” Javier Blas, Financial TimesOnline, May 27, 2008; [http://www.ft.com].96 “Field and Specialty Crops: Seeded Area,” Statistics Canada, April 21, 2008.97 “Set Aside Suspended by European Union,” by Bruno Waterfield and Charles Clover,©Telegraph Media Group Limited 2008, September 26, 2007; [http://www.telegraph.co.uk].
from the Center for Global Development (CGD), Japan continues to hold nearly 1.5million tons of rice that would otherwise be excluded from international markets bya WTO market-access trade commitment. In addition, the CGD reports that Chinaand Thailand also have substantial exportable rice stocks (1.5 million and 2.0 milliontons, respectively) that have been held off of international markets due touncertainties surrounding domestic price inflation and food needs. On May 26, 2008,Cambodia’s prime minister, Hun Sen, announced that his country was lifting its banon rice exports and that Cambodia had over 1 million tons or rice available forexport.95 India is expected to wait for the arrival of the annual monsoon rains —India’s monsoon is usually due in mid-June and is vital for non-irrigated riceproduction — before deciding on whether to ease its trade restrictions. Easing of riceexport bans in combination with projections for record production are expected tosubstantially dampen international rice market prices in the latter half of 2008.
Biofuel feedstock demand has bid up the price of corn, soybeans, and othercrops that compete for acres, especially in the United States. Both USDA’s andFAPRI’s outlook projections for 2008 include expanded acreage in the United Statesand worldwide, as high prices bring marginal land back into crop production. In theUnited States, expectations for increased double cropping of winter wheat andsoybeans in the Delta and Southeast, along with a nation-wide return to cropproduction of a substantial portion of pasture land as well as nearly 2 million acresof former CRP, are expected to boost planted area for corn, soybeans, and wheat bynearly 7 million acres to 224.6 million acres.
Similar area expansion is expected to occur worldwide in response to strongprice incentives and, in some countries, to government policy. For example,StatsCanada recently forecast Canadian wheat plantings to be up over 16% in 2008.96
In the EU, in September 2007 agriculture ministers suspended a 10% set-asiderequirement that paid farmers to idle nearly 3.8 million hectares (9.4 million acres)of cropland annually. Mariann Fischer Boel, EU Agriculture Commissioner, expectsthe additional land re-entering crop production to bolster EU grain output by up to17 million tons in 2008.97
Despite projections for record world grain production in 2008, only marginalglobal stock building is projected to occur. Relatively low stocks are expected topersist through 2008 as global production will be hard pressed to keep up withcontinued growth in demand (even with a return to normal weather and yields). Thiswill leave commodity markets particularly vulnerable to news of poor harvests ordemand shocks, and will very likely mean continued high price volatility.
CRS-39
Long-Term Outlook Hinges on Productivity Gains
Projections for a steady rise in global population, accompanied by sustainedincome growth in the world’s developing economies, are expected to sustain growthin demand for livestock products and the feedstuffs — e.g., coarse grains and proteinmeals — needed to produce those products. In addition, the outlook for increaseddemand for agricultural feedstocks to meet large increases in government biofuel-usage policies, particularly in the United States and the European Union (EU),suggest that demand will increase strongly over the coming decade for corn (theprimary feedstock for U.S. ethanol production), and vegetable oils (the primaryfeedstock for biodiesel production in the United States and the EU).
As a result, even with a return to normal crop growing conditions and successfulharvests, prices for feed grains and oilseeds — as well as those crops that competefor area with feed grains and oilseeds — are expected to remain at significantlyhigher levels than experienced during the 1998-2006 period. For an indication ofhow much higher farm prices might be in the future, see Table 2 where FAPRI’s 10-year projections suggest that prices for major U.S. program crops and products —corn, barley, sorghum, soybeans, soybean oil, soybean meal, wheat, and rice — willremain well above the average prices of the recent five-year period 2002/2003 to2006/2007.
A sustained period of agricultural output growth that surpasses the projected risein demand is needed to produce a return to abundant supplies and more moderateprices. Increased agricultural production implies some combination of increased landdedicated to crop production and/or increased output per acre of planted land. Formost countries, only marginal expansion of cropped area is possible and often thisinvolves less-productive, more environmentally sensitive land. Agriculturalproductivity gains, on the other hand, require sustained long-term investment inagricultural research, extension, and marketing infrastructure. How commoditymarkets actually evolve will depend greatly on the policy choices that the U.S. andinternational community make concerning agricultural productivity and renewableenergy.
U.S. and International Policy Response
Because the current U.S. and global commodity market dynamic affects so manyaspects of agricultural markets including short-term consumer needs, as well asissues related to intermediate and longer-term agricultural productivity, the nature ofthe U.S. and international response will necessarily vary by targeted beneficiary aswell as the relevant time period. It is unlikely that any single policy response will beable to address all issues simultaneously. This section briefly reviews some of themore salient policy responses being suggested or implemented by major players inthe U.S. and international agricultural arena.

CRS-40
98 For more information see the American Bakers Association, Press Releases, at[http://www.americanbakers.org/].99 For more information, see CRS Report RS22870, Waiver Authority Under the RenewableFuel Standard (RFS), by Brent Yacobucci.100 Transcript from interview with Scott Faber, vice president of government affairs, GroceryManufacturer Association, E&ENews OnPoint, April 9, 2008, at [http://www.eenews.net/].101 “Renewable Fuels and Ethanol Production,” policy news, NCBA, at [http://www.beefusa.org/goveRenewableFuelsandEthanolProduction.aspx].
U.S. Industry Groups Decry Rising Costs of Grain as an Input
Interests from livestock and poultry sectors, food processors and retailers, andhunger advocacy groups, have advocated for changes in current U.S. agricultural andfood policy. Many interests from within these sectors have advocated for the reversalof U.S. biofuels policy, while some have also advocated for a reduction in crop landretirement under the CRP program.
The U.S. milling and baking industry, led by the American Bakers Association(ABA), held a march in Washington, D.C. in March, 2008, to highlight theirconcerns about the short grain supplies and sharp price rises in U.S. commoditymarkets. As part of their campaign, the ABA put forward a three-point congressionalaction plan.98
! First, the ABA claims that as much as one-third of CRP land could
be returned to agricultural production without environmental harm.They urge Congress to accept House Agriculture CommitteeChairman, Colin Peterson’s proposal to decrease the CRP by 7million acres; they encourage Congress and the USDA to supportearly out-of-contract provisions within the CRP; and they requestthat USDA and the Administration undertake an evaluation toidentify viable cropland within the CRP to facilitate its return toproduction.
! Second, the ABA recommends that EPA use its waiver authority towaive the RFS annual requirements, and to drop all tariffs onimported ethanol.99
! Third, the ABA recommends that Congress and USDA consider theneeds of the domestic food industry ahead of export marketswhenever U.S. wheat stocks drop below a three-month-usage supply.
In April 2008, a spokesperson for the U.S. Grocery Manufacturers Associationcalled on Congress, the EPA, and states to freeze and rollback the biofuels mandatesdue to their effect on food prices.100 In addition to interests from the food processingand grocery retail sectors, the U.S. livestock sector has expressed long-standingconcerns about diverting feed crops away from commercial animal feeders and intobiofuels production. The National Cattlemen’s Beef Association (NCBA) explicitlyopposes the national biofuels RFS.101 NCBA members have called for amarket-based approach for the production and usage of ethanol produced fromlivestock feedstuffs, and the NCBA supports sun-setting the existing biofuels tax

CRS-41
102 “Biofuels Halt Would Ease Food Prices — Ag Group,” Missy Ryan, Guardian, April 29,2008.103 “Letter to EPA Administrator Stephen Johnson,” by Texas Governor Perry, April 25,2008, at [http://www.governor.state.tx.us/].104 “National Chicken Council Commends Texas Governor for Filing First Request forWaiver of National Renewable Fuel Standard,” NCC Press Release, April 25, 2008.105 “Sens. Hutchinson, McCain Urge Ethanol Mandate Relief from EPA,” news release, Sen.Hutchinson’s office, May 2, 2008, at [http://hutchinson.senate.gov/pr050208b.thml].106 For example, see the articles “Flat out Wrong About Food Prices,” and “RFA OpposesWaiver Request by Texas Governor,” at the RFA website at [http://www.ethanolrfa.org/];or “Recipe for a Food and Fuel Smear Campaign,” Rick Tolman, Chief Executive Officer,National Corn Growers Association, at [http://www.ncga.com/].
credits and the ethanol import tariff as scheduled and not allowing for renewal intheir current form. In April, a major international agriculture research group, theInternational Food Policy Research Institute (IFPRI), announced that a moratoriumon global grain- and oilseed-based biofuels would help ease corn prices by up to 20%and wheat prices by 10% in the next few years.102
On April 25, 2008, Texas Governor Rick Perry, in a letter to Stephen Johnson,Administrator of the Environmental Protection Agency (EPA) — the federal agencyresponsible for administering the RFS — to request that EPA waive 50% of the RFS’ethanol requirements to alleviate their impact on corn prices.103 Section 211(o) of theFederal Clean Air Act (as amended by EISA of 2007) provides the EPAAdministrator, in consultation with the Secretary of Agriculture and the Secretary ofEnergy, with the authority to suspend for one year all or part of the RFS. EPA has90 days to respond to Governor Perry’s petition for a waiver. The National ChickenCouncil’s President, George Watts, publicly commended Governor Perry’s actionstating that ethanol has been a factor behind rising food costs.104
On May 2, 2008, 23 Republican senators sent a letter to EPA administratorJohnson to inquire about the status of regulations for states applying for an ethanolmandate waiver and urged that EPA take into consideration food inflation concernsrelated to the biofuels mandate.105 However, not all quarters agree with the blamebeing targeted on the biofuels sector. The Renewable Fuels Association, the NationalCorn Growers Association, and other interest groups that have benefitted from U.S.biofuels policy suggest that high oil prices, global production shortfalls, and foreignexport controls are the main culprits and that it is unfair and incorrect to place theentire blame on the biofuels sector.106
U.S. Congressional Action
Hearings. Since May 1, 2008, Congress has held a series of hearings on issuesrelated to the potential causes and effects of the run-up on agricultural prices.Witness lists and testimony are available for each of these at the respectivecommittee’s website. These include the following:

CRS-42
107 “Citing Food Costs, Texas Governor Seeks Waiver of Fuel Mandate,” Ben Geman,Greenwire, April 28, 2008, [http://www.eenews.net].108 For more information see CRS Report RL34451, Second FY2008 SupplementalAppropriations for Military Operations, International Affairs, and Other Purposes109 For more information see CRS Report RL33934, Farm Bill Legislative Action in the110th Congress, Renee Johnson coordinator.
! May 1, 2008; Joint Economic Committee; Hearing: “How Are HighFood Prices Impacting American Families?”;
! May 6, 2008: House Committee on Energy and Commerce;Subcommittee on Energy and Air Quality; Hearing: “The RenewableFuels Standard: Issues, Implementation, and Opportunities”;
! May 7, 2008; Senate Homeland Security and Government Affairs;Hearing: “Fuel Subsidies: Is There an Impact on Food Supply andPrices?”;
! May 14, 2008; House Committee on Financial Services; Hearing:“Contributing Factors and International Responses to the GlobalFood Crisis”;
! May 14, 2008; Senate Committee on Foreign Relations; Hearing:“Responding to the Global Food Crisis”;
! May 15, 2008; House Committee on Small Business; Hearing:“Food Prices and Small Businesses”; and
! May 20, 2008; Senate Homeland Security and Government Affairs;Hearing: “Financial Speculation in Commodity Markets: AreInstitutional Investors and Hedge Funds Contributing to Food andEnergy Price Inflation?”
Legislation. Several bills have been introduced in direct response to the high
commodity prices and the alleged causes. On April 29, 2008, Congressman JeffFlake introduced a bill, H.R. 5911, that would repeal the RFS biofuels usagemandate, as well as the biofuels tax credit incentive and the ethanol import tariff —all to take effect immediately upon enactment of the bill. On May 19, 2008, SenatorKay Bailey Hutchinson introduced S. 3031, a bill that would freeze the RFS at its2009 level of 9 billion gallons rather than allowing it to increase to 36 billion gallonsby 2022.107
Additional legislative proposals currently being negotiated in Congress thatcould contribute directly or indirectly to the U.S. response to the current global foodcrisis are possible new emergency supplemental appropriations bills. Congress ispresently considering supplemental appropriations FY2008 and FY2009 for the Iraqwar which could include some as-yet-undetermined funding for emergency responseto the international food crisis.108 President Bush has requested substantial newmoney for additional food aid as part of these emergency supplemental bills.
In addition to pending legislative proposals, on May 22, 2008, new farmlegislation (P.L. 110-234) was enacted.109 Farm legislation has importantimplications for the level and timing of funding for several areas related to the U.S.’s

CRS-43
110 For more information on the U.S. response to international food concerns, see CRSReport RL34478, Rising Food Prices and Global Food Needs: The U.S. Response byCharles E. Hanrahan. For information on U.S. domestic food issues see CRS ReportRL33829, Domestic Food Assistance: The 2007 Farm Bill and Other Legislation in the110th Congress by Joe Richardson.111 For more information on the WFP, see [http://www.wfp.org/].112 For more information on the FAO, see [http://www.fao.org/].113 “Information Note,” FAO’s Initiative on Soaring Food Prices, FAO, U.N., at
(continued...)
ability to respond to domestic and international food concerns.110 For example, theseinclude provisions related to U.S. domestic nutrition programs, U.S. foreign food aidand agricultural assistance, the on-going debate over food versus fuel, agriculturalland use incentives, and agricultural productivity issues.
Immediate International Food Crises Response
Note, this and the next section briefly summarize some of the more salientevents related to the international communities attempts at responding to theperceived food crisis. For more detail, see CRS Report RL34478, Rising FoodPrices and Global Food Needs: The U.S. Response, by Charles E. Hanrahan.
On April 29, 2008, U.N. Secretary-General Ban Ki-moon announced that he willlead a task force to coordinate the efforts of the U.N. system in addressing the globalcrisis arising from the surge in food prices. The Task Force on the Global FoodCrisis will bring together the heads of U.N. agencies, funds and programs, and theWorld Bank and International Monetary Fund, as well as experts within the UN andleading authorities from the international community.
The two principal agencies within the United Nations (U.N.) responsible forinternational agricultural development and food aid are the Food and AgriculturalOrganization (FAO) and the World Food Program (WFP). WFP is the U.N.’s front-line agency in the fight against global hunger via emergency operations in responseto natural and man-made disasters, relief and rehabilitation projects, developmentprojects where food aid is used for social and economic development, and specialoperations involving logistics to speed up the movement of food aid.111 In contrast,FAO has a longer-term focus. FAO is mandated to raise levels of nutrition, improveagricultural productivity, better the lives of rural populations and contribute to thegrowth of the world economy. FAO accomplishes this through in-countryagricultural research and extension support, information dissemination, internationalworkshops and conferences, etc. in order to help developing countries modernize andimprove their agriculture, forestry and fisheries practices and ensure good nutritionfor all.112
On December 17, 2007, the U.N.’s FAO launched its Initiative on Soaring FoodPrices (ISFP) as a focal point for technical and policy assistance to those countriesidentified as the hardest hit by the sharp increase in food prices — referred to asLow-Income Food-Deficit Countries (LIFDCs).113 The international community is

CRS-44
113 (...continued)[http://www.fao.org/newsroom/common/ecg/1000826/en/ISFP.pdf].114 “Food Prices Hampering U.N. Agency’s Ability to Head Off ‘New Face of Hunger’,”Nathanial Gronewold, E&E News PM, April 24, 2008, at [http://www.eenews.net].115 “U.N. Taskforce to Tackle Global Food Crisis,” Harvey Morris, Financial Times, April30, 2008.116 For example, see “Food Price Hikes Threaten Political Crises,” by John Baize, WorldPerspectives, Inc., April 9, 2008.
seeking to coordinate on-going work by the World Bank, the International Fund forAgriculture Development (IFAD), WFP, Regional Development Banks (e.g., theAsian Development Bank and the African Development Bank), and privatefoundations to integrate new projects and interventions. First, the WFP, FAO, andIFAD are scheduled to present their strategies for coping with the food-price crisisat a U.N. executive board meeting in Geneva.114 Then, the WFP and otherinternational agencies will hear directly from governments on what they believepolicy responses need to be at a gathering at U.N. headquarters in New York. Thesepolicy meetings are a prelude to the FAO’s “Summit on Food Security” in Romescheduled for June 3-5, 2008. It is expected that the Rome summit will provide aforum for coordinating the global response to the current food crises. The list ofcurrent proposals by the U.N. and its agencies includes:115
! Establishment of a U.N. task force on food crisis.! WFP request for $755 million of emergency food aid (above normal
program funds) to world’s poorest.! Emergency $1.7 billion initiative to provide poor food importers
with seed and fertilizer.! The World Bank is to explore a rapid financing facility for poor
countries.! The International Monetary Fund (IMF) proposes aid to countries
facing balance of payments gaps.! The U.N. calls for the lifting of food export restrictions.
Long-Term Agricultural Productivity Response
While the international donor community is responding to short-term foodneeds, other interest groups are encouraging both greater investment in internationalagricultural productivity and the phasing out or elimination of government policiesthat distort market signals and diminish agricultural producer’s incentives to respondto price signals. For each country, the appropriate policy response depends on thespecific policy goal.116 Many suggestions are being offered by market watchers, butseveral recurring themes are present:
! Reverse protective country-level policies of export bans and/orlimitations that have exacerbated the problem.
! Reduce or eliminate subsidies that divert agricultural land from foodand feed production to the production of feedstocks for biofuels.

CRS-45
117 “Rising Food Prices: What Should Be Done?” Joachim von Braun, IFPRI Policy Brief,April 2008, at [http://www.ifpri.org/themes/foodprices/foodprices.asp].118 Rising Food Prices: Policy Options and World Bank Response,” Background note for theDevelopment Committee, prepared by PREM, ARD, and DEC drawing from across theBank; undated mimeo, at [http://www.worldbank.org/].119 “A Proposal on Food Export Restrictions,” World Trade Daily, Vol. 17, No. 87, April 30,2008.
! Remove or phase out domestic policies that keep market prices lowin favor of consumers, but at the expense of sustained investment inthe agricultural sector.
! Remove barriers that have constrained the production and use ofgenetically-modified crops.
In April, the International Food Policy Research Institute (IFPRI) — a majorinternational agriculture research agency that operates as part of the ConsultativeGroup on International Agricultural Research (CGIAR) — issued a 2-page policybrief that enumerated several policy recommendations for dealing with highinternational commodity prices and their harmful effect on groups vulnerable to foodinsecurity. First, IFPRI calls for short-run reinforcement and expansion of socialprotection and nutrition programs targeted to vulnerable groups. Second, IFPRI callsfor elimination of biofuel subsidies and mandates. Third, IFPRI recommends theelimination of trade barriers to reduce market distortions and thereby allow correctprice signals to reach agricultural producers. Finally, IFPRI encourages long-terminvestment in agricultural research and extension, rural infrastructure, and marketaccess for small farmers.117
The World Bank (WB) also has released a list of policy recommendations inresponse to the emerging global food crisis. The WB’s recommendation focus onthose policy options designed to improve household food security. The WB recentlyreleased a policy option paper as a partial guide for government policy designed torespond to the current high commodity prices in international markets.118 As such,the WB prioritizes policy options by their effectiveness at reaching target groups, theequity of distribution of program benefits, and the degree of market distortionsintroduced. The WB lists country-level policy options under three broad classes:Targeted Safety Net Programs; Measures to Lower Domestic Food Prices; andMeasures to Stimulate Medium-term Food Grain Production
Possible World Trade Organization (WTO) Implications
In an attempt to deal with its own food-import dependency while responding tothe global food crisis and the proliferation of export restrictions, Japanese officialshave announced that Japan will be offering a formal proposal in the WTO’s DohaRound of multilateral trade negotiations calling for stronger disciplines on exportingmembers.119
Doha agriculture negotiations chair, Crawford Falconer, has proposedeliminating all existing export restrictions by the end of the first year of the

CRS-46
120 “Revised Draft Modalities for Agriculture,” TN/AG/W/4/Rev.1, WTO, February 8, 2008.
implementation of any new agreement.120 In addition, he has proposed that any newexport restrictions and prohibitions be allowed only for a period of 12 months,extendable up to a maximum of 18 months, in consultations with affected importers.