Hfbs harder, better, faster, stronger a presentation created by louis kam with the support and...
16
h f b s harder, better, faster, stronger a presentation created by louis kam with the support and sponsorship of cell biology, amgen wa QAL
-
Upload
molly-hood -
Category
Documents
-
view
219 -
download
2
Transcript of Hfbs harder, better, faster, stronger a presentation created by louis kam with the support and...

h fb s
harder, better, faster, stronger
a presentation created by
louis kamwith the support and sponsorship ofcell biology, amgen wa QAL

louis kam
introduction
awa qal
In a GMP environment, effective and accurate methods of measurement become essential to the acquisition and assessment of scientific data. The advantages to more reliable data, such as an improved understanding of potency and effectiveness under various conditions, are simple and easily understood, yet vital to the process leading up to final product delivery.
For the Cell Biology group in QAL, a shift to newer technology has been made to generate more accurate results, create more scientifically rigid procedures, and also to eliminate certain forms of controllable error.
a simplified model of the drug development process emphasizing quality’s role
one

louis kamawa qal
abstract
This study is primarily aimed at quantitatively comparing the manual Trypan Blue cell counting method against the automated Guava flow cytometry method. Comparison is based upon two characteristics, cell density and viability, and their results are assessed by measures in variability. A secondary goal is the optimization of the Guava data acquisition process, done by setting viability and debris event (PM2) gates at appropriate values for individual cell lines.
The importance of such a study stems from the eventual goal of attaining proper viability measurements.
two
Cell viability studies are important in ascertaining cell proliferation rates, hardiness, and potential cell cycle complications. Thus, there is ample motivation to improve the current process.
On top of improving viability studies, the Guava system supports many different types of assay procedures, allowing the development of more complex experiments that were once done by hand to be done by Guava. Not only could this save time and money, but due to the complete automation of assay data collection, the process can be calibrated and standardized to a greater degree than the human hand.

louis kamawa qal
the present
the molecular structure of Trypan Blue, used in staining cell populations
dead cells absorb the molecule and are thus stained blue, while live cells do not and remain transparent
1 introduce cells to Trypan Blue
the cells mix with the Trypan Blue, creating a blend of live and dead populations that appear differently under a microscope
three
2 load into a hemacytometer
3 count cells
4 extrapolate
live cells eventually become poisoned by the Trypan Blue, so importance is placed on performing counts as soon as possible as to not skew viability
counts are usually taken from squares in multiples of 2, while maximizing distance between squares to maintain randomness
Viable Non-viable
124 9
# of SquaresDilution Factor 24
Density
extrapolation is done via a cell count from 0.1 µL per square in volume to 1mL, or four orders of magnitude away
in this example, 4 squares were counted, totaling .4 µL in volume, and extrapolated to 6.20 x 10⁴ cells/mL
6.20 x 10⁴ cells/mL
Trypan Bluestaining

the future
louis kamawa qal
four
1 prepare fluorescent reagent
2 introduce cells to reagent
3 cells pass through flow cellin single file
after the cells are tagged with the fluorescent reagent, the sample is ready to enter the Guava flow cell, where they will be counted and sorted
this dye tags cells individually, allowing them to emit different wavelengths of light at different locations based upon their biological composition when struck with a laser
capillary flow
4 laser excites cells andgenerates signals
cytometry
5 cell signals sorted by scatterand color
6 data is fed into a computerfor final analysis
the cells are fed through a capillary where they are forced into single file,when a high-energy laser strikes them one by one and excites the reagent bound to the cell, giving off specific scatter and color signals
scatter is sorted by forward and side scatter, giving the cell’s physical characteristics while color signals tell which receptors have been bound viability requires only scatter
detection, but many assay varieties can make use of color detection as a means of finding specific cellular receptors, and make use of those results
except for sample preparation, every other step along the way is done by a calibrated and automated process, making each sample run procedurally identical.
methodology
louis kamawa qal
five
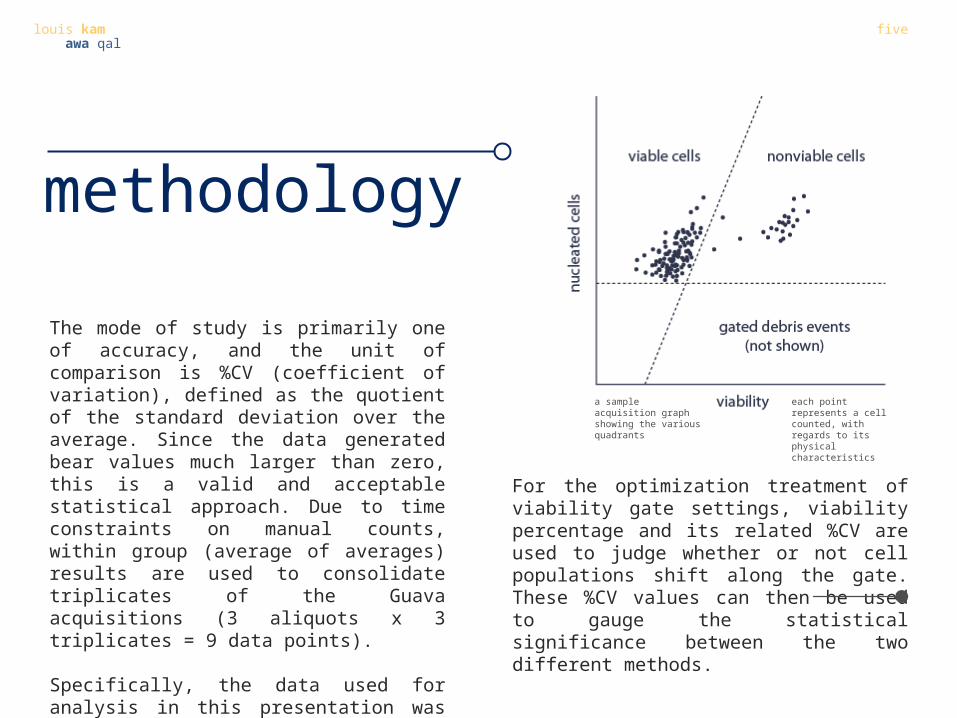
The mode of study is primarily one of accuracy, and the unit of comparison is %CV (coefficient of variation), defined as the quotient of the standard deviation over the average. Since the data generated bear values much larger than zero, this is a valid and acceptable statistical approach. Due to time constraints on manual counts, within group (average of averages) results are used to consolidate triplicates of the Guava acquisitions (3 aliquots x 3 triplicates = 9 data points).
Specifically, the data used for analysis in this presentation was collected between July 9, 2007 and July 31, 2007, summing to a total of 279 Guava runs and 93 manual Trypan Blue runs from five different cell lines.
For the optimization treatment of viability gate settings, viability percentage and its related %CV are used to judge whether or not cell populations shift along the gate. These %CV values can then be used to gauge the statistical significance between the two different methods.
a sample acquisition graph showing the various quadrants
each point represents a cell counted, with regards to its physical characteristics
the project
louis kamawa qal
six
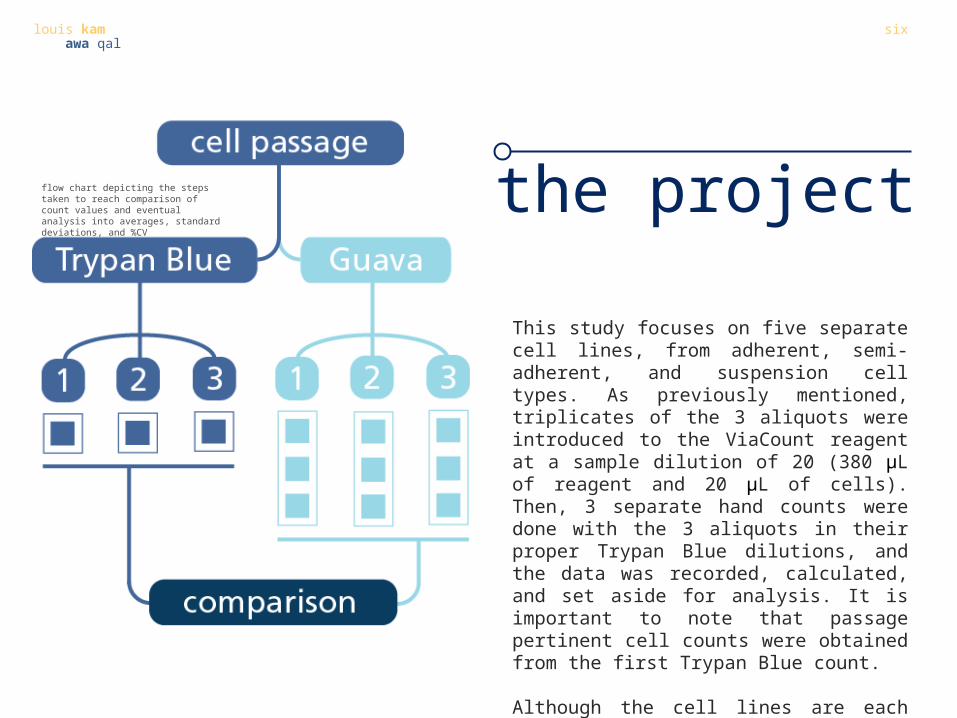
This study focuses on five separate cell lines, from adherent, semi-adherent, and suspension cell types. As previously mentioned, triplicates of the 3 aliquots were introduced to the ViaCount reagent at a sample dilution of 20 (380 μL of reagent and 20 μL of cells). Then, 3 separate hand counts were done with the 3 aliquots in their proper Trypan Blue dilutions, and the data was recorded, calculated, and set aside for analysis. It is important to note that passage pertinent cell counts were obtained from the first Trypan Blue count.
Although the cell lines are each unique in their own regard, the results were accumulated since size of cells did not appear to affect cell counts.
flow chart depicting the steps taken to reach comparison of count values and eventual analysis into averages, standard deviations, and %CV

type 1 comparison
louis kamawa qal
seven
Type 1 cells are mid-size suspension cells (do not adhere to surfaces). Each color bar represents a separate cell passage where a count was taken. In the case of raw counts, the manual method generates less variation than the Guava method.
Average : 7.0St. Dev. : 4.0
Average : 5.7St. Dev. : 2.1
However, the Guava excelled with the viability assessment, giving only one outlier run, while the other data points remained under 0.50%.
Average : 0.5St. Dev. : 0.6
Average : 1.7St. Dev. : 0.8
type 2 comparison
louis kamawa qal
eight
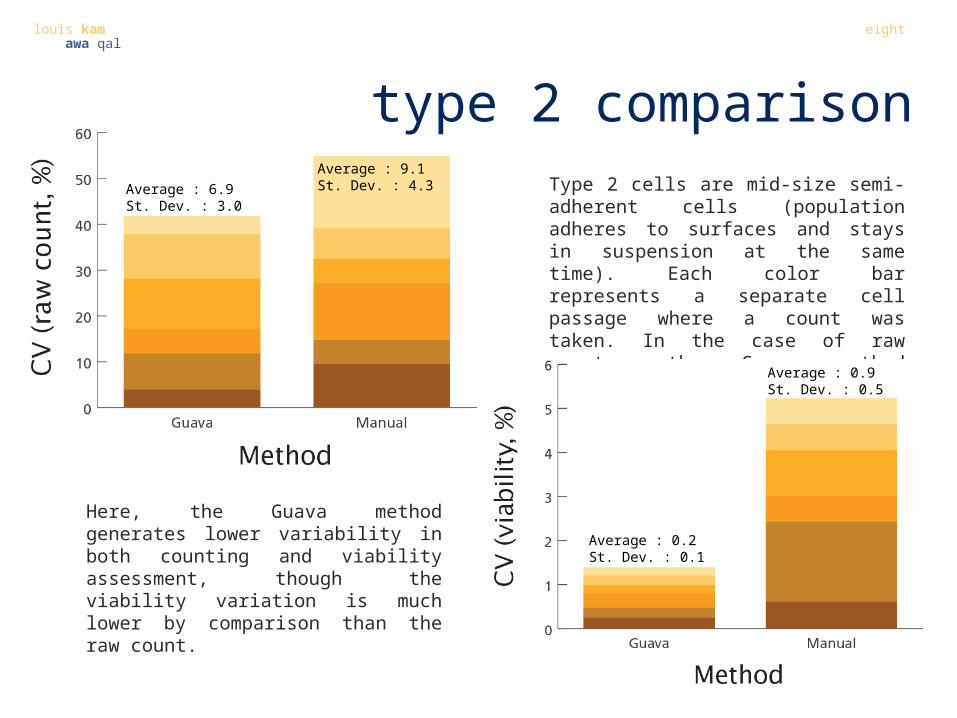
Average : 6.9St. Dev. : 3.0
Average : 9.1St. Dev. : 4.3 Type 2 cells are mid-size semi-
adherent cells (population adheres to surfaces and stays in suspension at the same time). Each color bar represents a separate cell passage where a count was taken. In the case of raw counts, the Guava method generates slightly less variation than the manual method.
Average : 0.2St. Dev. : 0.1
Average : 0.9St. Dev. : 0.5
Here, the Guava method generates lower variability in both counting and viability assessment, though the viability variation is much lower by comparison than the raw count.
louis kamawa qal
nine
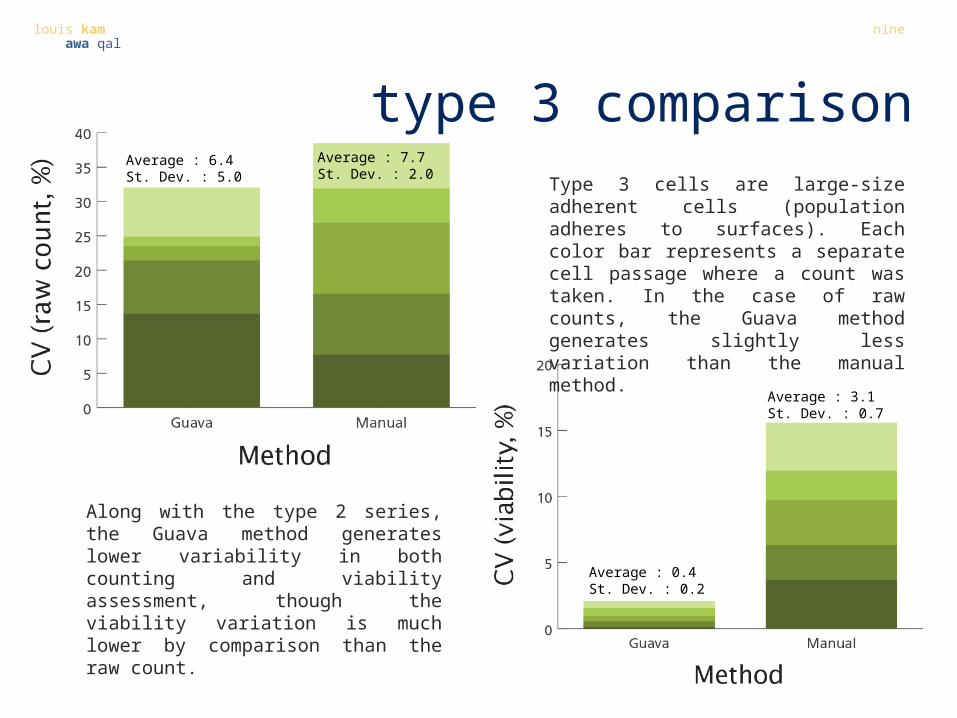
Average : 6.4St. Dev. : 5.0
Average : 7.7St. Dev. : 2.0
Average : 0.4St. Dev. : 0.2
Average : 3.1St. Dev. : 0.7
Type 3 cells are large-size adherent cells (population adheres to surfaces). Each color bar represents a separate cell passage where a count was taken. In the case of raw counts, the Guava method generates slightly less variation than the manual method.
Along with the type 2 series, the Guava method generates lower variability in both counting and viability assessment, though the viability variation is much lower by comparison than the raw count.
type 3 comparison
louis kamawa qal
ten
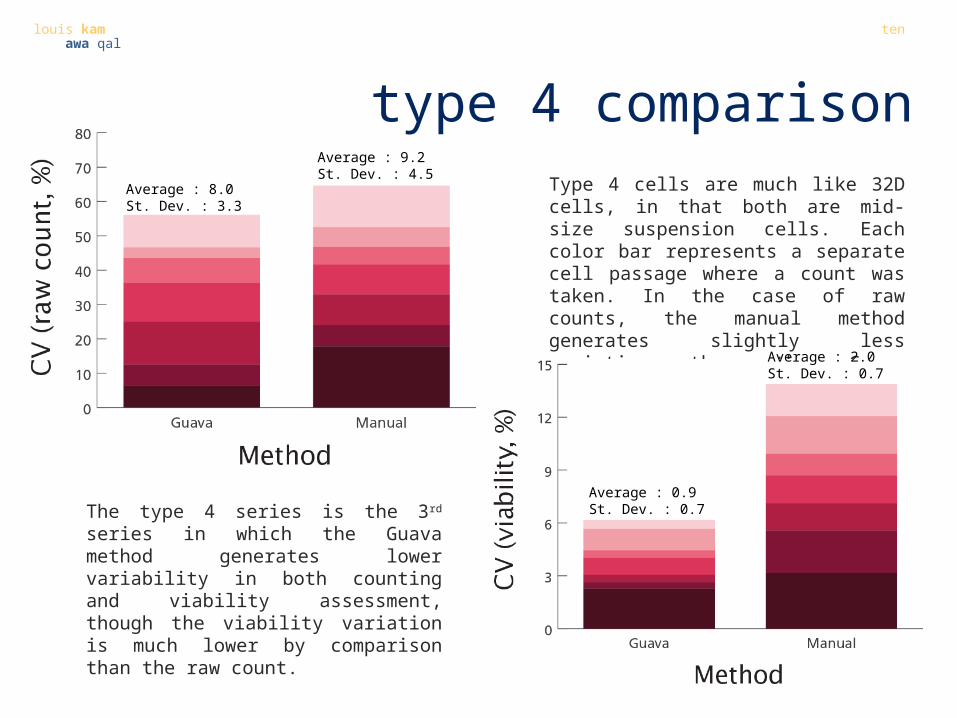
Type 4 cells are much like 32D cells, in that both are mid-size suspension cells. Each color bar represents a separate cell passage where a count was taken. In the case of raw counts, the manual method generates slightly less variation than the Guava method.
Average : 8.0St. Dev. : 3.3
Average : 9.2St. Dev. : 4.5
The type 4 series is the 3rd series in which the Guava method generates lower variability in both counting and viability assessment, though the viability variation is much lower by comparison than the raw count.
Average : 0.9St. Dev. : 0.7
Average : 2.0St. Dev. : 0.7
type 4 comparison
louis kamawa qal
eleven
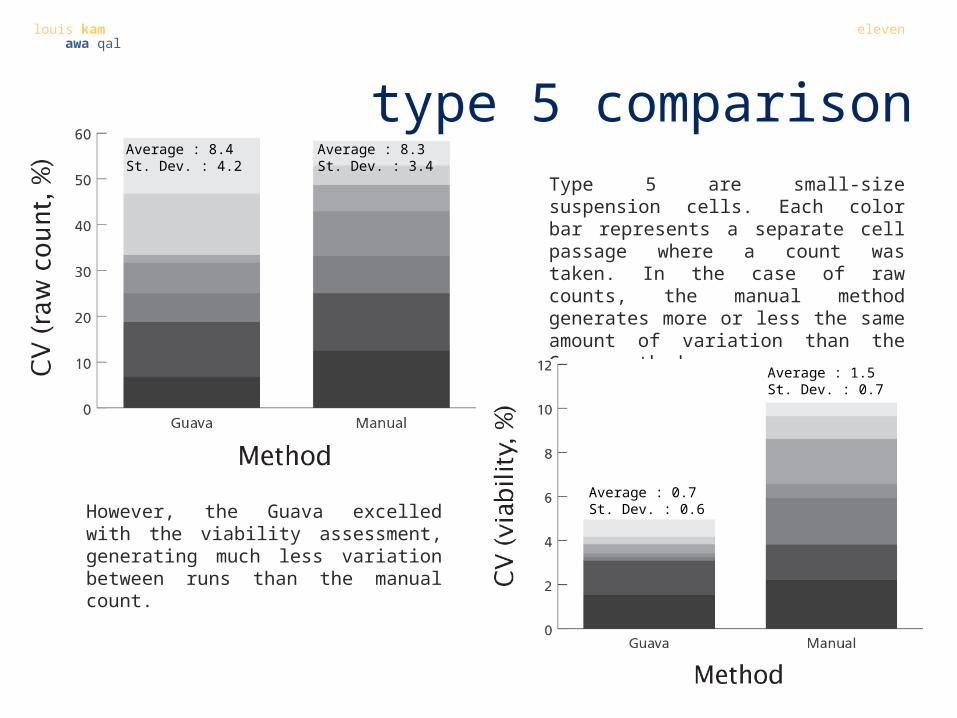
Type 5 are small-size suspension cells. Each color bar represents a separate cell passage where a count was taken. In the case of raw counts, the manual method generates more or less the same amount of variation than the Guava method.
However, the Guava excelled with the viability assessment, generating much less variation between runs than the manual count.
Average : 8.4St. Dev. : 4.2
Average : 8.3St. Dev. : 3.4
Average : 0.7St. Dev. : 0.6
Average : 1.5St. Dev. : 0.7
type 5 comparison

louis kamawa qal
twelve
total cell count resultsThe box plot represented here is the accumulated statistics of all %CV values collected for all cell lines. In the end, the manual count proved to have tighter results, though slightly skewed towards the lower end, while the Guava managed an even spread of CV points throughout. This can be interpreted by saying manual counting generates less variation with similarly taken data (with no regard to the true value, which cannot be known) than the Guava flow cytometry system. However, neither are greatly more advantageous than the other.
Outliers are determined by using the 1.5 x IQR (interquartile range) method. Suppose h = 1.5 x IQR = 1.5 x (q3 – q1), then the floor and ceiling of the box plot is determined by q1 – h and q3 + h, respectively. Points lying outside of these ranges are considered outliers.
total viability results
louis kamawa qal
thirteen
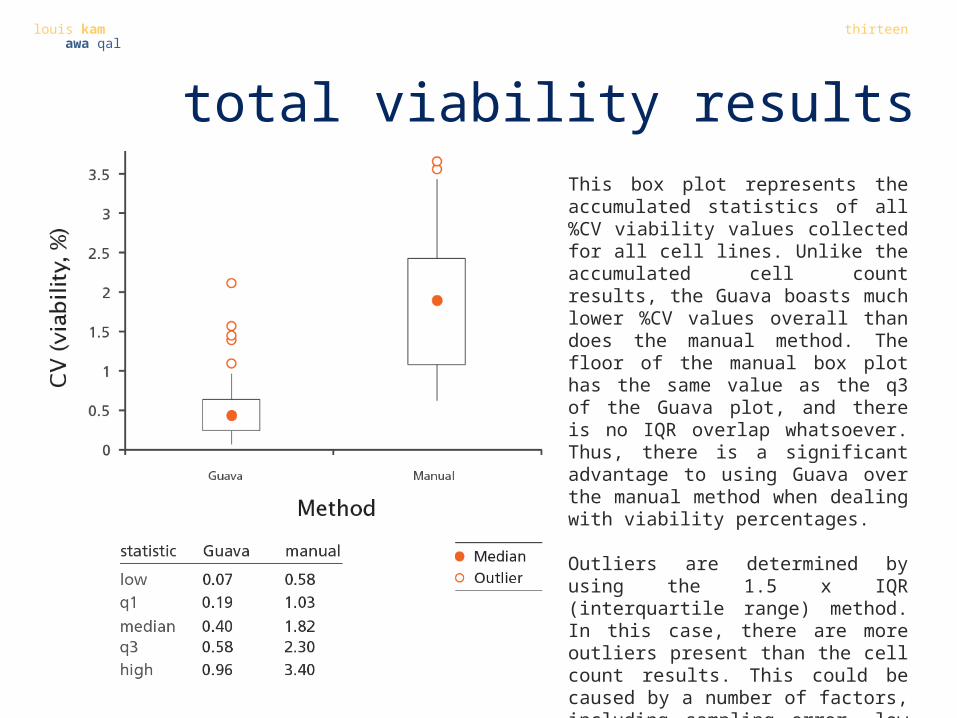
This box plot represents the accumulated statistics of all %CV viability values collected for all cell lines. Unlike the accumulated cell count results, the Guava boasts much lower %CV values overall than does the manual method. The floor of the manual box plot has the same value as the q3 of the Guava plot, and there is no IQR overlap whatsoever. Thus, there is a significant advantage to using Guava over the manual method when dealing with viability percentages.
Outliers are determined by using the 1.5 x IQR (interquartile range) method. In this case, there are more outliers present than the cell count results. This could be caused by a number of factors, including sampling error, low sample count, and random noncompliance to Gaussian or fixed distributions.
conclusions
louis kamawa qal
fourteen
Though the Guava system can run many replicates of the same aliquot much faster than hand counting could, there are perceivable advantages to using it. However, there is no significant advantage to using Guava over Trypan Blue staining when assessing total cell count. On the other hand, cell viability assessment inproved greatly, with 75% of its CV values reaching below the lower bound of the manual CV values. This presents a great statistical advantage, and supports Guava’s ability to attain more precise readings in viability. Regardless, the implementation of Guava is an important step, as cytometry is not the only function available, and many assays could be developed using it.
Since true values are never known regarding total cell number, precision, not accuracy, is the variable assessed in this study. While the manual method may, at first glance, offer more precise cell counts, its heavy reliance on analyst bias when determining what counts as a live or dead cell makes this a scientifically lacking procedure worth improving. It is also possible that the Guava may have come closer to true values more often than the manual count. Thus, further study may be recommended as per the needs and requirements of the lab using the procedure.

louis kamawa qal
fifteen
acknowledgements
I would first and foremost like to thank Amgen for creating the internship program and allowing students like myself to expand their horizons in a professional environment. In particular, thanks go out to Val Jackson and Kim McNeil for helping to ease and simplify the administrative process. A big special thanks goes to the QAL Cell Biology department for assimilating and including me as one of their own. I would also like to give thanks to Ann Schulz for creating the project and allowing me free reign, Katharine Schwedhelm for extensively training me and getting me up to speed in such a short time, Laura Carlson for being able to answer every obscure protocol question I could ever have, Yidong Zhao for introducing me to the program by proxy, and Katie Clayton, Adrienne Dahl, Quyen Huynh, and Patrick Maunder for being superbly helpful and humorous people.
For auxiliary support, I would like to thank Axel Roesler for planting the seed of change in how I view the way communication is delivered, Guy- Manuel de Homen-Christo and Thomas Bangalter for supplying titling inspiration, and Johnny Pate, Demis Roussos, Minnie Riperton and more for delivering potent midnight coffee in helping me finish this presentation.
Moreover, I wish to thank my family and friends for being a constant inspiration and source of support. Special thanks also go out to Richard Ruiz for his assistance in burning the midnight oil.
Lastly, I would like to thank awards programs acceptance speeches for allowing me to plagiarize the format of this page.