Heterogeneous photocatalysis on construction materials...
17
MATERIALES DE CONSTRUCCIÓN Vol. 64, Issue 314, April–June 2014, e013 ISSN-L: 0465-2746 http://dx.doi.org/10.3989/mc.2014.06713 Heterogeneous photocatalysis on construction materials: effect of catalyst properties on the efficiency for degrading NOx and self cleaning N. Bengtsson a , M. Castellote a * a. Institute of Construction Science Eduardo Torroja–IETcc (CSIC) - (Madrid-Spain) *[email protected] Received 29 July 2013 Accepted 12 December 2013 Available on line 19 May 2014 ABSTRACT: This paper analyzes the effect of some properties of different catalysts on the photocatalytic activity. The efficiency has been determined for two different processes: NOx abatement and self-cleaning for Rhodamine B and tobacco extract being, the TiO 2 based photocatalyst, supported as coatings on white mortar. Eight different catalysts were tested, seven commercial ones and one home-made catalyst with improved visible light absorption properties. Additionally, some of them were submitted to exposition to water and/or calcina- tions to alter their physical properties. A kinetic approach was used to evaluate the photocatalytic activity, being the first reaction constant (for NO) and just empirical constants (for self-cleaning) the parameters used for the comparison of the different materials. As a result, the efficiency, even for ranking, is dependent on the type of contaminant used in the experiment. In general, NO oxidation and tobacco followed similar trends while no clear relations were found for Rhodamine B. KEYWORDS: TiO 2 ; Optical; Crystalline and microstructure properties; NOx removal; Self cleaning; Rhodamine B; Tobacco extract; Construction materials Citation / Citar como: Bengtsson, N.; Castellote, M. (2014) Heterogeneous photocatalysis on construction materials: effect of catalyst properties on the efficiency for degrading NOx and self cleaning Mater. Construcc. 64 [314], e013 http://dx.doi.org/10.3989/mc.2014.06713. RESUMEN: Fotocatálisis heterogénea en materiales de construcción: efecto de las propiedades de los cataliza- dores en la eficiencia de degradación de NOx y autolimpieza. En este trabajo se analiza el efecto de las propie- dades de distintos catalizadores en la actividad fotocatalítica de degradación de NOx y autolimpieza, para Rodamina B y extracto de tabaco. Se han ensayado ocho fotocatalizadores, basados en TiO 2 y soportados sobre mortero blanco; siete de ellos comerciales y uno sintetizado en el laboratorio con absorción mejorada en el vis- ible. Adicionalmente, las propiedades físicas de algunos de ellos se alteraron mediante tratamientos con agua y/o por calcinación. La actividad fotocatalítica se ha evaluado mediante aproximación cinética, siendo la constante de reacción de primer orden (para NO) y constantes empíricas de ajuste (para autolimpieza) los parámetros de comparación entre materiales. Como resultado, la eficiencia depende del contaminante utilizado en el experi- mento de evaluación. En general, en este estudio, oxidación de NO y de extracto de tabaco presentan tendencias similares mientras para Rodamina B no se encontró correlación clara ninguna. PALABRAS CLAVE: TiO 2 ; Propiedades ópticas, cristalográficas y microestructurales; Degradación de NOx; auto- limpieza; Rodamina B; Extracto de tabaco; Materiales de construcción Copyright: © 2014 CSIC. This is an open-access article distributed under the terms of the Creative Commons Attribution-Non Commercial (by-nc) Spain 3.0 License.
Transcript of Heterogeneous photocatalysis on construction materials...

Materiales de ConstruCCión
Vol. 64, Issue 314, April–June 2014, e013ISSN-L: 0465-2746
http://dx.doi.org/10.3989/mc.2014.06713
Heterogeneous photocatalysis on construction materials: effect of catalyst properties on the efficiency for degrading
NOx and self cleaning
N. Bengtssona, M. Castellotea*
a. Institute of Construction Science Eduardo Torroja–IETcc (CSIC) - (Madrid-Spain)*[email protected]
Received 29 July 2013Accepted 12 December 2013
Available on line 19 May 2014
ABSTRACT: This paper analyzes the effect of some properties of different catalysts on the photocatalytic activity. The efficiency has been determined for two different processes: NOx abatement and self-cleaning for Rhodamine B and tobacco extract being, the TiO2 based photocatalyst, supported as coatings on white mortar. Eight different catalysts were tested, seven commercial ones and one home-made catalyst with improved visible light absorption properties. Additionally, some of them were submitted to exposition to water and/or calcina-tions to alter their physical properties. A kinetic approach was used to evaluate the photocatalytic activity, being the first reaction constant (for NO) and just empirical constants (for self-cleaning) the parameters used for the comparison of the different materials. As a result, the efficiency, even for ranking, is dependent on the type of contaminant used in the experiment. In general, NO oxidation and tobacco followed similar trends while no clear relations were found for Rhodamine B.
KEYWORDS: TiO2; Optical; Crystalline and microstructure properties; NOx removal; Self cleaning; Rhodamine B; Tobacco extract; Construction materials
Citation / Citar como: Bengtsson, N.; Castellote, M. (2014) Heterogeneous photocatalysis on construction materials: effect of catalyst properties on the efficiency for degrading NOx and self cleaning Mater. Construcc. 64 [314], e013 http://dx.doi.org/10.3989/mc.2014.06713.
RESUMEN: Fotocatálisis heterogénea en materiales de construcción: efecto de las propiedades de los cataliza-dores en la eficiencia de degradación de NOx y autolimpieza. En este trabajo se analiza el efecto de las propie-dades de distintos catalizadores en la actividad fotocatalítica de degradación de NOx y autolimpieza, para Rodamina B y extracto de tabaco. Se han ensayado ocho fotocatalizadores, basados en TiO2 y soportados sobre mortero blanco; siete de ellos comerciales y uno sintetizado en el laboratorio con absorción mejorada en el vis-ible. Adicionalmente, las propiedades físicas de algunos de ellos se alteraron mediante tratamientos con agua y/o por calcinación. La actividad fotocatalítica se ha evaluado mediante aproximación cinética, siendo la constante de reacción de primer orden (para NO) y constantes empíricas de ajuste (para autolimpieza) los parámetros de comparación entre materiales. Como resultado, la eficiencia depende del contaminante utilizado en el experi-mento de evaluación. En general, en este estudio, oxidación de NO y de extracto de tabaco presentan tendencias similares mientras para Rodamina B no se encontró correlación clara ninguna.
PALABRAS CLAVE: TiO2; Propiedades ópticas, cristalográficas y microestructurales; Degradación de NOx; auto-limpieza; Rodamina B; Extracto de tabaco; Materiales de construcción
Copyright: © 2014 CSIC. This is an open-access article distributed under the terms of the Creative Commons Attribution-Non Commercial (by-nc) Spain 3.0 License.

2 • N. Bengtsson et al.
Materiales de Construcción 64 (314), April–June 2014, e013. ISSN-L: 0465-2746. doi: http://dx.doi.org/10.3989/mc.2014.06713
1. INTRODUCTION
Photocatalysis is classified as an advanced oxida-tion process. It is equivocal when and who started utilizing first such a photochemical power of TiO2 to induce chemical reactions. However, it was in the early 1970s when this discipline becomes more pop-ular with Fujishima and Honda (1) and Wrighton et al. (2) that reported the photocatalytic split-ting of water on TiO2 and Sr-doped TiO2 respec-tively. The application of photocatalytic materials has increased rapidly in construction materials, try-ing to profit of the extensive surfaces that they can provide, for environmental protection, self-cleaning, self-sterilizing materials, antifogging mirrors and windows. The photocatalytic activity of TiO2 en -riched building materials has been reported to pro-vide promising results for the degradation of air contaminates such as VOC (3–5), NOx (6–9) and for self cleaning (10, 11) and the expectations of their possibilities increase every day. As an example, very recently, the possibility of using heterogeneous pho-tocatalysis to diminish the allergenic airborne pollen has been reported (12).
TiO2 based catalysts commonly found in the lit-erature have very different catalysts properties so, sometimes is very difficult to compare the results achieved in different trials. Therefore, is important to consider and understand the influence of the differ-ent catalyst properties on the photocatalytic activity. Additionally, as in construction activity TiO2 can be dispersed into other materials, as cement, the influ-ence of the interactions of both and the resulting microstructure is also important (11, 13–15).
Concerning the first aspect, several papers can be found in literature, mainly on the influence of the crystal size on the optical properties and on the effi-ciency of the photocatyst.
It is known that the band gap of a crystalline semiconductor is a function of the particle size (16–18). Below a certain threshold, decrease in particle size brings about reduction in band gap, that is, red-shift in absorption spectrum. When the size of semiconductor particle decreases from its bulk to that of Bohr radius, e.g., the first exci-tation state, the size quantization (quantum size effect, QSE) effect arises due to the spatial confine-ment of charge carriers. Therefore, the band gap of ultra-fine semiconductor particle increases with the decrease in particle size when it is smaller than the band gap minimum. Size quantization effect has been studied using various semiconductors includ-ing TiO2 (19–21). The reported QSE of semicon-ductor clusters appears to be between 1 and 12 nm. Results of these studies were mostly obtained theo-retically, and only a few investigations have been conducted on the change of band gap as a func-tion of particle size using TiO2 (19-22). Anpo et al. (19) studied the change of band gap of TiO2 over a
wide range of particle sizes (e.g., 3.8–200 nm) and found significant blue shifts of the absorption edge by 0.093 and 0.156 eV for rutile and anatase crys-talline, respectively, when particle size was less than 12 nm. Kormann et al. (20) observed the quantum confinement effect upon illumination of TiO2 col-loids and reported a blue-shift by 0.15–0.17 eV in absorption spectrum. However, Serpone et al. (22) did not observe a quantum size effect in the par-ticles size range between 2.1 and 26.7 nm of TiO2. On the other hand, particle size can also affect the photocatalytic reactivity. A few studies have been conducted to assess the relationship between par-ticle size and photocatalytic reactivity (19, 23–32). As recent examples, in (33) the influence of optical properties on the size of two anatase TiO2 nano-crystallines was studied. (34) investigated photo-catalytic performances in rela tion to photocatalyst properties and influence of the chemical environ-ment of cement on titania particles for two com-mercial anatase samples in cement and mortar specimens: a micro-sized, m-TiO2 and a nano-sized, n-TiO2. In (35) it was found that crystallinity, rather than surface area or porosity, was the crucial parameter that favours the photocatalytic oxidation of TCE over anatase.
However, most these studies were performed on UV–vis absorbance measurements conducted on suspensions, and considering in isolated way the effect of the different parameters. In this context, this work evaluates the influence of catalyst proper-ties on the NOx abatement and self-cleaning ac tivity, on hardened construction materials enriched with TiO2, with the purpose to evaluate the obtained results for different catalyst properties. A wide range of photocatalysts were selected with different mate-rial properties, referring to crystal phases, surface area, optical properties and particle size. The photo-catalytic activity of each catalyst was determined by NOx oxidation and self-cleaning tests based on the discoloration of Rhodamine B and tobacco.
2. EXPERIMENTAL
2.1. Catalysts
The photocatalytic materials used in this study were all based on TiO2. Eight different catalysts were tested, where seven were commercial photocatalysts (A, B, C, D, E, F, G) and one was a home-made S, N and C doped catalyst (S-TiO2) with improved visible light absorption properties (36). They were of two types: fine powders (A, B, C, D, E and S-TiO2) and white paints (F and G) TiO2 enriched. The paint G was mentioned by the producer to be activated by visible light.
To achieve a wide range of catalysts properties except for the paints and for S-TiO2, samples of the catalysts were submitted to exposition to water and
Heterogeneous photocatalysis on construction materials • 3
Materiales de Construcción 64 (314), April–June 2014, e013. ISSN-L: 0465-2746. doi: http://dx.doi.org/10.3989/mc.2014.06713
calcinations respectively to alter their crystal prop-erties. Provided that when using powdered photo-catalysts, at least when dispersed in a cementitious matrix, they are in contact with an aqueous phase, we considered it was important to analyse also the catalysts after they were subjected to water in order to look mainly for aggregates that could eventually change the size of the crystals with respect to that in a dry state. Concerning calcinations, the catalysts were heated until 800 °C during 6 hours with a prior temperature increasing using a ramp of 1.8 °C per minute until reaching 800 °C. The catalysts were let to cool down slowly inside the oven after the annealing.
The resulting table of catalyst (before and after pre-treatments) is summarized in table 1.
2.1.1. Sample preparation
The different photocatalysts included in this work were tested by applying them on the surface of white mortar.
The mortar was prepared according to the stan dards UNE-EN 196-1 (UNE-EN 196-1) and UNE–EN 197-1 (UNE–EN 197-1). White cement BL II/A-LL 52.5 N was used. The water/cement ratio was 0.50. The quantities for the batches were 450 ± 2 g of cement, 1350 ± 5 g of sand and 225 ± 1 g of water. The mortar was moulded in Petri dishes with a diameter of 90 mm and a height of 16 mm. The fresh mixture in the mould was vibrated to remove the air from the mixture and finally exces-sive mortar was removed to obtain a flat surface. The fresh mortar in the Petri dish was cured for 28 days at >95 %RH and 23 ± 2 °C inside a humidity chamber.
The paints were applied directly on the surface and distributed homogeneously by a metal roller, giving a homogeneous layer of paint with a mass load of around 300 g/m2. The powder catalysts were applied as a mixture of water/TiO2, see description of the TiO2 application below.
A circular area of 50.2 cm2 on the surface of the mortar samples was delimited by silicone. A solution
made up of a TiO2 at a concentration of 8.37 (g/l) in deionised water, stirred rigorously during 10 min-utes was applied on the delimited area. A total vol-ume of 3 ml taken directly from the mixture while stirred to avoid the sedimentation of the catalyst was distributed over the saturated sample’s sur-face, to give a final TiO2 mass load of 5 g/m2 after evaporation of the water at room temperature. This method for coating was chosen in order to not have a significant influence of the substrate. In fact, the samples were water saturated prior to add the TiO2 suspension; so, nothing was sucked inside the sam-ples. However, being a porous support, the adher-ence was enough good.
The samples were stored at 57 %RH and 21 °C at least 48 hours prior to the NO oxidation and self cleaning degradation tests. The humidity and tem-perature were controlled by storing the samples in a closed plastic container with a saturated water solu-tion of magnesium nitrate (Mg(NO3)2·6H2O) in the bottom. The samples were placed on a plastic grid to avoid contact between the samples and the liquid. The container was stored in a room with controlled temperature of 21 °C.
2.1.2. Characterisation trials
The catalysts were characterized for their crystal-lographic phases, porosity and optical properties:
X-Ray Diffraction analysis allowed to known the crystallographic phases, the crystallite size and the degree of crystallinity (FWHM). The crystal size was determined according to the Scherrer’s equation, Equation [1]:
dKcos
= λβ θ [1]
where d is the average particle size of the phase under investigation, K is the Scherrer’s constant, λ is the x-ray wavelength used (1.5406 Å), β is the width at mean height of the diffraction peak expressed in radians and θ is the angle in radians of the diffraction peak. The value of the Scherrer constant (K) depends on normalized Grain Size Distribution width.
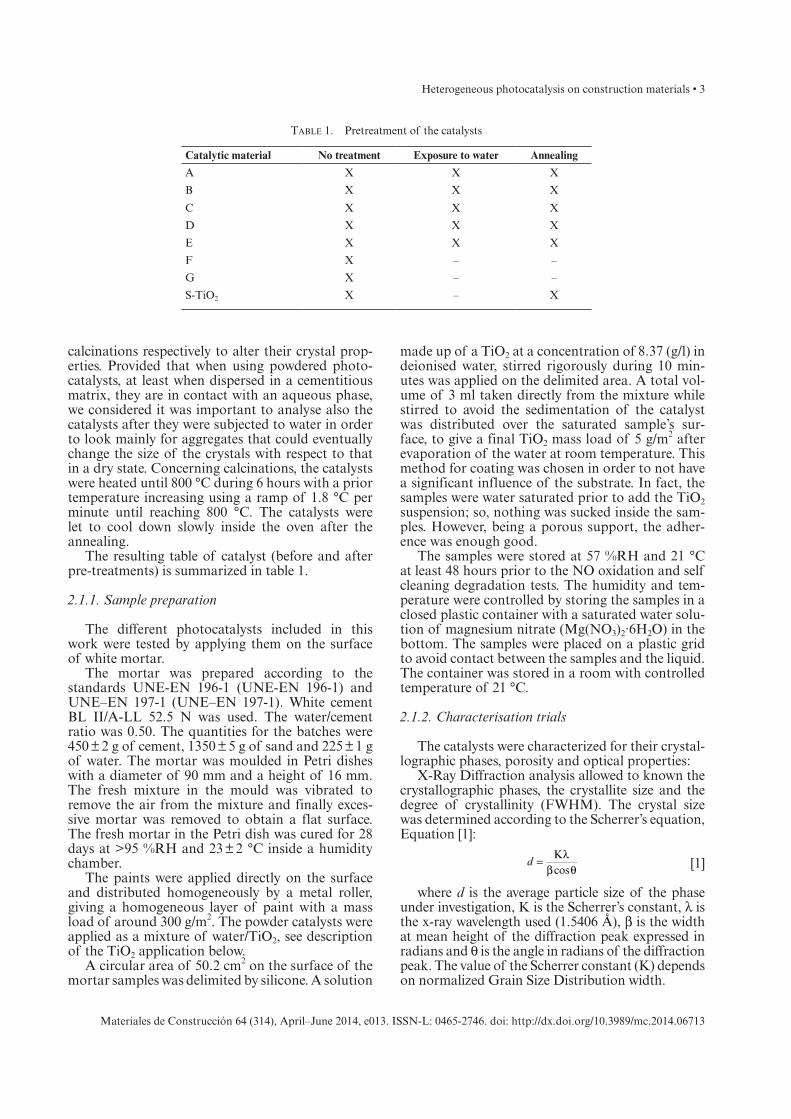
Table 1. Pretreatment of the catalysts
Catalytic material No treatment Exposure to water Annealing
A X X X
B X X X
C X X X
D X X X
E X X X
F X – –
G X – –
S-TiO2 X – X

4 • N. Bengtsson et al.
Materiales de Construcción 64 (314), April–June 2014, e013. ISSN-L: 0465-2746. doi: http://dx.doi.org/10.3989/mc.2014.06713
Surface area measurements were made by BET multipoint method, using N2-77K gas. The surface area was calculated from the sorption isotherm data in the relative pressure range of 0.003 to 0.3. Pore volume and pores-size distribution were calculated according to the Barret-Joyner-Halenda (BJH) method, using data from the adsorption isotherm branch. The Harkins and Jura equation was used from calculating the thickness t of the adsorbed layer on the pore walls at every P/Po. UV-vis diffuse reflectance spectra, in the range from 200–900 nm, were used to determine the absorption properties and the band gap of the photocatalysts. The reflec-tance data was converted to the absorption coeffi-cient F(R) values according to the Kubelka–Munk equation (37) being F(R) equivalent to the absorp-tion coefficient. The band gap was calculated by plotting the modified Kubelka–Munk function, (F(R)·E)0.5 versus E the energy of exciting light and determining the band gap from where the tangent cuts the x-axis (38).
2.2. Degradation Trials
As mentioned previously the photocatalytic activity tests were NO removal and self cleaning of solid surfaces. The NOx oxidation test was based on a continuous flow reactor where the concentration of NO and NO2 in the outlet gas was continuously monitored during the gas phase heterogeneous pho-tocatalytic oxidation of NO in air by the tested cata-lyst. The procedure followed was a modification of the ISO standard (39) using recycled instead of a continuous flow, to be able to determine the kinetics of the decrease in the NOx content over time. For detailed description of the experimental procedure see (8). A kinetic approach was used establishing the reaction constants by different theoretic and experi-mental models.
The self-cleaning tests were designed to deter-mine the discoloration of compounds on the sur-face of the photocatalytic material. Two different
self-cleaning methods were preformed: on one hand, the UNI standard (40) as a basis, modified in some parts that evaluates the discoloration of Rhodamine B (red colored). On the other hand, the discoloration of a tobacco extract applied on the catalytic surface was evaluated. Tobacco extract was used for its complex mixture of organic compounds and for evaluating also the color of dirt most usu-ally found in real construction materials (brown). The tobacco solution was produced by leaching tobacco in deionized water during 24 hours before filtering the solid material. The remaining tobacco solution was applied on the sample of the surface and let to evaporate leaving a brownish film on the surface.
The colour measurements where done directly on the surface of the sample by a portable spectro-photometer. The results were expressed according CIELAB colour coordinate system. This sys-tem is based on three colour coordinates named L*, a* and b* forming a three-dimensional space. L* describes the brightness from black to white where 0 is black and 100 white, a* the colour from green (negative value) to red (positive value) and b* from blue (negative value) to yellow (positive value). To assess the colour change of the speci-mens due to photocatalysis process the three coor-dinates L*, a*, and b* were registered before and after the exposure to UV irradiation. Also these coordinates were measured before addition of solution in order to have the reference of the clean initial colour.
Rhodamine B was selected for its low sensibil-ity for UV-light, stability in a basic environment, high colorimetric sensibility and previous use in photocatalysts. The self-cleaning studies were also carried out investigated the discoloration of a to -bacco extract applied on the catalytic surface. Tobacco extract was used for its complex mixture of organic compounds, as tar and nicotine, whose brownish color is more representative of most real dirt in reality. The tobacco solution was produced
Table 2. Experimental conditions for the evaluation of the photocatalytic activity by NOx oxidation, and self-cleaning activity for the studied catalysts
Test NOx oxidation Rhodamine B Tobacco
Temperature ( °C) 21 20 20
Humidity (%RH) 62 50 50
Lamp Philips Actinic BL 15W 10 SLV Philips PL-S 9W/2P BLB Philips PL-S 9W/2P BLB
Irradiance (W/m2) 10 5 5
Catalyst load (g/m2) 5.0 5.0 5.0
Initial NO concentration (ppbv) 1000 – –
Initial NO2 concentration (ppbv) 50 – –
Initial RhB concentration (mol/m2) – 1.368E−4 –
Initial tobacco concentration (g/m2) – – 2.359
Heterogeneous photocatalysis on construction materials • 5
Materiales de Construcción 64 (314), April–June 2014, e013. ISSN-L: 0465-2746. doi: http://dx.doi.org/10.3989/mc.2014.06713
by leaching tobacco in deionized water during 24 hours before filtering the solid material. The remaining tobacco solution was applied on the sample of the surface and let to evaporate leaving a thin film of tobacco extract on the surface.
The photocatalytic activity of the studied catalysts was quantified under the same experimental condi-tions for all the catalysts. The parameters used for the NO oxidation, rhodamine B discoloration and tobacco discoloration are summarized in Table 2.
3. RESULTS AND DISCUSSION
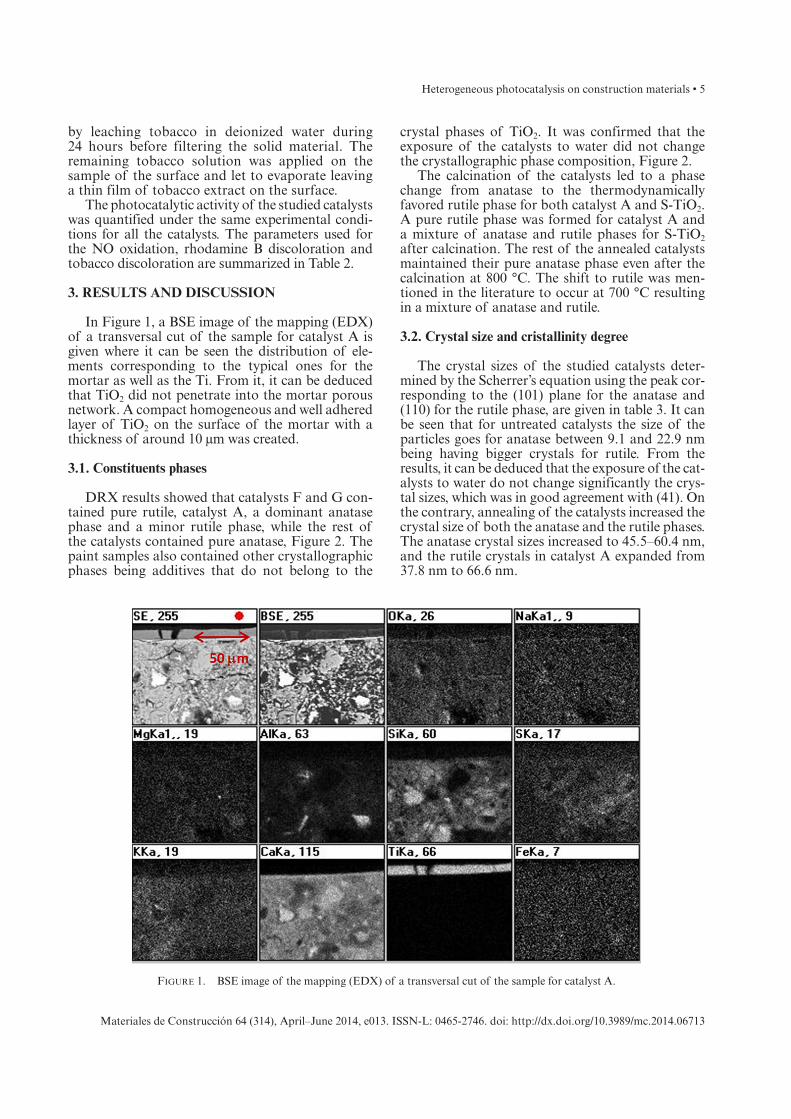
In Figure 1, a BSE image of the mapping (EDX) of a transversal cut of the sample for catalyst A is given where it can be seen the distribution of ele-ments corresponding to the typical ones for the mortar as well as the Ti. From it, it can be deduced that TiO2 did not penetrate into the mortar porous network. A compact homogeneous and well adhered layer of TiO2 on the surface of the mortar with a thickness of around 10 μm was created.
3.1. Constituents phases
DRX results showed that catalysts F and G con-tained pure rutile, catalyst A, a dominant anatase phase and a minor rutile phase, while the rest of the catalysts contained pure anatase, Figure 2. The paint samples also contained other crystallographic phases being additives that do not belong to the
crystal phases of TiO2. It was confirmed that the exposure of the catalysts to water did not change the crystallographic phase composition, Figure 2.
The calcination of the catalysts led to a phase change from anatase to the thermodynamically favored rutile phase for both catalyst A and S-TiO2. A pure rutile phase was formed for catalyst A and a mixture of anatase and rutile phases for S-TiO2 after calcination. The rest of the annealed catalysts maintained their pure anatase phase even after the calcination at 800 °C. The shift to rutile was men-tioned in the literature to occur at 700 °C resulting in a mixture of anatase and rutile.
3.2. Crystal size and cristallinity degree
The crystal sizes of the studied catalysts deter-mined by the Scherrer’s equation using the peak cor-responding to the (101) plane for the anatase and (110) for the rutile phase, are given in table 3. It can be seen that for untreated catalysts the size of the particles goes for anatase between 9.1 and 22.9 nm being having bigger crystals for rutile. From the results, it can be deduced that the exposure of the cat-alysts to water do not change significantly the crys-tal sizes, which was in good agreement with (41). On the contrary, annealing of the catalysts increased the crystal size of both the anatase and the rutile phases. The anatase crystal sizes increased to 45.5–60.4 nm, and the rutile crystals in catalyst A expanded from 37.8 nm to 66.6 nm.
Figure 1. BSE image of the mapping (EDX) of a transversal cut of the sample for catalyst A.

6 • N. Bengtsson et al.
Materiales de Construcción 64 (314), April–June 2014, e013. ISSN-L: 0465-2746. doi: http://dx.doi.org/10.3989/mc.2014.06713
The full width at half maximum (FWHM), related with crystallinity and the size of grain), for the same peaks that those taken for determining the size, are given in table 4. It could be said that smaller the FWHM of the peaks, better the crystallinity degree. From the variation in the FWHM, it can be deduced that water exposure increases slightly the degree of crystallinity, being this increase very important after calcinations of the catalysts.
3.3. Optical properties
3.3.1. Absorbance UV-vis
The absorbance spectra were performed for every catalyst without pretreatment and for two of the cal-cinated catalysts (A and S-TiO2). All the catalysts absorbed light in the UV spectra, for some of them in the near UV and for S-TiO2 into the visible light region slightly above 500 nm, Figure 3. The amount of absorbed light differed between the materials. The integrated absorbance over the wavelengths 200–900 nm proved a small difference between the studied catalysts with values from 212 to 280 nm, (see table 5). In the photocatalytic experiments the UV light used emits radiation from 350 to 400 nm and therefore it was more proper to compare the absorption in the range of these wavelengths. This comparison give highest absorption for the catalysts: F, G, S-TiO2 and the calcined samples of S-TiO2 and catalyst A that absorbed in higher wavelengths com-pared to the rest of the catalysts. The absorption at higher wavelengths was justified by the XRD results that revealed the presence of rutile in these mate-rials except for S-TiO2. The higher absorption of S-TiO2 was regarded to the visible light absorption
Figure 2. XRD spectra for the untreated, washed and calcined catalysts: A, B, C, D, E, F, G and S-TiO2.
Table 4. FWHM for the untreated, water exposed and annealed catalysts, for the anatase (peak 101) and rutile (110) phases
Catalyst
Anatase: FWHM Rutile: FWHM
Untreated Water exposure Calcined Untreated Water exposure Calcined
A 0.380 0.347 – 0.234 0.213 0.133
B 0.891 0.703 0.191 – – –
C 0.451 0.434 0.169 – – –
D 0.422 0.391 0.144 – – 0.0058
E 0.954 0.760 0.152 – – –
F – 0.255
G – 0.169
S-TiO2 0.600 0.150 – 0.11
Table 3. Crystal size for the untreated, water exposed and annealed catalysts, for the anatase (peak 101) and rutile (110) phases
Catalyst
Anatase: Crystal size (nm) Rutile Crystal size (nm)
Untreated Water exposure Calcined Untreated Water exposure Calcined
A 22.9 23.2 – 37.8 38.3 66.6
B 9.7 9.3 45.5 – – –
C 19.3 18.7 51.4 – – –
D 20.7 20.5 60.4 – – 130.2
E 9.1 8.5 57.2 – – –
F – 34.8
G – 52.7
S-TiO2 14.6 56.8 – 79.1

Heterogeneous photocatalysis on construction materials • 7
Materiales de Construcción 64 (314), April–June 2014, e013. ISSN-L: 0465-2746. doi: http://dx.doi.org/10.3989/mc.2014.06713
properties caused by doping (S, C, N) (36). The vis-ible light absorption was highest for S-TiO2 having the highest absorption in the range 401–900 nm.
3.3.2. Band gap determination
The band gap was calculated by plotting the modified Kubelka–Munk function, (F(R)·E)0.5 versus E the energy of exciting light and determin-ing the band gap from where the tangent cuts the x-axis (37). The numerical values of the band gap for the untreated and calcined catalysts are given in Table 6.
Visible light detectable to human eye starts from 390 nm and the band gaps corresponding to visible light can be seen for the catalysts: F, G, S-TiO2 and the calcined samples of S-TiO2 and A. This was in accordance with the highest absorbing catalysts in the range 350–400 nm given in Table 6.
The band gap obtained for the different catalyst in function of their crystal size is given in Figure 4. First of all, it has to be remarked that the catalyst presented here are different materials even though all of them are TiO2 based. So, the typical trend of the band gap as a function of the particle size shoud not primarily
expected. On the other hand, QSE occur for semicon-ductor particles on the order of 1–10 nm in size, even though (42) found that for anatase, there was almost no variation of the band gap energy with size down to 7.5 nm. In this research two catalysts could eventu-ally experiment QSE: the powdered catalysts B and E, both slightly below 10 nm and both are having the highest band gap. Catalysts A, C and D, in their ana-tase phases, have band gaps higher than the theoret-ical value for this phase while the opposite takes place for S-TiO2. In the case of S-TiO2, as it is a homemade material it is possible to known the reason: it is a co-doped catalyst. Rutile catalyst, having higher sizes are all of them very close to the theoretical values, with the exception of calcined S-TiO2, red shifted due again to doping. After annealing, both catalysts exhibited a reduction in the band gap. In the case of catalyst A anatase converts to rutile, and the corresponding band gap is the theoretical one for rutile.
3.4. Microstructure
Figure. 5 presents the N2 adsorption isotherms of the catalysts without and after the water treatment and annealing. For untreated materials, catalyst B and E, the isotherms are of Type II, indicating an indefi-nite multi-layer formation after completion of the monolayer and are found in adsorbents with a wide distribution of pore sizes. The rest of catalysts present Type III isotherms, obtained when the amount of gas adsorbed increases without limit as its relative satura-tion approaches unity. The exposure of the catalysts to water did not show an influence on the isotherms, except for catalyst A where adsorption was higher at the highest partial pressures than in the case of untreated catalyst. The heat treatment of the catalysts: A, D and S-TiO2 to 800 °C led to a collapse of the porous structure and a decrease in the adsorbed vol-ume indicating a less porous material. This collapse due to heating was also proved by Puddu et al. (35).
Figure 3. Absorbance spectra of the different photocatalysts.
Table 5. Integrated UV-VIS absorbance of the studied catalysts (a.u nm)
Catalyst350–400
nm200–400
nm200–900
nm401–900
nm
A 23.7 248 253 5
B 18.1 270 279 9
C 22.0 260 275 15
D 20.1 249 267 18
E 17.1 271 281 10
F 44.7 209 222 13
G 46.6 228 263 35
S-TiO2 38.9 220 273 53
A Calcined 52.1 255 274 19
S-TiO2 calcined 42.9 174 212 38
Table 6. Calculated band gap for the studied catalysts (calcined samples to 800 °C)
CatalystBand gap
(eV)Corresponding wavelength
(nm)
A 3.30 376
B 3.36 369
C 3.29 377
D 3.30 376
E 3.35 370
F 3.02 411
G 3.01 412
S-TiO2 3.06 405
A calcined 3.01 412
S-TiO2 calcined 2.93 423

8 • N. Bengtsson et al.
Materiales de Construcción 64 (314), April–June 2014, e013. ISSN-L: 0465-2746. doi: http://dx.doi.org/10.3989/mc.2014.06713
The pore size distribution (Figure 6), indicates that catalysts B, C, D and E presents a type of dis-tribution with a maximum, at very small sizes for B and E (around 2 nm) and at around 12 nm for catalysts C and D. Catalyst A presents a mono-tonic trend growing as the size increase and all the po rosity for S-TiO2 is below 20 nm. When submitted to water, the pore volume and average pore diameter were neither affected except in the case of catalyst
A, that increased the amount of bigger pores with a ma ximum at around 85 nm. This change could be due to the more tight packing of particles causing formation of intra particle space in the measuring range of N2 adsorption. Pore size distribution after calcination of the catalysts demonstrated a total collapse of the porous network. The annealing dra-matically decreased the pore volume for catalysts A, D and S-TiO2 from 0.17 to 0.022 cm3/g, 0.31 to 0.041 cm3/g and 0.062 to 0.0031 cm3/g respectively.
In table 7, a summary or these results is presented, where the BET area SBET is also given. Highest spe-cific surface area SBET was found for the catalysts B and E with areas above 300 m2/g, well in correspon-dence with their small crystal size. In agreement with the behavior on crystal size, the water treatment did not produce any significant change in the BET area of the studied catalysts (Figure 7). The heat treat-ment reduced the SBET surface to 15% for catalyst A and 10% for catalyst D compared to the surface area of the untreated catalyst.
3.5. Photocatalytic Efficiency
The photocatalytic activity expressed as NOx concentration (NO and NO2) over time for the dif-ferent studied catalysts is given in figure 8. It was revealed that the presence of the catalyst reduce
Figure 4. Band gap as a function of the crystal size. Horizontal continuous and discontinuous lines are the theoretical
band gap values for anatase and rutile respectively.
Figure 5. Isotherm diagrams of the studied catalyst before and after washing with deionised water and after calcination. (The S-TiO2 catalyst was not washed). For the units of the Y axis, the volume absorbed in Standard Temperature and Pressure conditions.

Heterogeneous photocatalysis on construction materials • 9
Materiales de Construcción 64 (314), April–June 2014, e013. ISSN-L: 0465-2746. doi: http://dx.doi.org/10.3989/mc.2014.06713
the concentration of NO over time compared to an inactive sample not containing catalyst. The cata-lysts F, G and S-TiO2 did not demonstrate photo-catalytic activity. The concentration of NO after 120 minutes of radiation and exposure to the photocata-lytic active materials was reduced from 1000 ppb to
39–175 ppb. The highest NO oxidation rate was seen for catalyst B that also demonstrated the highest formation of NO2. The annealing of the catalysts A and the home made S-TiO2 decreased the activity for the catalyst A and no significant change was seen for the S-TiO2 being considered as inactive.
Figure 6. Pore diameter distribution for the untreated catalysts. a) Untreated catalysts, b) washed catalysts, c) calcined catalysts.
Table 7. Microstructure parameters for the different catalysts before and after the treatments
Catalyst Treatment SBET (m2/g) Pore volume (cm3/g)a Pore diameter (nm)b
A Untreated 49.9 0.167167 13.38
Exposed to water 51.49 0.416103 32.32
Calcined 7.27 0.02234 12.29
B Untreatedw 311.8 0.350614 4.51
Exposed to water 311.1 0.356796 4.58
C Untreated 60.3 0.248026 16.44
Exposed to water 59.31 0.250779 16.91
D Untreated 75.8 0.304871 16.08
Exposed to water 76.14 0.313132 16.44
Calcined 7.84 0.041337 21.09
E Untreated 320.2 0.369515 4.61
Exposed to water 313.1 0.354598 4.52
S-TiO2 Untreated 24.5 0.061500 13.87
Calcined 0.505 0.003102 24.59
a Single Point Total Pore Volume of pores less than 218.16 nm Diameter at P/Po 0.99114583.b Average Pore Diameter (4V/A by BET).

10 • N. Bengtsson et al.
Materiales de Construcción 64 (314), April–June 2014, e013. ISSN-L: 0465-2746. doi: http://dx.doi.org/10.3989/mc.2014.06713
The results for the rhodamine B and tobacco deg-radation were expressed as “a” and = +v a b2 2 and, respectively as a function of the irradiation time for
the studied catalysts before and after the heat treat-ment. The results are given in Figure 9.
The photocatalytic activity of the different tested catalysts determined by rhodamine B degradation over time demonstrated that the presence of the catalyst reduced in higher content the concentration of rhodamine B over time compared to the sample not contained catalyst. The decrease in colour of the sample not containing catalysts was caused by photo-oxidation of the colorant. Very low activity was seen for the catalysts F, G and S-TiO2 conclud-ing low or absence of photocatalytic activity. The annealing of catalyst A and S-TiO2 reduces the reaction rate indicating a lower ac tivity for both catalysts. The photocatalytic activity determined by tobacco degradation over time demonstrated that the presence of the catalyst reduce in higher content
Figure 7. SBET area as a function of the crystal size.
Figure 8. Photocatalytic activity expressed as NOx concentration (NO and NO2) over time for the different studied catalysts.
Figure 9. Photocatalytic activity results for the rhodamine B and tobacco degradation.

Heterogeneous photocatalysis on construction materials • 11
Materiales de Construcción 64 (314), April–June 2014, e013. ISSN-L: 0465-2746. doi: http://dx.doi.org/10.3989/mc.2014.06713
the concentration of tobacco over time compared to the sample not containing catalyst. Very low activity was seen for the catalysts F and G concluding low or absence of photocatalytic activity. The annealing of catalyst A and S-TiO2 reduced the reaction rate indicating a lower activity for both catalysts.
The NO oxidation kinetics was estimated by a first order reaction, presented in its integrated form in Equation [2].
= ⋅ − ⋅C C e k t0
NO [2]
where: C0 is the initial NO concentration (ppb) t the time (min) and kNO the reaction rate constant (min−1).
For self-cleaning the expression of the degra-dation was fitted also to simple elemental order reactions of nth order [equation 3]. The best fit-ting of the results to this equation resulted to be of n = 50 for rhodamine and n = 5 for tobacco. It is important to remark that these values for n, especially for rhodamine B do not have any physi-cal sense and therefore the values for “k” obtained cannot be considered as reaction kinetic constants
but empirical fitting constants that allow making comparison in a simple manner.
=− ⋅ ⋅ +
− ⋅
( )
−
−
C
n k tn C
1
( 1)1
( 1) n
n
0( 1)
1( 1)
[3]
For rhodamine B, The efficiency for catalysts F, G, the home made catalyst S-TiO2 calcined at 800 °C could not be adjusted to equation 3.
The constants “k” so obtained are given in figure 10 and the variance explained, R2, is given in Table 8. It is remarkable that the same catalyst demonstrated different activity depending on the test used for its evaluation. Catalyst B was the most active catalyst determined by the NO oxidation and the tobacco discoloration tests. The opposite trend was seen when the activity was determined by the rhodamine B degradation where catalyst B was the less active material. The annealing of catalyst A demonstrates an important decrease in activity both for NO oxi-dation and for the tobacco discoloration, while the discoloration of rhodamine B was not affected
Figure 10. Comparison of the photocatalytic efficiency between the studied catalysts determined by a) NO oxidation, b) rhodamine B discoloration and c) tobacco discolouration. *The k values of the rhodamine B discoloration are multiplied
by 1.1065 to achieve values above 1 for the logarithmic scale of the graph.

12 • N. Bengtsson et al.
Materiales de Construcción 64 (314), April–June 2014, e013. ISSN-L: 0465-2746. doi: http://dx.doi.org/10.3989/mc.2014.06713
by the annealing. The annealing of S-TiO2 decreases the activity for NO oxidation, but increased for the tobacco discoloration.
The so obtained constants are going to be used from now to express the photocatalytic activity
3.6. Influence of the properties of the catalysts on the activity
The influence of the crystallographic proper-ties of the catalysts on the photocatalytic activity depending on the crystal size of both anatase and rutile is given in Figures 11 and 12 respectively. No clear relation has been deduced between the activity and the size of the crystals, neither for anatase or rutile, even though for pure anatase a trend increas-ing the activity when increasing the size of crystal is noticeable, mainly for Rhodamine B. The majority of the pure anatase phase catalysts had better activ-ity than pure rutile catalysts for the NO oxidation and tobacco discoloration.
The crystalline degree expressed as Full Width at Half Maximum (FWHM) of the diffraction peaks,
for anatase and rutile, and its influence of the photo-catalytic activity for NOx oxidation and rhodamine B and tobacco discoloration is given in figure 12, where it can be seen that even though a clear rela-tionship cannot be made, the tendency is to increase the efficiency as cristallinity decrease.
Anatase and rutile were expected to exhibit a syn-ergetic effect explained by the fact that rutile acts as an electron sink by receiving electrons produced by the charge separation on the anatase phase that inhibits recombination of electrons and holes in the bulk allowing them to migrate to the surface (35). However, this effect was not detected in these results. The catalysts containing both anatase and rutile (points joined in the graphs through two headed arrows) were not more efficient than that containing pure anatase. As a general trend, pure rutile demon-strated the lesser active behavior. The phase transfer from anatase to rutile during calcination caused a drop in photocatalytic activity explained as due to accelerated growth of crystallites by provided heat during the phase transfer leading to the reduction of the surface area.
Table 8. Variance explained, R2 in the different fittings of the results to equation 3
CatalystFitting NO n = 1
R2Fitting RhB n = 50
R2Fitting Tobacco n = 50
R2
A 0.994 0.998 0.980
B 0.995 0.995 0.997
C 0.998 0.993 0.988
D 0.998 0.881 0.979
E 0.999 0.994 0.395
F 0.968 – 0.362
G 0.991 – 0.902
S-TiO2 0.963 0.823 0.751
S-TiO2 calcined 0.988 – 0.995
A calcined 0.996 0.969 0.992
Figure 11. Influence of the crystal size of anatase and rutile on the photocatalytic degradation of a) NO and b) rhodamine B and tobacco. Two headed arrows join the points corresponding to the same catalyst composed of anatase and rutile.

Heterogeneous photocatalysis on construction materials • 13
Materiales de Construcción 64 (314), April–June 2014, e013. ISSN-L: 0465-2746. doi: http://dx.doi.org/10.3989/mc.2014.06713
Figure 12. Influence of the FWHM (full width height medium) of anatase and rutile on the photocatalytic degradation of a) NO and b) rhodamine B and tobacco. Two headed arrows join the points corresponding to the same catalyst composed of anatase and rutile.
Figure 13. Influence of several microstructure properties of the catalysts on the k for NO, rhodamine B and tobacco: a–b) specific surface area SBET, c–d) pore diameter and e–f) pore volume.

14 • N. Bengtsson et al.
Materiales de Construcción 64 (314), April–June 2014, e013. ISSN-L: 0465-2746. doi: http://dx.doi.org/10.3989/mc.2014.06713
Figure 14. The influence of the band gap on the photocatalytic oxidation of a) NO and b) discoloration of rhodamine B and tobacco.
Figure 15. Influence of the absorbance of photons on the photocatalytic oxidation of NO, rhodamine B and tobacco discoloration. The type of test and the integration range of wavelengths are: a) NO–200–900 nm b) Rhodamine B and tobacco 200–900 nm c)
NO–200–400 nm d) Rhodamine B and tobacco 200–400 nm e) NO–401–900 nm f) Rhodamine B and tobacco 401–900 nm.
Heterogeneous photocatalysis on construction materials • 15
Materiales de Construcción 64 (314), April–June 2014, e013. ISSN-L: 0465-2746. doi: http://dx.doi.org/10.3989/mc.2014.06713
The influence of the microstructure properties of the catalysts in the values of efficiency expressed as k`s are presented in figure 13 (a–f). Specific sur-face area SBET was demonstrated to have a positive influence on the photocatalytic activity, for NOx (potential trend) and tobacco (linear trend). For Rhodamine B a relationship was not found. The pore diameter do not seems to be very influential even though it seems to be a negative linear trend for NO, while for the total pore volume, m3/g, the trends are quite similar than for the BET area.
Concerning band gap, the NO oxidation and tobacco discoloration demonstrated that an increase in bad gap increased the photocatalytic activity with the best fitting to potential relationships for NO oxidation and for tobacco, while no relation was found for Rhodamine (Figure 14). It was expected a high influence of the band gap of the catalysts on the photocatalytic activity; However, a smaller band gap permit the catalyst to absorb less energetic photons of longer wavelengths taking advantage of light in a wider spectrum of wavelengths. However, the results obtained in this research are not as sur-prising as UV light was used with sufficient energy to activate all the catalysts; so, as higher the band gap, higher red-ox power of the catalysts.
The radiation source emitted wavelengths be -tween 340 to 400 nm corresponding to band gap energies in the range of 3.1 to 3.65 eV indicating that the catalysts with band gap energies below 3.1 eV were not absorbing the full spectra of the light source. On the other hand a higher band gap might result in higher reduction or oxidation power for the photo generated electrons and holes that could explain the increase in activity.
The influence of the absorbance of photons by the catalysts for NO oxidation, rhodamine B and tobacco discoloration is presented in figure 15. The absorbance is given as the integrated number of photons absorbed by the photocatalytic material in the whole range registered covering both the ultra-violet and visible spectra, 200–900 nm, in the range of UV-light spectra 200–400 nm and in the visible spectra 401–900 nm.
The absorbance in the wave lengths 200–400 nm, corresponding to UVA with enough energy to acti-vate the studied catalysts demonstrated that an increase in absorbance increased the photocatalytic activity for the NO oxidation and tobacco discol-oration (Figure 15 c–d), in accordance with the behavior in relation with the band gap. Increases in absorbance in the visible light spectra decreased the activity for NO oxidation and tobacco discol-oration, (figure 15 e–f). The increased absorbance in the full spectra including ultraviolet and visible light enhanced the oxidation of NO and the discol-oration of rhodamine B and tobacco, Figure 15 a–b. It has to be pointed out that much more photons in the UV region were absorbed by all the catalysts,
including that specified as improved for visible light (S-TiO2, catalyst G), that in fact presented a reduced band gap and absorbed more protons in visible light than the others, (points marked inside a square in figures 15 e–f).
The fact that no clear trends are found for Rhodamine B could be attributed to the fact that degradation of RhB dye follows two competitive processes such as N-deethylation and destruction of conjugated structure (43, 44, 45). Therefore, for these different catalysts, the degradation mecha-nisms seem to be dependent on the catalysts.
4. CONCLUSIONS
This work has evaluated the effect of the prop-erties of the photocatalyst on the efficiency for degrading NOx and self cleaning (Rhodamine B and Tobacco extract). The efficiency has been com-pared on the basis of a constant k that for NO oxi-dation has the meaning of the kinetic constant for a first order reaction, while for self-cleaning are just empirical fitting constants without any other physical meaning, having obtained the following conclusions:
• The photocatalytic efficiency is dependent of the type of contaminant removed; the most active catalysts for one specific contaminant might be or not the least active for other compounds. So, there not seem to be “a universal best catalyst” for every contaminant. Therefore, from one iso-lated characteristic of a photocatalyst no gen-eral conclusions of its expected behavior can be extracted.
• In this research NO oxidation and tobacco extract follow similar trends according to most of the parameters studied; however, no clear relations have been found for Rhodamine B, which has been attributed to the two competi-tive processes for its degradation.
• Taking this into mind, two types of properties have been revealed as the most influents: optical and microstructural and textural properties of the catalysts
• If light of enough energy is available to excite the catalysts, as higher the band gap, higher the efficiency of the photocatalytic reactions, due to higher redox power, following a poten-tial trend.
• Concerning microstructure properties, the spe-cific surface area, SBET and the total pore volume behave in the way of increasing the photocata-lytic activity as increasing these parameters, according a potential trend for NOx and linear trend for tobacco degradation.
• Concerning the different crystal phases, the syn-ergetic effect of the combination anatase/rutile was not clearly detected in these results; pure

16 • N. Bengtsson et al.
Materiales de Construcción 64 (314), April–June 2014, e013. ISSN-L: 0465-2746. doi: http://dx.doi.org/10.3989/mc.2014.06713
rutile samples were fewer actives for all the con-taminants than that made of pure anatase and that combined anatase/rutile. The size of the crystals does not seem to have special relevance, not having detected in this research clear QSE. The degree of cristallinity (FWHM) seems to be more relevant, increasing the efficiency as the cristallinity decreases.
ACKNOWLEDGMENTS
The authors thank the Ministry of Economy and Competitivity the funding provided through the proj-ect BIA 2011–25653 ‘‘TELEPASSCLOR’’ granted within the Spanish National Plan of R + D + i.
REFERENCES
1. Fujishima, A.; Honda, K. (1972) Electrochemical Photolysis of Water at a Semiconductor Electrode. Nature, 238, 37–38. http://dx.doi.org/10.1038/238037a0.
2. Wrighton, M.S.; Ellis, A.B.; Wolczanski, P.T.; Morse D.L.; Abrahamson, H.B.; Ginley, D.S. (1976) Strontium titanate photoelectrodes. Efficient photoassisted electrolysis of water at zero applied potential. J. Am. Chem. Soc. 98, 2774. http://dx.doi.org/10.1021/ja00426a017.
3. Stirini A.; Cassese L.; Schiavi L. (2005). Measurement of benzene, toluene, ethylbenzene and o-xylene gas phase pho-todegradation by titanium dioxide dispersed in cementi-tious materials using a mixed flow reactor. Applied Catalysis B: Environmental 61, 90–97. http://dx.doi.org/10.1016/j.apcatb.2005.04.009.
4. Demeestere K.; Dewulf J.; Witte B.D.; Baeldens A.; Langenhove H.V. (2008) Heterogeneous photocatalytic removal of toluene from air on building materials enriched with TiO2. Building and Environment 43, 406–414. http://dx.doi.org/10.1016/j.buildenv.2007.01.016.
5. Maury A.; Demeestere K.; De Belie N.; Mäntylä T.; Levänen E. (2010). Titanium dioxide coated cementi-tious materials for air purifying purposes: Preparation, characterization and toluene removal potential, Building and Environment 45, 832–838. http://dx.doi.org/10.1016/j.buildenv.2009.09.003.
6. Cassar L. (2004) Photocatalysis of cementitious materials: Clean buildings and clean air. Materials Research Society 29, 328–331. http://dx.doi.org/10.1557/mrs2004.99.
7. Hüsken G.; Hunger M.; Brouwers H.J.H. (2009) Experimental study of photocatalytic concrete products for air purifica-tion. Building and Environment 44, 2463–2474. http://dx.doi.org/10.1016/j.buildenv.2009.04.010.
8. Bengtsson, N.; Castellote, M. (2010) Photocatalytic Activity for NO degradation by construction materials: Parametric study and multivariable correlations. Journal of Advanced Oxidation Technology, 13, 341–349.
9. De Melo J.V.S.; Trichês G. (2012) Evaluation of the influ-ence of environmental conditions on the efficiency of photocatalytic coatings in the degradation of nitrogen oxides (NOx). Building and Environment, 49, 117–123. http://dx.doi.org/10.1016/j.buildenv.2011.09.016.
10. Peruchon, L.; Puzenat, E.; Herrmann, J.M.; Guillard, C. (2009) Photocatalytic efficiencies of self-cleaning glasses. Influence of physical factors Photochemistry and Photobiology A: Chemistry, 8, 1040–1046.
11. Ruot, B.; Plassais, A.; Olive, F.; Guillot, L.; Bonafous, L. (2009) TiO2-containing cement pastes and mortars: Measurements of the photocatalytic efficiency using a Rhodamine B-based colourimetric test, Solar Energy 83, 1794–1801. http://dx.doi.org/10.1016/j.solener.2009.05.017.
12. Sapina, M.; Jimenez-Relinque, E.; Castellote, M. (2013) Control ling the Levels of Airborne Pollen: Can Heteroge neous Photocatalysis Help?, Environ. Sci. Technol. 47, 11711−11716.
13. Folli, A.; Pochard, I.; Nonat, A.; Jakobsen, U.H.; Shepherd, A.M.; Macphee, D.E. (2010) Engineering Photocata-lytic Cements Understanding TiO2 Surface Chemistry to Control and Modulate Photocatalytic Performances, J. Am. Ceram. Soc. 93, [10] 3360–3369 http://dx.doi.org/10.1111/j. 1551-2916.2010.03838.x.
14. Lucas, S.S.; Ferreira, V.M.; Barroso de Aguiar, J.L. (2013) Incorporation of titanium dioxide nanoparticles in mortars –Influence of microstructure in the hardened state proper-ties and photocatalytic activity, Cem. Concr. Res. 43, 112–120. http://dx.doi.org/10.1016/j.cemconres.2012.09.007.
15. Diamanti, M.V.; Lollini, F.; Pedeferri,M.P.; Bertolini, L. (2013) Mutual interactions between carbonation and titanium diox-ide photoactivity in concrete, Building and Environment 62, 174e181. http://dx.doi.org/10.1016/j.buildenv.2013.01.023.
16. Brus, L. (1984) Electron–electron and electron-hole inter-actions in small semiconductor crystallites: The size depen-dence of the lowest excited electronic state. J. Chem. Phys. 80, 4403–4409.
17. Brus, L. (1986) Electronic wave functions in semiconduc-tor clusters: experiment and theory. Phys. Chem. 90, [12] 2555–2560. http://dx.doi.org/10.1021/j100403a003.
18. Rino, J.P.; Studart, N. (1999) Structural correlations in titanium dioxide. Phys. Rev. B 59, 6643–6649.
19. Anpo, M.; Shima, T.; Kodama, S.; Kubokawa, Y. (1987) Photocatalytic hydrogenation of propyne with water on small-particle titania: size quantization effects and reaction intermediates. J. Phys. Chem. 91, 4305–4310. http://dx.doi.org/10.1021/j100300a021.
20. Kormann, C.; Bahnemann, D.W.; Hoffmann, M.R. (1988) Preparation and characterization of quantum-size tita-nium dioxide. J. Phys. Chem. 92, 5196–5201. http://dx.doi.org/10.1021/j100329a027.
21. Kavan, L.; Stoto, T.; Gratzel, M.; Fitzmaurice, D.; Shklover, V. (1993) Quantum-size effects in nanocrystaline semicon-ducting TiO2 layers prepared by anodic oxidative hydrolysis of TiCl3. J. Phys. Chem. 97, (37) 9493–9498. http://dx.doi.org/10.1021/j100139a038.
22. Serpone, N.; Lawless, D.; Khairatdinov, R.; (1995) Size Effects on the Photophysical Properties of Colloidal Anatase TiO2Particles: Size Quantization versus Direct Transitions in This Indirect Semiconductor?. J. Phys. Chem. 99, 16646–16654. http://dx.doi.org/10.1021/j100045a026.
23. Tanaka, K.; Lapule, M.F.V.; Hisanaga, T. (1991) Effect of crys-tallinity of TiO2on its photocatalytic action. Chem. Phys.Lett. 187, 73–76. http://dx.doi.org/10.1016/0009-2614(91)90486-S.
24. Maira, A.J.; Yeung, K.L.; Lee, C.Y.; Yue, P.L.; Chan, C.K.; (2000) Size Effects in Gas-Phase Photo-oxidation of Trichlo-roethylene Using Nanometer-Sized TiO2Catalysts. J. Catal. 192, 185–196. http://dx.doi.org/10.1006/jcat.2000.2838.
25. Almquist, C.B.; Biswas, P. (2002) Role of Synthesis Method and Particle Size of Nanostructured TiO2 on Its Photo-activity. J. Catal. 212, 145–156. http://dx.doi.org/10.1006/jcat.2002.3783.
26. Byrne, J.A.; Eggins, B.R.; Dunlop, P.S.M.; Linquette-Mailley, S. (1998) The effect of hole acceptors on the pho-tocurrent response of particulate TiO2 anodes. Analyst 123, 2007–2012. http://dx.doi.org/10.1039/a803885f.
27. Jang, H.D.; Kim, S.J.; Kim, S.K. (2001) Effect of Particle Size and Phase Composition of Titanium Dioxide Nanoparticles on the Photocatalytic Properties. J. Nanoparticle Res. 3, 141–147. http://dx.doi.org/10.1023/A:1017948330363.
28. Nam, H.J.; Amemniya, T.; Murabayashi, M.; Itoh, K. (2004) Photocatalytic Activity of Sol−Gel TiO2 Thin Films on Various Kinds of Glass Substrates: The Effects of Na+ and Primary Particle Size. J. Phys. Chem. B 108, 8254–8259. http://dx.doi.org/10.1021/jp037170t.
29. Zhang, Z.; Wang, C.C.; Zakaria, R.; Ying, J.Y. (1998) role of particle size in nanocrystalline TiO2-based photocatalysts. J. Phys. Chem. B 102, 10871–10878. http://dx.doi.org/10.1021/jp982948+.
30. Xu, N.; Shi, Z.; Fan, Y.; Dong, J.; Shi, J.; Hu, M.Z.C. (1999) Effects of Particle Size of TiO2 on Photocatalytic Degradation of Methylene Blue in Aqueous Suspensions. Ind. Eng. Chem. Res. 38, 373–379. http://dx.doi.org/10.1021/ie980378u.

Heterogeneous photocatalysis on construction materials • 17
Materiales de Construcción 64 (314), April–June 2014, e013. ISSN-L: 0465-2746. doi: http://dx.doi.org/10.3989/mc.2014.06713
31. Gerischer, H. (1995) Photocatalysis in aqueous solution with small TiO2 particles and the dependence of the quantum yield on particle size and light intensity. Electrochim. Acta, 40, 1277–1281. http://dx.doi.org/10.1016/0013-4686(95)00058-M.
32. Grela, M.A.; Colussi, A.J. (1996) Kinetics of Stochastic Charge Transfer and Recombination Events in Semiconduc-tor Colloids. Relevance to Photocatalysis Efficiency. J. Phys. Chem. 100, 18214–18221. http://dx.doi.org/10.1021/jp961936q.
33. Lin, H.; Huang, C.P.; Li, W.; Ni, C.; Ismat Shah, S.; Tseng, Y. (2006) Size dependency of nanocrystalline TiO2 on its opti-cal property and photocatalytic reactivity exemplified by 2-chlorophenol, Applied Catalysis B: Environmental, 68 1. http://dx.doi.org/10.1016/j.apcatb.2006.07.018.
34. Folli, A.; Pade, C.; Hansen, T.B.; De Marco, T.; Macphee, D.E. (2012) TiO2 photocatalysis in cementitious systems: Insights into self-cleaning and depollution chemistry, Cem. Concr. Res, 42, 539–548. http://dx.doi.org/10.1016/j.cemconres.2011.12.001.
35. Puddu, V.; Choi, H.; Dionysiou, D.D.; Li Puma, G. (2010) TiO2 photocatalyst for indoor air remediation: Influence of crystallinity, crystal phase, and UV radiation intensity on trichloroethylene degradation. Applied Catalysis B: Environmental, 94, 211–218. http://dx.doi.org/10.1016/j.apcatb.2009.08.003.
36. Bengtsson, N.; Castellote, M.; López-Munoz, M.; Cerro, L. (2009) Preparation of Co-doped TiO2 for Photocatalytic Degradation of NOx in Air under Visible Light. Journal of Advanced Oxidation Technologies, 12, 55–64.
37. G.F.A. Kortum, (1969) Reflectance Spectroscopy: Prin-ciples, Methods, Applications, New York. http://dx.doi.org/ 10.1007/978-3-642-88071-1.
38. Augugliario, V.; Kisch, H.; Loddo, V.; López-Munoz, M.; Márquez-Álvarez, C.; Palmisano, G.; Palmisano, F. Parrino, F.;
Yurdakal. S. (2008) Photocatalytic oxidation of aromatic alcohols to aldehydes in aqueous suspension of home pre-pared titanium dioxide: 2. Intrinsic and surface features of catalysts. Applied Catalysis A: General, 349, 189–197. http://dx.doi.org/10.1016/j.apcata.2008.07.038.
39. ISO 22197-1: Fine ceramics (advanced ceramics, advanced technical ceramics)–Test method for air-purification per-formance of semiconducting photocatalytic materials–Part 1: Removal of nitric oxide, 2007.
40. UNI 11259: Determinazione dell’attività fotocatalitica de leganti idraulici–Metodo della rodamina 2008.
41. Luo, Y.; Tai, W.S.; Seo, H.O.; Kim, K.; Kim, M.J.; Dey, N.K.; Kim, Y.D.; Choi, K.H.; Lim, D. (2010) Adsorption and Photocatalytic Decompositon of Toluene on TiO2 Surfaces. Catalysis Letters, 138, 76–81. http://dx.doi.org/10.1007/s10562-010-0369-1.
42. Monticone, S.; Tufeu, R.; Kanaev, A.V.; Scolan, E.; Sanchez, C. (2000) Quantum size effect in TiO2 nanopar-ticles: does it exist?, Applied Surface Science, 162–163, 565–570. http://dx.doi.org/10.1016/S0169-4332(00)00251-8.
43. Perez-Estrada, L.A.; Aguera, A.; Hernando, M.D.; Malato, S.; Fernandez, A. (2008) AR Photo degradation of malachite green under natural sunlight irradiation: kinetic and toxicity of the transformation products. Chemosphere 70, 2068–2075 http://dx.doi.org/10.1016/j.chemosphere.2007.09.008.
44. Fu, H.B.; Zhang, S.C.; Xu, T.G.; Zhu, Y.F.; Chen, J.M. (2008) Photocatalytic degradation of RhB by fluorinated Bi2WO6 and distributions of the intermediate products. Environ Sci Technol, 42, 2085–2091. http://dx.doi.org/10.1021/es702495w.
45. Natarajan, T.S.; Natarajan, K.; Bajaj, H.C.; Tayade, R.J. (2013) Enhanced photocatalytic activity of bismuth-doped TiO2 nanotubes under direct sunlight irradiation for deg-radation of Rhodamine B dye, J Nanopart Res, 15, 1669. http://dx.doi.org/10.1007/s11051-013-1669-3.


![Spectral Selective Solar Light Enhanced Photocatalysis ...Heterogeneous photocatalysis is an attractive method for air purification [6–9]. Light illumination of particulate metal](https://static.fdocuments.net/doc/165x107/5f9becb004b38228337a08ed/spectral-selective-solar-light-enhanced-photocatalysis-heterogeneous-photocatalysis.jpg)