Hershey, Pennsylvania
56
Dr. Randy West, P.E. Director / Research Professor Hershey, Pennsylvania 57 th Annual PAPA Conference
Transcript of Hershey, Pennsylvania

Dr. Randy West, P.E.Director / Research Professor
Hershey, Pennsylvania 57th Annual PAPA Conference

NCAT’s mission is to provide innovative, relevant and implementable research, technology development and education that advances safe, durable and sustainable asphalt pavements.

Outline– Pavement Economics Committee projects
• Limiting strain in pavement design• Educational program• Thinlays• IRI related to performance
– Update on the NCAT Test Track• MnROAD partnership
– performance testing for mix design and QC– pavement preservation

Pavement Economics Committee Projects
• Optimized Pavement Design• Determining Service Lives Based on IRI• Thinlay Pavement Preservation Guide• Educational Program• Best Practices for Determining the Life
Cycle Costs of Asphalt Pavements• Life Cycle Benefits of Premium Mixes

Pavement Engineering

6
Concept of Perpetual Pavement
No fatigue cracking or structural rutting if critical strains are kept below thresholds
Horizontal strains at bottom of AC layer
Vertical strains at top of subgrade

7
Perpetual Pavement Design For controlling bottom-up
fatigue cracking Calculated strain should be
lower than the 60th
percentile horizontal strain distribution
For controlling structural rutting Vertical strains at the 50th
percentile should be lower than 200 microstrain

8
Criteria validated with data from the NCAT Test Track and Perpetual Pavement Award sections

9
Validation of Horizontal Strain Distribution Criteria
0
10
20
30
40
50
60
70
80
90
100
0 100 200 300 400 500 600
Perc
entil
e
Predicted Tensile Strain (Microstrain)
Criteria IowaMontana OklahomaOklahoma 2 KentuckyVirginia MississippiTennessee
- Perpetual pavementsto the left
- TT sections (cracked) to the right

10
Validation of Vertical Strain Criteria
Pavement Strain at 50th Percentile
Iowa 76 microstrain
Montana 146 microstrain
Oklahoma 128 microstrain
Oklahoma 2 153 microstrain
Virginia 169 microstrain
Kentucky 188 microstrain
Mississippi 164 microstrain
Tennessee 162 microstrain
Vertical strains at the 50th percentile
for perpetual pavements are lower than 200
microstrain

11
Implementation of Limiting Strain Criteria
PerRoad is being updated to include these limiting strain criteria
by Dr. David Timm, Auburn Professor of Civil Engineering

12
Implementation of Limiting Strain Criteria
References NCAT report 15-05R: Refined Limiting Strain Criteria and
Approximate Ranges of Maximum Thicknesses for Designing Long-Life Asphalt Pavements
NCAT Research Synopsis 15-05R TRB Paper 17-02109
Set maximum AC thicknesses for flexible pavement designs


Benefits of Thin Asphalt Overlays
• Long life and low life-cycle cost!
• Safety / User satisfaction–Minimize traffic delays–Smooth surface–Restore skid resistance–No loose stones &
minimizes dust–Lower noise
• Structural–Maintain grade & slope–Withstands heavy traffic–Easy to maintain
• Sustainable–Recycled materials–Seals surface & no
binder run-off

Thin Overlay Guides
• NCHRP Synthesis 464• Thinlays for Pavement
Preservation – pending publication from NAPA
• Future FHWA Tech Brief: The Use of Thin Asphalt Concrete Overlays for Pavement Preservation

20
International Roughness Index (IRI) The only universal measure of pavement performance All states required to report IRI in HPMS The only common measure among all pavement
types: asphalt, concrete, composite, other
International Roughness Index Categories

21
NCAT Draft Report
REVIEW OF INITIAL SERVICE LIFE DETERMINATION IN
LCCA PROCEDURES AND IN PRACTICE

22
NCAT Report 16-031. INTRODUCTION
1.1 Background2. RIDE QUALITY AND PAVEMENT ROUGHNESS
2.1 Importance of Ride Quality to Traveling Public 2.2 Factors Related to Perceived Ride Quality
3. IMPACT OF PAVEMENT ROUGHNESS ON VEHICLE OPERATING COSTS 3.1 Fuel Consumption 3.2 Tire Wear 3.3 Maintenance and Repair 3.4 Oil Consumption 3.5 Depreciation
4. SUMMARY 5. REFERENCES
“not only do our customers want smooth roads for comfort, smooth roads cost less for both the owner/agency and the user”Mark Swandlund, FHWA

23
LCCA for Pavement Type Selection
23

24
LCCA Basics
𝑁𝑁𝑁𝑁𝑁𝑁 = 𝐼𝐼𝐼𝐼𝐼𝐼𝐼𝐼𝐼𝐼𝐼𝐼𝐼𝐼 𝐶𝐶𝐶𝐶𝐼𝐼𝐶𝐶𝐼𝐼.𝐶𝐶𝐶𝐶𝐶𝐶𝐼𝐼 + �𝑘𝑘=1
𝑁𝑁
𝐹𝐹𝐹𝐹𝐼𝐼𝐹𝐹𝐹𝐹𝐹𝐹 𝐶𝐶𝐶𝐶𝐶𝐶𝐼𝐼𝑘𝑘1
1 + 𝐼𝐼 𝑛𝑛𝑘𝑘− 𝑆𝑆𝐼𝐼𝐼𝐼𝑆𝑆𝐼𝐼𝑆𝑆𝐹𝐹 𝑁𝑁𝐼𝐼𝐼𝐼𝐹𝐹𝐹𝐹
11 + 𝐼𝐼 𝑛𝑛𝑒𝑒
PCI
Threshold
Option A Option B
Threshold
Time
Cost
Time
Rehab.
Cost
Time
Rehab. Rehab.
Salvage ValueSalvage Value
24

25
Based on LTPP DataPavement Age and Roughness at
First RehabilitationPavement
TypeNo. Pavement Age at
Rehabilitation (yrs)
Mean IRI prior to Rehabilitation
(in/mi)Asphalt 106 17.9 118.5
Concrete 44 24.0 146.5

Time to First Rehabilitation (Years) by Climatic Zone
Asphalt PavementsClimatic Zone No. Avg. Min. Max. Std. Dev. COVDry, Freeze 24 15.0 7.1 26.3 5.1 34.0%Dry, Non-freeze 23 19.7 7.8 27.0 4.6 23.5%Wet, Freeze 50 20.0 8.8 28.2 5.5 27.3%Wet, Non-freeze 109 16.8 7.8 28.9 5.3 31.8%
Concrete PavementsClimatic Zone No. Avg Min Max Std. Dev. COVDry, Freeze 10 23.8 15.8 31.3 5.8 28.4%Dry, Non-freeze 6 24.5 17.1 30.3 5.8 23.7%Wet, Freeze 80 23.5 14.7 35.4 5.8 24.7%Wet, Non-freeze 25 24.9 12.9 33.7 6.0 24.0%

IRI at First Rehabilitation by Climatic Zone
Climatic Zone No. Avg IRI (in/mi)
Min IRI (in/mi)
Max IRI (in/mi)
Std. Dev.
COV
Asphalt PavementsDry, Freeze 21 116 47 214 40 34%Dry, Non-freeze 20 82 47 137 24 30%Wet, Freeze 39 140 60 359 73 52%Wet, Non-freeze 86 106 30 260 47 44%
PCC PavementsDry, Freeze 9 117 73 228 47 40%Dry, Non-freeze 6 102 75 154 30 29%Wet, Freeze 56 138 48 261 46 33%Wet, Non-freeze 19 114 65 258 45 40%

Educational Program• Life Cycle Cost Analysis for Pavement Type Selection• Warm Mix Asphalt• Open-Graded Friction Courses• Using Recycled Materials• Thin Overlays• Perpetual Pavement Design

Pavement Test Track
• 46 Test Sections, 200 ft. each• Test sections are typically evaluated over
a three year period• 5 trucks each pulling 3 heavily loaded
trailers make 400 laps/day
Asphalt Pavement Proving Ground

Types of Experiments2. Surface expmts.
– rutting– friction– permeability– noise– albedo– durability (raveling)– top-down cracking
1. Structural expmts.– pavement design
• Perpetual Pavement• MEPDG models • Empirical – layer coef.
– contribution of non-traditional layers
• highly modified mixes• OGFC• recycled bases• stabilized subbase

• Eliminated the Restricted Zone• Identify polishing prone aggregates• Gravel works in SMA & OGFC• Relax F&E limit for SMA & OGFC
Refining Aggregate Specifications

APAI – 12/2/08
Findings Related to Mix Design
• Fine and coarse Superpave mixes perform similarly• Modified binders reduce rutting approximately 50%• Dense-graded mixes perform as well as SMA for
rutting resistance, but SMA is more durable• Lowering Ndesign does not lead to rutting
Fine-GradedCoarse-Graded
Gravel Limestone-SlagLimestone-Slag Gravel

33
•Track Conference – 2/10/09Indiana Low Air Voids Experiment
R² = 0.669
0
5
10
15
20
25
30
35
40
0.0 1.0 2.0 3.0 4.0 5.0
Rut D
epth
(mm
)
SGC Air Voids
45% RAP
PG 67-22

34
• Revised asphalt layer coefficient for ‘93 AASHTO Pavement Design
• Mechanistic-Empirical Pavement Design – Measured vs. predicted stresses – Seasonal effects on asphalt pavement layers– Compressive stresses in unbound layers– Traffic wander– Dual tires vs super-single tire– Speed vs strain / load pulse – Field fatigue thresholds– Calibration of transfer functions
Structural Analysis

Right Gauge
-300
-200
-100
0
100
200
300
400
500
0.5 0.7 0.9 1.1 1.3 1.5 1.7 1.9 2.1 2.3 2.5Time, sec
Long
tidin
al M
icro
stra
in

Oklahoma Perpetual Pavementon a weak subgrade
10” 14”
N8 Strain = 21.487e0.0335*Temperature
R2 = 0.96
N9 Strain = 11.496e0.0298*Temperature
R2 = 0.9217
0
200
400
600
800
1000
1200
1400
0 20 40 60 80 100 120 140Mid-Depth Temperature, F
Tens
ile M
icro
stra
in
N8 N9
14”
10”

Product Evaluations• WMA• High polymer mixes• Asphalt-rubber mixes• Thiopave• Trinidad Lake Asphalt• Fibers• Dual layer OGFC• Crack arresting mixes• High Friction Surface Treatments

Reclaimed Asphalt Pavement

High RAP Test Sections• Several experiments with 45 to 50% RAP
– Surface layers – benefit of using lower PG– All layers 50% RAP
• lower critical strains• sections outperformed companion virgin sections• essentially a Perpetual Pavement at 7 inches thick

Cold Central Plant Recycling
• RAP treated with foamed or emulsified asphalt• An excellent option for areas with excess RAP• Proven technology at NCAT Test Track and I-81 in
Virginia for very high traffic
Structural contribution of CCPR materials is estimated to be about 70% of HMA

Cold Central Plant Recycling
• Highly sustainable pavement technology• Low capital equipment investment

MnROAD + NCAT Partnership
Working together on national need research projects1. Validating cracking tests for balanced mix design2. Documenting the life cycle benefits of Pavement
Preservation Treatments


44
With the current volumetric mix design
system…Sulfur pellets
Recycled Shingles
Fractionated RAP
Recycled Tire Rubber Aramid & Polyolefin fibers
Recycling agents

45
Balanced Mix DesignCracking Resistance Rutting Resistance

Scope
NCAT Test Track• Top-down cracking
MnROAD• Low-temperature cracking
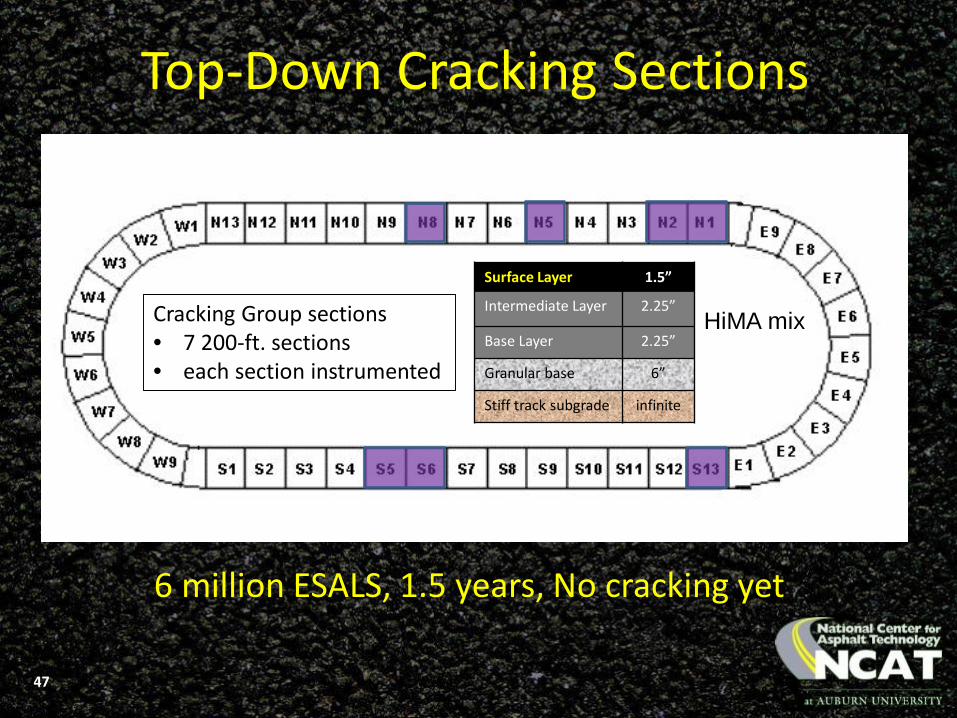
Top-Down Cracking Sections
47
Cracking Group sections• 7 200-ft. sections• each section instrumented
Surface Layer 1.5”
Intermediate Layer 2.25”
Base Layer 2.25”
Granular base 6”
Stiff track subgrade infinite
HiMA mix
6 million ESALS, 1.5 years, No cracking yet

48
SCB-LA
Energy Ratio
OT-NCAT
Cantabro
I-FIT OT-TX
Nflex Factor
BBF
DCTSVECD
Load Related Asphalt Mixture Cracking Tests

Test Section Layout
16
17
23
22
21
20
19
18
Built Aug.-Sept 2016No cracking yet

Pavement Preservation Experiments
• Warm and cold climates• Low and high traffic sections• At least 25 preservation treatment
sections on each roadway• High quality construction• Performance monitoring
MnROAD + NCAT Partnership

Pavement Preservation
Life Extending Benefit

Preservation on Lee County Road 159
•Thin Overlay x 8•Micro Surface x 6 •Chip Seal x 7•Fog Seal x 1•Crack Seal x 1•Control Section x 2•25 Total Sections
•County road•Low ADT, high % trucks•Empty in, loaded out•In yr = 1 Track day•Out yr = 6 Track days•Diverse condition•Varies by WP and dir
Built in 2012

Preservation on US 280
•53
Built in 2015
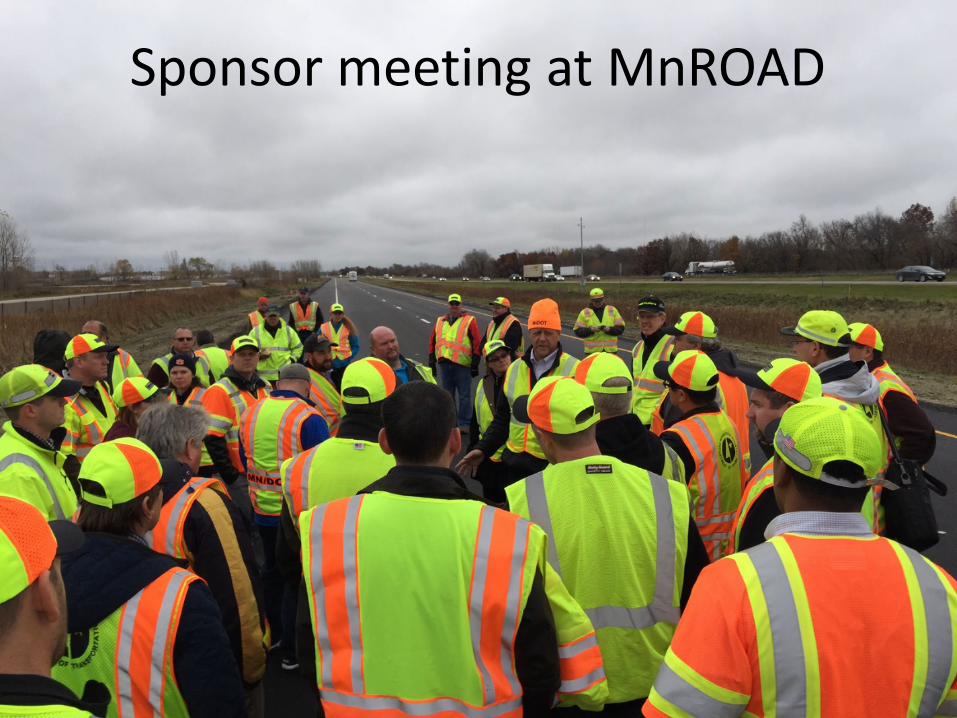
Sponsor meeting at MnROAD

• Leading Edge Workshop, Practical Implementation of Asphalt Mixture Performance Tests
• 1st Technical Session, Pavement Preservation • 2nd Technical Session, Asphalt Mixture Testing • AAPT/ISAP International Forum, Hot Recycling: State of
the Art and New Challenges • 3rd Technical Session, Asphalt Binder • 4th Technical Session, Asphalt Mixture • Symposium, Rubberized Asphalt Developments,
Opportunities, and Challenges • 5th Technical Session, Recycling • 6th Technical Session, Cracking
92nd AAPT Annual Meeting and Technical SessionsThe 2017 Annual Meeting will be held March 19-22, 2017 The Island Hotel, Newport Beach, California USA
Our 2017 venue
For the latest information please check our web site at: http://www.asphalttechnology.org
Thank You