Herschel DP Workshop – ESAC, Madrid, E, 2008 Dec 4 - page 1 HIFI Pipelines and Data Products Adwin...
28
Herschel DP Workshop – ESAC, Madrid, E, 2008 Dec 4 - page 1 HIFI Pipelines and Data Products HIFI Pipelines and Data Products Adwin Boogert, NHSC/IPAC, Pasadena, CA, USA Thanks to: Pat Morris, Carolyn McCoey, Jesus Martin-Pintado, Colin Borys, Russ Shipman, Steve Lord CH 3 CN at 765.5 GHz WBS-H
-
Upload
silvester-heath -
Category
Documents
-
view
218 -
download
0
Transcript of Herschel DP Workshop – ESAC, Madrid, E, 2008 Dec 4 - page 1 HIFI Pipelines and Data Products Adwin...

Herschel DP Workshop – ESAC, Madrid, E, 2008 Dec 4 - page 1
HIFI Pipelines and Data Products
HIFI Pipelines and Data ProductsAdwin Boogert, NHSC/IPAC, Pasadena, CA, USA
Thanks to: Pat Morris, Carolyn McCoey, Jesus Martin-Pintado, Colin Borys, Russ Shipman, Steve Lord
CH3CN at 765.5 GHz WBS-H
Herschel DP Workshop – ESAC, Madrid, E, 2008 Dec 4 - page 2
HIFI Pipelines and Data Products
Menu
•HIFI Instrument and AOTs
•HIFI Pipeline Structure (see also posters!)
•HIFI Level 0 → 1 Processing:
•Standard Product Generation (SPG; 'lights out')
•Interactively
•HIFI Level 1 → 2 Processing:
•Flagging Bad Data
•Deconvolution Double Side Band Spectra
•Standing Wave Removal
•Map Making
•...
•HIFI Data Products

HIFI: most powerful and versatile heterodyne instrument in space for observing molecular and atomic lines in FIR/submm at ultra-high spectral resolutions
• Single pixel on the sky
7 dual-polarization mixer bands• 5 x 2 SIS mixers: 480-1250 GHz, IF 4-8 GHz• 2 x 2 HEB mixers: 1410-1910 GHz, IF 2.4-4.8 GHz
14 LO sub-bandsLO source unit in commonLO multiplier chains
2 spectrometers-Auto-correlator (HRS) -Acousto-optical (WBS)
IF bandwidth/resolution- 2.4 and 4 GHz (in 2 polarizations)- 0.14, 0.28, 0.5, and 1 MHz- Velocity discrimination 0.1-1 km/s
Angular Resolution (w/ telescope):11”.3 (high-freq. end) to 40” (low-freq. end)
SensitivityNear-quantum noise limit sensitivity
Calibration Accuracy10% radiometric baseline, 3% goal
Handy summary: http://www.ipac.caltech.edu/Herschel/hifi/hifi_flyer_13_may_2008.pdf

Herschel DP Workshop – ESAC, Madrid, E, 2008 Dec 4 - page 4
HIFI Pipelines and Data Products
G
AOT IIISpectral Scans
NHSC/HIFI (01/142008)
AOT Schemes
AOT ISingle Point Observations
AOT IIMapping Observations
Reference scheme
1 - Position Switch
2 - Dual Beam Switch Optional continuum measurement
3 - Frequency Switch Optional sky measurement
4 - Load Chop Optional sky measurement
Mode I – 1Point-PositionSwitch
Mode I – 2DBS
FastChop-DBS
Mode I – 3FSwitch
FSwitch-NoReference
Mode I – 4LoadChop
LoadChop-NoReference
Mode II – 2DBS-Raster
FastChop-DBS-RasterDBS-Cross
FastChop-DBS-Cross
Mode II – 3OTF-FSwitch
OTF-FSwitch-NoReference
Mode II – 1OTF
Mode III – 2SScan-DBS
SScan-FastChop-DBS
Mode III – 3SScan-FSwitch
SScan-FSwitch-NoReference
Mode II– 4OTF-LoadChop
OTF-LoadChop-NoReference
Mode III– 4SScan-LoadChop
SScan-LoadChop-NoReference
Load-Chop modes for OTF Maps and SScans being tested, as FSwitch alternative.
See HIFI Observers’ Manual: http://herschel.esac.esa.int/Docs/HIFI/html/hifi_om.html

Herschel DP Workshop – ESAC, Madrid, E, 2008 Dec 4 - page 5
HIFI Pipelines and Data Products
Latest Performances (June ‘08)
T. De Graauw, D. Teyssier, et al.SPIE 2008 / Marseille
Updates expected this December (Thermal Vac)

Herschel DP Workshop – ESAC, Madrid, E, 2008 Dec 4 - page 6
HIFI Pipelines and Data Products
HIFI Pipeline Concept
Processing HIFI observations similar to ground-based telescopes with heterodynes, e.g., @ CSO, JCMT, IRAM, KOSMA
• Spectrometer Pipeline (level 0 → 0.5): initial processing backends• AOT mode independent• Each spectrometer and polarization separately: WBS-H, WBS-V, HRS-H, HRS-V• Users can run automatically and interactively, changing options, but unlikely need to
• Generic Pipeline (level 0.5 → 1): applying AOT mode-specific calibrations Spectrometer independent Intensity calibration using Hot/Cold loads Reference spectrum subtraction (on-off sky DBS, position switch, freq. throw, load) Users can run automatically and interactively, changing options, but unlikely need to
• Extended Pipeline (level 1 → 2): remove additional instrumental effects• e.g. Standing waves, Baseline offset and slope, Sideband convolution• Most interactive step for users

Herschel DP Workshop – ESAC, Madrid, E, 2008 Dec 4 - page 7
HIFI Pipelines and Data Products
Overall Pipeline Structure
Calibrations
Conversion to Dataframes and HK
(basic reformatting)
Raw Telemetry
Level 0 Timeline Product
Calibrations
Level 1 Product
AOT TypeSingle Point Spectral Scan
Spectral Map
Calibrations
Level 1 Product Level 1 Product
Ripple removalBaseline fitting
Band stitching, etc.
Level 2 Product
Map construction, etc.
Level 2 Product
Ripple removal, etc.
Level 2 Product
WBS H/V HRS H/V
Spectrometer Calibrations
Spectrometer BranchSpectrometer Branch
Generic BranchGeneric Branch
Level 0.5 Product SCIENCE

Herschel DP Workshop – ESAC, Madrid, E, 2008 Dec 4 - page 8
HIFI Pipelines and Data Products
Spectrometer Pipelines (Level 0 → 0.5)
Find and Flag Bad Pixels
Subtract Dark Current Levels
Non-Linearity Correction
Zero Level Subtraction
Frequency Calibration
Derive Attenuator Setting
Corrections
WBS Level 0 Product
Compute Offset and Power
Normalize Correlation Function
Correct for A to D Quantization
Gain Non-Linearity Power Correction
Hanning Smoothing
HRS Level 0 Product
Autocorrelation Funct. Symmetrization
Spectrum in Freq Domain and Scale
Generic Modules
Cal
Level 0.5 Product
Cal
Cal
Cal
Cal
Cal
UserUser
dark pixels?
interpolation methodtime domain?
WBS comb or HRS? Q
Cal
IF Non-Linearity Flux Correction
Cal
Cal Q
calibration file in/output
quality check file in/output
Green: optional user input
Sub-band Splitting

Herschel DP Workshop – ESAC, Madrid, E, 2008 Dec 4 - page 9
HIFI Pipelines and Data Products
Generic Pipeline (Level 0.5 →1)
Make OFF spectrum
Frequency drifts?
Apply hot/cold band pass: T
A* calibration
Data as expected for AOT mode?
Subtract reference spectrum
Tsys and band pass from Hot and Cold
Determine channel weights
Subtract OFF spectrum
average, smooth or fit to reduce noise in OFF data?
Q
drift tolerance [Hz/sec]?
Cal
Cal
weights from time, variance or Tsys
? smooth over channels?
ref spectrum? e.g. if one chop has line contamination
Cal
interpolation method? (OFF spectrum drift over time)
interpolation method? (band pass drift over time)
Cal
Cal
Cal
Cal
Level 0.5 Product:
frequency calibrated
Level 1 Product:
frequency and intensity
calibrated
Previous spectrometer
pipeline
Level 2 pipeline
Cal Q
calibration file in/output
quality check file in/output
Green: optional user input

Herschel DP Workshop – ESAC, Madrid, E, 2008 Dec 4 - page 10
HIFI Pipelines and Data Products
Extended Pipeline (Level 1 → 2)
Level 2 processing is most user-interactive. Several steps are optional.
Calpoint source or extended source calibration?
Frequency regridding
Baseline fitting
Sideband gain correction
TA'=l*TA*
Band stitching
Standing wave removal
OTF cube construction
Deconvolution
Spectrum averaging
TMB=TA’/MB
Cal
Cal
Cal
freq. grid, resolution? interpolation method?
model to fit?
sideband to correct?
Level 1 Product
Previous spectrometer and generic
pipelines
Level 2 Product
Science
Cal
or TA’/
Cal calibration file in/output Green: optional user input

Herschel DP Workshop – ESAC, Madrid, E, 2008 Dec 4 - page 11
HIFI Pipelines and Data Products
How to Run these Pipelines?•Pipelines generate level 0, 0.5, 1, and 2 products that can be retrieved from Herschel archive, including all calibration products. •Observers have all software and can run pipelines on lap/desktop: automatically, interactively, or with own algorithms. •Level 2 processing especially interactive, some steps are optional.•Extensive help on running pipeline available in HIPE, written in 'how-to' fashion.•See demos this afternoon by Carolyn McCoey (level 0 → 1 pipelines) and Steve Lord (level 2 deconvolution tool)
Pipeline definition
Pipeline “How To”

Herschel DP Workshop – ESAC, Madrid, E, 2008 Dec 4 - page 12
HIFI Pipelines and Data Products
Basic HIFI SPG pipeline form (selected with window->Show View->HifiPipeline and click on hifiPipeline in Tasks pane).
Data to be processed previously retrieved from Herschel Science Archive is dragged and dropped from ObservationContext in Variables pane on right.
Click on 'Accept' to run all pipelines or selection thereof.
HIPE: Running Pipeline 'Lights Off'

Herschel DP Workshop – ESAC, Madrid, E, 2008 Dec 4 - page 13
HIFI Pipelines and Data Products
Expert HIFI SPG pipeline form offers possibility of user-defined pipeline algorithms (written in jython).
HIPE: Running Pipeline 'Lights Off'

Herschel DP Workshop – ESAC, Madrid, E, 2008 Dec 4 - page 14
HIFI Pipelines and Data Products
HIPE: Interactive PipelineBoth spectrometer and generic pipelines can be run step-by-step. Allows for modification of parameters by user, though rarely necessary.Example: WBS dark subtraction: even and odd channels have different dark levels

Herschel DP Workshop – ESAC, Madrid, E, 2008 Dec 4 - page 15
HIFI Pipelines and Data Products
HIPE: Interactive PipelineWBS frequency calibration on comb spectrum, fitting Gaussians. Initial values from Cal file or user input.
If comb spectrum fit fails, equally good solution can be obtained using simultaneous HRS spectrum.Note: although user can intervene using HIPE form, pipeline will likely work fine in 99.9% of cases.

Herschel DP Workshop – ESAC, Madrid, E, 2008 Dec 4 - page 16
HIFI Pipelines and Data Products
HIPE: Interactive Pipeline•Generic pipeline somewhat more interactive than Spectrometer pipelines, although defaults will work well for almost all observations.
•Example doChannelWeights():
•Weight per channel can be calculated by entering indefinition box:
• 'integrTime': integration time• 'variance': variance in moving window• 'radiometric': integration time/T2
sys
•Result can be smoothed as function of channel using box car or Gaussian convolution.
•Note command-line equivalent in console window.
Herschel DP Workshop – ESAC, Madrid, E, 2008 Dec 4 - page 17
HIFI Pipelines and Data Products
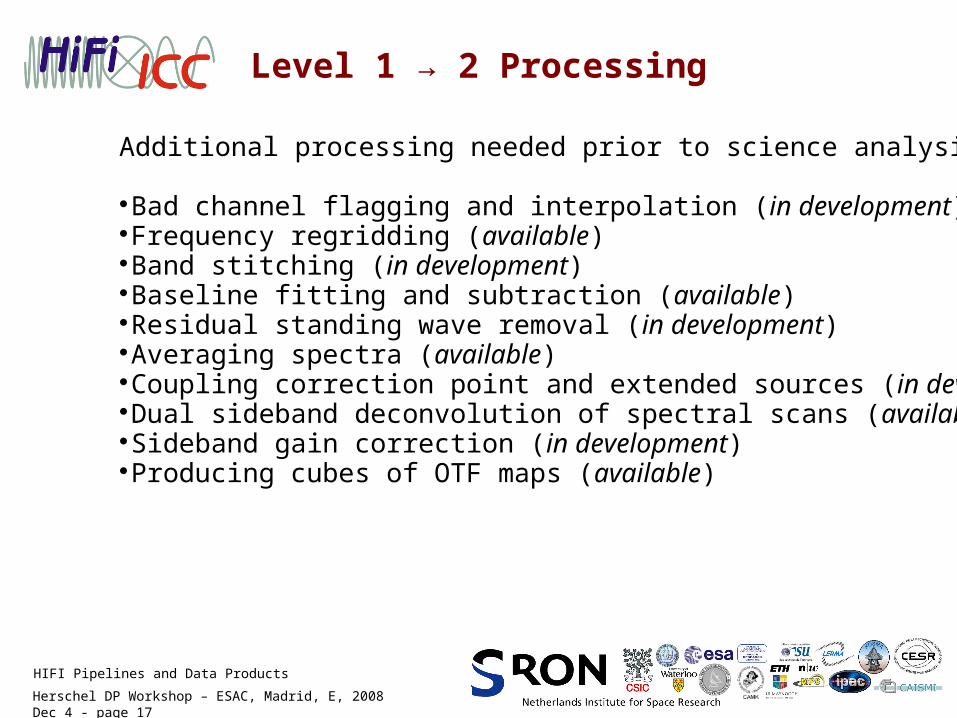
Level 1 → 2 Processing
Additional processing needed prior to science analysis (level 2):
Bad channel flagging and interpolation (in development)Frequency regridding (available)Band stitching (in development)Baseline fitting and subtraction (available)Residual standing wave removal (in development)Averaging spectra (available)Coupling correction point and extended sources (in development)Dual sideband deconvolution of spectral scans (available)Sideband gain correction (in development)Producing cubes of OTF maps (available)

Herschel DP Workshop – ESAC, Madrid, E, 2008 Dec 4 - page 18
HIFI Pipelines and Data Products
Level 1 → 2: Sideband Deconvolution
At any given LO frequency, two sidebands of 4 GHz IF coverage each (2.4 GHz bands 6+7), separated by 8-16 (4.8-9.6) GHz in sky frequencies are overlaid on top of each other in DSB spectrum, with mirrored freq. scales.
Sideband deconvolution especially important to spectrally complex regions.
HIPE deconvolution tool based on Comito & Schilke (2002) algorithm in X-CLASS for deconvolving ground-based observations.
See demo Steve Lord this afternoon0
T[K
]
20
0
Double sideband spectrum
800 [GHz] 850
0
T[K
]
35
800.0 [GHz] 804.
Synthetic Spectrum
LO
816.0 [GHz] 812.
T [
K]

Herschel DP Workshop – ESAC, Madrid, E, 2008 Dec 4 - page 19
HIFI Pipelines and Data Products
Level 1 → 2: Sideband DeconvolutionDeconvolved (SSB) result, methanol with HIFI in the lab, viewed in HIPE with TablePlotter.
HIPE GUI frontend (beta) for decon toolI/O and hooks to view intermediate results, fit statistics
See demo Steve Lord this afternoon
More pretty examples of real HIFI data in the Supplemental Slides

Herschel DP Workshop – ESAC, Madrid, E, 2008 Dec 4 - page 20
HIFI Pipelines and Data Products
Level 1 → 2: Standing Waves Removal
IF frequency [MHz]
ILT (worst case!)
•Standing wave removal needed for all HIFI AOTs, either as a residual (e.g. chopped/nodded spectra) or if OFF sky not taken with FSwitch or LoadChop modes.
•Robust sine wave fitting routine for ISO/SWS and Spitzer/IRS defringing available in IDL. Fits multiple sine waves, using Bayesian statistics. Little user interaction. Contains line blanking routine.
•Tool being developed in HIPE. May be used for PACS and SPIRE spectra as well.
Frequency [GHz]
Nor
mal
ized
Int
ensi
ty
Band 1A:
Band 1A
Nor
mal
ized
Int
ensi
ty

Herschel DP Workshop – ESAC, Madrid, E, 2008 Dec 4 - page 21
HIFI Pipelines and Data Products
Level 1 → 2: Standing Waves Removal
'Fringes'-diagnostic plot --- 2 vs frequency, with clear minimum (red)
Standing waves successfully removed in gas cell spectra. (residual) standing wave patterns likely different in space. However, algorithm very flexible! Initial guesses easily adjusted.•Bands 6+7 non-optical standing waves, non-sinusoidal. Strength and shape power-dependent. Well reproduced in laboratory spectra with similar power: remove empirically.

Herschel DP Workshop – ESAC, Madrid, E, 2008 Dec 4 - page 22
HIFI Pipelines and Data Products
Level 1 → 2: Map Making
Level 2 pipeline
produces data
cubes of OTF
maps, which can
be displayed in
HIPE.

Herschel DP Workshop – ESAC, Madrid, E, 2008 Dec 4 - page 23
HIFI Pipelines and Data Products
Level 1 → 2: Masking Bad Data
• Spurious response ('spurs') in some LO chains observed, arising from strong harmonics or oscillations in bias circuitry.
• Spurs may affect hot/cold calibrations, deconvolution solution, and spectral lines. • Spur detector will be included in pipeline, but user may also flag spectral ranges
Different spur types, e.g. up/down type, where spur has moved in frequency between calibration stepsSpur list generated by prototype spur detector

Herschel DP Workshop – ESAC, Madrid, E, 2008 Dec 4 - page 24
HIFI Pipelines and Data Products
Science Analysis Tools
Level 2 data ALL instrument signatures removed. Science analysis tools available for HIFI users:
HIPE has Spectrum Toolbox of Astrolib-like applications for Conveniently displaying maps, spectral scans: See Russ Shipman presentation
tomorrow Gaussian, polynomial fitting (and more functions), interactively and in scripts
Line intensity and shape fitting (outside HIPE): CASSIS http://cassis.cesr.fr/ (might be called within HIPE) MASSA http://www.damir.iem.csic.es/mediawiki-1.12.0/index.php/Portada#MASSA
Imaging tool (in HIPE) MADCUBA: http://www.damir.iem.csic.es/mediawiki1.12.0/index.php/Portada Regrid irregularly spaced data (time, position) to a regular grid Production monochromatic images, and cube of images. Different interpolation methods depending on desired spatial scale:
Nearest Neighbor (coarse but fast) Linear Interpolation with windowing, with selective distance weighting and filtering

Herschel DP Workshop – ESAC, Madrid, E, 2008 Dec 4 - page 25
HIFI Pipelines and Data Products
HIFI Data Products: ObservationContext
Pipelines produce “ObservationContext”, wrapping products of various pipeline levels, calibration files and meta data with observing mode, time, pointing, spacecraft velocity etc.:
TimelineProduct
ObservationContext ObservationContext
DataSets
Cal Products

Herschel DP Workshop – ESAC, Madrid, E, 2008 Dec 4 - page 26
HIFI Pipelines and Data Products
HIFI Data Products: TimelineProduct
• TimelineProduct is the fundamental container of spectra and metadata in ObservationContext
• At level 0 contains all observed spectra in time sequence including hot and cold loads, combs, on and off integrations
• At level 1 TimelineProduct cleaned from calibration data, and only science spectra remaining

Herschel DP Workshop – ESAC, Madrid, E, 2008 Dec 4 - page 27
HIFI Pipelines and Data Products
Individual integrations stored in TimelineProduct and user can list and view them in HIPE in several ways (see presentation by Russ Shipman tomorrow).
HIFI Data Products: TimelineProduct
Level 0.5 on-source Level 2

Herschel DP Workshop – ESAC, Madrid, E, 2008 Dec 4 - page 28
HIFI Pipelines and Data Products
Conclusions
• HIFI healthy, thermal vacuum (cold LO!) tests ongoing this and next week
• Pipelines in place, have been (and are being) extensively tested against various simulator and real-instrument data from various campaigns. Much effort going into level 2 software development.
• Pipelines can be run 'lights out' and interactively, step-by-step by users. User interaction most needed in level 1 → 2 pipeline.
• See pipeline and deconvolution demos this afternoon.