
Heritability and Cognitive Relevance of Structural Brain ...
11
© The Author(s) 2019. Published by Oxford University Press. This is an Open Access article distributed under the terms of the Creative Commons Attribution Non-Commercial License (http://creativecommons.org/ licenses/by-nc/4.0/), which permits non-commercial re-use, distribution, and reproduction in any medium, provided the original work is properly cited. For commercial re-use, please contact [email protected] Cerebral Cortex, May 2020;30: 3044–3054 doi: 10.1093/cercor/bhz293 Advance Access Publication Date: 14 December 2019 Original Article ORIGINAL ARTICLE Heritability and Cognitive Relevance of Structural Brain Controllability Won Hee Lee 1 , Amanda Rodrigue 2 , David C. Glahn 2 , Danielle S. Bassett 3,4,5,6,7 and Sophia Frangou 1 1 Department of Psychiatry, Icahn School of Medicine at Mount Sinai, New York, NY 10029, USA, 2 Tommy Fuss Center for Neuropsychiatric Disease Research, Department of Psychiatry, Boston Children’s Hospital, Harvard Medical School, Boston, MA 02115, USA, 3 Department of Bioengineering, School of Engineering and Applied Science, University of Pennsylvania, Philadelphia, PA 19104, USA, 4 Department of Electrical and Systems Engineering, School of Engineering and Applied Science, University of Pennsylvania, Philadelphia, PA 19104, USA, 5 Department of Neurology, Perelman School of Medicine, University of Pennsylvania, Philadelphia, PA 19104, USA, 6 Department of Psychiatry, Perelman School of Medicine, University of Pennsylvania, Philadelphia, PA 19104, USA and 7 Department of Physics and Astronomy, College of Arts & Sciences, University of Pennsylvania, Philadelphia, PA 19104, USA Address correspondence to Sophia Frangou, Department of Psychiatry, Icahn School of Medicine at Mount Sinai, 1425 Madison Avenue, New York, NY 10029, USA. Email: [email protected]. Abstract Cognition and behavior are thought to emerge from the connections and interactions among brain regions. The precise nature of these relationships remains elusive.Here we use tools provided by network control theory to determine how the structural connectivity profile of brain regions may shape individual variation in cognition. In a cohort of healthy young adults (n = 1066), we computed two fundamental brain regional control patterns, average and modal controllability, which index the degree of influence of a region over others. We first established that regional brain controllability measures were both reproducible and heritable. Regions with controllability profiles theoretically conducive to facilitating multiple cognitive operations were over-represented in higher-order resting-state networks. Finally, variation in regional controllability accounted for about 50% of interindividual variability in multiple cognitive domains. We conclude that controllability is a biologically plausible property of the structural connectome and provides a mechanistic explanation for how brain structural architecture may influence cognitive functions. Key words: cognition, controllability, diffusion magnetic resonance imaging, structural connectivity Introduction Among the most pressing and challenging questions in sys- tems neuroscience, and its application to psychiatry and neu- rology, is how the configuration of the human brain enables the emergence of cognition and behavior. Network neuroscience models the brain as a connectome—an intricate network of brain regions that synchronize their activity via anatomical and functional connections that can be mapped and quantitatively characterized (Bassett et al. 2018; Breakspear 2017). The precise
Transcript of Heritability and Cognitive Relevance of Structural Brain ...

© The Author(s) 2019. Published by Oxford University Press.This is an Open Access article distributed under the terms of the Creative Commons Attribution Non-Commercial License (http://creativecommons.org/licenses/by-nc/4.0/), which permits non-commercial re-use, distribution, and reproduction in any medium, provided the original work is properly cited.For commercial re-use, please contact [email protected]
Cerebral Cortex, May 2020;30: 3044–3054
doi: 10.1093/cercor/bhz293Advance Access Publication Date: 14 December 2019Original Article
O R I G I N A L A R T I C L E
Heritability and Cognitive Relevance of StructuralBrain ControllabilityWon Hee Lee1, Amanda Rodrigue2, David C. Glahn2,Danielle S. Bassett3,4,5,6,7 and Sophia Frangou1
1Department of Psychiatry, Icahn School of Medicine at Mount Sinai, New York, NY 10029, USA, 2Tommy FussCenter for Neuropsychiatric Disease Research, Department of Psychiatry, Boston Children’s Hospital, HarvardMedical School, Boston, MA 02115, USA, 3Department of Bioengineering, School of Engineering and AppliedScience, University of Pennsylvania, Philadelphia, PA 19104, USA, 4Department of Electrical and SystemsEngineering, School of Engineering and Applied Science, University of Pennsylvania, Philadelphia, PA 19104,USA, 5Department of Neurology, Perelman School of Medicine, University of Pennsylvania, Philadelphia, PA19104, USA, 6Department of Psychiatry, Perelman School of Medicine, University of Pennsylvania,Philadelphia, PA 19104, USA and 7Department of Physics and Astronomy, College of Arts & Sciences,University of Pennsylvania, Philadelphia, PA 19104, USA
Address correspondence to Sophia Frangou, Department of Psychiatry, Icahn School of Medicine at Mount Sinai, 1425 Madison Avenue, New York, NY10029, USA. Email: [email protected].
AbstractCognition and behavior are thought to emerge from the connections and interactions among brain regions. The precisenature of these relationships remains elusive. Here we use tools provided by network control theory to determine how thestructural connectivity profile of brain regions may shape individual variation in cognition. In a cohort of healthy youngadults (n = 1066), we computed two fundamental brain regional control patterns, average and modal controllability, whichindex the degree of influence of a region over others. We first established that regional brain controllability measures wereboth reproducible and heritable. Regions with controllability profiles theoretically conducive to facilitating multiplecognitive operations were over-represented in higher-order resting-state networks. Finally, variation in regionalcontrollability accounted for about 50% of interindividual variability in multiple cognitive domains. We conclude thatcontrollability is a biologically plausible property of the structural connectome and provides a mechanistic explanation forhow brain structural architecture may influence cognitive functions.
Key words: cognition, controllability, diffusion magnetic resonance imaging, structural connectivity
IntroductionAmong the most pressing and challenging questions in sys-tems neuroscience, and its application to psychiatry and neu-rology, is how the configuration of the human brain enablesthe emergence of cognition and behavior. Network neuroscience
models the brain as a connectome—an intricate network ofbrain regions that synchronize their activity via anatomical andfunctional connections that can be mapped and quantitativelycharacterized (Bassett et al. 2018; Breakspear 2017). The precise

Heritability and Cognitive Relevance of Structural Brain Controllability Lee et al. 3045
mechanisms that underpin structure–function relationships inthe brain remain the focus of intense research.
The application of graph theory has led to novel insightsinto the topological organization of the brain by providing newmathematical tools to model and quantify the pattern of inter-connections between brain regions (Bullmore and Sporns 2009).Graph theory analyses have demonstrated that the pattern ofanatomical connections of individual brain regions shows sig-nificant variation, which constitutes the main influence on thetypes of mental processes that can be supported (Misic andSporns 2016; Sporns et al. 2004). These mental processes arisefrom continuous changes in functional brain states, which aredefined as the vector of the magnitude of the neurophysiologicalactivity across brain regions at a single time point (Gu et al. 2015;Lynn and Bassett 2019). Network control theory is an emergingmultidisciplinary field of enquiry concerned with modeling howanatomical connectivity influences transitions between brainstates (Betzel et al. 2016; Gu et al. 2015; Tang and Bassett 2018).The underlying assumption is that transitions in brain states arecontrollable, meaning that they occur along trajectories aimingto attain a target brain state chosen for its utility in meetingcontextual demands (Gu et al. 2015; Lynn and Bassett 2019;Pasqualetti et al. 2014). It further posits that the anatomicalconnectivity of individual brain regions is critical in definingtheir controllability, which refers to the degree of their influ-ence in driving transitions towards a specific target brain state(Gu et al. 2015; Lynn and Bassett 2019). The controllability of abrain region is thus linked to its structural connectivity prop-erties which can constrain or support transitions between dif-ferent brain states. The controllability of each brain region canbe captured by two key metrics: average controllability (AC),which quantifies the capacity of a brain region to facilitatetransitions to easy-to-reach states, and modal controllability(MC), which quantifies the ease with which a brain region cansteer the brain into difficult-to-reach states (Gu et al. 2015; Lynnand Bassett 2019). The ease or difficulty of reachability of aspecific brain state reflects the number of the required inter-vening state transitions and the inferred cost associated withthese transitions (Gu et al. 2015; Pasqualetti et al. 2014). Thus,examination of patterns of regional controllability could providean account of how the brain structural connectome may shapepatterns of brain activity. However, there are yet unansweredquestions regarding the controllability features of the structuralconnectome of the brain with regard to their consistency acrosslarge cohorts of healthy individuals, their sensitivity to geneticinfluence, and their association with cognitive systems andcognitive functions.
To address these knowledge gaps, we used publicly accessiblehigh-quality neuroimaging, genetic, and cognitive data from1066 healthy participants of the Human Connectome Project(HCP; https://www.humanconnectome.org/) to compute brainregional AC and MC. We first sought to test the interscan reli-ability of regional controllability in a subset of HCP participantswith repeat scans and then to evaluate the heritability of con-trollability measures based on the HCP twin and sibling data.The structural features and functional properties of the humanbrain are known to be heritable (Blokland et al. 2012; Sinclair etal. 2015; Strike et al. 2018). Thus, demonstrating that regionalcontrollability is also heritable is important for affirming itsbiological relevance.
Further, in assessing the cognitive relevance of regionalcontrollability, we sought to test whether brain regions withdifferent controllability profiles are differentially located withincognitive systems. The brain is functionally organized into
cognitive systems supported by spatially defined networks(Fox et al. 2005; Power et al. 2011; Smith et al. 2009). Systemsmapping to the default mode, central executive and saliencenetworks are typically involved in diverse higher-order mentalfunctions (Doucet et al. 2011; Menon and Uddin 2010; Raichleet al. 2001), while the auditory, visual, and sensorimotornetworks support specialized sensory and motor processing(Damoiseaux et al. 2006; Smith et al. 2009). We would thus expectthat regions with high AC will be preferentially located withinhigher-order cognitive systems where they could function tofacilitate transitions to diverse states associated with thesesystems. Finally, we also sought to quantify the contributionof regional controllability measures to interindividual variationin higher-order cognitive functions in order to assess theirrelevance for cognitive task performance.
Materials and MethodsSample
We used neuroimaging, genetic, and cognitive data from 1066healthy participants (490 men and 576 women; age range = 22–37 years; mean age = 28.7 years) provided by the HCP (https://db.humanconnectome.org/). The outline of the work flow isshown in Figure 1. The reliability of the controllability mea-sures was assessed using the intraclass correlation coefficient(ICC) (Shrout and Fleiss 1979) using data from 44 HCP partic-ipants (13 men and 31 women; age range = 22–35 years; meanage = 30.4 years) who had two scans with an interscan interval of2–11 months. Supplementary analyses were also conducted byrestricting the HCP sample to unrelated individuals only (n = 339)to address confounds related to familiality.
Construction of the Structural Connectome
Details of acquisition and preprocessing protocols for diffusionMRI (dMRI) in HCP have been provided in prior studies (Glasseret al. 2013; Sotiropoulos et al. 2013; Van Essen et al. 2012) and arealso outlined in the Supplementary Material. In constructing thestructural connectome, we used an in-house image processingpipeline that combines tools from DSI Studio (http://dsi-studio.labsolver.org/) and validated custom routines written in MAT-LAB (Mathworks) (Lee and Frangou 2017a, 2017b). The dMRI datawere reconstructed in DSI Studio using generalized q-samplingimaging (GQI) (Yeh et al. 2010). GQI first reconstructs the spindistribution functions (SDFs) within each voxel and computesthe quantitative anisotropy in native space. Whole-brain fibertractography was performed using a deterministic fiber trackingalgorithm that leverages information in SDFs (Yeh et al. 2013).We generated a total of 1 000 000 whole brain streamlines foreach individual, with the anisotropy threshold of 0.05 and stepsize of 0.9 mm, determined automatically in DSI Studio. Theangular threshold was 60◦. Fiber tracks with lengths less than10 mm (approximately 35 000 tracks) were discarded to preventthe tracking process from being overloaded with short associa-tion fibers.
The areal parcellation was performed by warping the stan-dard space to the subject space using the statistical paramet-ric mapping nonlinear registration algorithm (Ashburner andFriston 1999). We used a template derived from the automatedanatomical labeling template (Tzourio-Mazoyer et al. 2002) thatsubdivides the brain into 512 cortical and subcortical regionswith approximately uniform volume as previously described(Zalesky et al. 2010) (Supplementary Table S1). For each partici-
3046 Cerebral Cortex, 2020, Vol. 30, No. 5
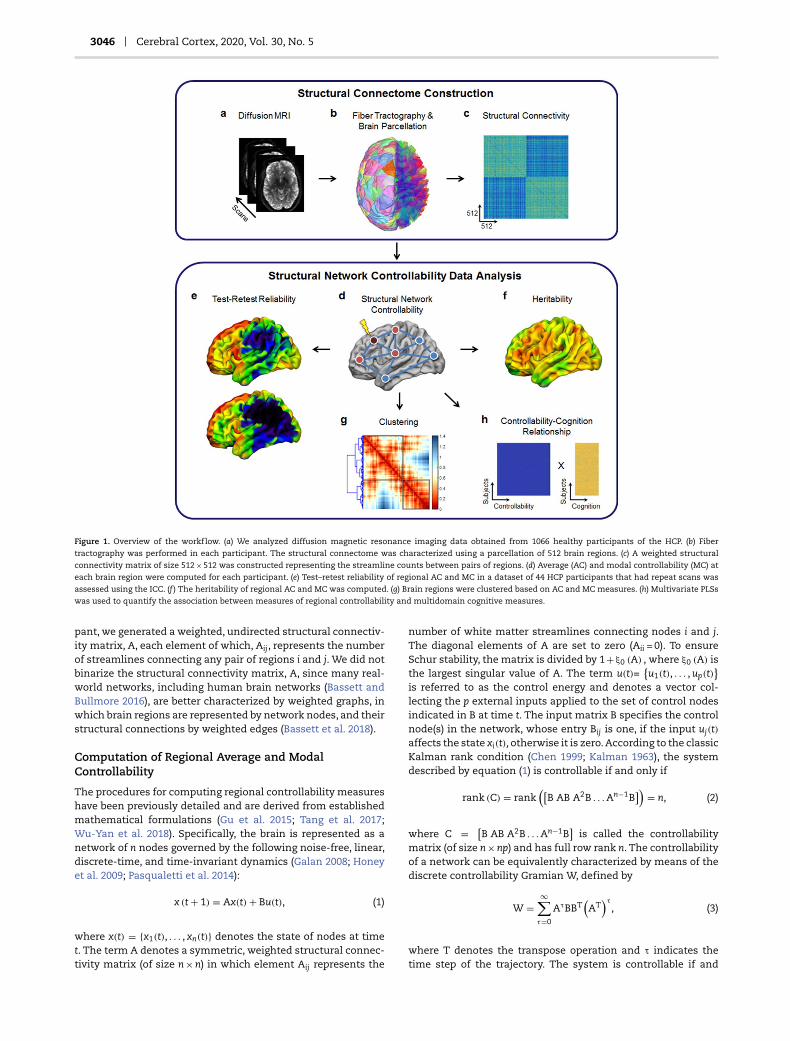
Figure 1. Overview of the workflow. (a) We analyzed diffusion magnetic resonance imaging data obtained from 1066 healthy participants of the HCP. (b) Fibertractography was performed in each participant. The structural connectome was characterized using a parcellation of 512 brain regions. (c) A weighted structuralconnectivity matrix of size 512 × 512 was constructed representing the streamline counts between pairs of regions. (d) Average (AC) and modal controllability (MC) at
each brain region were computed for each participant. (e) Test–retest reliability of regional AC and MC in a dataset of 44 HCP participants that had repeat scans wasassessed using the ICC. (f ) The heritability of regional AC and MC was computed. (g) Brain regions were clustered based on AC and MC measures. (h) Multivariate PLSswas used to quantify the association between measures of regional controllability and multidomain cognitive measures.
pant, we generated a weighted, undirected structural connectiv-ity matrix, A, each element of which, Aij, represents the numberof streamlines connecting any pair of regions i and j. We did notbinarize the structural connectivity matrix, A, since many real-world networks, including human brain networks (Bassett andBullmore 2016), are better characterized by weighted graphs, inwhich brain regions are represented by network nodes, and theirstructural connections by weighted edges (Bassett et al. 2018).
Computation of Regional Average and ModalControllability
The procedures for computing regional controllability measureshave been previously detailed and are derived from establishedmathematical formulations (Gu et al. 2015; Tang et al. 2017;Wu-Yan et al. 2018). Specifically, the brain is represented as anetwork of n nodes governed by the following noise-free, linear,discrete-time, and time-invariant dynamics (Galan 2008; Honeyet al. 2009; Pasqualetti et al. 2014):
x (t + 1) = Ax(t) + Bu(t), (1)
where x(t) = {x1(t), . . . , xn(t)} denotes the state of nodes at timet. The term A denotes a symmetric, weighted structural connec-tivity matrix (of size n × n) in which element Aij represents the
number of white matter streamlines connecting nodes i and j.The diagonal elements of A are set to zero (Aii = 0). To ensureSchur stability, the matrix is divided by 1+ξ0 (A) , where ξ0 (A) isthe largest singular value of A. The term u(t)=
{u1(t), . . . , up(t)
}is referred to as the control energy and denotes a vector col-lecting the p external inputs applied to the set of control nodesindicated in B at time t. The input matrix B specifies the controlnode(s) in the network, whose entry Bij is one, if the input uj(t)affects the state xi(t), otherwise it is zero. According to the classicKalman rank condition (Chen 1999; Kalman 1963), the systemdescribed by equation (1) is controllable if and only if
rank (C) = rank([
B AB A2B . . . An−1B]) = n, (2)
where C = [B AB A2B . . . An−1B
]is called the controllability
matrix (of size n × np) and has full row rank n. The controllabilityof a network can be equivalently characterized by means of thediscrete controllability Gramian W, defined by
W =∞∑
τ=0
AτBBT(AT
)τ
, (3)
where T denotes the transpose operation and τ indicates thetime step of the trajectory. The system is controllable if and

Heritability and Cognitive Relevance of Structural Brain Controllability Lee et al. 3047
only if W is positive definite or equivalently if the minimumeigenvalue of W is strictly larger than zero (Chen 1999). Wechose to control nodes one at a time, and thus the input matrixB in fact reduces to a one-dimensional vector, for example,Bij = (1 0 0 . . . )T when the first brain region is the control node. Ingeneral, the ease or difficulty of control is related to the structureand eigenvalues of the controllability Gramian (Wu-Yan et al.2018). Based on this theoretical foundation, the AC is computedas the trace of the controllability Gramian matrix Wk,
ζ = Trace (Wk) , (4)
where Wk is the Gramian calculated from the node k and MC iscomputed from the eigenvector matrix V = [vij] of the networkadjacency matrix A, defined by
φi =∑
j
(1 − ξ2
j (A))
v2ij, (5)
as a scaled measure of the controllability of all N modes ξ1 (A),. . . , ξN−1 (A) from brain region i.
We followed the procedures outlined above to compute theAC and MC for each of the 512 brain regions in each participant.Further, we confirmed the validity of these results (Supplemen-tary Fig. S1), by comparing findings from the empirical datato those obtained from null network models constructed byrandomly permuting the connection (edge) weights of the con-nectivity matrix using either a strength- or degree-preservingrandomization scheme implemented in the Brain ConnectivityToolbox (Rubinov and Sporns 2010).
Assessment of Heritability of Regional Controllability
Heritability estimates were calculated using Sequential Oli-gogenic Linkage Analysis Routines software (Almasy andBlangero 1998), which employs maximum likelihood variancedecomposition methods to determine the relative importanceof genetic and environmental influences by modeling thecovariance among family members as a function of geneticproximity. Age, age2, sex, and their interactions (age × sex,age2 × sex) were tested as covariates of interest by comparingthe likelihood of a model estimating the covariate effect tothe likelihood of a model where the covariate effect wasconstrained to zero. See Supplementary Material for moredetails.
Regional Controllability Profiles and Cognitive Systems
In order to evaluate the potential functional consequences ofthe brain regional controllability, we tested whether regions thatdiffered in their controllability profile were differentially locatedwithin known cognitive systems mapped to spatially definednetworks. Here, we focused on six large-scale networks, namelythe auditory (AUD), central executive (CEN), default mode (DMN),salience (SAL), somatosensory (SMN), and visual (VIS) networkswhich we defined using the template provided by Power andcolleagues (Power et al. 2011), which was originally derived fromthe resting-state functional MRI data. We refer to these networksas cognitive systems based on prior research which establishedthat the functional architecture of the brain at rest correspondsto the functional networks mapped to cognitive domains inactivation studies (Cole et al. 2014; Smith et al. 2009). We
assigned each of the 512 brain regions to a single net-work based on the closest Euclidian distance between eachregion and the Power parcellation template (SupplementaryTable S2).
To identify clusters of regions with different controllabilityprofiles, we used data-driven hierarchical clustering usingWard’s minimum variance method (Ward 1963) for Euclideandistances between pairs of ranked controllability measures.The optimal cluster number was determined using the Davies–Bouldin (DB) index, which is the ratio of intracluster similarityto intercluster differences for a given clustering solution (Daviesand Bouldin 1979). Lower DB index values indicate a betterclustering solution. We then computed the percentage of brainregions in each cluster present from each of the six cognitivesystems. To correct for system size, we normalized the rawpercentage of brain regions located in a given cognitive systemby the total number of regions in a cognitive system. To confirmthe reproducibility of the findings, we repeated the analysesusing an alternative functional template provided by Yeo andcolleagues (Yeo et al. 2011).
Regional Controllability and Cognitive Function
We considered nine cognitive variables from the HCP databasethat cover all aspects of cognition: crystallized cognition (NIMHToolbox Crystallized Cognition Composite), fluid intelligence(Penn Matrix Test: Number of Correct Responses), workingmemory (List Sorting Working Memory Test), sustained atten-tion (Short Penn Continuous Performance Test Sensitivity andSpecificity), language comprehension (Picture Vocabulary Test),cognitive flexibility (Dimensional Change Card Sort Scale Score),inhibitory control (Flanker Inhibitory Control and AttentionTest), and emotion recognition (Penn Emotion Recognition:Number of Correct Responses) (Supplementary Table S3).
We applied multivariate partial least squares (PLSs) to modelthe associations between the cognitive variables detailed aboveand regional average and MC (Krishnan et al. 2011; McIntoshand Lobaugh 2004). PLS models the associations between twosets of variables by means of latent variables (LVs) and waschosen because it is a data-driven approach that has beensuccessfully used to identify associations between cognitive andneuroimaging measures (Krishnan et al. 2011). The two mainadvantages of PLS are its sensitivity in detecting subtle andspatially distributed brain-cognition associations and its explicitmodeling of the effects of variables that are collinear or near-linear, which is often the case with cognitive and brain imagingmeasures.
The associations between cognition and AC or MC wereexamined in two separate PLS analyses controlling for age andsex or age2 and sex. The total brain volume was also entered as acovariate in all models as it showed univariate correlations withcontrollability measures at a nominal uncorrected significancelevel. We created two controllability matrices: one for regionalAC and the other for regional MC (each controllability matrix:size of 1066 × 512, representing, respectively, the number ofparticipants and the number of regions). We also constructed amatrix for the cognitive data (cognitive matrix: size of 1066 × 9,representing, respectively, the number of participants and thenumber of cognitive variables included). The controllability andcognitive data were z-scored across subjects prior to performingthe PLS analyses. We proceeded to compute the covariancematrix between the controllability and cognitive matrices, andthen we decomposed the resulting covariance matrix into sets of

3048 Cerebral Cortex, 2020, Vol. 30, No. 5
Figure 2. Regional average (AC) and modal controllability (MC). The ranked mean value of the AC of each of the 512 brain regions in the (a) entire sample (n = 1066) andin the (b) baseline and (c) repeat scans of a reproducibility subsample (n = 44). The ranked mean value of the MC of each of the 512 brain regions in the (d) entire sample(n = 1066) and in the (e) baseline and (f ) repeat scans of a reproducibility subsample (n = 44). The ranked controllability values are projected onto the cortical surface for
ease of visualization. L: Left. Additional information is provided in Supplementary Figure S2 and Tables S4 and S5.
orthogonal LVs. Permutation testing and bootstrap resamplingwere used to determine statistical significance for controllabilitypatterns and for the contribution of individual nodes to thesepatterns, respectively. The significance of LVs was assessedusing permutation tests (1000 iterations) of the singular valuesfrom singular value decomposition of controllability and cogni-tive matrices. The reliability of each controllability estimateto the LV was assessed using bootstrap resampling (3000iterations). Bootstrapping also allowed us to estimate a bootstrapratio for each brain region, which is the ratio of the weightof regional controllability over its estimated standard error,where each ratio approximates a z-score for the contributionof the controllability of each region to the association of interest(Zimmermann et al. 2018). A high, positive bootstrap ratio indi-cates that the corresponding region contributes positively andreliably to the controllability–cognition relationship identifiedby the LV correlation. In contrast, a high, negative bootstrap ratiomeans that the corresponding region contributes negatively andreliably to the controllability–cognitive relationship. For eachLV, we reported results with an absolute bootstrap ratio above3, which corresponds to robustness at a confidence level ofapproximately 99% (Garrett et al. 2013)
ResultsRegional Average and Modal Controllability
Fig. 2a,d, respectively, show the AC and MC for each of the 512regions averaged across 1066 participants (additional details inSupplementary Fig. S2 and Tables S4 and S5). AC was highestbilaterally in the medial prefrontal and anterior cingulategyri, the supplementary motor area, and the precuneus. MC
was highest bilaterally in the orbital prefrontal gyrus, thesomatosensory cortex, the supramarginal gyrus, the insula, themedial temporal gyrus, and the thalamus. The results remainedthe same when the analyses were restricted only to unrelatedstudy participants (Supplementary Fig. S3).
Reproducibility of Regional Controllability
Figure 2b-c,e-f , respectively, show the within-subject ICC of theAC and MC for each of the 512 regions averaged across 44HCP participants with two scanning sessions. The mean ICC forregional AC and MC was, respectively, 0.71 ± 0.15 and 0.77 ± 0.09(Supplementary Fig. 4). The ICC for AC was highest in the mid-dle and inferior occipital gyri, the superior parietal gyrus, theprecuneus, and the middle temporal gyrus (additional details inSupplementary Tables S6 and S7), and the ICC for MC was high-est in the precuneus, the supplementary motor area, the inferiorand middle temporal gyri, the fusiform gyrus, and the inferiorparietal gyrus (additional details in Supplementary Tables S6and S7).
Heritability of Regional Average and MC
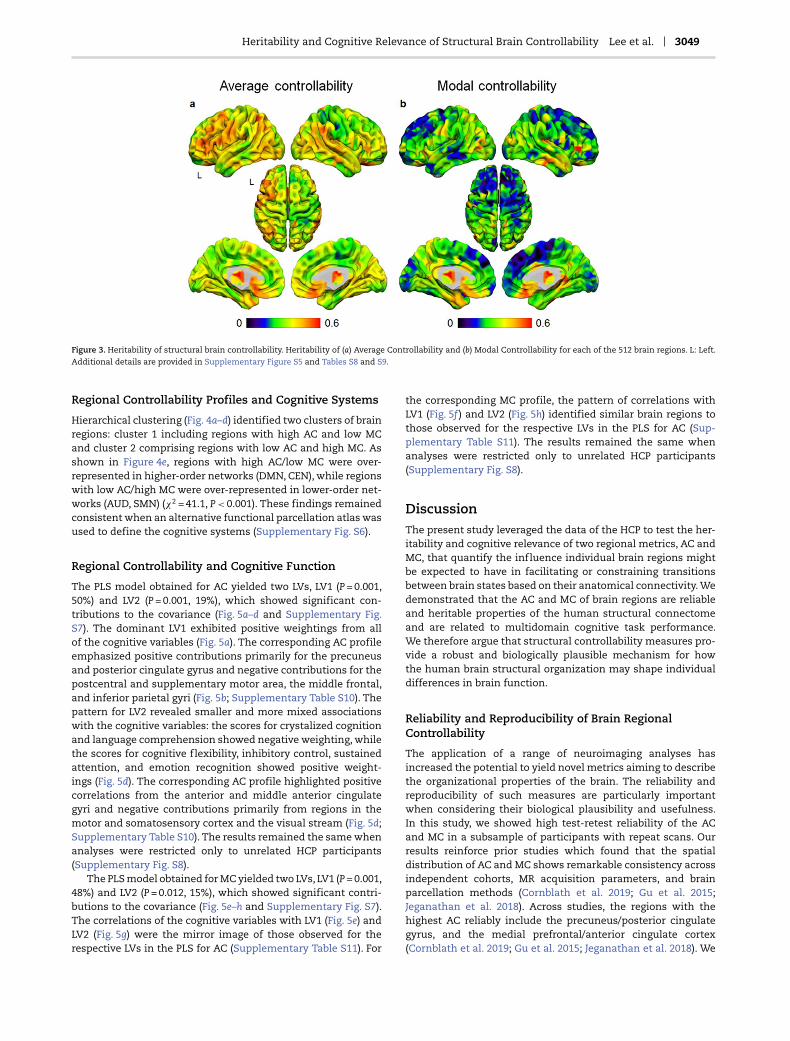
Heritability estimates of AC and MC were generally high inmultiple cortical and subcortical regions (Fig. 3 and Supplemen-tary Fig. S5). The thalamus, striatal regions, and ventral pre-frontal regions had the highest values, while the lowest valueswere noted in the medial superior frontal gyrus, the paracentrallobule, the middle frontal gyrus, the postcentral gyrus, andthe supramarginal gyrus (additional details in SupplementaryTables S8 and S9).
Heritability and Cognitive Relevance of Structural Brain Controllability Lee et al. 3049
Figure 3. Heritability of structural brain controllability. Heritability of (a) Average Controllability and (b) Modal Controllability for each of the 512 brain regions. L: Left.Additional details are provided in Supplementary Figure S5 and Tables S8 and S9.
Regional Controllability Profiles and Cognitive Systems
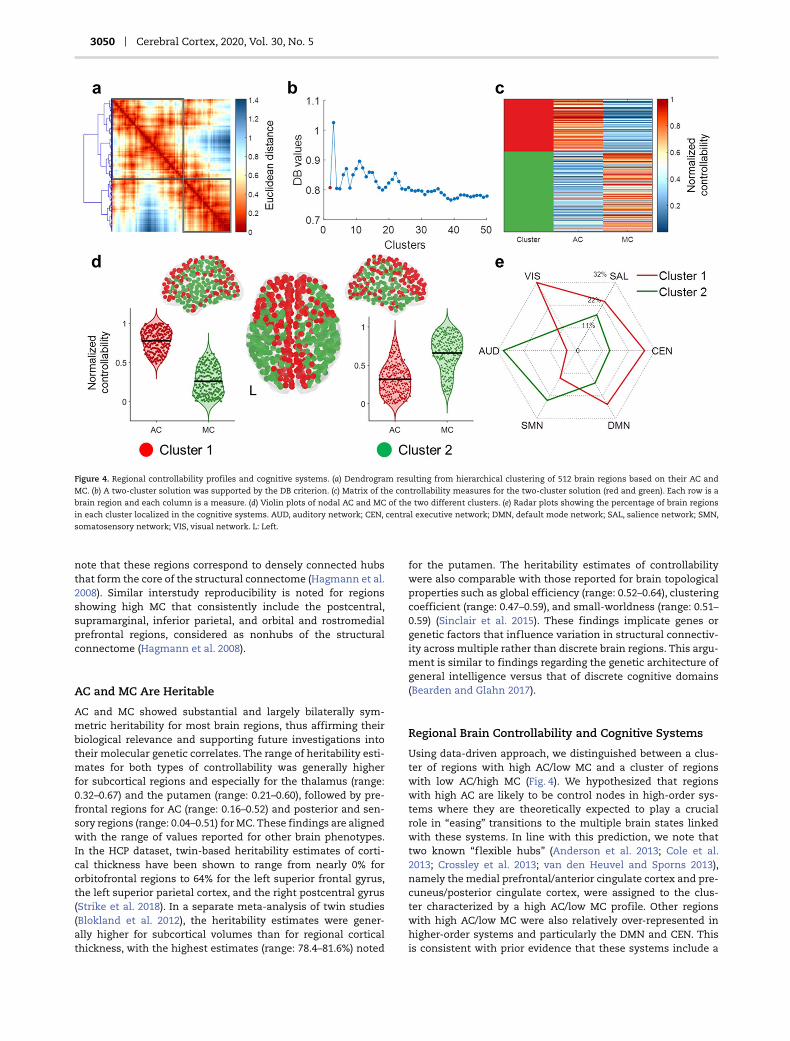
Hierarchical clustering (Fig. 4a–d) identified two clusters of brainregions: cluster 1 including regions with high AC and low MCand cluster 2 comprising regions with low AC and high MC. Asshown in Figure 4e, regions with high AC/low MC were over-represented in higher-order networks (DMN, CEN), while regionswith low AC/high MC were over-represented in lower-order net-works (AUD, SMN) (χ2 = 41.1, P < 0.001). These findings remainedconsistent when an alternative functional parcellation atlas wasused to define the cognitive systems (Supplementary Fig. S6).
Regional Controllability and Cognitive Function
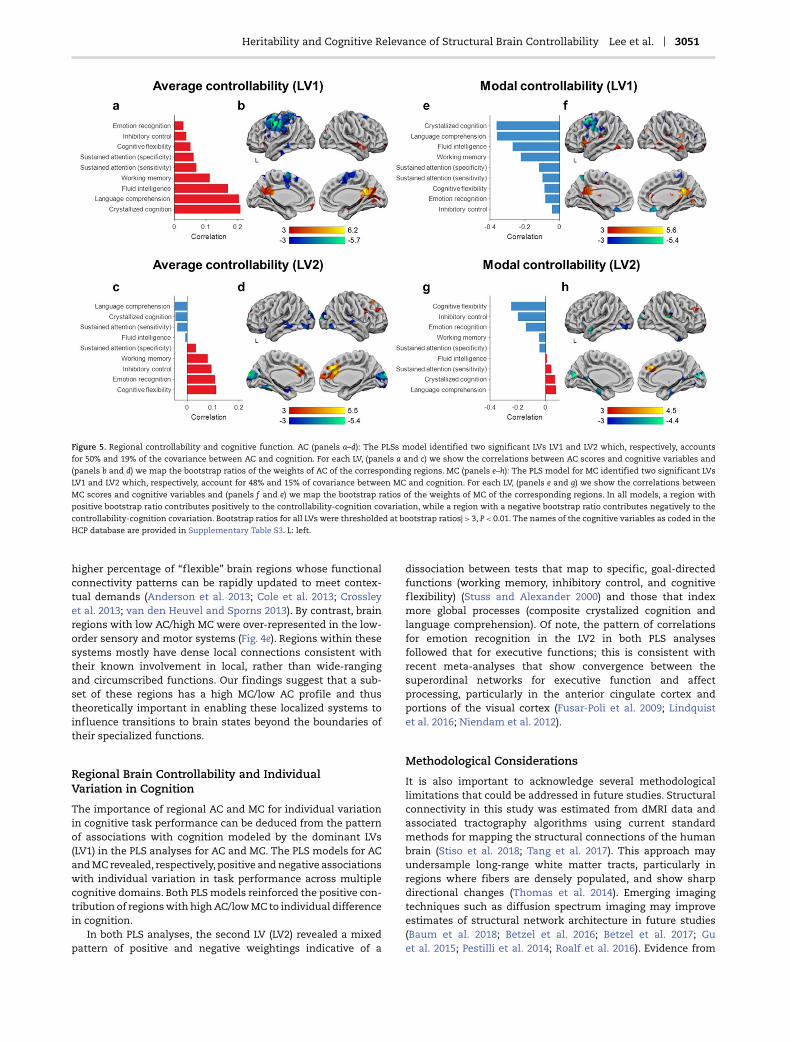
The PLS model obtained for AC yielded two LVs, LV1 (P = 0.001,50%) and LV2 (P = 0.001, 19%), which showed significant con-tributions to the covariance (Fig. 5a–d and Supplementary Fig.S7). The dominant LV1 exhibited positive weightings from allof the cognitive variables (Fig. 5a). The corresponding AC profileemphasized positive contributions primarily for the precuneusand posterior cingulate gyrus and negative contributions for thepostcentral and supplementary motor area, the middle frontal,and inferior parietal gyri (Fig. 5b; Supplementary Table S10). Thepattern for LV2 revealed smaller and more mixed associationswith the cognitive variables: the scores for crystalized cognitionand language comprehension showed negative weighting, whilethe scores for cognitive flexibility, inhibitory control, sustainedattention, and emotion recognition showed positive weight-ings (Fig. 5d). The corresponding AC profile highlighted positivecorrelations from the anterior and middle anterior cingulategyri and negative contributions primarily from regions in themotor and somatosensory cortex and the visual stream (Fig. 5d;Supplementary Table S10). The results remained the same whenanalyses were restricted only to unrelated HCP participants(Supplementary Fig. S8).
The PLS model obtained for MC yielded two LVs, LV1 (P = 0.001,48%) and LV2 (P = 0.012, 15%), which showed significant contri-butions to the covariance (Fig. 5e–h and Supplementary Fig. S7).The correlations of the cognitive variables with LV1 (Fig. 5e) andLV2 (Fig. 5g) were the mirror image of those observed for therespective LVs in the PLS for AC (Supplementary Table S11). For
the corresponding MC profile, the pattern of correlations withLV1 (Fig. 5f ) and LV2 (Fig. 5h) identified similar brain regions tothose observed for the respective LVs in the PLS for AC (Sup-plementary Table S11). The results remained the same whenanalyses were restricted only to unrelated HCP participants(Supplementary Fig. S8).
DiscussionThe present study leveraged the data of the HCP to test the her-itability and cognitive relevance of two regional metrics, AC andMC, that quantify the influence individual brain regions mightbe expected to have in facilitating or constraining transitionsbetween brain states based on their anatomical connectivity. Wedemonstrated that the AC and MC of brain regions are reliableand heritable properties of the human structural connectomeand are related to multidomain cognitive task performance.We therefore argue that structural controllability measures pro-vide a robust and biologically plausible mechanism for howthe human brain structural organization may shape individualdifferences in brain function.
Reliability and Reproducibility of Brain RegionalControllability
The application of a range of neuroimaging analyses hasincreased the potential to yield novel metrics aiming to describethe organizational properties of the brain. The reliability andreproducibility of such measures are particularly importantwhen considering their biological plausibility and usefulness.In this study, we showed high test-retest reliability of the ACand MC in a subsample of participants with repeat scans. Ourresults reinforce prior studies which found that the spatialdistribution of AC and MC shows remarkable consistency acrossindependent cohorts, MR acquisition parameters, and brainparcellation methods (Cornblath et al. 2019; Gu et al. 2015;Jeganathan et al. 2018). Across studies, the regions with thehighest AC reliably include the precuneus/posterior cingulategyrus, and the medial prefrontal/anterior cingulate cortex(Cornblath et al. 2019; Gu et al. 2015; Jeganathan et al. 2018). We
3050 Cerebral Cortex, 2020, Vol. 30, No. 5
Figure 4. Regional controllability profiles and cognitive systems. (a) Dendrogram resulting from hierarchical clustering of 512 brain regions based on their AC andMC. (b) A two-cluster solution was supported by the DB criterion. (c) Matrix of the controllability measures for the two-cluster solution (red and green). Each row is abrain region and each column is a measure. (d) Violin plots of nodal AC and MC of the two different clusters. (e) Radar plots showing the percentage of brain regionsin each cluster localized in the cognitive systems. AUD, auditory network; CEN, central executive network; DMN, default mode network; SAL, salience network; SMN,
somatosensory network; VIS, visual network. L: Left.
note that these regions correspond to densely connected hubsthat form the core of the structural connectome (Hagmann et al.2008). Similar interstudy reproducibility is noted for regionsshowing high MC that consistently include the postcentral,supramarginal, inferior parietal, and orbital and rostromedialprefrontal regions, considered as nonhubs of the structuralconnectome (Hagmann et al. 2008).
AC and MC Are Heritable
AC and MC showed substantial and largely bilaterally sym-metric heritability for most brain regions, thus affirming theirbiological relevance and supporting future investigations intotheir molecular genetic correlates. The range of heritability esti-mates for both types of controllability was generally higherfor subcortical regions and especially for the thalamus (range:0.32–0.67) and the putamen (range: 0.21–0.60), followed by pre-frontal regions for AC (range: 0.16–0.52) and posterior and sen-sory regions (range: 0.04–0.51) for MC. These findings are alignedwith the range of values reported for other brain phenotypes.In the HCP dataset, twin-based heritability estimates of corti-cal thickness have been shown to range from nearly 0% fororbitofrontal regions to 64% for the left superior frontal gyrus,the left superior parietal cortex, and the right postcentral gyrus(Strike et al. 2018). In a separate meta-analysis of twin studies(Blokland et al. 2012), the heritability estimates were gener-ally higher for subcortical volumes than for regional corticalthickness, with the highest estimates (range: 78.4–81.6%) noted
for the putamen. The heritability estimates of controllabilitywere also comparable with those reported for brain topologicalproperties such as global efficiency (range: 0.52–0.64), clusteringcoefficient (range: 0.47–0.59), and small-worldness (range: 0.51–0.59) (Sinclair et al. 2015). These findings implicate genes orgenetic factors that influence variation in structural connectiv-ity across multiple rather than discrete brain regions. This argu-ment is similar to findings regarding the genetic architecture ofgeneral intelligence versus that of discrete cognitive domains(Bearden and Glahn 2017).
Regional Brain Controllability and Cognitive Systems
Using data-driven approach, we distinguished between a clus-ter of regions with high AC/low MC and a cluster of regionswith low AC/high MC (Fig. 4). We hypothesized that regionswith high AC are likely to be control nodes in high-order sys-tems where they are theoretically expected to play a crucialrole in “easing” transitions to the multiple brain states linkedwith these systems. In line with this prediction, we note thattwo known “flexible hubs” (Anderson et al. 2013; Cole et al.2013; Crossley et al. 2013; van den Heuvel and Sporns 2013),namely the medial prefrontal/anterior cingulate cortex and pre-cuneus/posterior cingulate cortex, were assigned to the clus-ter characterized by a high AC/low MC profile. Other regionswith high AC/low MC were also relatively over-represented inhigher-order systems and particularly the DMN and CEN. Thisis consistent with prior evidence that these systems include a
Heritability and Cognitive Relevance of Structural Brain Controllability Lee et al. 3051
Figure 5. Regional controllability and cognitive function. AC (panels a–d): The PLSs model identified two significant LVs LV1 and LV2 which, respectively, accountsfor 50% and 19% of the covariance between AC and cognition. For each LV, (panels a and c) we show the correlations between AC scores and cognitive variables and(panels b and d) we map the bootstrap ratios of the weights of AC of the corresponding regions. MC (panels e–h): The PLS model for MC identified two significant LVs
LV1 and LV2 which, respectively, account for 48% and 15% of covariance between MC and cognition. For each LV, (panels e and g) we show the correlations betweenMC scores and cognitive variables and (panels f and e) we map the bootstrap ratios of the weights of MC of the corresponding regions. In all models, a region withpositive bootstrap ratio contributes positively to the controllability-cognition covariation, while a region with a negative bootstrap ratio contributes negatively to the
controllability-cognition covariation. Bootstrap ratios for all LVs were thresholded at bootstrap ratios| > 3, P < 0.01. The names of the cognitive variables as coded in theHCP database are provided in Supplementary Table S3. L: left.
higher percentage of “flexible” brain regions whose functionalconnectivity patterns can be rapidly updated to meet contex-tual demands (Anderson et al. 2013; Cole et al. 2013; Crossleyet al. 2013; van den Heuvel and Sporns 2013). By contrast, brainregions with low AC/high MC were over-represented in the low-order sensory and motor systems (Fig. 4e). Regions within thesesystems mostly have dense local connections consistent withtheir known involvement in local, rather than wide-rangingand circumscribed functions. Our findings suggest that a sub-set of these regions has a high MC/low AC profile and thustheoretically important in enabling these localized systems toinfluence transitions to brain states beyond the boundaries oftheir specialized functions.
Regional Brain Controllability and IndividualVariation in Cognition
The importance of regional AC and MC for individual variationin cognitive task performance can be deduced from the patternof associations with cognition modeled by the dominant LVs(LV1) in the PLS analyses for AC and MC. The PLS models for ACand MC revealed, respectively, positive and negative associationswith individual variation in task performance across multiplecognitive domains. Both PLS models reinforced the positive con-tribution of regions with high AC/low MC to individual differencein cognition.
In both PLS analyses, the second LV (LV2) revealed a mixedpattern of positive and negative weightings indicative of a
dissociation between tests that map to specific, goal-directedfunctions (working memory, inhibitory control, and cognitiveflexibility) (Stuss and Alexander 2000) and those that indexmore global processes (composite crystalized cognition andlanguage comprehension). Of note, the pattern of correlationsfor emotion recognition in the LV2 in both PLS analysesfollowed that for executive functions; this is consistent withrecent meta-analyses that show convergence between thesuperordinal networks for executive function and affectprocessing, particularly in the anterior cingulate cortex andportions of the visual cortex (Fusar-Poli et al. 2009; Lindquistet al. 2016; Niendam et al. 2012).
Methodological Considerations
It is also important to acknowledge several methodologicallimitations that could be addressed in future studies. Structuralconnectivity in this study was estimated from dMRI data andassociated tractography algorithms using current standardmethods for mapping the structural connections of the humanbrain (Stiso et al. 2018; Tang et al. 2017). This approach mayundersample long-range white matter tracts, particularly inregions where fibers are densely populated, and show sharpdirectional changes (Thomas et al. 2014). Emerging imagingtechniques such as diffusion spectrum imaging may improveestimates of structural network architecture in future studies(Baum et al. 2018; Betzel et al. 2016; Betzel et al. 2017; Guet al. 2015; Pestilli et al. 2014; Roalf et al. 2016). Evidence from

3052 Cerebral Cortex, 2020, Vol. 30, No. 5
this and previous studies suggests that average and MC mayincrease during childhood and adolescence (Cornblath et al.2019) and reaches a plateau in young adulthood. Larger studieswith more comprehensive coverage of the human lifespan areneeded to provide a definitive age-related trajectory of regionalcontrollability and its association with cognition. Future studiesinvolving functional MRI data will be important in elucidatingmore precisely how different aspects of controllability con-tribute to functional brain states and cognition.
In summary, we provide evidence that controllability thatmodels the dynamic properties of the brain as inferred from thestructural connectome is a biologically plausible metric that hasthe potential to provide mechanistic insights into the relation-ship between cognitive functions and the structural organiza-tion of the human brain.
Supplementary MaterialSupplementary material is available at Cerebral Cortex online.
FundingNational Institute of Mental Health (grant R01MH113619); theJohn D. and Catherine T. MacArthur Foundation; the Alfred P.Sloan Foundation; the ISI Foundation; the Paul Allen Foundation;the Army Research Laboratory (W911NF-10-2-0022); the ArmyResearch Office (Bassett-W911NF-14-1-0679, Grafton-W911NF-16-1-0474, DCIST-W911NF-17-2-0181); the Office of NavalResearch; the National Institute of Mental Health (2-R01-DC-009209-11, R01-MH112847, R01-MH107235, R21-M MH-106799,R01-M MH-113550); the National Institute of NeurologicalDisorders and Stroke (R01 NS099348); the National Instituteof Child Health and Human Development (1R01HD086888-01);the National Science Foundation (BCS-1441502, BCS-1430087,NSF PHY-1554488, BCS-1631550) to D.S.B. Data were provided bythe Human Connectome Project (HCP), and the WashingtonUniversity, University of Minnesota, and Oxford UniversityConsortium (Principal Investigators David Van Essen and KamilUgurbil; Grant 1U54MH091657) funded by 16 National Institutesof Health and Centers that support the NIH Blueprint forNeuroscience Research, and the McDonnell Center for SystemsNeuroscience at Washington University.
NotesThe content is solely the responsibility of the authors and doesnot necessarily represent the official views of any of the fundingagencies. The authors declare no competing financial interests.Conflict of Interests: None declared.
ReferencesAlmasy L, Blangero J. 1998. Multipoint quantitative-trait
linkage analysis in general pedigrees. Am J Hum Genet.62(5):1198–1211.
Anderson ML, Kinnison J, Pessoa L. 2013. Describing functionaldiversity of brain regions and brain networks. NeuroImage.73:50–58.
Ashburner J, Friston KJ. 1999. Nonlinear spatial normalizationusing basis functions. Hum Brain Mapp. 7(4):254–266.
Bassett DS, Bullmore ET. 2016. Small-world brain networks revis-ited. Neuroscientist.
Bassett DS, Zurn P, Gold JI. 2018. On the nature and use of modelsin network neuroscience. Nat Rev Neurosci. 19(9):566–578.
Baum GL, Roalf DR, Cook PA, Ciric R, Rosen AFG, Xia C, ElliottMA, Ruparel K, Verma R, Tunc B, et al. 2018. The impact of in-scanner head motion on structural connectivity derived fromdiffusion mri. NeuroImage. 173:275–286.
Bearden CE, Glahn DC. 2017. Cognitive genomics: searching forthe genetic roots of neuropsychological functioning. Neu-ropsychology. 31(8):1003–1019.
Betzel RF, Gu S, Medaglia JD, Pasqualetti F, Bassett DS. 2016.Optimally controlling the human connectome: the role ofnetwork topology. Sci Rep. 6:30770.
Betzel RF, Medaglia JD, Kahn AE, Soffer J, Schonhaut DR, BassettDS. 2017. Inter-regional ecog correlations predicted by com-munication dynamics, geometry, and correlated gene expres-sion. ArXiv e-prints. https://ui.adsabs.harvard.edu/#abs/2017arXiv170606088B (last accessed 1 June 2017).
Blokland GA, de Zubicaray GI, McMahon KL, Wright MJ. 2012.Genetic and environmental influences on neuroimagingphenotypes: a meta-analytical perspective on twin imagingstudies. Twin Res Hum Genet. 15(3):351–371.
Breakspear M. 2017. Dynamic models of large-scale brain activ-ity. Nat Neurosci. 20(3):340–352.
Bullmore E, Sporns O. 2009. Complex brain networks: graphtheoretical analysis of structural and functional systems. NatRev Neurosci. 10(3):186–198.
Chen C-T. 1999. Linear system theory and design. New York: OxfordUniversity Press.
Cole MW, Bassett DS, Power JD, Braver TS, Petersen SE. 2014.Intrinsic and task-evoked network architectures of thehuman brain. Neuron. 83(1):238–251.
Cole MW, Reynolds JR, Power JD, Repovs G, Anticevic A, BraverTS. 2013. Multi-task connectivity reveals flexible hubs foradaptive task control. Nat Neurosci. 16(9):1348–1355.
Cornblath EJ, Tang E, Baum GL, Moore TM, Adebimpe A,Roalf DR, Gur RC, Gur RE, Pasqualetti F, Satterthwaite TD,et al. 2019. Sex differences in network controllability asa predictor of executive function in youth. NeuroImage.188:122–134.
Crossley NA, Mechelli A, Vertes PE, Winton-Brown TT, PatelAX, Ginestet CE, McGuire P, Bullmore ET. 2013. Cognitiverelevance of the community structure of the human brainfunctional coactivation network. Proc Natl Acad Sci U S A.110(28):11583–11588.
Damoiseaux JS, Rombouts SA, Barkhof F, Scheltens P, StamCJ, Smith SM, Beckmann CF. 2006. Consistent resting-statenetworks across healthy subjects. Proc Natl Acad Sci U S A.103(37):13848–13853.
Davies DL, Bouldin DW. 1979. A cluster separation measure. IEEETrans Pattern Anal Mach Intell. 1(2):224–227.
Doucet G, Naveau M, Petit L, Delcroix N, Zago L, Crivello F,Jobard G, Tzourio-Mazoyer N, Mazoyer B, Mellet E, et al. 2011.Brain activity at rest: a multiscale hierarchical functionalorganization. J Neurophysiol. 105(6):2753–2763.
Fox MD, Snyder AZ, Vincent JL, Corbetta M, Van Essen DC, RaichleME. 2005. The human brain is intrinsically organized intodynamic, anticorrelated functional networks. Proc Natl AcadSci U S A. 102(27):9673–9678.
Fusar-Poli P, Placentino A, Carletti F, Landi P, Allen P,Surguladze S, Benedetti F, Abbamonte M, Gasparotti R, BaraleF, et al. 2009. Functional atlas of emotional faces processing:a voxel-based meta-analysis of 105 functional magnetic res-onance imaging studies. J Psychiatry Neurosci. 34(6):418–432.

Heritability and Cognitive Relevance of Structural Brain Controllability Lee et al. 3053
Galan RF. 2008. On how network architecture determines thedominant patterns of spontaneous neural activity. PLoS One.3(5).
Garrett DD, Kovacevic N, McIntosh AR, Grady CL. 2013. Themodulation of bold variability between cognitive statesvaries by age and processing speed. Cereb Cortex. 23(3):684–693.
Glasser MF, Sotiropoulos SN, Wilson JA, Coalson TS, Fischl B,Andersson JL, Xu J, Jbabdi S, Webster M, Polimeni JR, et al.2013. The minimal preprocessing pipelines for the humanconnectome project. Neuroimage. 80:105–124.
Gu S, Pasqualetti F, Cieslak M, Telesford QK, Yu AB, Kahn AE,Medaglia JD, Vettel JM, Miller MB, Grafton ST, et al. 2015.Controllability of structural brain networks. Nat Commun.6:8414.
Hagmann P, Cammoun L, Gigandet X, Meuli R, Honey CJ, WedeenVJ, Sporns O. 2008. Mapping the structural core of humancerebral cortex. PLoS Biol. 6(7):e159.
Honey CJ, Sporns O, Cammoun L, Gigandet X, Thiran JP, Meuli R,Hagmann P. 2009. Predicting human resting-state functionalconnectivity from structural connectivity. Proc Natl Acad Sci US A. 106(6):2035–2040.
Jeganathan J, Perry A, Bassett DS, Roberts G, Mitchell PB,Breakspear M. 2018. Fronto-limbic dysconnectivity leads toimpaired brain network controllability in young people withbipolar disorder and those at high genetic risk. NeuroimageClin. 19:71–81.
Kalman RE. 1963. Mathmatical description of linear dynamicalsystems. SIAM Rev. 5(2): 186.
Krishnan A, Williams LJ, McIntosh AR, Abdi H. 2011. Partialleast squares (pls) methods for neuroimaging: a tutorial andreview. NeuroImage. 56(2):455–475.
Lee WH, Frangou S. 2017a. Emergence of metastable dynamicsin functional brain organization via spontaneous fmri signaland whole-brain computational modeling. Conf Proc IEEE EngMed Biol Soc. 2017:4471–4474.
Lee WH, Frangou S. 2017b. Linking functional connectivityand dynamic properties of resting-state networks. Sci Rep.7(1):16610.
Lindquist KA, Satpute AB, Wager TD, Weber J, Barrett LF. 2016.The brain basis of positive and negative affect: evidence froma meta-analysis of the human neuroimaging literature. CerebCortex. 26(5):1910–1922.
Lynn CW, Bassett DS. 2019. The physics of brain networkstructure, function and control. Nat Rev Phys. 1(5):318–332.
McIntosh AR, Lobaugh NJ. 2004. Partial least squares analysis ofneuroimaging data: applications and advances. NeuroImage.23(Suppl 1):S250–S263.
Menon V, Uddin LQ. 2010. Saliency, switching, attention andcontrol: a network model of insula function. Brain Struct Funct.214(5–6):655–667.
Misic B, Sporns O. 2016. From regions to connections and net-works: new bridges between brain and behavior. Curr OpinNeurobiol. 40:1–7.
Niendam TA, Laird AR, Ray KL, Dean YM, Glahn DC, Carter CS.2012. Meta-analytic evidence for a superordinate cognitivecontrol network subserving diverse executive functions. CognAffect Behav Neurosci. 12(2):241–268.
Pasqualetti F, Zampieri S, Bullo F. 2014. Controllability metrics,limitations and algorithms for complex networks. IEEE Trans-actions on Control of Network Systems. 1(1):40–52.
Pestilli F, Yeatman JD, Rokem A, Kay KN, Wandell BA. 2014.Evaluation and statistical inference for human connectomes.Nat Methods. 11(10):1058–1063.
Power JD, Cohen AL, Nelson SM, Wig GS, Barnes KA, Church JA,Vogel AC, Laumann TO, Miezin FM, Schlaggar BL, et al. 2011.Functional network organization of the human brain. Neuron.72(4):665–678.
Raichle ME, MacLeod AM, Snyder AZ, Powers WJ, Gusnard DA,Shulman GL. 2001. A default mode of brain function. Proc NatlAcad Sci U S A. 98(2):676–682.
Roalf DR, Quarmley M, Elliott MA, Satterthwaite TD, VandekarSN, Ruparel K, Gennatas ED, Calkins ME, Moore TM, Hop-son R, et al. 2016. The impact of quality assurance assess-ment on diffusion tensor imaging outcomes in a large-scalepopulation-based cohort. NeuroImage. 125:903–919.
Rubinov M, Sporns O. 2010. Complex network measures ofbrain connectivity: uses and interpretations. NeuroImage.52(3):1059–1069.
Shrout PE, Fleiss JL. 1979. Intraclass correlations: uses in assess-ing rater reliability. Psychol Bull. 86(2):420–428.
Sinclair B, Hansell NK, Blokland GA, Martin NG, Thompson PM,Breakspear M, de Zubicaray GI, Wright MJ, McMahon KL. 2015.Heritability of the network architecture of intrinsic brainfunctional connectivity. NeuroImage. 121:243–252.
Smith SM, Fox PT, Miller KL, Glahn DC, Fox PM, MackayCE, Filippini N, Watkins KE, Toro R, Laird AR, et al. 2009.Correspondence of the brain’s functional architecture dur-ing activation and rest. Proc Natl Acad Sci U S A. 106(31):13040–13045.
Sotiropoulos SN, Jbabdi S, Xu J, Andersson JL, Moeller S, Auer-bach EJ, Glasser MF, Hernandez M, Sapiro G, Jenkinson M,et al. 2013. Advances in diffusion mri acquisition and pro-cessing in the human connectome project. NeuroImage. 80:125–143.
Sporns O, Chialvo DR, Kaiser M, Hilgetag CC. 2004. Organization,development and function of complex brain networks. TrendsCogn Sci. 8(9):418–425.
Stiso J, Khambhati AN, Menara T, Kahn AE, Stein JM, Das SR,Gorniak R, Tracy J, Litt B, Davis KA, et al. 2018. White matternetwork architecture guides direct electrical stimulationthrough optimal state transitions. ArXiv e-prints. https://ui.adsabs.harvard.edu/#abs/2018arXiv180501260S (lastaccessed 1 May 2018).
Strike LT, Hansell NK, Couvy-Duchesne B, Thompson PM, deZubicaray GI, McMahon KL, Wright MJ. 2018. Genetic com-plexity of cortical structure: differences in genetic and envi-ronmental factors influencing cortical surface area andthickness. Cereb Cortex.
Stuss DT, Alexander MP. 2000. Executive functions and thefrontal lobes: a conceptual view. Psychol Res. 63(3–4):289–298.
Tang E, Bassett DS. 2018. Colloquium: control of dynamics inbrain networks. Rev Mod Phys. 90(3).
Tang E, Giusti C, Baum GL, Gu S, Pollock E, Kahn AE, Roalf DR,Moore TM, Ruparel K, Gur RC, et al. 2017. Developmentalincreases in white matter network controllability supporta growing diversity of brain dynamics. Nat Commun. 8(1):1252.
Thomas C, Ye FQ, Irfanoglu MO, Modi P, Saleem KS, Leopold DA,Pierpaoli C. 2014. Anatomical accuracy of brain connectionsderived from diffusion mri tractography is inherently limited.Proc Natl Acad Sci U S A. 111(46):16574–16579.
3054 Cerebral Cortex, 2020, Vol. 30, No. 5
Tzourio-Mazoyer N, Landeau B, Papathanassiou D, CrivelloF, Etard O, Delcroix N, Mazoyer B, Joliot M. 2002. Auto-mated anatomical labeling of activations in spm using amacroscopic anatomical parcellation of the mni mri single-subject brain. NeuroImage. 15(1):273–289.
van den Heuvel MP, Sporns O. 2013. Network hubs in the humanbrain. Trends Cogn Sci. 17(12):683–696.
Van Essen DC, Ugurbil K, Auerbach E, Barch D, Behrens TE,Bucholz R, Chang A, Chen L, Corbetta M, Curtiss SW, et al.2012. The human connectome project: a data acquisitionperspective. NeuroImage. 62(4):2222–2231.
Ward JH. 1963. Hierarchical grouping to optimize an objectivefunction. J Am Stat Assoc. 58(301): 236.
Wu-Yan E, BR F, Tang E, Gu S, Pasqualetti F, Bassett DS.2018. Benchmarking measures of network controllability oncanonical graph models. J Nonlinear Sci.
Yeh FC, Verstynen TD, Wang Y, Fernandez-Miranda JC, TsengWY. 2013. Deterministic diffusion fiber tracking improved byquantitative anisotropy. PLoS One. 8(11):e80713.
Yeh FC, Wedeen VJ, Tseng WY. 2010. Generalized q-samplingimaging. IEEE Trans Med Imaging. 29(9):1626–1635.
Yeo BT, Krienen FM, Sepulcre J, Sabuncu MR, Lashkari D,Hollinshead M, Roffman JL, Smoller JW, Zollei L, Polimeni JR,et al. 2011. The organization of the human cerebral cortexestimated by intrinsic functional connectivity. J Neurophysiol.106(3):1125–1165.
Zalesky A, Fornito A, Harding IH, Cocchi L, Yucel M, Pantelis C,Bullmore ET. 2010. Whole-brain anatomical networks: doesthe choice of nodes matter? NeuroImage. 50(3):970–983.
Zimmermann J, Griffiths JD, McIntosh AR. 2018. Unique mappingof structural and functional connectivity on cognition. J Neu-rosci. 38(45):9658–9667.