Hepatitis B virus DNA testing - Department of Health · Figure 1 Clinical pathway: Initial...
187
Hepatitis B virus DNA testing March 2007 MSAC application 1096 Assessment report
Transcript of Hepatitis B virus DNA testing - Department of Health · Figure 1 Clinical pathway: Initial...

Hepatitis B virusDNA testing
March 2007
MSAC application 1096
Assessment report

© Commonwealth of Australia 2007
ISBN (Print) 1-74186-278-7
ISBN (Online) 1-74186-279-5
ISSN (Print) 1443-7120
ISSN (Online) 1443-7139
First printed February 2008
Paper-based publications © Commonwealth of Australia 2007 This work is copyright. Apart from any use as permitted under the Copyright Act 1968, no part may be reproduced by any process without prior written permission from the Commonwealth. Requests and inquiries concerning reproduction and rights should be addressed to the Commonwealth Copyright Administration, Attorney General’s Department, Robert Garran Offices, National Circuit, Barton ACT 2600 or posted at http://www.ag.gov.au/cca Internet sites
© Commonwealth of Australia 2007 This work is copyright. You may download, display, print and reproduce this material in unaltered form only (retaining this notice) for your personal, non-commercial use or use within your organisation. Apart from any use as permitted under the Copyright Act 1968, all other rights are reserved. Requests and inquiries concerning reproduction and rights should be addressed to Commonwealth Copyright Administration, Attorney General’s Department, Robert Garran Offices, National Circuit, Barton ACT 2600 or posted at http://www.ag.gov.au/cca Electronic copies of the report can be obtained from the Medical Service Advisory Committee’s Internet site at http://www.msac.gov.au/
Printed copies of the report can be obtained from:
The Secretary Medical Services Advisory Committee Department of Health and Ageing Mail Drop 106 GPO Box 9848 Canberra ACT 2601
Enquiries about the content of the report should be directed to the above address.
The Medical Services Advisory Committee (MSAC) is an independent committee which has been established to provide advice to the Minister for Health and Ageing on the strength of evidence available on new and existing medical technologies and procedures in terms of their safety, effectiveness and cost-effectiveness. This advice will help to inform government decisions about which medical services should attract funding under Medicare.
MSAC recommendations do not necessarily reflect the views of all individuals who participated in the MSAC evaluation. This report was prepared by the Medical Services Advisory Committee with the assistance of Dr John Gillespie, Ms Antje Smala, Dr Nathan Walters, and Dr Liesl Birinyi-Strachan from M-TAG Pty Ltd, a unit of IMS Health. The report was endorsed by the Minister for Health and Ageing on 4 June 2007.
Publication approval number: P3–1981

Hepatitis B virus DNA testing iii
Contents
Executive summary.................................................................................................. x The procedure................................................................................................................................ x Medical Services Advisory Committee—role and approach .................................................. x MSAC’s assessment of DNA testing for chronic hepatitis B................................................. x
Clinical need...................................................................................................................... x Safety................................................................................................................................. xi Effectiveness.................................................................................................................... xi Summary of evidence for effectiveness of serum HBV DNA testing.................. xvi Cost-effectiveness ........................................................................................................ xvii
Recommendation ....................................................................................................................... xix
Introduction ..........................................................................................................1
Background ......................................................................................................... 2 DNA testing for chronic hepatitis B .......................................................................................... 2
The procedure .................................................................................................................. 2 Intended purpose ............................................................................................................. 3 Reference standard........................................................................................................... 3
Clinical need and burden of disease ........................................................................................... 3 Natural history.................................................................................................................. 4 Serum HBV DNA and treatment for chronic hepatitis B ......................................... 5
Existing procedures ...................................................................................................................... 6 Viral serology .................................................................................................................... 6 Alanine aminotransferase (ALT) levels......................................................................... 6 Liver biopsy....................................................................................................................... 6
Marketing status of the technology ............................................................................................ 7 Current reimbursement arrangement ......................................................................................... 7
Approach to assessment .......................................................................................... 8 Research questions and clinical pathways.................................................................................. 8
Initial assessment of patients with chronic hepatitis B before undergoing antiviral therapy ............................................................................................................................... 8 Monitoring of patients with chronic hepatitis B not receiving antiviral therapy .. 11 Monitoring of patients with chronic hepatitis B receiving antiviral therapy ......... 12
Assessment framework............................................................................................................... 18 Types of evidence .......................................................................................................... 18
Literature review.......................................................................................................................... 18 Search strategy ................................................................................................................ 18 Selection criteria ............................................................................................................. 19 Search results .................................................................................................................. 21
Data extraction ............................................................................................................................ 23 Statistical methods ......................................................................................................... 23 Appraisal of the evidence.............................................................................................. 24
Expert advice ............................................................................................................................... 27
Results of assessment ............................................................................................ 28
iv Hepatitis B virus DNA testing
Is it safe? ....................................................................................................................................... 28 Is it effective? ............................................................................................................................... 28 Direct evidence ............................................................................................................................ 30
Summary of direct evidence ......................................................................................... 30 Does HBV DNA testing improve health outcomes?............................................... 31
Linked evidence........................................................................................................................... 41 HBV DNA test accuracy: Summary of evidence ................................................................... 42
Is HBV DNA testing accurate? ................................................................................... 44 Do serum HBV DNA levels correlate to clinical outcomes?.................................. 69
Summary of evidence for the relationship between serum HBV DNA levels and clinical outcomes ......................................................................................................................... 70
Does HBV DNA testing improve patient management? ........................................ 90 What are the economic considerations? .................................................................................. 91
Summary of economic considerations........................................................................ 91 Test costs......................................................................................................................... 92 Patient management costs ............................................................................................ 95 Financial implications of a positive recommendation .............................................. 98
Conclusions ...................................................................................................... 104 Effectiveness .............................................................................................................................. 104 Cost-effectiveness ..................................................................................................................... 108
Recommendation.................................................................................................. 109
Appendix A MSAC terms of reference and membership................................ 110
Appendix B Advisory panel .............................................................................. 112 Advisory panel for MSAC application 1096 Hepatitis B DNA testing for chronic hepatitis B ....................................................................................................... 112 Evaluators for MSAC application 1096.................................................................... 113
Appendix C Studies included in the review ..................................................... 114
Appendix D Quality criteria.............................................................................. 131
Appendix E Literature search strategies .......................................................... 133
Appendix F List of studies excluded after retrieval ........................................ 138
Appendix G Examples of treatment studies .................................................... 152
Appendix H Major capital equipment cost ...................................................... 157
Appendix I Decision tree................................................................................. 159
Appendix J Cost for other healthcare funders................................................. 160
Abbreviations ...................................................................................................... 161
References ...................................................................................................... 164
Hepatitis B virus DNA testing v
Tables
Table 1 Minimum detection levels of HBV DNA diagnostic assay kits......................... 2 Table 2 Knodell histology activity index ............................................................................. 7 Table 3 PPICO criteria for the use of HBV DNA testing in the initial
assessment of patients with chronic hepatitis B before undergoing antiviral therapy......................................................................................................... 8
Table 4 PPICO criteria for the use of HBV DNA testing in monitoring patients with chronic hepatitis B not receiving antiviral therapy.................... 11
Table 5 PPICO criteria for the use of HBV DNA testing in the monitoring of patients with chronic hepatitis B receiving antiviral therapy............................ 12
Table 6 Electronic databases searched to review HBV DNA testing for chronic hepatitis B literature ................................................................................. 18
Table 7 Selection criteria: HBV DNA test studies considering initial assessment of chronic hepatitis B patients before antiviral therapy................ 19
Table 8 Selection criteria: HBV DNA test studies monitoring chronic hepatitis B patients who were not undergoing antiviral therapy...................... 20
Table 9 Selection criteria: HBV DNA test studies monitoring chronic hepatitis B patients undergoing antiviral therapy ............................................... 21
Table 10 NHMRC levels of evidence for effectiveness .................................................... 25 Table 11 NHMRC levels of evidence for diagnosis........................................................... 25 Table 12 Grading system used to rank included studies ................................................... 26 Table 13 Study characteristics: assessment of the impact of HBV DNA testing
among kidney transplant patients ......................................................................... 32 Table 14 Outcomes of lamivudine treatment among renal transplant recipients.......... 35 Table 15 Study characteristics: Assessment of additional value offered by HBV
DNA testing among lamivudine treated patients............................................... 38 Table 16 Adefovir treatment outcomes among lamivudine resistant patients............... 39 Table 17 Study characteristics: Evaluating the predictive value of serum HBV
DNA testing for initial assessment and monitoring of patients not undergoing antiviral therapy.................................................................................. 45
Table 18 Serum HBV DNA levels and predicting HBeAg reversion ............................. 48 Table 19 Value of serum HBV DNA and ALT to predict liver inflammation
among HBeAg negative patients .......................................................................... 49 Table 20 Diagnostic performance of a hybridisation-based serum HBV DNA
assay .......................................................................................................................... 52 Table 21 Diagnostic performance of baseline tests to differentiate HBeAg
negative chronic hepatitis B from HBeAg negative inactive carriers.............. 54 Table 22 Diagnostic performance of baseline tests to differentiate HBeAg
negative chronic hepatitis B from HBeAg negative inactive carriers when baseline ALT and AST values are normal ................................................ 55

vi Hepatitis B virus DNA testing
Table 23 Diagnostic performance of serum HBV DNA levels for differentiating between inactive carriers and chronic chronic hepatitis B patients ................................................................................................................. 57
Table 24 Characteristics of studies evaluating the predictive value of serum HBV DNA testing among patients undergoing antiviral therapies................. 59
Table 25 Predictive ability of negative HBV DNA test for maintained therapy response.................................................................................................................... 62
Table 26 Predictive value of serum HBV DNA below detection limits for various time points ................................................................................................. 63
Table 27 Prediction of treatment response by serum HBV DNA testing...................... 68 Table 28 Characteristics of a systematic review evaluating the relationship
between serum HBV DNA levels and clinical outcomes ................................. 73 Table 29 Summary of results of a systematic review evaluating the relationship
between serum HBV DNA levels and clinical outcomes ................................. 74 Table 30 Characteristics of studies used to evaluate the relation between serum
HBV DNA levels and clinical outcomes............................................................. 76 Table 31 Relationship between serum HBV DNA levels and long term clinical
outcomes: results from the REVEAL-HBV study group ................................ 79 Table 32 Risk of hepatocellular carcinoma by serum HBV DNA levels at study
entry and last follow-up ......................................................................................... 82 Table 33 Factors associated with prognosis of HBV-associated hepatocellular
carcinoma................................................................................................................. 84 Table 34 Predictive factors for hepatocellular carcinoma in cirrhotic chronic
hepatitis B patients (Ishikawa et al 2001) ............................................................ 85 Table 35 Relationship between serum HBV DNA, ALT levels and liver
histology ................................................................................................................... 87 Table 36 Relation between serum HBV DNA levels and liver histology scores
in HBeAg negative patients ................................................................................... 88 Table 37 Direct cost of chronic hepatitis B in Australia ................................................... 92 Table 38 HBV DNA test costs other than capital costs ................................................... 94 Table 39 Estimated number of chronic hepatitis B patients not undergoing
antiviral treatment that requires monitoring ..................................................... 102 Table 40 Aggregated financial impact of HBV DNA test funding to Medicare
Australia.................................................................................................................. 102 Table 41 Characteristics and results of studies assessing the additional value of
HBV DNA testing on patient outcomes........................................................... 115 Table 42 Study characteristics and results: Evaluating the predictive value of
serum HBV DNA testing in initial assessment and monitoring among patients not undergoing antiviral therapy.......................................................... 117
Table 43 Study characteristics and results: Evaluating the predictive value of serum HBV DNA testing among patients undergoing antiviral therapy .................................................................................................................... 121

Hepatitis B virus DNA testing vii
Table 44 Characteristics and results of a systematic review evaluating the relationship between serum HBV DNA levels and clinical outcomes ......... 124
Table 45 Characteristics and results of studies evaluating the relationship between serum HBV DNA levels and clinical outcomes ............................... 125
Table 46 PreMedline and Medline search for HBV DNA testing, 1966 to April Week 1 2006 .......................................................................................................... 133
Table 47 EMBASE search for HBV DNA testing, 1980 to 2006 Week 15................. 134 Table 48 Cochrane Library search for HBV DNA testing (Issue 2, 5 May 2006) ...... 135 Table 49 Chronic hepatitis B treatment studies: efficacy of lamivudine therapy......... 154 Table 50 Calculation of capital costs per HBV DNA test .............................................. 158 Table 51 Aggregated financial impact of HBV DNA test funding to other
healthcare funders................................................................................................. 160

viii Hepatitis B virus DNA testing
Figures
Figure 1 Clinical pathway: Initial assessment of patients with chronic hepatitis B prior to receiving antiviral therapy and monitoring of chronic hepatitis B patients not undergoing therapy, HBV DNA testing not available ...................................................................................................................... 9
Figure 2 Clinical pathway: Initial assessment of patients with chronic hepatitis B before undergoing antiviral therapy and monitoring of chronic hepatitis B patients not undergoing therapy, with HBV DNA testing available .................................................................................................................... 10
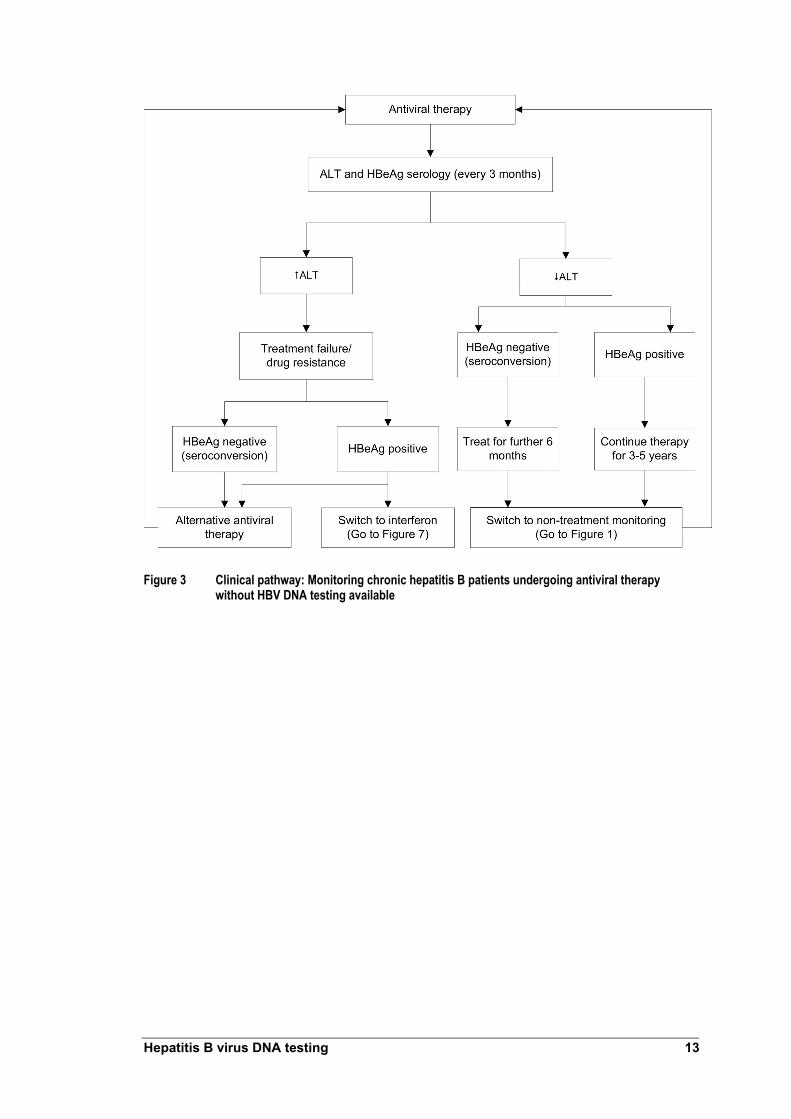
Figure 3 Clinical pathway: Monitoring chronic hepatitis B patients undergoing antiviral therapy without HBV DNA testing available...................................... 13
Figure 4 Clinical pathway: Monitoring HBeAg positive chronic hepatitis B patients undergoing antiviral therapy with HBV DNA testing available .................................................................................................................... 14
Figure 5 Clinical pathway: Monitoring HBeAg negative chronic hepatitis B patients undergoing antiviral therapy with HBV DNA testing available .................................................................................................................... 15
Figure 6 Clinical pathway: Monitoring HBeAg positive chronic hepatitis B patients undergoing interferon without HBV DNA testing available ............ 16
Figure 7 Clinical pathway: Monitoring HBeAg positive chronic hepatitis B patients undergoing interferon therapy with HBV DNA testing available .................................................................................................................... 17
Figure 8 QUOROM flowchart: Identification and selection of studies from the HBV DNA testing literature review .................................................................... 22
Figure 9 Strategy to identify evidence supporting effectiveness of serum HBV DNA testing ............................................................................................................ 29
Figure 10 Average equipment costs per HBV DNA test, by number of tests per batch ......................................................................................................................... 95
Figure 11 Forecast incident HBV cases, 2007–2010........................................................... 99 Figure 12 Forecast of patients treated with antivirals ....................................................... 100
Figure 13 Forecast of patients treated with interferon-α 2a or 2b.................................. 101 Figure 14 Decision-tree model for monitoring of patients on lamivudine
treatment ................................................................................................................ 159


x Hepatitis B virus DNA testing
Executive summary
The procedure
This report considers deoxyribonucleic acid (DNA) tests used as part of the clinical management of patients with chronic hepatitis B infection. The main techniques applied currently to assess hepatitis B virus (HBV) DNA are signal amplification by hybridisation, or branched DNA assays; and target sequence amplification by polymerase chain reaction assays.
Optimal clinical management requires a precise, sensitive and accurate assay to monitor response to antiviral therapy over time. The dynamic quantification ranges of available HBV DNA assays vary considerably but none covers the full range of HBV DNA values observed in treated and untreated chronic hepatitis B patients. Recently developed polymerase chain reaction assays are highly sensitive. These new generation assays enable quantitation of serum HBV DNA in samples with high viral loads without dilution and associated loss of accuracy.
Medical Services Advisory Committee—role and approach
The Medical Services Advisory Committee (MSAC) was established by the Australian Government to strengthen the role of evidence in health financing decisions in Australia. MSAC advises the Minister for Health and Ageing on the evidence relating to the safety, effectiveness and cost-effectiveness of new and existing medical technologies and procedures, and under what circumstances public funding should be supported.
A rigorous assessment of evidence is thus the basis of decision making when funding is sought under Medicare. A team from the Medical Technology Assessment Group (M-TAG) Pty Ltd, a unit of IMS Health, was engaged to conduct a systematic review of literature on hepatitis B DNA testing for chronic hepatitis B. An advisory panel with expertise in this area then evaluated the evidence and provided advice to MSAC.
MSAC’s assessment of DNA testing for chronic hepatitis B
Clinical need
Hepatitis B is one of the world’s most common infectious diseases. It is estimated that in Australia between 91,500 and 163,000 (0.49% and 0.87% of the population, respectively) people are chronically infected with hepatitis B. About half of the infected population are immigrants from southern or north eastern Asia (O’Sullivan et al 2004). Chronic HBV infection is associated with a 30 per cent risk of hepatic cirrhosis and carries a 5 to 10 per cent risk of people with the virus developing hepatocellular carcinoma. Estimates indicate that there are about 1200 deaths in Australia annually that are associated with chronic HBV and its complications.
Chronic hepatitis B infection is manifested by persistence of the virus and HBV surface antigen (HBsAg) in serum, production of hepatitis B e (HBeAg) viral antigens and HBV

Hepatitis B virus DNA testing xi
DNA in the liver. The presence of HBeAg and HBV DNA is associated with an increased risk for developing hepatocellular carcinoma.
The primary goal of HBV treatment is to prevent clinical complications of chronic hepatitis B, including cirrhosis and hepatocellular carcinoma. Recent studies indicate that this can be achieved by durable suppression of viral replication.
The drug therapies currently reimbursed in Australia for chronic hepatitis B are lamivudine, entecavir, interferon-α, and adefovir dipivoxil. Lamivudine, entecavir and interferon-α are available as first line treatments for chronic hepatitis B as Section 100 items on the Pharmaceutical Benefits Scheme (PBS). Adefovir dipivoxil (PBS Section 100, monotherapy or combined with lamivudine) is available only for patients with lamivudine-resistant HBV. Lamivudine resistance occurs as a consequence of long term antiviral treatment for most chronic hepatitis B patients. The current Section 100 access guidelines mandate HBV DNA testing to verify presence of active hepatitis B replication.
Safety
Specimens for HBV DNA testing can be collected simultaneously along with samples for use in other tests, such as biochemical markers. Because specimens are collected using standard blood collection methods there are unlikely to be major safety issues relating to HBV DNA testing.
Effectiveness
Initial assessment of patients prior to antiviral therapy
The research question was:
‘To what extent is hepatitis B virus (HBV) DNA testing safe, and effective (including diagnostic performance and the impact of diagnosis on changes in clinical management and changes in clinical outcomes), and cost-effective in the initial assessment of patients with chronic hepatitis B prior to receiving antiviral therapy relative to current clinical practice?’
Monitoring of patients not receiving antiviral therapy
The research question was:
‘To what extent is hepatitis B virus (HBV) DNA testing safe, and effective (including diagnostic performance and the impact of diagnosis on changes in clinical management and changes in clinical outcomes), and cost-effective in monitoring patients with hepatitis B who do not require treatment relative to current clinical practice?’
Monitoring of patients receiving antiviral therapies
The research question was:
‘To what extent is hepatitis B virus (HBV) DNA testing safe, and effective (including diagnostic performance and the impact of diagnosis on changes in clinical management and changes in clinical outcomes), and cost-effective in monitoring of patients with chronic hepatitis B receiving antiviral therapy relative to current clinical practice?

xii Hepatitis B virus DNA testing
Direct evidence
No studies were identified that had specific objectives of assessing additional benefits derived from HBV DNA testing on health outcomes compared with current clinical practice.
Studies by Chan et al (2002) and Lampertico et al (2005) informed assessment of the value of HBV DNA testing on patient outcomes. These studies compared outcomes between groups of patients before and after two different antiviral therapies were available.
HBV DNA testing and HBsAg positive renal transplant patients
Chan et al (2002) reported evidence to support that HBV DNA testing improves outcomes by reducing mortality risk among HBsAg positive renal transplant patients. This study considered HBV DNA testing to identify transplant patients whose DNA levels were likely to escalate. Patients were pre-emptively administered lamivudine, with or without elevation of alanine aminotransferase (ALT) levels.
When the pre-emptive strategy of HBV DNA testing with lamivudine therapy was readily available throughout the post-transplant period, patient survival was similar to HBsAg negative patients. When unavailable, patient survival declined and the relative risks of death and liver-related death increased. The study’s design did not facilitate making associated additional comparative value assessments about benefits provided by HBV DNA and ALT testing.
HBV DNA testing and monitoring among patients undergoing treatment using lamivudine
Lampertico et al (2005) assessed outcomes of adefovir dipivoxil therapy among chronic hepatitis B e-antigen (HBeAg)-negative patients who were lamivudine resistant. Adefovir dipivoxil was administered either at the time point of genotypic resistance (rising serum HBV DNA levels) or phenotypic resistance (elevated ALT levels). Genotypic resistance can onlt be detected by measuring serum HBV DNA levels. Comparing adefovir dipivoxil treatment outcomes between genotypic and phenotypic resistance cohorts enable assessment of the impact of HBV DNA testing on patient outcomes.
Patients in the genotypic resistance cohort had a significantly greater response when adefovir dipivoxil therapy was co-administered with lamivudine, compared with the phenotypic resistance cohort patients. Greater response was measured as the proportion of patients who had a significantly greater response compared with the phenotypic resistance cohort, as measured by the proportion of patients whose HBV DNA levels were undetectable after three months of adefovir dipivoxil therapy. Normalisation of ALT levels was time dependent in the phenotypic resistance cohort. In contrast, ALT levels were normal throughout the study period in the genotypic patient cohort. Patients in the genotypic cohort were administered adefovir dipivoxil at first signs of lamivudine resistance.
Lampertico et al (2005) found that alanine aminotransferase (ALT) testing alone may not be the most effective means of detecting the initial development of lamivudine resistance. Including regular HBV DNA testing can improve monitoring of patients undergoing lamivudine monotherapy. This study provides evidence that HBV DNA
Hepatitis B virus DNA testing xiii
testing has the potential to alter management of patients undergoing lamivudine therapy and can result in improvements in short term outcomes.
Linked evidence
Because direct evidence relating to HBV DNA testing on patient outcomes was not considered applicable to all research questions in this assessment, linked evidence was required.
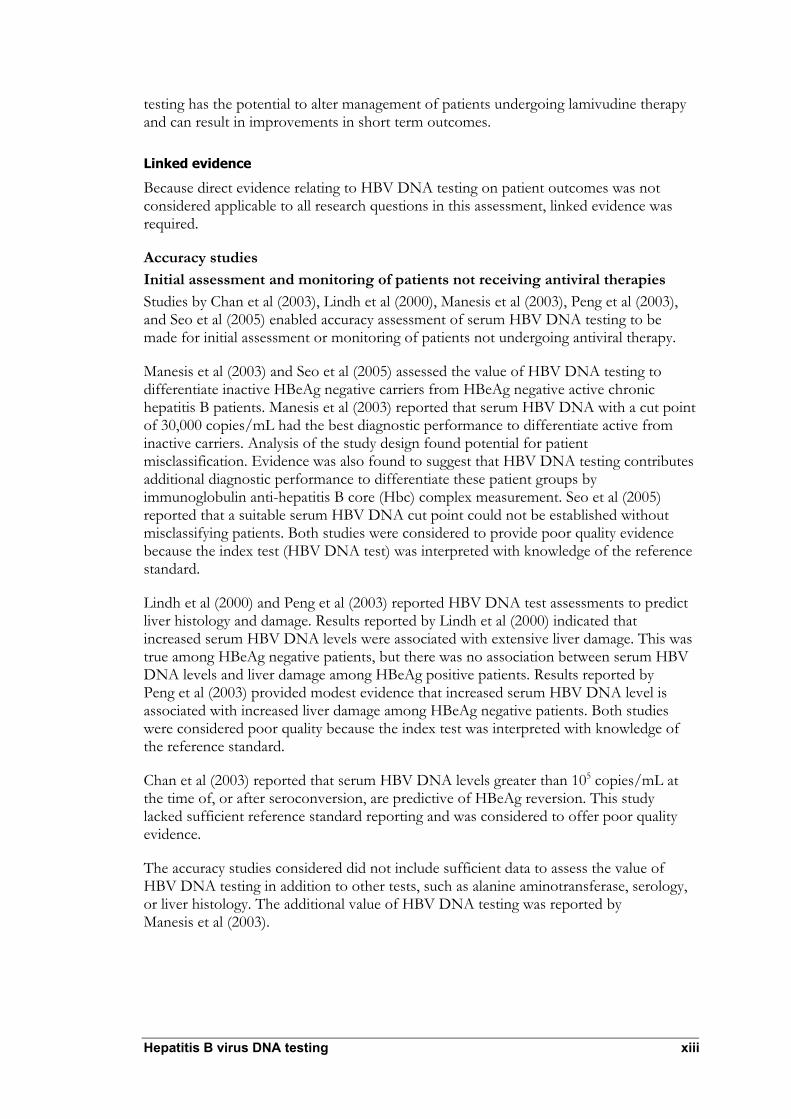
Accuracy studies Initial assessment and monitoring of patients not receiving antiviral therapies Studies by Chan et al (2003), Lindh et al (2000), Manesis et al (2003), Peng et al (2003), and Seo et al (2005) enabled accuracy assessment of serum HBV DNA testing to be made for initial assessment or monitoring of patients not undergoing antiviral therapy.
Manesis et al (2003) and Seo et al (2005) assessed the value of HBV DNA testing to differentiate inactive HBeAg negative carriers from HBeAg negative active chronic hepatitis B patients. Manesis et al (2003) reported that serum HBV DNA with a cut point of 30,000 copies/mL had the best diagnostic performance to differentiate active from inactive carriers. Analysis of the study design found potential for patient misclassification. Evidence was also found to suggest that HBV DNA testing contributes additional diagnostic performance to differentiate these patient groups by immunoglobulin anti-hepatitis B core (Hbc) complex measurement. Seo et al (2005) reported that a suitable serum HBV DNA cut point could not be established without misclassifying patients. Both studies were considered to provide poor quality evidence because the index test (HBV DNA test) was interpreted with knowledge of the reference standard.
Lindh et al (2000) and Peng et al (2003) reported HBV DNA test assessments to predict liver histology and damage. Results reported by Lindh et al (2000) indicated that increased serum HBV DNA levels were associated with extensive liver damage. This was true among HBeAg negative patients, but there was no association between serum HBV DNA levels and liver damage among HBeAg positive patients. Results reported by Peng et al (2003) provided modest evidence that increased serum HBV DNA level is associated with increased liver damage among HBeAg negative patients. Both studies were considered poor quality because the index test was interpreted with knowledge of the reference standard.
Chan et al (2003) reported that serum HBV DNA levels greater than 105 copies/mL at the time of, or after seroconversion, are predictive of HBeAg reversion. This study lacked sufficient reference standard reporting and was considered to offer poor quality evidence.
The accuracy studies considered did not include sufficient data to assess the value of HBV DNA testing in addition to other tests, such as alanine aminotransferase, serology, or liver histology. The additional value of HBV DNA testing was reported by Manesis et al (2003).

xiv Hepatitis B virus DNA testing
Monitoring of patients receiving antiviral therapies Lamivudine The value of HBV DNA testing among patients treated with lamivudine was assessed by Buti et al (2001) and Zollner et al (2001). Buti et al (2001) reported using real-time polymerase chain reaction. Negative HBV DNA test results at month three of therapy was found to be a sensitive indicator of sustained response. When HBV DNA testing was positive at month 3, this was a moderately specific indicator of lack of sustained response. This study was considered poor quality because the index test was also the reference standard
Zollner et al (2001) reported sequential HBV DNA measurement by real time polymerase chain reaction during lamivudine therapy. HBV DNA was assessed to determine its value to predict HBeAg seroconversion and emergence of drug resistance. Results from this study indicated that HBV DNA tests reporting a value of <log 2 copies/mL at month 12 of therapy was the optimal time to predict seroconversion or resistance to lamivudine. Patients with HBV DNA levels above the detection limit at 12 and 15 months did not have seroconversion (negative predictive value = 100%), indicating that these patients did not respond to therapy. Evidence reported by this study was also considered to be poor quality because interpretation of the index test was not independent from the reference standard.
The additional value of HBV DNA testing was not reported by these studies.
Interferon Lindh et al (2001) and van der Eijk et al (2006) assessed the value of HBV DNA testing to predict treatment response among patients undergoing interferon treatment. Lindh et al (2001) sought to determine whether pre-treatment HBV DNA levels could predict sustained virological response among patients treated with interferon who had undergone earlier priming doses of prednisolone. There was limited value in differentiating non-sustained responders from sustained responders when a serum HBV DNA threshold value of <log 8.7 copies/mL was used.
Van der Eijk et al (2006) evaluated HBV DNA testing by real-time polymerase chain reaction assay as a response predictor among HBeAg positive chronic hepatitis B patients who were treated with interferon-α. Log HBV DNA at baseline >8 and <1.0 log decrease between baseline and week 12 was better able to predict the proportion of patients who would not respond to treatment.
The additional value of HBV DNA testing was not reported by these studies. Both studies were considered poor quality evidence because the index test was part of the reference standard.
Serum HBV DNA and clinical outcomes The absence of studies that assessed the accuracy or predictive ability of HBV DNA testing to predict long term clinical outcomes, such as cirrhosis and hepatocellular carcinoma, meant that it was considered necessary to provide supporting evidence indicating the link between HBV DNA levels and clinical outcomes. These studies did not assess whether the test changed outcomes, but offer supportive evidence that knowledge of serum HBV DNA levels can assist to determine patients’ prognoses.

Hepatitis B virus DNA testing xv
Systematic review A systematic review by Mommeja-Marin et al (2003) investigated the relationship between serum HBV DNA levels and clinical outcomes. Although this systematic review did not show that the (additional) using the test affects outcomes, evidence was provided that HBV DNA levels can be predictive of outcome and may illustrate treatment efficacy.
Hepatocellular carcinoma risk The relationship between serum HBV DNA levels and hepatocellular carcinoma was investigated by Chen et al (2006), Harris et al (2003) and Okhubo et al (2001). The long term, population based prospective study by Chen et al (2006) found that increased HBV DNA levels at baseline indicated an independent risk factor for hepatocellular carcinoma among both HbeAg negative and positive patients. Patients with elevated serum HBV DNA levels, who did not have liver cirrhosis, carried increased risk of developing hepatocellular carcinoma. These analyses involved sampling HBV DNA at a single point. This approach did not capture potential variations in viral replication over the follow-up period or relationship to hepatocellular carcinoma. Additional analysis indicated that persistently elevated serum HBV DNA levels lead to an increased risk of developing hepatocellular carcinoma.
Okhubo et al (2001) found that serum HBV DNA level measured when hepatocellular carcinoma was diagnosed was an independent prognostic factor for survival. Lower HBV DNA levels were associated with increased patient survival.
Stable or unstable serum HBV DNA seroconversion was found to be a prognostic factor for hepatocellular carcinoma death by Harris et al (2003). Patients who became HBV DNA negative spontaneously, regardless of whether levels were stable were found to have an increased risk of hepatocellular carcinoma death. Evidence indicating that low serum HBV DNA levels at baseline are associated with a reduced risk of hepatocellular carcinoma death was also presented
Cirrhosis risk The relationship between serum HBV DNA levels and risk of cirrhosis was explored by the REVEAL-HBV study. Iloeje et al (2005) reported that increased baseline serum HBV DNA levels were found to be associated with a greater cumulative incidence of cirrhosis. Serum HBV DNA levels were found to be an independent risk factor for cirrhosis. The study’s methodology required HBV DNA to be sampled at a single point which did not capture potential variations in viral replication during the follow-up period.
Risk of hepatocellular carcinoma among patients with HBV-related cirrhosis Ishikawa et al (2001) and Mahmoud et al (2005) investigated the association between serum HBV DNA levels and development of hepatocellular carcinoma among patients with HBV-related cirrhosis. Both studies reported that elevated serum HBV DNA was the strongest prognostic factor for hepatocellular carcinoma among patients with HBV-related cirrhosis.
Risk of hepatocellular carcinoma recurrence after resection Kubo et al (2000) and Kubo et al (2003) assessed the value of HBV DNA testing as a prognostic factor for hepatocellular carcinoma recurrence after resection. These studies suggest that evidence of high serum HBV DNA levels before resection is a significant prognostic indicator of recurrent hepatocellular carcinoma.

xvi Hepatitis B virus DNA testing
Summary of evidence for effectiveness of serum HBV DNA testing
A review was conducted to identify evidence relating to the effectiveness of HBV DNA testing for chronic hepatitis B patients.
Direct evidence
There was limited evidence that:
• HBV DNA testing in addition to ALT testing alters patient management and improves short term health outcomes when used to identify drug resistance among patients undergoing lamivudine therapy
• HBV DNA test monitoring improved health outcomes among HbsAg positive renal transplant patients. The additional value provided by HBV DNA testing for these patients could not be measured.
Linked evidence: Accuracy studies
HBV DNA testing, initial assessment and monitoring of patients not undergoing antiviral therapy There was limited evidence that HBV DNA testing used in initial assessment or monitoring of patients not undergoing antiviral therapy:
• HBV DNA testing enabled differentiation between inactive HBeAg negative carriers and HBeAg negative active chronic hepatitis B patients
• increased serum HBV DNA levels were associated with increased liver damage among HBeAg negative patients
• elevated serum HBV DNA levels were predictive of HbeAg reversion.
There was insufficient evidence for the additional value of HBV DNA testing in these patient groups.
HBV DNA testing and monitoring among patients undergoing antiviral therapy There was limited evidence to support that HBV DNA testing used to monitor patients undergoing antiviral therapies:
• HBV DNA testing can predict sustained response to lamivudine therapy
• HBV DNA testing can predict HbeAg seroconversion or resistance to lamivudine
• HBV DNA testing can predict patients who would not respond to lamivudine therapy
• pre-treatment HBV DNA levels can differentiate between sustained and non-sustained responders among patients treated with interferon-α
• HBV DNA testing at baseline and during treatment can predict patients who would not respond to interferon treatment.

Hepatitis B virus DNA testing xvii
There was insufficient evidence for the additional value of HBV DNA testing in these patient groups.
Linked evidence: Serum HBV DNA testing and clinical outcomes Evidence concerning the relationship between HBV DNA levels and long term clinical outcomes is also summarised:
• a systematic review provided evidence that HBV DNA testing can predict outcomes and illustrate treatment efficacy
• serum HBV DNA levels were shown to be indicative of survival following hepatocellular carcinoma diagnosis and risk of death from hepatocellular carcinoma
• elevated serum HBV DNA levels were associated with increased risk and cumulative incidence of hepatocellular carcinoma
• elevated serum HBV DNA levels were associated with increased risk and cumulative incidence of cirrhosis
• elevated serum HBV DNA levels were a prognostic factor for hepatocellular carcinoma among patients with HBV-related cirrhosis
• elevated serum HBV DNA levels were prognostic of recurrence following surgical resection to treat hepatocellular carcinoma.
Cost-effectiveness
Based on price information for the four different test systems currently available in Australia (Digene Hybrid Capture II assay, Bayer Versant HBV 3.0 test, Roche COBAS TaqMan HBV test, and Qiagen [Artus] RealArt HBV PCR), each HBV DNA test would cost Medicare Australia about $130, if listed for reimbursement.
Research questions were formulated to assess economic considerations associated with use of HBV DNA testing:
1. to conduct initial assessments of patients with chronic hepatitis B infection before initiating drug treatment
2. to monitor patients not undergoing antiviral treatment, and 3. to monitor patients undergoing antiviral therapy.
Testing of all newly reported HBV infections, assuming patients were tested once, would create demand for around 6500 tests per year. Based on historic incidence, future demand is forecast to remain stable at this rate.
The number of chronic hepatitis B patients to be monitored while not undergoing antiviral drug treatment is expected to be low and stable at about 8200 patients annually. Each patient would be tested annually to monitor disease course.
Increased HBV DNA testing could be expected if used to monitor patients undergoing antiviral treatment, including interferon. Numbers of patients treated with lamivudine

xviii Hepatitis B virus DNA testing
with or without co-administration of adefovir, or those treated with interferon, is expected to increase over time, generating higher demand for HBV DNA testing. Patients receiving antiviral treatments are expected to be tested quarterly; people treated with interferon would be tested three times during a defined 12-month period. The total number of monitoring tests was calculated to be around 4700 to 5900 tests per year.
Total demand is forecast to be about 20,000 tests annually. The expected cost to Medicare Australia would be between $2.5 and $2.7 million per year.
Other healthcare funders are also likely to benefit from listing HBV DNA testing on the Medicare Benefits Schedule because the test can identify patients who would not benefit from particular drug treatments. Patients who test negative for hepatitis B virus could discontinue drug treatment, and appropriate early interventions applied when drug resistance occurs. A detailed assessment of these benefits is not included because current evidence does not support changing long term outcomes following HBV DNA testing.

Hepatitis B virus DNA testing xix
Recommendation
MSAC has considered the safety, effectiveness and cost effectiveness of the use of hepatitis B assays in the pre-treatment assessment and in the monitoring of patients with chronic hepatitis B.
MSAC finds there is sufficient evidence of the safety, effectiveness and cost effectiveness of hepatitis B assay in the pre-treatment and in the monitoring of patients with chronic hepatitis B.
MSAC recommends that public funding be provided for the use of hepatitis B assay in patients with chronic hepatitis B.
MSAC further recommends that the number of hepatitis B assays for pre-treatment assessment or for the monitoring of patients with chronic hepatitis B who are not on antiviral therapy be restricted to one assay in a twelve month period and for patients on antiviral therapy the number of assays be restricted to four assays in a twelve month period.
–The Minister for Health and Ageing accepted this recommendation on 4 June 2007–


Hepatitis B virus DNA testing 1
Introduction
The Medical Services Advisory Committee (MSAC) has reviewed the use of hepatitis B DNA diagnostic testing for chronic hepatitis B. MSAC evaluates new and existing health technologies and procedures for which public funding is sought in terms of their safety, effectiveness and cost-effectiveness, while taking into account other issues such as access and equity. MSAC adopts an evidence-based approach to its assessments, based on reviews of the scientific literature and other information sources, including clinical expertise.
MSAC’s terms of reference and membership are at Appendix A. MSAC is a multidisciplinary expert body, comprising members drawn from such disciplines as diagnostic imaging, pathology, oncology, surgery, internal medicine and general practice, clinical epidemiology, health economics, consumer health and health administration.
This report summarises the assessment of current evidence for hepatitis B DNA testing for the chronic phase of the disease.

2 Hepatitis B virus DNA testing
Background
DNA testing for chronic hepatitis B
The procedure
Deoxyribuonucleic acid (DNA) tests used in the management of hepatitis B viral infection were assessed for this report. Measurement of hepatitis B virus (HBV) DNA occurs during routine clinical assessment and monitoring of people with chronic hepatitis B infections. Serum samples are obtained during clinical assessment which are analysed for viral serology, alanine aminotransferase (ALT) and HBV DNA levels.
The serum sample is processed for DNA testing. The resulting sample is then assessed using one of the available HBV DNA diagnostic assay kits. This involves further sample preparation, DNA amplification and detecting HBV DNA specific to the assay kit.
There are two main techniques to assess HBV DNA—either through signal amplification (sometimes referred to as hybridisation or branched DNA assays) or target sequence amplification (polymerase chain reaction [PCR] assays). Target sequence amplification techniques use primers to target specific HBV DNA sequences. Target sequences then undergo PCR amplification and direct detection to quanitify HBV DNA. Signal amplification techniques use target probes (ribonucleic acid [RNA] or oligonucleotide sequences) which combine with target DNA to form hybrid sequences. These hybrid sequences are then isolated, amplified and quantitatively assessed, typically by measuring a chemiluminescent reaction (Chen et al 2006).
Diagnostic assay kits quantify HBV DNA levels present in samples. Assay kits have different minimum detection levels for HBV DNA (see Table 1). Diagnostic capabilities may differ between kits, an aspect which was considered in this assessment.
Table 1 Minimum detection levels of HBV DNA diagnostic assay kits
Assay Minimum detection level Signal amplification assays
Genostix 4 to 5 x 10⁵ c/mLa Digene HBV test hybrid capture II (standard) 1.4 x 10⁵ c/mL Digene HBV test hybrid capture II (ultra sensitive) 4.7 x 10³ c/mL Quantiplex 7 x 10⁵ c/mL
Target sequence amplification assays Microwell plate Amplicor HBV monitor 103 c/mL Cross-linking naxcor polymerase chain reaction 5 x 10⁵ c/mL Real time polymerase chain reaction 300 c/mL Cobas Amplicor HBV monitor 4 x 10² c/mL Polymerase chain reaction beacon molecular detection 100 c/mL TMA-HPA 5 x 10³ c/mL
Abbreviations: c/mL, copies per millilitre; HBV, hepatitis B virus; TMA-HPA, transcription-mediated amplification and hybridisation protection assay
a Corrected value 4 to 5 x 10⁸ c/mL Source: Mommeja et al (2003)

Hepatitis B virus DNA testing 3
Intended purpose
The viral load, defined as the amount of HBV DNA contained in a serum sample, is considered to be a measure of viral replication level. These levels can be used to identify optimal timing for initiation, continuation, altering or termination of antiviral therapy (Keeffe et al 2004).
The purpose of HBV DNA testing is:
• for initial and ongoing assessment of viral load among patients with chronic hepatitis B who are not undergoing antiviral drug treatment, and
• for subsequent viral load monitoring among patients with chronic hepatitis B undergoing antiviral treatment.
Reference standard
Diagnoses made with new tests must be compared with the true status of the relevant disease to ascertain the test’s accuracy. In practical and ethical terms it is often unfeasible to determine unequivocal disease status. Proxy measures—such as another diagnostic test or clinical judgement—may be applied to stand for disease states. The best available measure of disease is called the reference standard.
In this review, the reference standard to assess and monitor chronic hepatitis B infection is histologically examined hepatic tissue obtained by biopsy. Other reference standards regarded as approporiate included clinical outcomes, such as disease progression (cirrhosis, cancer, death); ALT normalisation; viral load (determined by HBV DNA testing); durable seroconversion; and quality of life. Histological sampling combined with clinical outcomes is also regarded as an appropriate reference standard.
Clinical need and burden of disease
The World Health Organization estimates that more than 350 million people globally are chronically infected with the hepatitis B virus (Kao et al 2002; McMahon 2004). In Australia, chronic hepatitis B prevalence is between 91,500 and 163,000 (0.49% and 0.87% of the Australian population, respectively). About half of all infected people migrated from southern or north eastern Asia (O’Sullivan et al 2004).
Chronic hepatitis B infection is associated with a 30 per cent risk of cirrhosis and 5–10 per cent risk of developing hepatocellular carcinoma. About 1200 people in Australia (Gust 1996), and about a million people worldwide (Kao et al 2002; McMahon 2004), die from chronic hepatitis B infection and its complications annually. Australia implemented universal hepatitis B vaccination for all newborns in 2000, but impact on hepatitis B incidence is unlikely to be evident for at least another 15 years.

4 Hepatitis B virus DNA testing
Natural history
About 3–5 per cent of adults exposed to the hepatitis B virus will develop chronic infection—circulating hepatitis B surface (HBsAg) and hepatitis B e (HBeAg) antigens will be evident in these people. HBeAg seroconversion, where there is clearance of HBeAg and development of HBeAg (anti-HBe) antibodies, can occur spontaneously or result from treatment. Although these people may have circulating HBsAg particles, levels of HBV DNA are low or undetectable. These people have a reduced risk of hepatic decompensation and a twofold lower risk of death (McMahon 2004). Up to 30 per cent of infected people may have repeated ALT flares which can lead to progressive fibrosis (McMahon 2004). Hepatitis B viral infection does not persist among people with acute disease. People with acute hepatitis B virus initially test positive for HBsAg, HBeAg, and HBV DNA. These markers disappear over time.
Although HBeAg can be regarded as a hepatitis B virus replication marker, the type of HBV genotype (A–H) determines the percentage of people (1–25%) who develop HBeAg (pre-core) escape mutants during HBeAg seroconversion. The genotype variants prevent formation of HBeAg but allow for moderate-to-high levels of viral replication. Genotype variants are indicated by persistently elevated serum ALT levels, absence of HBeAg, presence of anti-HBe, and moderate to high HBV DNA levels (typically >105copies/mL). This form of infection is termed HBeAg-negative chronic hepatitis B. Chronic hepatitis B can be classified as either of two major forms: HBeAg positive and HBeAg negative.
Chronic hepatitis B has four phases: replicative/immune tolerant, HBeAg clearance, low or non-replicative and replicative or re-activating.
The replicative/immune tolerant phase is characterised by high levels of HBV DNA, HBeAg positivity, minimal liver inflammation, normal liver enzyme levels (generally), and low risk of progression to liver disease.
HBeAg clearance occurs in the second phase. HBV DNA levels fluctuate and decline during this stage, HBeAg is lost, and seroconversion (development of anti-HBe antibodies) occurs. There is a moderate-to-high degree of liver inflammation and liver enzymes, and liver disease progression is often rapid. This phase can be protracted and many people remain HBeAg positive for years, if not indefinitely. During seroconversion some patients develop the pre-core or basic core promoter variant of the virus that results in HBeAg negative chronic hepatitis B. People whose HBeAg clearance phase is short often progress to the third phase of low or non-replicative chronic hepatitis B.
The third phase is associated with low to undetectable levels of serum HBV DNA, persistently normal liver enzymes and negligible liver inflammation, minimal liver damage and low risk of liver disease.
People in phase three can progress to the fourth phase of chronic hepatitis B—the replicative or re-activating phase. Features of this phase are that HBV DNA levels increase, HBeAg is usually negative, serum enzyme levels are elevated and there is potential for further liver disease progression. Immune suppression, resulting from steroid therapy or chemotherapy, can contribute to development of replicative disease.

Hepatitis B virus DNA testing 5
Spontaneous flares of disease activity during the natural course of chronic hepatitis B may lead to progressive hepatic fibrosis, cirrhosis and carcinogenesis (Perrillo 2001). Mortality rates at five years are 16 per cent for those with compensated cirrhosis, where the liver is damaged but can still function (Realdi et al 1994; Perrillo 2004), and 65–86 per cent (in the absence of liver transplantation) for people with decompensated cirrhosis, and whose liver function is severely impaired (Perrillo 2004).
The primary goal of treating hepatitis B is to prevent clinical complications of chronic disease. Recent data indicate that this goal can be achieved by durable suppression of viral replication. The optimal target level for HBV DNA suppression, associated with favourable alteration of natural history (if any), has not yet been conclusively identified. Cohort studies of chronic hepatitis B patients have shown that the risk of progression to advanced liver disease complications is considerably higher among patients with replicative disease compared with non-replicative disease (Realdi et al 1994; Villeneuve 1994). Control of serum HBV DNA levels has important clinical implications.
Serum HBV DNA and treatment for chronic hepatitis B
A panel of USA-based hepatologists have developed a treatment algorithm for chronic hepatitis B that uses serum HBV DNA levels to inform clinical decisions about treatment initiation (Keeffe et al 2004). Specifically, a serum HBV DNA threshold of ≥104–105 IU/mL was recommended as a candidacy baseline for patients with HBeAg positive chronic hepatitis B. A lower threshold (≥103–104 IU/mL) was recommended for patients with HBeAg negative chronic hepatitis B. A further recommendation addresses treatment for patients with decompensated cirrhosis.
The treatment algorithm was subsequently revised to include a serum HBV DNA threshold level for treatment candidacy of 20 000 IU/mL or more for patients with HBeAg-positive chronic hepatitis B (Keeffe et al 2006). Other modifications to the earlier treatment algorithm include a serum HBV DNA threshold of 2000 IU/mL for patients with HBeAg-negative chronic hepatitis B and 200 IU/mL or more for patients with decompensated cirrhosis (Keeffe et al 2006).
The American Association for the Study of Liver Disease (AASLD) practice guidelines (Lok 2004) recommend that patients with decompensated cirrhosis patients whose HBV DNA <104–105 IU/mL should be referred to a liver transplant unit for assessment and treatment. These data also recommend that treatment criteria be based on elevated serum ALT, and/or liver biopsy findings.
Therapies available to treat chronic hepatitis B in Australia are:
1. lamivudine
2. interferon-α (including α-2a and α-2b, which are also available as investigational agents for HBV in their pegylated forms)
3. adefovir dipivoxil
4. entecavir.
Lamivudine, interferon-α and entecavir are available as first line treatments for chronic hepatitis B as Section 100 items on the PBS. Adefovir dipivoxil (monotherapy or combined with lamivudine) (also Section 100) is available only for patients with

6 Hepatitis B virus DNA testing
lamivudine-resistant HBV. Lamivudine resistance occurs as a consequence of the need for long term antiviral treatment for most chronic hepatitis B patients (Locarni et al 2004).
HBV DNA testing is an essential criterion to establish patient eligibility for treatment with lamivudine, interferon-α, adefovir dipivoxil, or entecavir.
Existing procedures
Viral serology
Hepatitis B virus surface antigen (HBsAg and HBeAg) measurement is used in diagnosis and during routine clinical assessment and monitoring of chronic infection. Confirmation of serological marker HBsAg in serum taken over six months or more indicates chronic hepatitis B infection. Active HBV replication is indicated by the presence of the serological marker HBeAg in serum samples. Absence of this marker does not necessarily indicate that viral replication is not occurring, even among patients who were previously HBeAg positive, because some hepatitis B virus variants have mutations that prevent serological detection of this antigen (Keeffe et al 2004).
Alanine aminotransferase (ALT) levels
Alanine aminotransferase (ALT) enzyme level measurement is used to monitor liver inflammation and inform routine clinical assessment. ALT levels within the normal range are generally regarded as predictive of quiescence of inflammatory activity, and above normal levels indicate active inflammation (Keeffe et al 2004). Elevated ALT levels can indicate hepatitis B infection, but a number of other conditions can also cause active liver inflammation.
Liver biopsy
Liver biopsy is used in the clinical assessment of chronic hepatitis B infection. Biopsied liver tissue is histologically examined to determine the extent of liver disease. It is a minimally invasive surgical technique using a biopsy needle that involves percutaneous sampling, with or without CT or ultrasound imaging, of a small portion of the liver (Zaman et al 2006). Liver biopsy complications may include pain and intrahepatic and/or subcapsular bleeding. Arteriovenous fistula, haemorrhage, bile peritonitis, bacteraemia, sepsis, pneumothorax and haemothorax are less common complications. There is a small risk of mortality associated with liver biopsy (Zaman et al 2006).
Biopsied liver tissue is typically assessed by a pathologist using a histological grading scale to determine disease extent. The Knodell histology activity index, Scheuer system, Ishak system, Ishak modified histology activity index and the METAVIR system are common grading scales. The Knodell histology activity index is shown in Table 2.

Hepatitis B virus DNA testing 7
Table 2 Knodell histology activity index
Periportal +/– bridging necrosis
Intralobular degeneration and focal necrosis
Portal inflammation Fibrosis
None 0 None 0 None 0 None 0 Mild piecemeal necrosis 1 Mild (acidophilic bodies,
ballooning degeneration and/or scattered foci of hepatocellular necrosis in less than a third of lobules or nodules)
1 Mild (few inflammatory cells in less than a third of portal tracts)
1 Fibrous portal expansion
1
Moderate piecemeal necrosis (involves <50% of the circumference of most portal tracts)
3 Moderate (involvement of one to two-thirds of lobules or nodules)
3 Moderate (increased incidence of inflammatory cells in one to two-thirds of portal tracts)
3 Bridging fibrosis (portal-portal or portal-central linkage)
3
Marked piecemeal necrosis (involves >50% of the circumference of most portal tracts)
4 Marked (involvement of more than two-thirds of lobules or nodules)
4 Marked (high density of inflammatory cells in more than two-thirds of portal tracts)
4 Cirrhosis 4
Moderate piecemeal necrosis plus bridging necrosis a
5
Marked piecemeal necrosis plus bridging necrosis a
6
Multilobular necrosis 10 a Hepatitis activity index (HAI) score is the combined scores for necrosis, inflammation, and fibrosis Source: Brunt EM (2000). ‘Grading and staging the histopathological lesions of chronic hepatitis: The Knodell histology activity index and beyond’. Hepatology 31: 241–246. Reprinted with permission of Wiley-Liss, Inc., a subsidiary of John Wiley & Sons, Inc.
HBV DNA testing would be used as an additional test in routine clinical assessment and monitoring of people with chronic hepatitis B infection. The relative value of HBV DNA testing to viral serology, ALT enzyme level measurement, and liver biopsy were considered in this assessment.
Marketing status of the technology
Commercial HBV DNA diagnostic assay kits are available in Australia. They are exempted from the current regulatory requirements of the Therapeutic Goods Act, 1989.
Current reimbursement arrangement
There is currently no reimbursement arrangement with the Medicare Benefits Scheme regarding HBV DNA testing.
8 Hepatitis B virus DNA testing
Approach to assessment
Research questions and clinical pathways
Initial assessment of patients with chronic hepatitis B before undergoing antiviral therapy
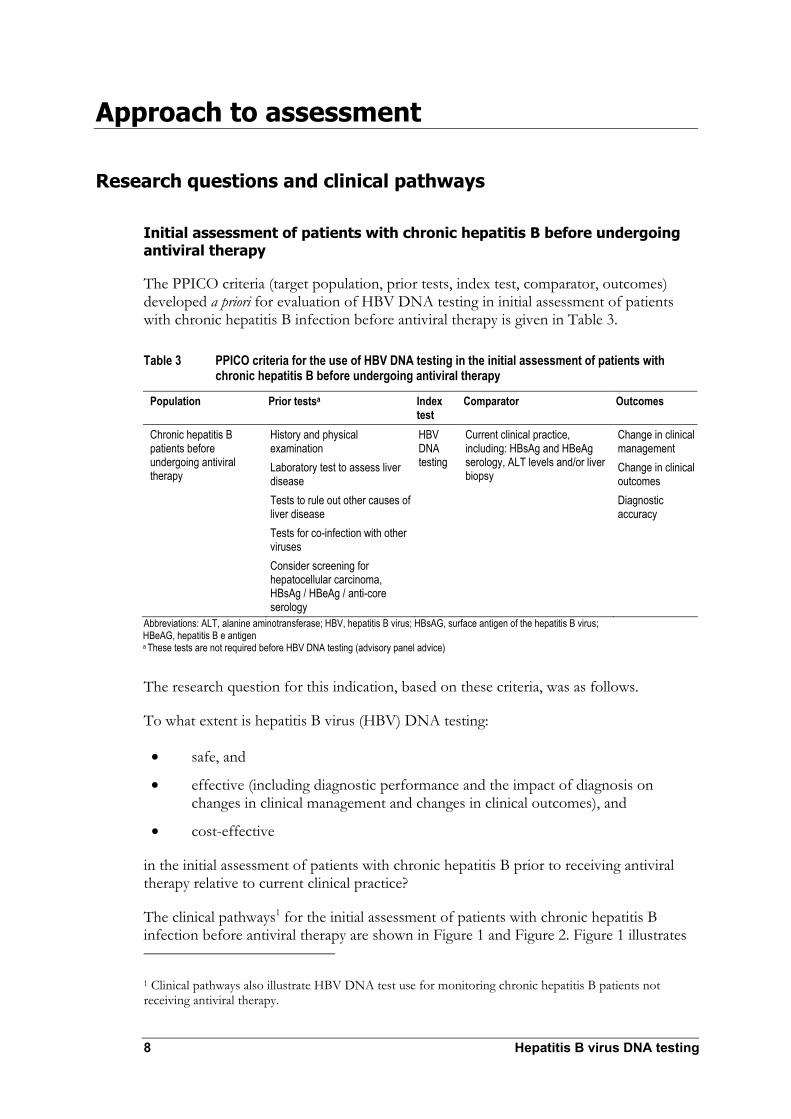
The PPICO criteria (target population, prior tests, index test, comparator, outcomes) developed a priori for evaluation of HBV DNA testing in initial assessment of patients with chronic hepatitis B infection before antiviral therapy is given in Table 3.
Table 3 PPICO criteria for the use of HBV DNA testing in the initial assessment of patients with chronic hepatitis B before undergoing antiviral therapy
Population Prior testsa Index test
Comparator Outcomes
Chronic hepatitis B patients before undergoing antiviral therapy
History and physical examination Laboratory test to assess liver disease Tests to rule out other causes of liver disease Tests for co-infection with other viruses Consider screening for hepatocellular carcinoma, HBsAg / HBeAg / anti-core serology
HBV DNA testing
Current clinical practice, including: HBsAg and HBeAg serology, ALT levels and/or liver biopsy
Change in clinical management Change in clinical outcomes Diagnostic accuracy
Abbreviations: ALT, alanine aminotransferase; HBV, hepatitis B virus; HBsAG, surface antigen of the hepatitis B virus; HBeAG, hepatitis B e antigen a These tests are not required before HBV DNA testing (advisory panel advice)
The research question for this indication, based on these criteria, was as follows.
To what extent is hepatitis B virus (HBV) DNA testing:
• safe, and
• effective (including diagnostic performance and the impact of diagnosis on changes in clinical management and changes in clinical outcomes), and
• cost-effective
in the initial assessment of patients with chronic hepatitis B prior to receiving antiviral therapy relative to current clinical practice?
The clinical pathways1 for the initial assessment of patients with chronic hepatitis B infection before antiviral therapy are shown in Figure 1 and Figure 2. Figure 1 illustrates
1 Clinical pathways also illustrate HBV DNA test use for monitoring chronic hepatitis B patients not receiving antiviral therapy.
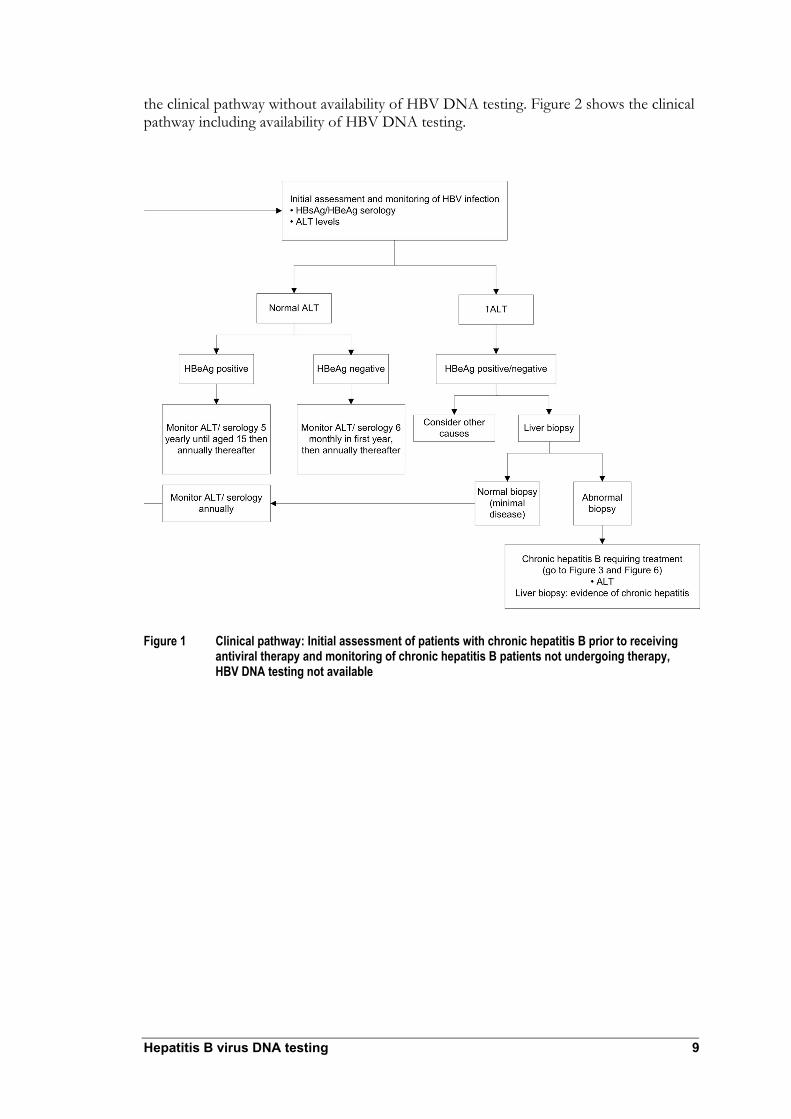
Hepatitis B virus DNA testing 9
the clinical pathway without availability of HBV DNA testing. Figure 2 shows the clinical pathway including availability of HBV DNA testing.
Figure 1 Clinical pathway: Initial assessment of patients with chronic hepatitis B prior to receiving antiviral therapy and monitoring of chronic hepatitis B patients not undergoing therapy, HBV DNA testing not available

10 Hepatitis B virus DNA testing
Figure 2 Clinical pathway: Initial assessment of patients with chronic hepatitis B before undergoing antiviral therapy and monitoring of chronic hepatitis B patients not undergoing therapy, with HBV DNA testing available
a Current recommendations for treatment thresholds differ between HBeAg positive patients (105), HBeAg negative patients (104) and inpatients with cirrhosis or liver decompensation (103)

Hepatitis B virus DNA testing 11
Monitoring of patients with chronic hepatitis B not receiving antiviral therapy
The PPICO criteria (target population, prior tests, index test, comparator, outcomes) developed a priori for evaluation of HBV DNA testing to monitor chronic hepatitis B patients who were not undergoing antiviral therapy are presented in Table 4.
Table 4 PPICO criteria for the use of HBV DNA testing in monitoring patients with chronic hepatitis B not receiving antiviral therapy
Population Prior testsa Index test Comparator Outcomes
Chronic hepatitis B patients not undergoing treatment
History and physical examination Laboratory test to assess liver disease Tests to rule out other causes of liver disease Tests for co-infection with other virusesConsider screening for hepatocellular carcinoma, HBsAg / HBeAg / anti-core serology, HBV DNA testing
HBV DNA testing
Current clinical practice, including: HBsAg and HBeAg serology and/or ALT levels
Change in clinical management Change in clinical outcomes Diagnostic accuracy
Abbreviations: ALT, alanine aminotransferase; HBV, hepatitis B virus; HBsAG, surface antigen of the hepatitis B virus; HBeAG, hepatitis B e antigen a These tests are not required before HBV DNA testing (advisory panel advice)
The research question for this indication, based on these criteria, was as follows.
To what extent is hepatitis B virus (HBV) DNA testing:
• safe, and
• effective (including diagnostic performance and the impact of diagnosis on changes in clinical management and changes in clinical outcomes), and
• cost-effective
in the monitoring of patients with hepatitis B not requiring treatment relative to current clinical practice?
The clinical pathways for monitoring patients with chronic hepatitis B not receiving therapy are shown in Figure 1 and Figure 2. Figure 1 indicates the clinical pathway without HBV DNA testing available; Figure 2 displays the clinical pathway with HBV DNA testing available.

12 Hepatitis B virus DNA testing
Monitoring of patients with chronic hepatitis B receiving antiviral therapy
The PPICO criteria (target population, prior tests, index test, comparator, outcomes) developed a priori to evaluate HBV DNA testing to monitor chronic hepatitis B patients undergoing antiviral therapy are presented in Table 5.
Table 5 PPICO criteria for the use of HBV DNA testing in the monitoring of patients with chronic hepatitis B receiving antiviral therapy
Population Prior tests a Index test Comparator Outcomes
Chronic hepatitis B patients undergoing antiviral treatment
History and physical examination Laboratory test to assess liver disease Tests to rule out other causes of liver disease Tests for co-infection with other viruses Consider screening for hepatocellular carcinoma, HBsAg / HBeAg / anti-core serology HBV DNA testing
HBV DNA testing
Current clinical practice, including: HBsAg and HBeAg serology, ALT levels, and/or liver biopsy
Change in clinical management Change in clinical outcomes Diagnostic accuracy
Abbreviations: ALT, alanine aminotransferase; HBV, hepatitis B virus; HBsAG, surface antigen of the hepatitis B virus; HBeAG, hepatitis B e antigen a These tests are not required before HBV DNA testing (advisory panel advice)
The research question for this indication, based on these criteria, was as follows.
To what extent is hepatitis B virus (HBV) DNA testing:
• safe, and
• effective (including diagnostic performance and the impact of diagnosis on changes in clinical management and changes in clinical outcomes), and
• cost-effective
in monitoring chronic hepatitis B patients who are undergoing antiviral therapy, relative to current clinical practice?
Clinical pathways for monitoring chronic hepatitis B patients undergoing antiviral therapy are represented in Figures 3–7. Figure 3 illustrates the clinical pathway omitting availability of HBV DNA testing. Clinical pathways that include availability of HBV DNA testing are presented in Figure 4 (HBeAg positive patients), and Figure 5 (HBeAg negative patients). Clinical pathways for patients undergoing interferon therapy are represented in Figure 6 (without HBV testing) and Figure 7 (with HBV testing).
Hepatitis B virus DNA testing 13
Figure 3 Clinical pathway: Monitoring chronic hepatitis B patients undergoing antiviral therapy without HBV DNA testing available

14 Hepatitis B virus DNA testing
Figure 4 Clinical pathway: Monitoring HBeAg positive chronic hepatitis B patients undergoing antiviral therapy with HBV DNA testing available
a HBV DNA testing every three months in the first year after commencing therapy is necessary in HBeAg positive patients with mild liver disease if ALT returns to normal
Note: In the case of drug resistance, abnormal DNA refers to a minimum increase of 1 log above nadir

Hepatitis B virus DNA testing 15
Figure 5 Clinical pathway: Monitoring HBeAg negative chronic hepatitis B patients undergoing antiviral therapy with HBV DNA testing available
a Current recommendations for treatment thresholds differ HBeAg negative patients (104) and in patients with cirrhosis or liver decompensation (103)
Notes: The advisory panel indicated that HBeAg negative patients undergo life-long oral antiviral therapy In the case of drug resistance, abnormal DNA refers to a minimum increase of 1 log above nadir

16 Hepatitis B virus DNA testing
Figure 6 Clinical pathway: Monitoring HBeAg positive chronic hepatitis B patients undergoing interferon without HBV DNA testing available
Note: Assessment of liver disease was based on first pre-treatment biopsy

Hepatitis B virus DNA testing 17
Figure 7 Clinical pathway: Monitoring HBeAg positive chronic hepatitis B patients undergoing interferon therapy with HBV DNA testing available
a Current recommendations for treatment thresholds differ between HBeAg positive patients (105) and in patients with cirrhosis or liver decompensation (103)
Note: Assessment of liver disease was based on first pre-treatment biopsy

18 Hepatitis B virus DNA testing
Assessment framework
Types of evidence
A systematic review of the medical literature was undertaken to identify relevant studies that examined the value of HBV DNA testing to assess and monitor patients with chronic hepatitis B in relation to commencing or continuing antiviral therapy. Direct evidence regarding the impact of HBV DNA testing on health outcomes was sought. The literature search was not limited by outcomes or comparators. Indirect evidence concerning the impact of HBV DNA testing on clinical management and diagnostic accuracy was assessed where studies offering direct evidence were absent or limited.
Literature review
A search of the medical literature was conducted to identify all relevant studies and reviews published before April 2006. Primary database searches were conducted as indicated in Table 6.
Search strategy
Primary databases
Table 6 Electronic databases searched to review HBV DNA testing for chronic hepatitis B literature
Database Period covered/date searched PreMedline and Medline 1966 to April week 1, 2006 EMBASE 1980 to 2006, week 15 Cochrane Library Issue 2, 2006 (5 May 2006)
The search terms included the following (as determined from the PPICO criteria):
• hepatitis B
• DNA, deoxyribonucleic acid
• hepatitis B virus, HBV, hepatitis B surface antigens
• viral DNA, HBV DNA, hepatitis B virus DNA
• test, assay, nucleic acid amplification techniques, gene amplification, nucleic acid hybridisation, polymerase chain reaction, versant, amplification, hybrid capture, Digene, Cobas, Amplicor, Roche PCR
• viral load, viral burden, viral dynamics, viral decline, virology, viral quantification, virus examination, DNA level, DNA value, DNA quantitation, DNA concentration, DNA determination.
Complete details of the literature searches performed using primary and secondary databases are presented in Appendix E. Additional searches were conducted as required to locate quality of life, epidemiological and economic information.

Hepatitis B virus DNA testing 19
Selection criteria
Initial assessment of patients with chronic hepatitis B prior to antiviral therapy
Table 7 Selection criteria: HBV DNA test studies considering initial assessment of chronic hepatitis B patients before antiviral therapy
Abbreviations: HBV, hepatitis B virus; HCV, hepatitis C virus; HDV, hepatitis D virus, HIV, human immunodeficiency virus; TGA, Therapeutic Goods Administration a These tests are not required before HBV DNA testing (advisory panel advice)
Research question: To what extent is HBV DNA testing safe, effective and cost-effective in initial assessment of chronic hepatitis B patients before undergoing antiviral therapy relative to current clinical practice? Selection criteria Inclusion Exclusion Study design Studies with ≥10 patients Non-systematic reviews, letters, opinion
pieces, surveys, non-human or in vitro studies
Population Chronic hepatitis B patient not treated with antiviral therapy
Wrong indication Patients co-infected with HCV, HDV, HIV and other viruses
Prior testsa History and physical examination Laboratory test to assess liver disease Tests to rule out other causes of liver disease Tests for co-infection with other viruses Screening for hepatocellular carcinoma, HBsAg / HBeAg / anti-core serology
Prior HBV DNA testing
Index test HBV DNA test use for assessment and monitoring of chronic hepatitis B patients as currently approved by the TGA
Wrong usage Wrong test
Comparator Current clinical practice Wrong comparator
Reference standard Liver biopsy / clinical outcomes Inadequate reference standard No reference standard
Outcomes Direct evidence studies Accuracy studies Management studies
Effect on health outcomes Diagnostic performance Effect on clinical management
Wrong outcomes Inadequate data reporting Case-control studies Case-referent studies

20 Hepatitis B virus DNA testing
Monitoring patients with chronic hepatitis B not receiving antiviral therapy
Table 8 Selection criteria: HBV DNA test studies monitoring chronic hepatitis B patients who were not undergoing antiviral therapy
Abbreviations: HBV, hepatitis B virus; TGA, Therapeutic Goods Administration a These tests are not required before HBV DNA testing (advisory panel advicel)
Research question: To what extent is HBV DNA testing safe, effective and cost-effective in monitoring patients with active hepatitis B who are not undergoing treatment relative to current clinical practice? Selection criteria Inclusion Exclusion Study design Studies with ≥10 patients Non-systematic reviews, letters, opinion
pieces, surveys, non-human or in vitro studies
Population Chronic hepatitis B patients not treated with antiviral therapy
Wrong indication Patients co-infected with HCV, HDV, HIV and other viruses
Prior testsa History and physical examination Laboratory test to assess liver disease Tests to rule out other causes of liver disease Tests for co-infection with other viruses Screening for hepatocellular carcinoma, HBsAg / HBeAg / anti-core serology HBV DNA testing
No specific exclusion criteria
Index test HBV DNA test use for assessment and monitoring of chronic hepatitis B patients as currently approved by the TGA
Wrong usage Wrong test
Comparator Current clinical practice Wrong comparator
Reference standard Liver biopsy / clinical outcomes Inadequate reference standard No reference standard
Outcomes Direct evidence studies
Effect on health outcomes
Accuracy studies Diagnostic performance Management studies Effect on clinical management
Wrong outcomes Inadequate data reporting Case-control studies Case-referent studies

Hepatitis B virus DNA testing 21
Monitoring patients with chronic hepatitis B receiving antiviral therapy
Table 9 Selection criteria: HBV DNA test studies monitoring chronic hepatitis B patients undergoing antiviral therapy
Abbreviation: HBV, hepatitis B virus a These tests are not required before HBV DNA testing (advisory panel advice)
Search results
Results from safety and effectiveness searches and management and health outcomes searches were pooled. The QUOROM (Quality of Reporting of Meta-analyses) flowchart (Figure 8) summarises reasons for study exclusions. A total of 2206 non-duplicate references were identified, of which 176 were reviewed for inclusion, and 21 were included in the effectiveness review.
Research question: To what extent is HBV DNA testing safe, effective and cost-effective in monitoring chronic hepatitis B patients undergoing antiviral therapy relative to current clinical practice? Selection criteria Inclusion Exclusion Study design Studies with ≥10 patients Non-systematic reviews, letters, opinion
pieces, surveys, non-human or in vitro studies
Population Chronic hepatitis B patients undergoing antiviral therapy
Wrong indication Patients co-infected with HCV, HDV, HIV and other viruses
Prior testsa History and physical examination Laboratory test to assess liver disease Tests to rule out other causes of liver disease Tests for co-infection with other viruses Screening for hepatocellular carcinoma, HBsAg / HBeAg / anti-core serology HBV DNA testing
No specific exclusion criteria
Index test HBV DNA test use for assessment and monitoring of chronic hepatitis B patients as currently approved by the Therapeutic Goods Administration
Wrong usage Wrong test
Comparator Current clinical practice Wrong comparator
Reference standard Liver biopsy / clinical outcomes Inadequate reference standard No reference standard
Outcomes Direct evidence studies
Effect on health outcomes
Accuracy studies Diagnostic performance Management studies Effect on clinical management
Wrong outcomes Inadequate data reporting Case-control studies Case-referent studies

22 Hepatitis B virus DNA testing
Potentially relevant studies identified in the literature search and screened for retrieval (n = 2206)
Studies retrieved for more detailed evaluation (n = 177)
Potentially appropriate studies to be included in the systematic review (n = 21)
Studies with usable information by outcome (n = 21)
Direct evidence (2)
Linked evidence:Accuracy: primary studies (9)
HBV DNA levels and outcomes:Systematic review (1)Primary studies (9)
Studies excluded with reasons (n = 2030):
Reviews/Editorials/opinion piece/survey/economic articles (213)Non-human/in vitro/pre clinical (215)Wrong patient group (98)Wrong outcome (1231)< 10 patients (162)Foreign language (111)a
Studies excluded with reasons (n = 156):Wrong outcome (63)Wrong usage (5)No reference standard (5)Inadequate data separation/reporting (81)Case-referent (1)Case-control (1)
Figure 8 QUOROM flowchart: Identification and selection of studies from the HBV DNA testing literature review
Note: Translation and review of these studies was not possible due to time constraints of the assessment process

Hepatitis B virus DNA testing 23
It was found that many studies’ data and separation reporting was inadequate for this review. To attempt to address data reporting deficits, the authors of 53 studies were contacted to elicit further information to inform assessment of HBV DNA test accuracy. No suitable data were provided from this process.
Data extraction
A pro forma was applied that included parameters to accommodate data collation of trial and study population characteristics, tests used and outcomes reported. This follows procedures for data collection outlined in the Cochrane Reviewers’ Handbook (Higgins et al 2005).
Statistical methods
Methodological considerations
Direct evidence supporting the value of HBV DNA testing relative to current clinical practice, when used in the relevant patient group, is required to justify reimbursement under Medicare. This should ideally be in the form of studies reporting effects on patient-centred health outcomes. Alternatively, evidence of greater diagnostic accuracy than the comparator(s), along with linked evidence of management change and that treatment will affect health outcomes is required.
Evidence of an effect on management change is a key component where an additional diagnostic test is to be used in the clinical pathway. The most appropriate design to investigate the effects on management change is a pre-test post-test case series study. Where a pre-test management plan is not reported, study outcomes do not fully represent patient management change, and outcomes may be biased.
The ideal design for a comparative accuracy study of diagnostic tests permits each test to be performed in a population with a defined clinical presentation, in a consecutive series. The study should be an independent, blinded comparison with a valid reference standard (NHMRC 2005).
To determine the relationship between a risk factor and clinical outcome, a Cox proportional hazards model can be applied to assess the relative risk. Multivariate-adjusted analysis allows exclusion of potential confounding factors.
Diagnostic performance
Evaluating accuracy of new diagnostic tests requires comparison of the novel approach with its comparators and a reference standard. The reference standard is the best available proxy for the true status of a disease or condition. The new diagnostic test and its comparators can be compared independently with the reference standard to assess sensitivity, specificity, accuracy, diagnostic odds ratio and likelihood ratios.
In this setting, sensitivity is defined as the proportion of all patients with a specified condition whose results are positive, and specificity as the proportion of all patients, who do not have the specified condition, who test negative. Test accuracy is reflected by the proportion of patients whom the test correctly identified as positive or negative. A plot of sensitivity against 1 minus specificity is known as a receiver operating characteristic

24 Hepatitis B virus DNA testing
(ROC) curve. The closer the area under the curve (AUC) is to 1.0, the more accurate the test.
The positive predictive value is the proportion of all patients with positive test results who have the condition in focus. The negative predictive value is the proportion of all patients with negative test results who do not have the condition. Both positive and negative predictive values are prevalence dependent. Caution should be taken when interpretating these measures. In the context of this assessment, where HBV DNA testing may be used to predict response to antiviral therapies, the negative predictive value of the HBV DNA test indicates ability to identify patients who would not respond to treatment. The negative predictive value of HBV DNA testing, where the test is used to monitor patients undergoing antiviral drug treatment, is considered highly clinically relevant (advice from advisory panel).
The diagnostic odds ratio is an expression of the odds of positive test results among patients with the specified condition, compared with those who do not have the condition. A diagnostic odds ratio of 100 provides convincing evidence of the test’s ability to discriminate between presence and absence of the condition.
The likelihood ratio of a positive test is the probability that positive test results would occur among people who have the condition, opposed to those who do not. The likelihood ratio of a negative test is the probability that a negative test result would occur among people who have the condition, opposed to those who do not. A positive ratio of >10 and a negative ratio <0.1 provide compelling diagnostic evidence. A positive likelihood ratio of >5 and a negative likelihood ratio of <0.2 provide strong diagnostic evidence (Medical Services Advisory Committee 2005). Bayes’ theorem indicates that the post-test odds of a condition are equal to the pre-test odds of the condition multiplied by the likelihood ratio. The post-test probability of a condition can be determined for any given pre-test probability using this approach.
Appraisal of the evidence
Appraisals of evidence were conducted at three stages.
Stage 1: Appraisal of the applicability and quality of studies included in the review
Stage 2: Appraisal of the precision, size and clinical importance of the primary outcomes used to determine the safety and effectiveness of the test
Stage 3: Evidence consolidation for analysis and development of recommendations about the index test’s net benefit in Australian clinical practice.
Appraisal of the quality and applicability of individual studies
The quality and applicability of included studies was assessed by applying pre-specified criteria according to the study design (Appendix D).
Ranking the evidence
Studies that evaluated direct impact of the test or treatment on patient outcomes were ranked according to the study design by applying levels of evidence designated by the National Health and Medical Research Council (NHMRC) (Table 10).

Hepatitis B virus DNA testing 25
Table 10 NHMRC levels of evidence for effectiveness
Level of evidence Study design I Evidence obtained from a systematic review of level II studies II Evidence obtained from properly designed randomised controlled trials III-1 Evidence obtained from well-designed pseudo-randomised controlled trials (alternate allocation or
some other method) III-2 Evidence obtained from comparative studies with concurrent controls: non-randomised experimental
trials, cohort studies, case-control studies, or interrupted time series with a control group III-3 Evidence obtained from comparative studies without concurrent controls: historical control studies,
two or more single-arm studies, or interrupted time series without a parallel control group IV Evidence obtained from case series, either post-test or pre-test/post-test outcomes
Source: NHMRC 2005
Diagnostic accuracy studies were ranked according to NHMRC levels of evidence for diagnoses (Table 11).
Table 11 NHMRC levels of evidence for diagnosis
Level of evidence Study design I Evidence obtained from a systematic review of level II studies II Evidence obtained from studies of test accuracy with: an independent blinded comparison with a
valid reference standard, among consecutive patients with a defined clinical presentation III-1 Evidence obtained from studies of test accuracy with: an independent blinded comparison with a
valid reference standard, among non-consecutive patients with a defined clinical presentation III-2 Evidence obtained from studies of test accuracy with: a comparison with reference standard that
does not meet the criteria required for level II or III-1 evidence III-3 Evidence obtained from diagnostic case-control studies IV Evidence obtained from studies of diagnostic yield (no reference standard)
Source: NHMRC 2005
Studies were also graded according to pre-specified quality and applicability criteria (Table 12).

26 Hepatitis B virus DNA testing
Table 12 Grading system used to rank included studies
Validity criteria Description Grading system Appropriate comparison Did the study evaluate a direct comparison of the
index test strategy versus the comparator test strategy?
C1 direct comparison CX other comparison
Applicable population Did the study evaluate the index test in a population that is representative of the subject characteristics (age and sex) and clinical setting (disease prevalence, disease severity, referral filter and sequence of tests) for the clinical indication of interest?
P1 applicable P2 limited P3 different population
Quality of study Was the study designed and to avoid bias? High quality = no potential for bias based on pre-defined key quality criteria Medium quality = some potential for bias in areas other than those pre-specified as key criteria Poor quality = poor reference standard and/or potential for bias based on key pre-specified criteria
Q1 high quality Q2 medium quality Q3 poor reference standard
poor quality or insufficient information
Ideally, comparative accuracy of diagnostic tests is derived from studies that perform all tests on all study participants. In this assessment, studies were classified as ‘CX’ (other comparison) where both tests were not performed for all study participants.
An applicable patient population was considered to reflect the research question for each indication in review. To be considered applicable, studies must be free from spectrum bias in patient selection: all consecutive patients with the appropriate clinical presentation should be included in the analysis. Patient populations applicable to the research question but with known spectrum bias were considered to offer limited applicability.
Study quality was determined by a number of predefined factors.
Verification bias is a key concept used to determine study quality, and occurs when a valid reference standard cannot be applied to all study participants. Verification bias is avoided when only data from participants with valid reference standards are analysed. The reference standard is defined as the best available proxy for the true status of a disease or condition. Differential verification bias occurs when different reference standards are applied to confirm positive and negative index test results. Studies conducted in consecutive series of participants, without potential for verification bias, were classified as providing high quality evidence.
A further factor affecting the study quality is selection bias. Studies are subject to selection bias when patient inclusion is based on receiving the index test or reference standard. To avoid selection bias, the accuracy of HBV DNA testing should be reported in a consecutive series of patients who meet the criteria to receive the index test (ie, have a defined clinical presentation). These criteria should be based on pre-test characteristics of the patients. The disease status of all patients should be verified by a high quality, valid reference standard.

Hepatitis B virus DNA testing 27
The study should provide sufficient data to reconstruct a 2 × 2 table to check calculation of diagnostic accuracy outcomes and extract the numbers of true positive, false positive, true negative and false negative results. It is a requirement of this process that a diagnostic test be compared with a reference standard. Where long term outcomes are considered as reference standard this may not be possible due to unavailability of long term outcome data. In this circumstance, a test can be compared with other recognised indicators of disease status, although the diagnostic test under assessment may be a more accurate predictor of long term outcome than other tests.
When a comparator test is also considered to be a reference standard, and a diagnostic test is potentially superior to the existing comparator reference standard, a valid estimate of the accuracy of the index test would not be established. In this circumstance, there is a requirement for direct evidence to support index test effectiveness on patient outcomes (MSAC 2005).
Expert advice
An advisory panel with expertise in diagnostic virology, including hepatitis, was established to evaluate the evidence and provide advice to MSAC from a clinical perspective. In selecting members for advisory panels, MSAC’s practice is to approach the appropriate medical colleges, specialist societies and associations and consumer bodies for nominees. Membership of the advisory panel is provided at Appendix B.

28 Hepatitis B virus DNA testing
Results of assessment
Is it safe?
Specimens to be used in HBV DNA testing are collected using general procedures for sampling blood. Collection of samples for HBV DNA testing carries a low safety risk.
However, as HBV DNA testing is not listed on the Medicare Benefits Schedule laboratories which perform this test do not need to be accredited. This may have potential implications for patient safety as HBV DNA testing is compulsory for patients to receive therapies listed on the PBS.
Is it effective?
The strategy used to identify the body of evidence to establish effectiveness of serum HBV DNA testing is outlined in Figure 9.
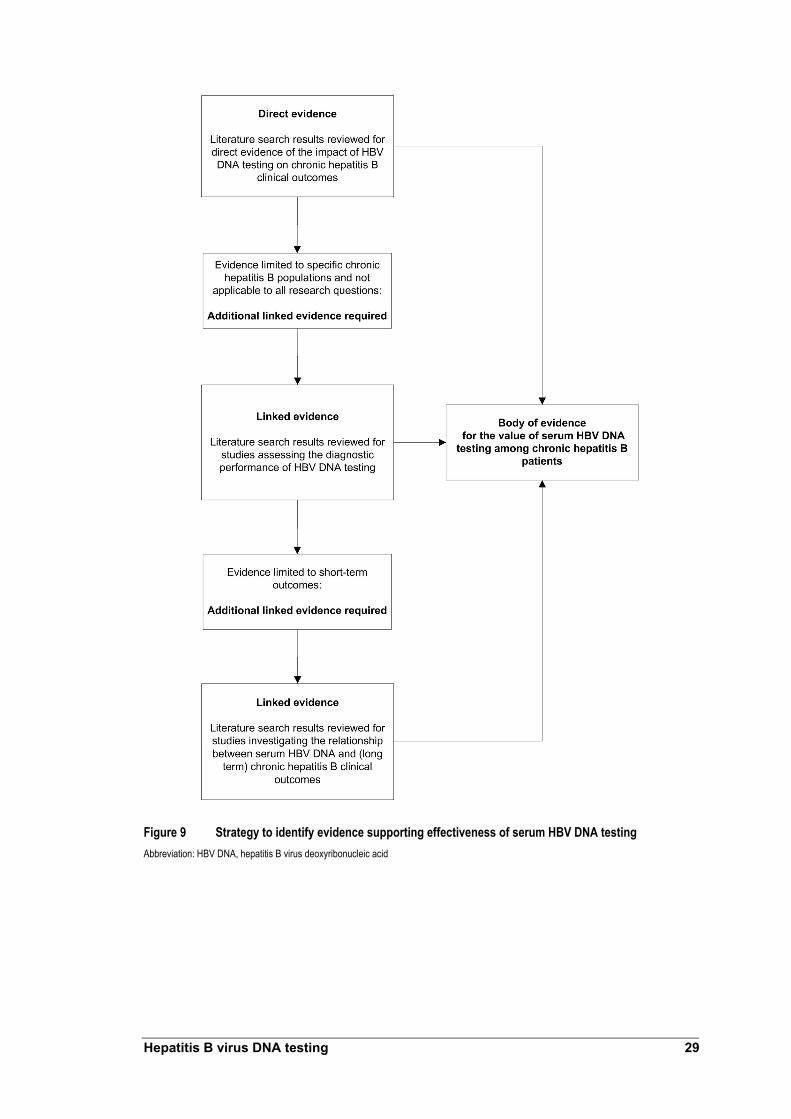
Hepatitis B virus DNA testing 29
Figure 9 Strategy to identify evidence supporting effectiveness of serum HBV DNA testing Abbreviation: HBV DNA, hepatitis B virus deoxyribonucleic acid

30 Hepatitis B virus DNA testing
Direct evidence
Summary of direct evidence
HBV DNA testing and the monitoring of patients with chronic hepatits B not receiving antiviral therapy
Chan et al (2002) published evidence indicating that HBV DNA testing improves outcomes by reducing mortality risk among HBsAg positive renal transplant patients. HBV DNA testing was used to identify transplant patients with increasing DNA levels. Lamivudine was administered pre-emptively, regardless of alanine aminotransferase (ALT) levels.
Patient survival was similar to HBsAg negative patients when the pre-emptive strategy of HBV DNA testing and lamivudine therapy was readily available throughout the post-transplant period. When this strategy was unavailable to all transplant patients, survival declined and the relative risks of death and liver-related death increased. Compared with HBsAg negative renal transplant patients, the relative risk of death among transplant patients was 9.7 (95% CI: [4.7, 19.9], p<0.001); the relative risk of liver-related death was 68.0 (95%CI: [8.7, 533.2], p<0.0001).
Although it was indicated that HBV DNA testing can enhance clinical outcomes, results are not considered applicable in Australian clinical practice, because HBsAg positive patients were treated with lamivudine to prevent reactivation of viral replication during immunosuppressive therapy.
HBV DNA testing and the monitoring of patients with chronic hepatitis B receiving antiviral therapy
Lampertico et al (2005) assessed outcomes of adefovir dipivoxil therapy among HBeAg negative chronic hepatitis B patients who were lamivudine resistant. Adefovir was administered either at the time point of genotypic resistance (3-6 log10 copies/mL, normal ALT) or phenotypic resistance (>6 log10 copies/mL, high ALT). Because detection of genotypic resistance is possible only by measuring serum HBV DNA levels, comparison of adefovir treatment outcomes between the genotypic and phenotypic resistance cohorts enabled assessment of HBV DNA testing on patient outcomes.
When adefovir was co-administered with lamivudine, patients in the genotypic resistance cohort had significantly greater response compared with the phenotypic resistance cohort: the proportion of patients with undetectable serum HBV DNA levels at three months of adefovir therapy was 100 per cent and 46 per cent, respectively (p<0.001). Normalisation of ALT levels was time dependent in the phenotypic resistance cohort. ALT levels were normal throughout the study period among the genotypic cohort treated with adefovir at initial lamivudine resistance onset.
This suggests that ALT testing alone may not be the most effective way of detecting initial development of lamivudine resistance. Regular HBV DNA testing offers better monitoring of patients undergoing lamivudine monotherapy, which has potential to alter patient management and to deliver short term outcome improvements. Adefovir treatment initiation was based on availability, not ALT levels alone. Patients in the phenotypic resistant cohort may not be entirely comparable with those monitored by ALT levels alone.
Direct evidence was considered to be limited because the studies were not randomised controlled trials and treatment decisions were driven by availability of antiviral therapy rather than HBV DNA test results.

Hepatitis B virus DNA testing 31
Does HBV DNA testing improve health outcomes?
Studies by Chan et al (2002) and Lampertico et al (2005) informed assessment of the additional value of HBV DNA testing compared with current clinical practice. Chan et al (2002) assessed impact of HBV DNA testing on health outcomes among HBsAg positive kidney allograft recipients. Lampertico et al (2005) investigated the impact of HBV DNA testing in monitoring patients undergoing lamivudine therapy.
No studies were found whose specific objective was to assess additional benefit provided by HBV DNA testing on health outcomes, compared with current clinical practice, and none that assessed serum HBV DNA testing on health outcomes when used as a part of initial patient assessment.
HBV DNA testing and monitoring patients with chronic hepatitis B not receiving antiviral therapy
Chan et al (2002) investigated HBV DNA testing on HBsAg positive kidney allograft recipients. HBV DNA testing sought to identify increasing DNA levels among transplant patients; lamivudine was administered pre-emptively, with or without elevation of ALT levels. Clinical outcomes were compared with a group of patients who underwent transplantation before lamivudine therapy became available (January 1996) to assess HBV DNA testing. When clinically indicated, patients in the transplant group were treated with lamivudine when it became available. Study characteristics are presented in Table 13.

Tabl
e 13
Stud
y cha
ract
erist
ics: a
sses
smen
t of t
he im
pact
of H
BV D
NA te
stin
g am
ong
kidne
y tra
nspl
ant p
atien
ts
Stud
y St
udy
desig
n Pa
tient
s (N)
Ot
her t
ests
Te
st ch
arac
teris
tics
Trea
tmen
t St
udy q
ualit
y
Chan
et al
(2
002)
Ch
ina
Coho
rt stu
dy
(198
3�20
00)
Pros
pecti
ve
data
colle
ction
fro
m Ja
nuar
y 19
96
Enro
lmen
t no
t rep
orted
Perio
d I c
ohor
t (19
83–1
995)
: HB
sAg p
ositiv
e tra
nspla
nt pa
tients
a (n
= 52
) Pe
riod
II coh
ort (
1996
–200
0):
HBsA
g pos
itive d
e no
vo tr
ansp
lanta
patie
nts (n
= 15
) HB
sAg
nega
tive c
ohor
t (1
983–
2000
): (n
= 44
2)
Exclu
sions
: anti
-hep
atitis
C
posit
ive (a
ntibo
dies s
ignific
ant
alcoh
ol co
nsum
ption
; cirr
hosis
on
biops
y; de
comp
ensa
ted liv
er
disea
se)
ALT;
alka
line p
hosp
hatas
e; γ-g
lutam
yl tra
nspe
ptida
se; a
nd bi
lirubin
b Pr
othro
mbin
time m
easu
red w
hen c
linica
lly
indica
ted; H
BeAg
/anti-H
BeAg
statu
s as
sess
ed at
base
line a
nd re
peate
d yea
rly or
wh
en cl
inica
lly in
dicate
d; an
ti-hep
atitis
D
when
clini
cally
indic
ated;
liver
biop
sy at
ba
selin
e (co
nsen
ting p
atien
ts on
ly� no
t ob
ligato
ry cri
terion
for la
mivu
dine t
reatm
ent)
Furth
er de
tails
of oth
er te
sts no
r rep
orted
HBV
DNA
test
: Di
gene
Hyb
rid C
aptur
e II
assa
y. Se
nsitiv
ity lim
it of
1.4 x
105 c
opies
/mLb
Com
para
tor t
est:
ALT
(Deta
ils no
t rep
orted
)
Lami
vudin
e (10
0 mg/d
ay)
Begu
n if o
ne of
follo
wing
cri
teria
met:
1. HB
V DN
A lev
el >
2.83 x
10
8 cop
ies/m
L amo
ng
patie
nts w
ith no
rmal
ALT
levels
2.
HBV
DNA
level
> 2.8
3 x
107 c
opies
/mL a
mong
pa
tients
with
incre
asing
ALT
lev
els an
d/or li
ver b
iopsy
sp
ecim
en sh
owing
sig
nifica
nt he
patiti
s Re
sistan
ce to
lami
vudin
e: de
fined
by re
appe
aran
ce of
HB
V DN
A in
at lea
st tw
o co
nsec
utive
samp
les am
ong
patie
nts w
hose
HBV
DNA
ha
d pre
vious
ly be
come
un
detec
table
Poss
ible s
electi
on
bias:
Co
hort
study
, pati
ent
selec
tion n
ot ra
ndom
ised
Poss
ible n
on-
cons
ecuti
ve pa
tient
enro
lmen
t Ap
plica
bility
: Ap
plica
bility
of H
BV
DNA
testin
g reg
imen
to
Austr
alian
clini
cal
prac
tice u
nkno
wn
Abbre
viatio
ns: A
LT, a
lanine
amino
trans
feras
e; HB
V DN
A, he
patiti
s B vi
rus de
oxyri
bonu
cleic
acid
a Acc
eptan
ce cr
iteria
for r
enal
trans
plant
patie
nts di
d not
chan
ge be
twee
n 198
3 and
2000
b T
est s
ched
ule: 1
. Eve
ry tw
o to f
our w
eeks
a) fo
r the f
irst 1
2 mon
ths af
ter tra
nspla
ntatio
n; b)
for fo
ur m
onths
after
pulse
ster
oid an
d/or a
nti-ly
mpho
cyte
therap
y for
acute
rejec
tion;
c) wh
en se
rial H
BV D
NA le
vels
show
incre
asing
trend
; d)
durin
g trea
tmen
t with
lami
vudin
e. 2.
Every
four
month
s in c
linica
lly st
able
long t
erm
renal
allog
raft re
cipien
ts on
low-
dose
immu
nosu
ppres
sive m
edica
tions
.
32 Hepatitis B virus DNA testing

Hepatitis B virus DNA testing 33
The survival of HBsAg positive patients was compared among patients who underwent transplantation before (period I cohort) and after lamivudine became available (period II cohort, de novo transplantation) to assess the impact of HBV DNA testing combined with pre-emptive lamivudine treatment. The results reported by Chan et al (2002) are presented in Table 14.
Of the 52 patients from the period I cohort, 14 died before January 1996 (73% survival). Liver complications accounted for the deaths of eight of the 14 patients (57.1%). All 12 of the 15 patients from the period II cohort who were studied in the between-group comparisons2 survived. It was not reported whether the survival difference between period I and II patients was statistically significant (p value not reported).
Of the 38 patients remaining from the period I cohort, 15 (39.5%) satisfied criteria for pre-emptive lamivudine treatment (Table 14). Of the 12 patients in the period II cohort, 11 (91.7%) satisfied criteria for pre-emptive lamivudine treatment, indicating a higher requirement for lamivudine therapy compared with the period I cohort (p = 0.002).
Lamivudine treatment was begun based on HBV DNA levels alone for seven (46.7%) and five (45.5%) patients from the period I (transplantation before lamivudine availability) and period II cohorts (lamivudine available at time of transplantation) respectively (p value not reported). Abnormal alanine aminotransferase (ALT) was also noted among remaining patients who underwent lamivudine treatment in both cohorts.
The duration of lamivudine treatment was not significantly different between period I and II patients (p = 0.118). There was no difference in treatment duration before HBV DNA levels became undetectable or ALT normalised between period I and II patients (p = 0.643 and p = 0.846, respectively) (Table 14).
The relative risks of death and liver-related death were also compared between each period I and period II cohort and with a cohort of HBsAg negative patients who underwent renal transplantation between 1983 and 2000 (Table 14). Compared with HBsAg negative renal transplant patients, the relative risk of death in period I patients was 9.7 (95% CI: [4.7, 19.9], p<0.001); the relative risk of liver-related death was 68.0 (95% CI: [8.7, 533.2], p<0.0001). Chen et al (2002) reported that survival of the period II cohort (de novo transplantation patients) was similar to HBsAg negative patients, but statistical data were not reported (p value not reported). HBeAg status at the time of transplantation or at last follow up was not related to patient survival (p = 0.660 and p = 0.797, respectively); however, it was unclear whether this analysis applied only to period I1 patients or to all HBsAg positive patients included in this study.
Chen et al (2002) provided some evidence that HBV DNA testing improved outcomes among HBsAg positive renal transplant patients (recipients). When the pre-emptive strategy of combined HBV DNA testing and lamivudine therapy was readily available throughout the post-transplant period (period II cohort), patient survival was similar to HBsAg negative patients. Conversely, when the pre-emptive strategy was not available to all transplant patients (period I cohort), survival was reduced and the relative risks of death and liver-related death increased.
2 Of the 15 patients from the period II cohort, three were late referrals who received lamivudine treatment as salvage therapy after developing liver decompensation. These three patients were excluded from between group comparisons by the study authors

34 Hepatitis B virus DNA testing
HBV DNA test results indicated initiation of lamivudine therapy in almost half of patients in both cohorts. This suggests that in the absence of HBV DNA testing, a significant proportion of patients would not receive appropriate therapy if treatment decisions were based on elevated ALT levels alone. These patients would be treated only if ALT levels became elevated.
Study quality A randomised controlled trial comparing outcomes between patient cohorts of those receiving HBV DNA testing, and another where testing was withheld, would provide the ideal study setting to determine the impact of HBV DNA testing among HBsAg positive renal transplant patients. This would be unethical because all patients who could benefit from lamivudine treatment would not be identified on the basis of ALT levels alone—HBV DNA levels can change without corresponding changes in ALT levels. Chan et al (2002) avoided this ethical dilemma by comparing outcomes before and after lamivudine availability. This approach may have introduced bias because there was no randomisation to select patients who did not have HBV DNA testing and pre-emptive lamivudine therapy. It was not reported whether patient enrolment was consecutive. Outcomes were compared between renal transplant patients during different time periods. It was possible that outcome variations between period I and II cohorts occurred because of differences between patient populations. Renal allograft survival was similar between cohorts, suggesting that that there were no differences in renal outcomes that impacted on liver-related outcomes. Data collection from January 1996 was prospective.
There was an indirect comparison of relative risk of death and liver-related death between period I and II cohorts. Outcomes from both cohorts were compared with HBsAg negative renal transplant patients between 1983 and 2000. Direct comparison between cohorts would have provided a more robust analysis that yielded a more accurate assessment of HBV DNA testing for HBsAg positive renal transplant patients.
The study’s design did not permit direct assessment of additional value provided by HBV DNA testing over ALT testing. If elevated ALT levels alone were used to inform lamivudine initiation, almost half of the patients treated with lamivudine in this study would not have been treated. The consequences of not using HBV DNA testing to monitor patients were indicated by poor survival among period I cohort patients. It is unknown whether period I cohort outcomes would have differed had lamivudine therapy been available at the time of transplantation, and elevated ALT levels only used to inform treatment initiation.

Tabl
e 14
Outc
omes
of l
amivu
dine
trea
tmen
t am
ong
rena
l tra
nspl
ant r
ecip
ients
Outc
omes
Re
lative
risk
s com
pare
d wi
th H
BsAg
ne
gativ
e ren
al tra
nspl
ant p
atien
ts
Stud
y Co
horta
Reas
ons f
or
initi
atin
g lam
ivudi
ne
treat
men
t
Trea
tmen
t du
ratio
n be
fore
HB
V DN
A be
cam
e un
dete
ctab
le (w
eeks
)
Trea
tmen
t du
ratio
n be
fore
AL
T no
rmali
satio
n (w
eeks
)
Surv
ivale
Deat
h Li
ver r
elate
d de
ath
Stud
y qua
lity
Perio
d I (
n = 52
) (1
983 t
o 199
5)
Base
d on H
BV D
NA
alone
(n =
7);
abno
rmal
ALT
also
noted
amon
g re
maini
ng pa
tients
(n
= 8)
15
b pati
ents
rece
ived
pre-
empti
ve
lamivu
dine t
reatm
ent
c
6.4 +
/– 2.1
(ra
nge 3
–10)
14.5
+/– 1
1.5
(rang
e 1–3
9)
73%
9.7
( 9
5% C
I:[4.7,
19
.9] p
< 0.0
01)
68.0
(95%
CI:[8
.7, 53
3.2]
p<0.0
001)
Chan
et al
(2
002)
Ch
ina
Perio
d II (
n = 15
) De
nov
o tra
nspla
nt pa
tients
(1
996 t
o 200
0)
Base
d on H
BV D
NA
alone
(n =
5);
abno
rmal
liver
bio
chem
istry
also
noted
amon
g re
maini
ng pa
tients
(n
= 6)
11
d pati
ents
rece
ived
pre-
empti
ve
lamivu
dine t
reatm
entc
6.4 +
/– 4.0
(ra
nge 3
–14)
15.6
+/– 1
2.2
(rang
e 5–3
8)
100%
Si
milar
to H
BsAg
ne
gativ
e pati
ents
(resu
lt not
repo
rted)
Simi
lar to
HBs
Ag
nega
tive p
atien
ts (re
sult n
ot re
porte
d)
Poss
ible s
electi
on bi
as:
Coho
rt stu
dy, p
atien
t se
lectio
n not
rand
omise
d. Po
ssibl
e non
-cons
ecuti
ve
patie
nt en
rolm
ent
Appli
cabil
ity:
HBV
DNA
testin
g reg
imen
no
t app
licab
le to
Austr
alian
cli
nical
prac
tice w
here
all
HBsA
g pos
itive r
enal
trans
plant
patie
nts re
ceive
pr
ophy
lactic
lami
vudin
e the
rapy
Abbr
eviat
ions:
ALT,
alan
ine am
inotra
nsfer
ase;
HBV
DNA,
hepa
titis B
viru
s deo
xyrib
onuc
leic a
cid
a Ren
al all
ogra
ft sur
vival
was s
imila
r betw
een c
ohor
ts an
d HBs
Ag ne
gativ
e pati
ents,
irres
pecti
ve of
lami
vudin
e the
rapy
statu
s b O
f the 5
2 per
iod I p
atien
ts, 14
died
befor
e Jan
uary
1996
. Of th
e rem
aining
38 pa
tients
, 15 s
atisfi
ed cr
iteria
for p
re-e
mptiv
e lam
ivudin
e tre
atmen
t c P
eriod
I pati
ents:
Lami
vudin
e tre
atmen
t star
ted 71
+/–
27 m
onths
(ran
ge 15
to 11
8) af
ter tr
ansp
lantat
ion; p
eriod
II pa
tients
: Lam
ivudin
e tre
atmen
t star
ted 71
+/–
27 m
onths
(ran
ge 1
to 18
) afte
r tra
nspla
ntatio
n. Du
ratio
n of
lamivu
dine t
hera
py w
as 36
.3 +/
– 11.4
mon
ths an
d 32.6
+/–
13.3
month
s for
perio
d I an
d per
iod II
patie
nts re
spec
tively
(p =
0.11
8)
d Of th
e 15 p
eriod
II pa
tients
, 3 w
ere l
ate re
ferra
ls for
who
m lam
ivudin
e was
a sa
lvage
ther
apy f
ollow
ing de
velop
ment
of liv
er de
comp
ensa
tion.
Thes
e pati
ents
were
exclu
ded f
rom
betw
een g
roup
comp
ariso
ns
e For
perio
d I pa
tients
this
value
for s
urviv
al re
fers t
o the
perio
d befo
re Ja
nuar
y 199
6; 14
of 52
patie
nts di
ed. T
wo ot
her p
atien
ts (n
ot tre
ated w
ith la
mivu
dine)
died
from
non-
liver
relat
ed ca
uses
after
Janu
ary 1
996
Hepatitis B virus DNA testing 35

36 Hepatitis B virus DNA testing
Applicability HBV DNA testing was carried out every two to four weeks or every four months in the study by Chan et al (2002)3. Lamivudine treatment was begun if HBV DNA level was:
1. >2.83 × 10⁸ copies/mL among patients with normal ALT, or 2. >2.83 × 10⁷ among patients with increasing ALT levels or liver biopsy confirming hepatitis.
Results reported by Chan et al (2002) were not applicable to Australian current clinical practice. In Australia, all HBsAg positive renal transplant patients undergo prophylactic lamivudine treatment regardless of serum HBV DNA levels.
HBV DNA testing and the monitoring of patients with chronic hepatitis B receiving antiviral therapy
Results reported by Lampertico et al (2005), who applied HBV DNA testing to assess antiviral treatment response, informed assessment of HBV DNA testing over current clinical practice (Table 15). Lampertico et al (2005) assessed outcomes of adefovir dipivoxil therapy among hepatitis B e antigen (HBeAg) negative chronic hepatitis B patients who were lamivudine resistant. Adefovir was administered either at the time point of genotypic resistance (HBV DNA level rising) or phenotypic resistance (ALT level rising). The authors defined genotypic resistance as the presence of moderate HBV DNA levels (3–6 log10 copies/mL) and persistently normal ALT levels; and phenotypic resistance as presence of high levels of both HBV DNA (>6 log10 copies/mL) and ALT. The authors did not define normal ALT level.
All study participants were treated with lamivudine and monitored for signs of drug resistance from study initiation. Monitoring included bi-monthly quantitative HBV DNA testing. Study participants who developed lamivudine resistance were assigned to one of two cohorts. Cohort I included those who developed genotypic resistance to lamivudine when adefovir was not available and continued on lamivudine monotherapy. Genotypic resistance had become phenotypic resistance in all patients in this cohort by the time adefovir was available. Adefovir was available and administered at genotypic resistance to cohort II patients. Adefovir was added to lamivudine treatment in both cohorts. Comparison of adefovir treatment outcomes between the genotypic and phenotypic resistance cohorts informed assessment of HBV DNA testing on patient outcomes. In the second cohort, exposing lamivudine resistance would only happen by detecting phenotypic resistance, such as increasing ALT levels. Because decisions to begin adefovir treatment were based on treatment availability, not ALT level, the phenotypic resistant cohort in this study may not ne comparable with a group whose ALT levels were monitored. Table 16 shows adefovir treatment outcomes.
The results presented in Table 16 indicate that detecting genotypic resistance using HBV DNA testing among HBeAg negative patients undergoing lamivudine monotherapy improves treatment outcomes. When adefovir was co-administered with lamivudine,
3 Test schedule: 1. Every two to four weeks: a) for the first 12 months after transplantation; b) for four months after pulse steroid and/or anti-lymphocyte therapy for acute rejection; c) when serial HBV DNA levels show increasing trend; d) during treatment with lamivudine 2. Every four months for clinically stable long term renal allograft recipients receiving low-dose immunosuppressive medications

Hepatitis B virus DNA testing 37
patients in the genotypic resistance cohort had a significantly greater response compared with the phenotypic resistance cohort: the proportion of patients with undetectable serum HBV DNA levels at three months was 100 per cent and 46 per cent, respectively (p<0.001). Serum ALT levels among the genotypic resistance cohort were also normal at lamivudine resistance onset and remained normal throughout the study period (24 months of adefovir treatment reported). In contrast, normalisation of ALT levels in the phenotypic resistance cohort was time-dependent (Table 16). The two-year clearance rate of serum HBV DNA was higher (100%) among the genotypic resistance cohort compared with the phenotypic cohort (78%) (p values not reported). There was no resistance to adefovir treatment (Table 16) reported in either cohort.
Lampertico et al (2005) provided evidence that pre-treatment HBV DNA levels can predict response to adefovir. Median pre-treatment serum HBV DNA levels for patients in the genotypic resistance and phenotypic resistance cohorts were 4.5 log10 copies/mL (range, 3.4–5.9) and 7.3 log10 copies/mL (range, 4.3–9.3) respectively (p<0.001). Pre-treatment levels of ALT were also significantly different between cohorts. Median pre-treatment serum ALT levels of patients in the genotypic cohort and phenotypic cohorts were 38 IU/mL (range, 20–70) and 145 IU/mL (range 42–2870) respectively (p<0.001). Although the time period between the development of genotypic and phenotypic resistance was relatively short, results indicated that adefovir treatment at genotypic resistance had more favourable outcomes because serum HBV DNA levels were lower than at the time of phenotypic resistance. Hepatitis B outcomes were poorly reported. It could not be determined if the benefits of detecting lamivudine resistance at the genotypic stage translated to longer term benefits in relation to cirrhosis and hepatocellular carcinoma.
Results reported by Lampertico et al (2005) indicated that adefovir therapy was more effective among lamivudine resistant patients when administered at the time of genotypic resistance (Table 16). By inference, this provided evidence that regular HBV DNA testing for patients undergoing lamivudine monotherapy improves health outcomes. The study also showed that adefovir therapy was less effective when administered at the time of phenotypic resistance. This can be inferred to suggest that lamivudine-treated patients who do not undergo regular HBV DNA testing could potentially have less favourable outcomes. These results suggested that ALT testing alone may not be the most effective means of detecting initial development of lamivudine resistance. Adding regular HBV DNA testing offers improvement for monitoring patients undergoing lamivudine monotherapy with potential for short term outcome improvements.

Tabl
e 15
Stud
y cha
ract
erist
ics: A
sses
smen
t of a
dditi
onal
valu
e offe
red
by H
BV D
NA te
stin
g am
ong
lamivu
dine
trea
ted
patie
nts
Stud
y St
udy
desig
n Pa
tient
s (N)
Ot
her t
ests
Te
st ch
arac
teris
tics
Trea
tmen
t St
udy q
ualit
y
Lamp
ertic
o et a
l (2
005)
Ita
ly
Pros
pecti
ve;
not r
epor
ted if
cons
ecuti
ve;
coho
rt stu
dy
(199
7 to
2003
)
HBeA
g neg
ative
durin
g pr
eviou
s 12 m
onths
; ≥18
ye
ars;
HBsA
g car
riers;
with
his
tolog
ical o
r clin
ical
diagn
osis
of ch
ronic
hepa
titis
or ci
rrhos
is. U
nres
pons
ive
to, or
did n
ot me
et, cr
iteria
for
inter
feron
ther
apy
Lam
ivudi
ne re
sista
nce
phas
e:
Phen
otypic
a res
istan
t coh
ort
(n =
46),
ge
notyp
icb res
istan
ce co
hort
(n =
28)
HbeA
g; an
ti-HBe
Ag;
histol
ogica
l or c
linica
l as
sess
ment
of ch
ronic
he
patiti
s B or
cirrh
osis
HBV
DNA
test
: Ve
rsant
3.0 (b
DNA)
, Bay
er.
Sens
itivity
limit o
f 200
0 cop
ies/m
L or
3.3 lo
g 10 c
opies
/mL.
Seru
m HB
V DN
A as
saye
d eve
ry 2 m
onths
Co
mpa
rato
r tes
ts:
ALT
(stan
dard
labo
rator
y pro
cedu
res,
furthe
r deta
ils no
t rep
orted
)
Lami
vudin
e (10
0 mg/d
ay);
adefo
vir
10 m
g (or
ally)
adde
d to l
amivu
dine
mono
thera
py
Adef
ovir
avail
abilit
y: at
time o
f phe
notyp
ic re
sistan
ce (n
=
46);
adefo
vir ad
ded 3
3 mon
thsc
(ave
rage
) afte
r lami
vudin
e init
iation
at tim
e of g
enoty
pic re
sistan
ce
(n =
28);
adefo
vir ad
ded 4
1 mo
nthsc (
aver
age)
after
lami
vudin
e ini
tiatio
n
Poten
tial fo
r bias
: pa
tients
who
wer
e tre
ated u
sing a
defov
ir at
differ
ent s
tages
of
lamivu
dine r
esist
ance
we
re no
t ran
domi
sed
Non-
cons
ecuti
ve
recru
itmen
t: only
inc
luded
patie
nts w
ho
deve
loped
lami
vudin
e re
sistan
ce
Comp
arato
r tes
t not
inter
prete
d ind
epen
dentl
y of H
BV
DNA
test
Redu
ced a
pplic
abilit
y: les
s fre
quen
t HBV
DNA
tes
ting t
han i
n Aus
tralia
n cli
nical
prac
tice
Abbr
eviat
ions:
ALT,
alan
ine am
inotra
nsfer
ase;
HBV
DNA,
hepa
titis B
viru
s deo
xyrib
onuc
leic a
cid
a Phe
notyp
ic re
sistan
ce de
fined
as hi
gh le
vels
of HB
V DN
A (>
6 log
10 co
pies/m
L) an
d high
ALT
leve
ls (N
R by
stud
y) b G
enoty
pic re
sistan
ce de
fined
as m
oder
ate le
vels
of HB
V DN
A (3
-6 lo
g 10 c
opies
/mL)
and p
ersis
tently
norm
al AL
T lev
els (N
R by
stud
y) c B
ecau
se ge
notyp
ic re
sistan
ce is
iden
tified
befor
e phe
notyp
ic re
sistan
ce it
is su
spec
ted th
at the
timing
of ad
efovir
addit
ion to
ther
apy h
as no
t bee
n rep
orted
corre
ctly i
n this
stud
y and
that
adefo
vir tr
eatm
ent w
as be
gun a
t 33
month
s for
the g
enoty
pic re
sistan
t coh
ort a
nd at
41 m
onths
for t
he ph
enoty
pic re
sistan
t coh
ort
38 Hepatitis B virus DNA testing

Tabl
e 16
Adef
ovir
treat
men
t out
com
es am
ong
lamivu
dine
resis
tant
pat
ients
Pre-
adef
ovir
treat
men
t fea
ture
s (m
edian
, ran
ge)
Adef
ovir
treat
men
t out
com
es
Stud
y qua
lity
Stud
y Co
hort
Seru
m
HBV
DNA
(log 1
0 co
pies
/mL)
Seru
m A
LT
(IU/m
L)
Resp
onse
a Se
rum
ALT
no
rmali
satio
nb Tw
o ye
ar
clear
ance
rate
of
seru
m H
BV
DNA
Onse
t of a
defo
vir
resis
tanc
ec
Geno
typi
c res
istan
ce
(n =
28)
Adefo
vir in
itiated
41
month
sd (av
erag
e) af
ter
lamivu
dine
Geno
type D
: 94%
(o
f 17 t
ested
)
4.5 (3
.4–5.9
) 38
(20–
70)
100%
10
0% (t
hrou
ghou
t the
study
perio
d)
100%
0%
Lamp
ertic
o et a
l (2
005)
Ita
ly
Phen
otyp
ic re
sista
nce
(n =
46)
Adefo
vir in
itiated
33
month
sd (av
erag
e) af
ter
lamivu
dine
Geno
type D
: 92%
(o
f 39 t
ested
)
7.3 (4
.3–9.3
) 14
5 (42
–287
0)
46%
Tim
e-de
pend
ent:
month
3 =
37%
(p
<0.00
01)
month
6 =
50%
(p
<0.00
1)
month
24 =
93%
(p
not s
ignific
ant)
78%
0%
Poten
tial fo
r bias
: pa
tients
who
rece
ived
adefo
vir at
diffe
rent
stage
s of la
mivu
dine
resis
tance
wer
e not
rand
omise
d No
n-co
nsec
utive
re
cruitm
ent: o
nly
includ
ed pa
tients
who
de
velop
ed la
mivu
dine
resis
tance
Co
mpar
ator t
est n
ot int
erpr
eted
indep
ende
ntly o
f HBV
DN
A tes
t Re
duce
d app
licab
ility:
less f
requ
ent H
BV
DNA
testin
g in
Austr
alian
clini
cal
prac
tice
Abbr
eviat
ions:
ALT,
alan
ine am
inotra
nsfer
ase;
HBV
DNA,
hepa
titis B
viru
s deo
xyrib
onuc
leic a
cid
a Pati
ents
(%) w
ith un
detec
table
seru
m HB
V DN
A aft
er th
ree m
onths
b P
atien
ts (%
) with
norm
al AL
T lev
els
c Pati
ents
(%) w
ith gr
eater
than
1 log
rebo
und o
f ser
um H
BV D
NA co
mpar
ed w
ith on
-trea
tmen
t (ad
efovir
addit
ion) n
adir.
None
of 10
patie
nts w
ith de
tectab
le se
rum
HBV
DNA
at the
end o
f the s
tudy h
ad ad
efovir
-relat
ed m
utatio
ns,
rtN23
6T A
ND rt
A181
V
d Bec
ause
geno
typic
resis
tance
was
iden
tified
befor
e phe
notyp
ic re
sistan
ce it
ispos
sible
that ti
ming
of ad
ding a
defov
ir was
not b
een r
epor
ted ac
cura
tely i
n this
stud
y, an
d tha
t ade
fovir t
reatm
ent c
omme
nced
at 33
mon
ths fo
r the
ge
notyp
ic re
sistan
t coh
ort a
nd at
41 m
onths
for t
he ph
enoty
pic re
sistan
t coh
ort
Hepatitis B virus DNA testing 39

40 Hepatitis B virus DNA testing
Study quality The phenotypic resistance cohort described by Lampertico et al (2005) is comparable with a group of patients monitored without HBV DNA testing. HBV DNA testing was available and genotypic resistance was detected, but adefovir was not made available until phenotypic resistance developed. Decisions to provide adefovir therapy was determined by test availability, not test results, to assess development of phenotypic resistance. It appears possible that serum ALT levels among this cohort may not be comparable with patients undergoing treatment using adefovir in response to rising ALT levels alone. If detection of phenotypic resistance, such as by serum ALT levels, was considered to be the comparator to HBV DNA testing, there was no blinding between cohorts. The serum ALT levels among the phenotypic cohort participants were not interpreted independently of HBV DNA levels—increased HBV DNA levels would have alerted treating clinicians to which patients’ ALT was likely to change. These considerations make the phenotypic cohort less comparable with a cohort of patients undergoing lamivudine therapy who were not monitored using HBV DNA testing. It could not be determined whether reported outcomes for the phenotypic resistance cohort in this study provided a conservative estimate of outcomes where HBV DNA testing was unavailable.
There was potential for bias in this study which was not designed with the objective of determining whether HBV DNA testing improves health outcomes among patients undergoing lamivudine monotherapy. Bias may have been introduced because the cohorts who were treated using adefovir at different stages of lamivudine resistance (genotypic resistance and phenotypic resistance) were not randomised. It seems that patient recruitment was non-consecutive, which further enhanced bias potential. Lampertico et al (2005) applied prospective recruitment—all patients who underwent lamivudine treatment were not included—only those who developed resistance. This design or reporting omission did not allow assessment to be made about the impact of serum HBV DNA testing used to monitor all patients undergoing lamivudine therapy, irrespective of resistance status. Outcomes for patients who did not develop resistance were not reported, so comparisons could not be made.
Applicability The antiviral therapies considered by Lampertico et al (2005) are applicable to Australian clinical practice. Lamivudine and adefovir are licensed in Australia, but government funding for adefovir is available only for lamivudine resistant patients. It was not reported whether pre- or post-treatment liver biopsies were obtained from study participants. Pre-treatment liver biopsy is required for access to therapies through the Australian Commonwealth Government Highly Specialised Drug Section 100 scheme for the treatment of chronic hepatitis B.
The two-monthly regimen of serum HBV DNA testing reported by Lampertico et al (2005) may reduce the applicability of the results to Australian clinical practice. HBV DNA testing for HBeAg negative patients is conducted every three months in Australian clinical practice. Serum HBV DNA testing every three months is considered to be the optimal regimen in Australia for patients undergoing lamivudine therapy (advisory panel).
Lampertico et al (2005) conducted their study in Italy, where people with hepatitis B virus are more likely to have HBeAg negative disease, which is a progression from positive status (Bell et al 2005). The study’s HBeAg negative patient population had extensive fibrosis or cirrhosis. Non-consecutive patient selection may have contributed

Hepatitis B virus DNA testing 41
to a bias to introduce higher than expected levels of fibrosis and cirrhosis. The findings of this study related to HBeAg negative patients with advanced liver disease or cirrhosis.
Linked evidence
Linking evidence requires aggregating test accuracy and impact of the test on patient management with evidence for treatment effectiveness (MSAC 2005). This approach was necessary because evidence concerning the direct impact of HBV DNA testing on health outcomes was limited.
Lampertico et al (2005) provided some evidence supporting that HBV DNA testing use can lead to improved health outcomes, a linked evidence approach was required because:
1. This study applied to HBeAg negative patients with advanced liver disease or cirrhosis undergoing antiviral therapy. Evidence was also required to support effectiveness of HBV DNA testing among HBeAg positive patients, initial assessments, and monitoring those not undergoing antiviral therapy.
2. The study did not provide evidence that HBV DNA testing provides longer term clinical improvement outcomes. Evidence is required to indicate that changes in serum HBV DNA levels correlate with changes in clinical outcomes.
3. The quality of evidence presented was considered inadequate to inform assessment of HBV DNA testing in the absence of a linked approach.
The study by Chan et al (2002) was considered to provide direct evidence supporting the impact of HBV DNA testing on patient outcomes, but was limited to HBsAg positive kidney allograft recipients. This study had limited applicability to HBV DNA testing in wider clinical practice, and confirmed need for a linked evidence approach. The quality of evidence presented was considered inadequate to assess HBV DNA testing in the absence of a linked approach.

42 Hepatitis B virus DNA testing
HBV DNA test accuracy: Summary of evidence
HBV DNA testing and initial assessment and monitoring of patients not undergoing antiviral therapy
Serum HBV DNA and differentiating inactive carriers from chronic hepatitis B patients
Manesis et al (2003) and Seo et al (2005) assessed the value of HBV DNA testing to differentiate inactive HBeAg negative carriers from HBeAg negative active chronic hepatitis B patients. Manesis et al (2003) reported that serum HBV DNA with a cut point of 30,000 copies/mL had the best diagnostic performance to differentiate active and carrier patient status. There was potential for patient misclassification: sensitivity (identification of patients with active chronic hepatitis B) was 89.6 per cent, meaning that patients could be misclassified as HBeAg negative carriers. This study also reported evidence suggesting that HBV DNA testing adds additional diagnostic performance to differentiation by IgM anti-Hbc complex measurement. In the other study a suitable serum HBV DNA cut point was hard to determine without misclassifying patients: at HBV DNA test thresholds of 4.5 and 5 log copies/mL, 23 per cent and 18 per cent of inactive carriers would be misclassified as active chronic hepatitis B patients respectively. The additional value of HBV DNA testing was not reported in this study. Both studies were considered poor quality as the HBV DNA test was interpreted with knowledge of the reference standard.
Serum HBV DNA and liver histology
Lindh et al (2000) found that increased serum HBV DNA levels were associated with extensive liver damage, especially among HBeAg negative patients. No association was found between serum HBV DNA levels and liver damage among HBeAg positive patients. Peng et al (2003) provided modest evidence indicating that higher serum HBV DNA levels were associated with increased liver damage in HBeAg negative patients. Both studies were considered to offer poor quality evidence because HBV DNA test results were interpreted with knowledge of the reference standard. Additional value provided by HBV DNA testing was not reported by either study.
Serum HBV DNA and sustained HBeAg seroconversion
Chan et al (2003) provided evidence that serum HBV DNA levels of >105 copies/mL at or following seroconversion are predictive of HBeAg reversion. No tests designated as comparators for this assessment were reported.
HBV DNA testing and monitoring of patients undergoing antiviral therapy
HBV DNA testing and predicting response to lamivudine
Buti et al (2001) found that a negative HBV DNA test at month three of therapy was both moderately sensitive and specific as an indicator of sustained response. This study was considered to present poor quality evidence because the reference standard was the clinical outcome of sustained treatment response which was measured by the index test.
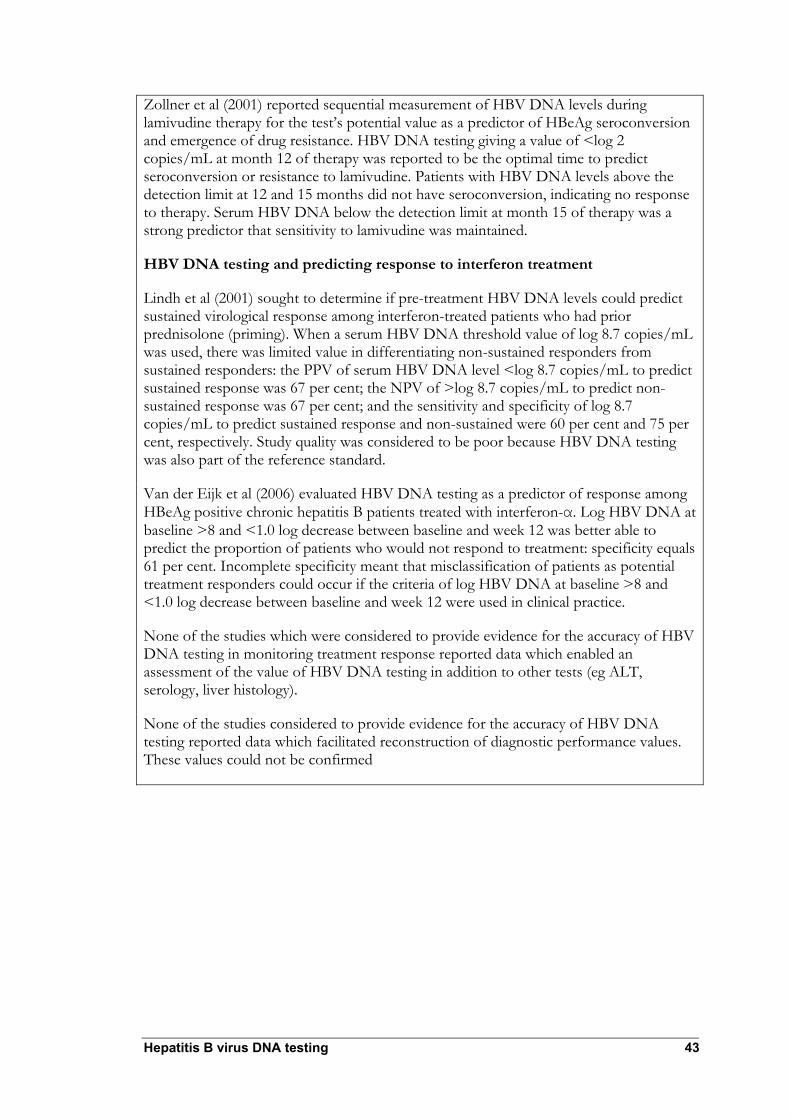
Hepatitis B virus DNA testing 43
Zollner et al (2001) reported sequential measurement of HBV DNA levels during lamivudine therapy for the test’s potential value as a predictor of HBeAg seroconversion and emergence of drug resistance. HBV DNA testing giving a value of <log 2 copies/mL at month 12 of therapy was reported to be the optimal time to predict seroconversion or resistance to lamivudine. Patients with HBV DNA levels above the detection limit at 12 and 15 months did not have seroconversion, indicating no response to therapy. Serum HBV DNA below the detection limit at month 15 of therapy was a strong predictor that sensitivity to lamivudine was maintained.
HBV DNA testing and predicting response to interferon treatment
Lindh et al (2001) sought to determine if pre-treatment HBV DNA levels could predict sustained virological response among interferon-treated patients who had prior prednisolone (priming). When a serum HBV DNA threshold value of log 8.7 copies/mL was used, there was limited value in differentiating non-sustained responders from sustained responders: the PPV of serum HBV DNA level <log 8.7 copies/mL to predict sustained response was 67 per cent; the NPV of >log 8.7 copies/mL to predict non-sustained response was 67 per cent; and the sensitivity and specificity of log 8.7 copies/mL to predict sustained response and non-sustained were 60 per cent and 75 per cent, respectively. Study quality was considered to be poor because HBV DNA testing was also part of the reference standard.
Van der Eijk et al (2006) evaluated HBV DNA testing as a predictor of response among HBeAg positive chronic hepatitis B patients treated with interferon-α. Log HBV DNA at baseline >8 and <1.0 log decrease between baseline and week 12 was better able to predict the proportion of patients who would not respond to treatment: specificity equals 61 per cent. Incomplete specificity meant that misclassification of patients as potential treatment responders could occur if the criteria of log HBV DNA at baseline >8 and <1.0 log decrease between baseline and week 12 were used in clinical practice.
None of the studies which were considered to provide evidence for the accuracy of HBV DNA testing in monitoring treatment response reported data which enabled an assessment of the value of HBV DNA testing in addition to other tests (eg ALT, serology, liver histology).
None of the studies considered to provide evidence for the accuracy of HBV DNA testing reported data which facilitated reconstruction of diagnostic performance values. These values could not be confirmed

44 Hepatitis B virus DNA testing
Is HBV DNA testing accurate?
An ideal study model to determine effectiveness of HBV DNA testing for chronic hepatitis B diagnosis would include measurement of serum HBV DNA levels among a prospectively recruited consecutive cohort of patients. These patient data would be cross-referenced to histological analyses of liver biopsy specimens or chronic hepatitis B clinical outcomes, such as cirrhosis, hepatocellular carcinoma, seroconversion, or sustained viral replication suppression. The reference standard, the best available method of determining true disease status, would be liver biopsy or chronic hepatitis B clinical outcomes. HBV DNA test results would be compared with the reference standard in an independent, blinded approach. It would also be necessary cross-reference the proportional change from baseline HBV DNA levels with liver biopsy results or chronic hepatitis B clinical outcomes where serum HBV DNA testing was used to monitor patients regardless of therapy regimen.
To confirm test accuracy data, where reporting was inadequate in studies considered for inclusion in this assessment, authors of 53 studies were contacted to seek further information. No additional data were obtained from this activity.
HBV DNA testing and the initial assessment and monitoring of patients not receiving antiviral therapy
Studies by Chan et al (2003), Lindh et al (2000), Manesis et al (2003), Peng et al (2003), and Seo et al (2005) informed assessment of the value of serum HBV DNA levels in initial assessment and monitoring of patients not undergoing antiviral therapy. Study characteristics are presented in Table 17.

Tabl
e 17
Stud
y cha
ract
erist
ics: E
valu
atin
g th
e pre
dict
ive va
lue o
f ser
um H
BV D
NA te
stin
g fo
r ini
tial a
sses
smen
t and
mon
itorin
g of
pat
ients
not
und
ergo
ing
antiv
iral
ther
apy
Stud
y St
udy d
esig
n Pa
tient
s (N)
Pr
ior t
ests
HB
V DN
A te
st
char
acte
ristic
s Co
mpa
rato
r te
st(s
) ch
arac
teris
tics
Refe
renc
e st
anda
rd
Stud
y qua
lity
Chan
et al
(2
003)
Ch
ina
Coho
rt, di
recti
on un
clear
En
rolm
ent n
ot re
porte
d (T
ime p
eriod
not
repo
rted)
Two g
roup
s of tr
eatm
ent n
aïve p
atien
ts:
1. HB
eAg p
ositiv
e at s
tudy e
ntry,
follow
ed by
su
staine
d ser
ocon
versi
on fo
r at le
ast 6
mo
nths w
ith no
rmal
ALT
(n
= 33
) Su
staine
d ser
ocon
versi
on:
n = 20
: 11 M
, 9 F
; med
ian ag
e 29
(rang
e 12–
39)
HBeA
g rev
ersio
n: n =
13, 1
1 M, 2
F; m
edian
ag
e 39
(rang
e 13–
68)
2. HB
eAg n
egati
ve, a
nti-H
BeAg
posit
ive at
stu
dy en
try (n
= 40
) Pe
rsiste
nt HB
eAg n
egati
ve:
n = 29
, 12M
, 17F
; med
ian ag
e = 41
(ra
nge 2
1–65
) HB
eAg r
ever
sion:
n = –1
1, M
8,F 3,
med
ian
age =
49
(rang
e 37–
67)
Tests
befor
e stu
dy en
try
not r
epor
ted
Realt
ime P
CR (T
aqMa
n sta
ndar
dised
to
EURO
HEP
gento
type D
, HB
V sta
ndar
d)
Sens
itivity
rang
e = 10
2 to
109 c
opies
/mL
Not r
epor
ted
Clini
cal o
utcom
es:
Susta
ined
sero
conv
ersio
n (H
BeAg
nega
tive,
anti-H
BeAg
po
sitive
) or
reve
rsion
to H
BeAg
po
sitive
De
tails
of as
sess
ment
of su
staine
d se
roco
nver
sion o
r HB
eAg r
ever
sion
not r
epor
ted
P1 Q
3 Ap
plica
bility
: Unc
lear
Crite
ria fo
r pati
ent
inclus
ion no
t rep
orted
Qu
ality:
Poo
r Di
recti
on un
clear
Po
tentia
l sele
ction
bias
Ina
dequ
ate re
portin
g of
refer
ence
stan
dard
Hepatitis B virus DNA testing 45

Stud
y St
udy d
esig
n Pa
tient
s (N)
Pr
ior t
ests
HB
V DN
A te
st
char
acte
ristic
s Co
mpa
rato
r te
st(s
) ch
arac
teris
tics
Refe
renc
e st
anda
rd
Stud
y qua
lity
Lindh
et al
(2
000)
Sw
eden
Pros
pecti
ve, c
ohor
t, no
n-co
nsec
utive
Ch
ronic
hepa
titis B
patie
nts at
tendin
g reg
ular
chec
k-up i
nvite
d to p
artic
ipate
(irre
spec
tive o
f cli
nical
signs
of di
seas
e)
Exclu
ded:
HCV
or H
DV co
infec
ted pa
tients
ex
clude
d (2
patie
nts ha
d pre
vious
inter
feron
trea
tmen
t 6
year
s befo
re)
n = 16
0 (10
5 M, 5
5 F)
Mean
age =
34 (r
ange
16–6
6) H
BeAg
po
sitive
: n =
36 (m
ean a
ge 30
year
s),
HBeA
g neg
ative
: n =
124 (
mean
age 4
0 ye
ars)
Tests
befor
e stu
dy en
try
not r
epor
ted
Ampli
cor H
BV m
onito
r (R
oche
) De
tectio
n ran
ge =
103 t
o 10
7 cop
ies/m
L (m
easu
red a
t time
of
liver
biop
sy)
ALT
(d
etails
not
repo
rted,
Index
ed A
LTa ,
ALTi
used
for
analy
sis)
Liver
biop
sy: d
etails
NR
Hi
stolog
ical
scor
ing: H
AI
(Kno
dell m
ethod
) HA
Iinf
(infla
mmato
ry sc
ore)
and H
AIfib
(fib
rosis
scor
e)
Scor
ing bl
inded
P1 Q
2 Ap
plica
bility
: App
licab
le Qu
ality:
Med
ium
Valid
refer
ence
sta
ndar
d, bli
nded
to te
st re
sults
Po
tentia
l for s
electi
on
bias:
non-
cons
ecuti
ve
recru
itmen
t
Mane
sis et
al (2
003)
Gr
eece
Dire
ction
uncle
ar
Cons
ecuti
ve co
hort
(199
7–19
99)
HBeA
g neg
ative
chro
nic he
patiti
s B pa
tients
; HB
sAg a
nd H
BeAg
nega
tive ≥
6 mon
ths
befor
e stud
y entr
y Ex
clude
d: HD
V, H
CV or
HIV
co-in
fected
and
patie
nts w
ith de
comp
ensa
ted liv
er di
seas
e an
d/or h
epato
cellu
lar ca
rcino
ma
(n =
196)
Cl
assif
ied as
HBe
Ag ne
gativ
e chr
onic
hepa
titis B
if AL
Tb acti
vity i
ncre
ased
and l
iver
histol
ogy c
ompa
tible
with
chro
nic he
patiti
s B
Clas
sified
as H
BeAg
nega
tive i
nacti
ve ca
rrier
s if h
ad pe
rsiste
nt no
rmal
ALTb d
uring
follo
w-up
HBsA
g, an
ti-HB
s, an
ti-HB
c, HB
eAg,
anti-H
BeAg
by
enzy
me
immu
noas
say
HDV,
HCV
, HI
V se
rolog
y by
enzy
me
immu
noas
say
Liver
biop
sies
scor
ed fo
r his
tolog
ical
grad
e and
sta
ge
acco
rding
to
Ishak
scor
e
PCR;
Amp
licor
HBV
Mo
nitor
(Roc
he)
LLD
= 40
0 cop
ies/m
L
IgM an
ti-HBc
ind
ex by
semi
qu
antita
tive
ELIS
A (A
bbot)
AL
T, A
ST
(Abb
ot sp
ectru
m au
to an
alyse
r)
HBeA
g car
rier
status
Cl
assif
ied as
HB
eAg n
egati
ve
chro
nic he
patiti
s B
if ALT
activ
ity
incre
ased
and l
iver
histol
ogy
comp
atible
with
ch
ronic
hepa
titis B
Cl
assif
ied as
HB
eAg n
egati
ve
inacti
ve ca
rrier
s if
had p
ersis
tent
norm
al AL
T du
ring
follow
-up
P1 Q
3 Ap
plica
bility
: App
licab
le HB
V DN
A tes
t reg
imen
co
nside
red a
pplic
able
to Au
strali
an cl
inica
l pr
actic
e Qu
ality:
Poo
r Ind
ex te
st int
erpr
eted
with
know
ledge
of
refer
ence
stan
dard
So
me po
tentia
l for
selec
tion b
ias: d
irecti
on
uncle
ar, c
onse
cutiv
e en
rolm
ent
46 Hepatitis B virus DNA testing

Stud
y St
udy d
esig
n Pa
tient
s (N)
Pr
ior t
ests
HB
V DN
A te
st
char
acte
ristic
s Co
mpa
rato
r te
st(s
) ch
arac
teris
tics
Refe
renc
e st
anda
rd
Stud
y qua
lity
Peng
et al
(2
003)
Ch
ina
Pros
pecti
ve, n
on-
cons
ecuti
ve co
hort;
test-
base
d enr
olmen
t (p
atien
ts wi
th liv
er
biops
y spe
cimen
s <1.0
cm
not e
nroll
ed)
(199
8 to 2
000)
HBsA
g pos
itive;
anti-H
Bs ne
gativ
e; no
an
tivira
l immu
nosu
ppre
ssive
ther
apy d
uring
pe
riod ≥
6 mon
ths be
fore s
tudy.
No
immu
noco
mpro
misin
g dise
ases
. Hep
atitis
A,
E, C
or D
viru
s co-
infec
ted or
othe
r live
r dis
ease
patie
nts ex
clude
d (n
= 74
3)
HBeA
g pos
itive =
64.1%
; HBe
Ag ne
gativ
e =
35.9%
HB
eAg p
ositiv
e gro
up (2
7.1+/
– 8.3
year
s) vs
. HB
eAg n
egati
ve gr
oup (
32.7+
/– 15
.3 ye
ars)
(p<0
.001)
Ge
nder
ratio
: HBe
Ag po
sitive
vs H
BeAg
ne
gativ
e gro
up: 4
13/63
vs 23
4/33 (
M/F)
(6
47 M
, , 96
F)
HBsA
g; an
ti-HB
s Do
t-blot
hybr
idisa
tion-
base
d, in-
hous
e ass
ay.
Semi
-qua
ntitat
ive
rang
es: <
20, 2
0–10
0, 10
0–20
0, 20
0–50
0,
500–
1000
and
>100
0 pg/m
L
NR
Liver
biop
sy:
Sure
cut n
eedle
s (1
6G X
70–9
0 mm)
, sp
ecim
ens f
orma
lin
fixed
, par
affin
embe
dded
and
staine
d with
he
matox
ylin,
eosin
an
d reti
culin
. Slid
es
read
blind
ly
Histo
logica
l sc
oring
: HAI
(K
node
ll meth
od)
HAIin
f (in
flamm
atory
scor
e) an
d HAI
fib
(fibro
sis sc
ore)
P2 Q
2 Ap
plica
bility
: Lim
ited
In-ho
use a
ssay
Qu
ality:
Med
ium
Valid
refer
ence
sta
ndar
d, bli
nded
to te
st re
sults
Po
tentia
l sele
ction
bias
: no
n-co
nsec
utive
en
rolm
ent
Seo e
t al
(200
5)
Japa
n
Retro
spec
tive,
coho
rt,
Enro
lmen
t not
repo
rted
(198
9–20
02)
Chro
nic he
patiti
s B pa
tients
: HB
eAg n
egati
ve in
activ
e car
riers
(with
pe
rsiste
ntly n
orma
l ALT
leve
ls) (n
= 22
) HB
eAg n
egati
ve ch
ronic
hepa
titis B
(p
ersis
tent o
r inter
mitte
nt AL
T ele
vatio
n)
(n =
26)
Patie
nts fo
llowe
d up f
or m
ean 5
1.5 m
onths
(ra
nge 5
–157
mon
ths) a
nd se
en ev
ery 1
–3
month
s
HBsA
g; an
ti-HB
s, Hb
eAg,
anti-H
BeAg
en
zyme
im
muno
assa
y (D
ianab
ot)
ALT
meas
urem
ent
not r
epor
ted
PCR;
Amp
licor
HBV
Mo
nitor
(Roc
he)
Detec
tion r
ange
= 10
3 to
107 c
opies
/mL
NR
HBeA
g car
rier
status
: HB
eAg n
egati
ve
inacti
ve: H
BeAg
ne
gativ
e and
no
rmal
ALT
HB
eAg n
egati
ve
activ
e: HB
eAg
nega
tive a
nd
persi
stent
on
inter
mitte
nt AL
T ele
vatio
n
P1 Q
3 Ap
plica
bility
: App
licab
le Qu
ality:
Poo
r Ind
ex te
st int
erpr
eted
with
know
ledge
of
refer
ence
stan
dard
Po
tentia
l sele
ction
bias
: pa
tient
selec
tion c
riteria
un
know
n, re
trosp
ectiv
e an
alysis
Ab
brev
iation
s: AL
T, al
anine
amino
trans
feras
e; AL
Ti, in
dexe
d ALT
; AST
, asp
artat
e ami
notra
nsfer
ase;
EURO
HEP,
Eur
opea
n con
certe
d acti
on on
vira
l hep
atitis
; HAI
, hist
ologic
al ac
tivity
inde
x; HA
Iinf, h
istolo
gical
activ
ity in
dex f
ibros
is sc
ore
HBV
DNA,
hepa
titis B
viru
s deo
xyrib
onuc
leic a
cid; H
BeAg
, hep
atitis
B vi
rus e
antig
en; H
BsAg
, hep
atitis
B vi
rus s
antig
en; H
CV, h
epati
tis C
viru
s; HD
V, he
patiti
s delt
a viru
s; HI
V, hu
man i
mmun
odefi
cienc
y viru
s; LL
D, lo
wer li
mit o
f dete
ction
a A
LTi =
ALT
divid
ed by
uppe
r refe
renc
e valu
e (UR
V; 0.
8 µka
t–1 fo
r male
s and
0.6 µ
kat–1
for f
emale
s) b P
atien
ts wi
th ab
norm
al AL
T lev
els at
base
line (
>upp
er lim
it of n
orma
l) foll
owed
by m
onthl
y ALT
deter
mina
tion.,
with
liver
biop
sy if
incre
ased
ALT
on at
leas
t twice
. Pati
ents
with
norm
al AL
T fol
lowed
for a
t leas
t 24 m
onths
: ALT
teste
d eve
ry thr
ee m
onths
for f
irst tw
o yea
rs an
d eve
ry six
mon
ths th
erea
fter
Hepatitis B virus DNA testing 47

48 Hepatitis B virus DNA testing
Serum HBV DNA and sustained HBeAg seroconversion Chan et al (2003) aimed to identify a serum HBV DNA level to predict sustained disease remission or HBeAg reversion.
Remission occurred in 65 per cent of patients who were HBeAg positive at study entry (n = 33), and who subsequently seroconverted. The authors applied receiver operating characteristic (ROC) curve analysis (see page 23) to assess the value of HBV DNA levels at seroconversion to predict HBeAg reversion. The reported area under curve (AUC) (see page 23) for this ROC curve was 0.73 (95% CI: [0.53, 0.93]; p = 0.03). HBeAg reversion occurred in 28 per cent of a patient group who were HBeAg negative and anti-HBeAg positive at study entry (n = 40). Using HBV DNA levels at the time of study entry to predict HBeAg reversion, ROC curve analysis resulted in an AUC of 0.83 (95% CI: [0.67, 0.98]; p = 0.002). These data suggest that HBV DNA levels may be moderately accurate to predict HBeAg reversion. Chan et al (2003) did not however report data to confirm these analyses.
Interval likelihood ratios were also reported for the ability of different serum HBV DNA levels to predict HBeAg reversion. Analysis results are presented in Table 18.
Table 18 Serum HBV DNA levels and predicting HBeAg reversion
Proportion of patients (%) Study Patient group Serum HBV DNA (Log10) Sustained
seroconversion HBeAg reversion
Interval likelihood ratio
Study quality
<4 a 55.0 15.4 0.3
4–5 a 40.0 38.5 1.0
HBeAg positive at study entry, seroconverted
>5 a 5.0 46.2 9.2
<4 b 65.5 18.2 0.3
4–5 b 24.1 18.2 0.8
Chan et al (2003) China
HBeAg negative, anti-HBeAg positive at study entry
>5 b 10.3 53.8 5.2
P? Q3 Applicability: Unclear Criteria for patient inclusion not reported Quality: Poor Direction unclear Potential selection bias Inadequate reporting of reference standard
Abbreviations: HBeAg, hepatitis B e antigen; HBV DNA, hepatitis B virus deoxyribonucleic acid a Serum HBV DNA levels at time of seroconversion b Serum HBV DNA levels at time of study entry
The results presented in Table 18 indicate that serum HBV DNA levels of >105 copies/mL at the time of seroconversion are predictive of HBeAg reversion (interval likelihood ratio = 9.2). Likewise, serum HBV DNA levels of >105 copies/mL after seroconversion are also predictive of HBeAg reversion (interval likelihood ratio = 5.2). The additional value of HBV DNA testing could not be assessed because there were no tests considered to be comparators for this assessment reported by this study.
Results reported by Chan et al (2003) should be interpreted with caution. The reported clinical outcomes were considered to be the reference standard for this assessment. Chan et al (2003) did not report how sustained seroconversion or HBeAg reversion was assessed and if clinical outcomes were interpreted blind to HBV DNA levels. It was also

Hepatitis B virus DNA testing 49
unclear whether this study was prospective or retrospective. There is potential for selection bias because patient enrolment was not reported. The applicability of this study is unclear for the reason that patient inclusion criteria were not reported. This study was considered poor quality.
According to NHMRC levels of evidence for diagnostic studies (see page 24), the study by Chan et al (2003) was considered to present level III–2 evidence.
Serum HBV DNA and liver histology Studies by Lindh et al (2000) and Peng et al (2003) informed assessment of the value of serum HBV DNA testing to predict liver histology.
Lindh et al (2000) compared levels of serum HBV DNA and ALT with liver histology activity index (HAI) in treatment regimens for naïve chronic hepatitis B patients attending regular check-ups. They found no association between serum HBV DNA levels and liver histological activity among HBeAg positive patients. Increasing serum HBV DNA level was associated with higher histology activity index inflammation and histology activity index fibrosis scores (p<0.0001) among HBeAG negative patients. The authors reported predictive values of serum HBV DNA and indexed ALT (ALTi) for minimal and severe inflammation among HBeAg negative patients. The results of this analysis are presented in Table 19.
Table 19 Value of serum HBV DNA and ALT to predict liver inflammation among HBeAg negative patients
Serum HBV DNA cut-off (copies/mL)
ALTia cut-off Study Predictive value
104 2 x 10⁵ 107 0.5 1.0 2.0
Study quality
PPV (%) 25 68 100 28 44 67
Predicting HAIinfl >3
NPV (%) 84 87 81 97 88 82
PPV (%) 14 36 83 14 20 42
Lindh et al (2000) Sweden
Predicting HAIinfl >6
NPV (%) 97 95 93 100 94 93
P1 Q2 Applicability: Applicable Quality: Medium Valid reference standard, blinded to test results Potential for selection bias: non-consecutive recruitment
Abbreviations: ALTi, indexed alanine aminotransferase; HAIinfl, histology activity index inflammation score; HBV DNA, hepatitis B virus deoxyribonucleic acid; NPV, negative predictive value; PPV, positive predictive value a Indexed ALT (ALTi) is ALT divided by upper reference value; 0.8 µkat–1 for males and 0.6 µkat–1 for females

50 Hepatitis B virus DNA testing
Data presented in Table 19 show that the positive predictive values for histology activity index inflammation scores >3 and >6 escalate as serum HBV DNA and ALTi cut-offs were increased. This suggests that increased serum HBV DNA and ALT levels are predictive of increased liver inflammation among HbeAg negative patients. The negative predictive values indicate the proportion of patients with histology activity index inflammation scores ≤3 and ≤6 below each cut-off value for serum HBV DNA and ALTi. There is little variation between these values indicating that liver damage (as assessed by histology activity index inflammation scores) may not necessarily increase as serum HBV DNA and ALTi levels increase. Positive predictive value and negative predictive value relate to different groups of patients—those with histology activity index inflammation scores >3 or >6 and those with histology activity index inflammation scores ≤3 and ≤6. Positive and negative predictive values are prevalence dependent—analysis results (Table 19) should be interpreted cautiously—they may not apply to other chronic hepatitis B populations. Inadequate data reporting meant that the additional value of HBV DNA testing over other tests could not be determined.
The prospective study by Lindh et al (2000) was considered to be medium quality and applicable to Australian clinical practice. Liver biopsy was considered to be an appropriate reference standard for this assessment. Liver biopsy histology activity index was scored blind to test results. Test results were interpreted with knowledge of the reference standard to determine the predictive value of HBV DNA testing. Inadequate data reporting did not permit confirmation of predictive values. There was potential for selection bias because patient recruitment was non-consecutive.
According to NHMRC levels of evidence for diagnostic tests (see page 24), the study by Lindh et al (2000) is considered to present level III–1 evidence.
Peng et al (2003) studied serum HBV DNA levels that were cross-classified to liver histology. This study’s objective was to determine the clinical and histological characteristics of HBeAg negative and positive chronic hepatitis B patients. The study was not designed to assess the diagnostic performance of HBV DNA testing as an indicator of chronic hepatitis B. The characteristics of this study are described in Table 17. Peng et al (2003) did not report data that informed assessment of the additional value of HBV DNA testing.
The study by Peng et al (2003) considered a population who were prospectively recruited, non-consecutive cohort of chronic hepatitis B patients 64 per cent of whom were HBeAg positive and the balance HBeAg negative. Peng et al (2003) reported serum HBV DNA levels, cross-classified to histological assessment of liver biopsy samples by both histological activity index inflammatory and histological activity index fibrosis scores. Cross-classification allowed assessment to be made of the diagnostic performance of serum HBV DNA testing. In this analysis, when histological activity index inflammatory or histological activity index fibrosis scores were considered as reference standards, cut-off scores of ≥9 and ≥3, respectively, were considered positive for chronic hepatitis B.
Positive and negative likelihood ratios were calculated to assess the diagnostic performance of serum HBV DNA testing. Each range of serum HBV DNA values was considered the cut point for chronic hepatitis B positive. This analysis assessed the likelihood of developing chronic hepatitis B among patients who test positive (or negative) for different serum HBV DNA values. Analysis results are presented in Table 20.
Hepatitis B virus DNA testing 51
There is a trend toward increased negative likelihood ratio values among HBeAg positive patients when lower serum HBV DNA levels are considered as threshold values for chronic hepatitis (Table 20). (Negative likelihood ratio values are held to be greater than positive likelihood ratio values). These results suggest that there is an increased likelihood of chronic hepatitis B among patients whose serum HBV DNA test results are below threshold values. Thus, lower levels of serum HBV DNA in HBeAg positive patients may be associated with increased liver damage.
Conversely, for each serum HBV DNA threshold value in HBeAg negative patients, positive likelihood ratio is greater than negative likelihood ratio indicating an increased likelihood of chronic hepatitis B among patients with HBV DNA values above the threshold. When the threshold is set at an HBV DNA level of 100–200 pg/mL, the positive and negative likelihood ratios of 4.18 and 0.48 respectively, indicate that this may be the most appropriate level to indicate presence of chronic hepatitis B. Overall, the results of this analysis among HBeAg negative patients indicate that higher levels of serum HBV DNA are associated with increased liver damage.
The study by Peng et al (2003) was considered to offer limited applicability and medium quality. Applicability was limited because the HBV DNA assay applied and reported was developed in-house and performance may be dissimilar to assays available in Australia. No evidence was reported to indicate whether the limits of detection and linearity were tested against current internationally recognised HBV DNA standards such as EUROHEP. Although the study was conducted in China, the patient population was considered applicable because a recent prospective cohort study of Australian chronic hepatitis B patients reported that 65 per cent had Asian ethnicity (Bell et al 2005).
Because there was potential for selection bias, quality was considered medium. Patients were recruited based on a suitable reference standard (liver biopsy specimen not <1.0 cm). It was significant that liver biopsy slides were read blind. Test results were interpreted by the authors with knowledge of the reference standard to inform determination of the predictive value of HBV DNA testing.
In compliance with NHMRC levels of evidence for diagnostic studies (see page 24), the study by Peng et al (2003) was considered to present level III–1 evidence.

Tabl
e 20
Diag
nost
ic pe
rform
ance
of a
hyb
ridisa
tion-
base
d se
rum
HBV
DNA
assa
y
Seru
m H
BV D
NA le
vels
(pg/
mLa )
<20
20–1
00
100–
200
200–
500
500–
1000
>1
000
Patie
nts
Refe
renc
e st
anda
rd
LR+
LR–
LR+
LR–
LR+
LR–
LR+
LR–
LR+
LR–
LR+
LR–
Histo
logica
l acti
vity
index
infla
mmato
ry sc
ore
1.00
0.00b
0.75
4.84
0.44
2.86
0.24
1.61
0.41
1.10
0.35
1.03
HBeA
g po
sitive
Histo
logica
l acti
vity
index
fibro
sis sc
ore
1.00
0.00b
0.70
3.83
0.39
2.36
0.27
1.41
0.49
1.07
0.77
1.01
Histo
logica
l acti
vity
index
infla
mmato
ry sc
ore
1.00
0.00b
2.15
0.07
4.18
0.48
1.21
0.98
0.26
1.06
NR
NR
HBeA
g ne
gativ
e
Histo
logica
l acti
vity
index
fibro
sis sc
ore
1.00
0.00b
1.65
0.17
2.31
0.60
1.61
0.97
0.00
1.02
NR
NR
Abbr
eviat
ions:
HBeA
g, he
patiti
s B e
antig
en; H
BV D
NA, h
epati
tis B
viru
s deo
xyrib
onuc
leic a
cid; L
R+, p
ositiv
e like
lihoo
d rati
o; LR
–, ne
gativ
e like
lihoo
d rati
o; NR
, not
repo
rted
a 1 pg
/mL =
3 x 1
05 co
pies/m
L b W
hen t
he va
lue fo
r tru
e neg
ative
= 0,
this
has b
een a
djuste
d to 0
.1 to
allow
a me
aning
ful LR
– to b
e calc
ulated
52 Hepatitis B virus DNA testing

Hepatitis B virus DNA testing 53
Serum HBV DNA and differentiating inactive carriers from chronic hepatitis B patients In an analysis of patients consecutively examined during routine chronic hepatitis B monitoring, Manesis et al (2003) investigated the predictive ability of baseline measurements of serum alanine aminotransferase (ALT), aspartate aminotransferase (AST), immunoglobulin M (IgM) antibody to hepatitis B core antigen (anti-HBc) and HBV DNA levels to differentiate hepatitis B e antigen (HBeAg) negative chronic hepatitis B patients from HBeAg negative inactive carriers. The predictive ability of a combined IgM anti-HBc and HBV DNA index was also investigated. Analysis results are presented in Table 21 and Table 22.
The ability of several baseline tests to correctly classify active chronic hepatitis B and inactive carriers was measured at cut points appropriate for each test. These data informed determination of positive predictive value, negative predictive value, specificity and sensitivity to differentiate active chronic hepatitis B from inactive carriers (Table 21 and Table 22). It was considered that Manesis et al (2003) applied HBeAg negative carrier status (HBeAg negative and persistent normal ALT during follow-up) as the reference standard for analyses.
Results indicate that serum HBV DNA with a cut point of 30 000 copies/mL has the best sensitivity (89.6%), specificity (100.0%), positive predictive value (100.0%) and negative predictive value (81.6%) to discriminate between active chronic hepatitis B and inactive HBeAg negative patients (Table 21). The combined serum HBV DNA IgM anti-HBc index had slightly higher sensitivity (95.5%) but lower specificity (91.9%).
Manesis et al (2003) also investigated the diagnostic performance of baseline tests among a subset of patients with normal baseline ALT/AST levels (Table 22). This analysis included 25 active chronic hepatitis B patients with normal ALT/AST levels at baseline, but who subsequently developed abnormal ALT during follow-up. HBV DNA with a cut point of 30 000 copies/mL had the best diagnostic performance to discriminate between active chronic hepatitis B and inactive HBeAg negative patients in this patient subset. Compared with serum HBV DNA with a cut point of 30 000 copies/mL, the combined serum HBV DNA IgM anti-HBc index was more sensitive (92.0% vs 80%) but had lower specificity (91.9% vs 100.0%).
Results reported by Manesis et al (2003) suggested that a baseline serum HBV DNA levels with a cut point of 30 000 copies/mL could differentiate HBeAg negative active chronic hepatitis B patients from HBeAg negative inactive carriers. IgM antiHBc tests used in addition to HBV DNA testing at this cut point resulted in a modest improvement in sensitivity and a decrease in specificity. Serum HBV DNA testing at a cut point of 30 000 copies/mL with or without IgM antiHBc testing is not completely sensitive, and thus, potential for misclassification of patients as HbeAg inactive carriers.
This study was considered to present poor quality evidence. Although selection bias was minimised by enrolling patients consecutively, the index test was interpreted with knowledge of the reference standard, which potentially biased diagnostic performance results. Reported values of HBV DNA testing diagnostic performance could not be confirmed. This study was considered applicable to Australian clinical practice. The regimen of serum HBV DNA testing was considered to be appropriate.
In compliance with the NHMRC levels of evidence for diagnostic studies (see page 24), the study by Manesis et al (2003) is considered level III–2 evidence.

Tabl
e 21
Diag
nost
ic pe
rform
ance
of b
aseli
ne te
sts t
o di
ffere
ntiat
e HBe
Ag n
egat
ive ch
roni
c hep
atiti
s B fr
om H
BeAg
neg
ative
inac
tive c
arrie
rs
Stud
y Ba
selin
e tes
t HB
eAg
nega
tive
chro
nic
hepa
titis
B (n
= 13
4)
HBeA
g ne
gativ
e in
activ
e ca
rrier
s (n
= 62
)
Corre
ct
class
ifica
tion
(%)
Posit
ive
pred
ictive
va
lue (
%)
Nega
tive
pred
ictive
va
lue (
%)
Sens
itivit
y (%
) Sp
ecifi
city
(%)
Stud
y qua
lity
ALT
(> vs
≤ up
per li
mit o
f nor
mal)
109/2
5 0/6
2 87
.2 10
0.0
73.1
81.3
100.0
AST
(> vs
≤ up
per li
mit o
f nor
mal)
92/42
0/6
2 78
.6 10
0.0
59.6
68.7
100.0
IgM an
ti-HBc
(≥ vs
<0.2
000)
10
4/30
5/57
82.1
95.4
65.5
77.6
91.9
HBV
DNA
(≥ vs
<30
000 c
opies
/mL)
12
0/14
0/62
92.9
100.0
81
.6 89
.6 10
0.0
HBV
DNA
(≥ vs
<10
0 000
copie
s/mL)
11
7/17
0/62
91.3
100.0
78
.5 87
.3 10
0.00
Mane
sis et
al
(200
3)
HBV
DNA-
IgM an
ti-HBc
inde
x (p
ositiv
ea vs n
egati
ve)
128/6
5/5
7 94
.4 96
.2 90
.5 95
.5 91
.9
P1 Q
3 Ap
plica
bility
: Ap
plica
ble
HBV
DNA
test
regim
en
cons
idere
d ap
plica
ble to
Au
strali
an
clinic
al pr
actic
e Qu
ality:
Poo
r Ind
ex te
st int
erpr
eted
with
know
ledge
of
refer
ence
sta
ndar
d So
me po
tentia
l for
selec
tion
bias:
direc
tion
uncle
ar,
cons
ecuti
ve
enro
lmen
t
Abbr
eviat
ions:
ALT,
alan
ine am
inotra
nsfer
ase;
anti-H
Bc, a
ntibo
dy to
hepa
titis B
core
antig
en; A
ST, a
spar
tate a
mino
trans
feras
e; HB
V DN
A, he
patiti
s B vi
rus d
eoxy
ribon
uclei
c acid
; IgM,
immu
noglo
bulin
M
a Pos
itive =
seru
m HB
V DN
A ≥
30 00
0 cop
ies/m
L or I
gM an
ti-HBc
≥ 0.
200.
All o
ther c
ases
cons
idere
d neg
ative
54 Hepatitis B virus DNA testing

Tabl
e 22
Diag
nost
ic pe
rform
ance
of b
aseli
ne te
sts t
o di
ffere
ntiat
e HBe
Ag n
egat
ive ch
roni
c hep
atiti
s B fr
om H
BeAg
neg
ative
inac
tive c
arrie
rs w
hen
base
line A
LT an
d AS
T va
lues
are n
orm
al
Stud
y Te
st
HBeA
g ne
gativ
e ch
roni
c he
patit
is B
(n =
25)
HBeA
g ne
gativ
e in
activ
e ca
rrier
s (n
= 62
)
Corre
ct
class
ifica
tion
(%)
Posit
ive
pred
ictive
va
lue (
%)
Nega
tive
pred
ictive
va
lue (
%)
Sens
itivit
y (%
) Sp
ecifi
city
(%)
Stud
y qua
lity
IgM an
ti-HBc
(≥ vs
<0.2
000)
14
/11
5/57
81.6
73.7
83.8
56.0
91.6
HBV
DNA
(≥ vs
<30
000 c
opies
/mL)
20
/5 0/6
2 90
.8 10
0.0
88.6
68.0
100.0
HBV
DNA
(≥ vs
<10
0 000
copie
s/mL)
17
/8 0/6
2 90
.8 10
0.0
88.6
68.0
100.0
Mane
sis et
al
(200
3)
HBV
DNA-
IgM an
ti-HBc
inde
x (p
ositiv
ea vs.
nega
tive)
23
/2 5/5
7 92
.0 82
.1 96
.6 92
.0 91
.9
P1 Q
3 Ap
plica
bility
: Ap
plica
ble
HBV
DNA
test
regim
en
cons
idere
d ap
plica
ble to
Au
strali
an
clinic
al pr
actic
e Qu
ality:
Poo
r Ind
ex te
st int
erpr
eted
with
know
ledge
of
refer
ence
sta
ndar
d So
me po
tentia
l for
selec
tion
bias:
direc
tion
uncle
ar,
cons
ecuti
ve
enro
lmen
t Ab
brev
iation
s: HB
V DN
A, he
patiti
s B vi
rus d
eoxy
ribon
uclei
c acid
a P
ositiv
e = se
rum
HBV
DNA ≥3
0 000
copie
s/mL o
r IgM
anti-H
Bc ≥
0.200
. All o
ther c
ases
cons
idere
d neg
ative
Hepatitis B virus DNA testing 55

56 Hepatitis B virus DNA testing
In a retrospective analysis of patients who underwent routine chronic hepatitis B monitoring, Seo et al (2005) compared serum HBV DNA levels between HBeAg negative inactive carriers with HBeAg negative chronic hepatitis B patients. The aim was to determine the HBV DNA level that could distinguish these groups. Serum HBV DNA levels used to differentiate inactive carriers from chronic active hepatitis patients were analysed. HBeAg carrier status (HBeAg negative and active or inactive disease) was considered to be the reference standard. The results of this analysis were used to determine the diagnostic performance of HBV DNA levels to differentiate these patient groups. These results are presented in Table 23.
When serum HBV DNA levels measured at one time point were used, the correct classification of patients as inactive carriers (sensitivity) increased as the serum HBV DNA cut point was increased (Table 23). At lower cut points of 4.5 and 5 log copies/mL, 23 per cent and 18 per cent respectively of inactive carriers would be misclassified as active chronic hepatitis B patients. The correct classification of patients with active chronic hepatitis B (specificity) was poor at the lower cut points, and was very low at the highest cut point, <6 (Table 23). Increasing the cut point for serum HBV DNA means that active chronic hepatitis B patients could be misclassified as inactive carriers. When serum HBV DNA levels were measured at two time points, the misclassification of inactive carrier patients at the lower cut points was somewhat reduced (Table 23). The misclassification of active chronic hepatitis B patients at the higher cut points was also reduced (Table 23).
These results indicate that differentiation of status between HBeAg negative inactive carriers and HBeAg negative active chronic hepatitis patients made on the basis of serum HBV DNA testing alone is not possible, and suggests that results of DNA testing should be considered with other tests (such as serology, serum ALT levels). It was not possible to assess the additional value of HBV DNA testing in this study because data regarding other test results were absent. It is likely that fluctuation in HBV DNA levels in both active and inactive carriers was responsible for HBV DNA testing’s low ability to differentiate these patient groups.
This study was considered to present poor quality evidence. There was potential for selection bias because criteria for patient selection were not reported, and the analysis was retrospective. HbeAg carrier status (inactive or active, chronic) was considered the reference standard in this study. Assessment of HBV DNA levels to distinguish inactive carriers from patients with chronic active disease was not performed independently of patients’ true carrier status. The values reported for the diagnostic performance of HBV DNA testing could not be confirmed. This study was considered to be applicable to Australian clinical practice: the regimen of HBV DNA testing (test and frequency) was considered appropriate.
According to the NHMRC levels of evidence for diagnostic tests (see page 24), the study by Seo et al (2005) was considered to present level III–2 evidence.

Tabl
e 23
Diag
nost
ic pe
rform
ance
of s
erum
HBV
DNA
leve
ls fo
r diff
eren
tiatin
g be
twee
n in
activ
e car
riers
and
chro
nic c
hron
ic he
patit
is B
patie
nts
Seru
m H
BV D
NA m
easu
rem
ent a
t one
tim
e poi
nta
Seru
m H
BV D
NA m
easu
rem
ent a
t two
tim
e poi
ntsb
Stud
y Se
rum
HBV
DNA
cu
t-off
level
(log
copi
es/m
L)
Sens
itivit
y Sp
ecifi
city
Sens
itivit
y Sp
ecifi
city
Stud
y qua
lity
<4.5
77
50
80
71.4
<5
82
45
90
71.4
<5.5
91
32
100
57.1
Seo e
t al
(200
5)
<6
100
14
100
35.7
P1 Q
3 Ap
plica
bility
: App
licab
le Qu
ality:
Poo
r Ind
ex te
st int
erpr
eted
with
know
ledge
of
refer
ence
stan
dard
Po
tentia
l sele
ction
bias
: pa
tient
selec
tion c
riteria
un
know
n, re
trosp
ectiv
e an
alysis
. Ab
brev
iation
s: HB
eAg,
hepa
titis b
e an
tigen
; HBV
DNA
, hep
atitis
b vir
us, d
eoxy
ribon
uclei
c acid
a M
easu
red a
t the e
nd of
follo
w-up
(pati
ent m
onito
ring)
: Mea
n dur
ation
= 51
.5 mo
nths (
rang
e 5–1
57 m
onths
), pa
tients
wer
e se
en ev
ery 1
–3 m
onths
, or m
ore o
ften i
f clin
ically
indic
ated.
HBeA
g neg
ative
inac
tive p
atien
ts (n
= 22
); HB
eAg n
egati
ve ac
tive p
atien
ts (n
= 26
) b M
ean t
ime b
etwee
n 2 m
easu
reme
nts w
as 4
+/– 2
mon
ths. H
BeAg
nega
tive i
nacti
ve pa
tients
(n =
10);
HBeA
g neg
ative
activ
e pati
ents
(n =
14)
Hepatitis B virus DNA testing 57
58 Hepatitis B virus DNA testing
HBV DNA testing and monitoring of patients receiving antiviral therapy
Buti et al (2001), Zollner et al (2001), Lindh et al (2001), and van der Eijk et al (2006) (see Table 24) evaluated the predictive value of HBV DNA testing for patients undergoing lamivudine (Buti et al and Zollner et al) and interferon (Lindh et al and van der Eijk et al) therapy.
HBV DNA testing and predicting response to lamivudine therapy Buti et al (2001) (see Table 25) investigated the predictive value of HBV DNA testing to assess response to lamivudine and reported findings about the ability of negative HBV DNA test results at month three of therapy for early prediction of maintained response to therapy. The study found that negative HBV DNA test results at month three of therapy is a moderately sensitive indicator of sustained response (sensitivity = 73%). Positive HBV DNA test results at month three were found to be a moderately specific indicator of lack of sustained response (specificity = 88%). Assessment of the additional value of HBV DNA testing was not possible because the results of serologic markers and ALT were not reported at month three.
According to NHMRC criteria, this study quality was considered poor and offered limited applicability. The performance of HBV DNA testing in predicting sustained treatment response is likely to be biased as sustained treatment response was also measured by HBV DNA testing: the index test was also the reference standard. Inadequate data reporting did not allow the diagnostic performance values to be confirmed. Applicability is considered limited: patient selection criteria were not reported and outdated HBV DNA tests with poor lower limits of detection were used.
In compliance with NHMRC levels of evidence for diagnostic test studies (see page 24), the study by Buti et al (2000) is considered level III–2.

Tabl
e 24
Char
acte
ristic
s of s
tudi
es ev
aluat
ing
the p
redi
ctive
valu
e of s
erum
HBV
DNA
test
ing
amon
g pa
tient
s und
ergo
ing
antiv
iral t
hera
pies
Stud
y St
udy d
esig
n Pa
tient
s (N)
Pr
ior t
ests
HB
V DN
A te
st
char
acte
ristic
s Co
mpa
rato
r/ ot
her t
est(s
) ch
arac
teris
tics
Refe
renc
e sta
ndar
d St
udy q
ualit
y
Buti e
t al (2
001)
Sp
ain
Pros
pecti
ve, c
ohor
t; op
en-la
bel tr
ial, n
o pla
cebo
grou
p E
nrolm
ent n
ot re
porte
d (tim
e per
iod no
t re
porte
d)
HBV
DNA
posit
ive ch
ronic
he
patiti
s B pa
tients
La
mivu
dine 1
00 m
g/day
>1 y
ear
(rang
e 12–
24 m
onths
) (N
= 35
) Ch
arac
teris
tics a
t bas
eline
: Me
an ag
e = 46
.1 (ra
nge 2
4–62
ye
ars)
Seru
m AL
T (m
ean 1
33 U
/L,
rang
e 49–
364 U
/L)
HBeA
g pos
itive =
15
(M 25
, F 10
)
Pre-
treatm
ent li
ver
biops
y in 3
1 pa
tients
(d
etails
NR)
Stud
y ent
ry:
Chem
olumi
nesc
ent
bDNA
assa
y (Q
uanti
plex,
Chiro
n)
LLD
= 7.
0 x 10
5 At
mon
th th
ree o
f tre
atm
ent:
Real-
time P
CR
assa
y, LL
D =
appr
oxim
ately
1 x
103 g
enom
e co
pies/m
L
HBsA
g (Ab
bot-
Ausz
yme M
c); H
BeAg
an
d anti
-HBe
detec
ted
by ra
dioim
muno
assa
y (D
iasor
in)
Maint
ained
trea
tmen
t re
spon
se:
defin
ed as
un
detec
table
seru
m HB
V DN
A thr
ough
out
thera
py pe
riod
(≤1 y
ear)
(Non
-resp
onse
=
persi
stenc
e of s
erum
HB
V DN
A or
re
appe
aran
ce af
ter
initia
l clea
ranc
e
P2 Q
3 Ap
plica
bility
: Lim
ited
Patie
nt se
lectio
n cri
teria
unkn
own
HBV
DNA
test
outda
ted, L
LD po
or
Quali
ty: P
oor
Index
test
is als
o re
feren
ce st
anda
rd
Inade
quate
data
repo
rting
Lindh
et al
(200
1)
INTR
EPED
stud
y gr
oup:
Denm
ark,
Fran
ce, S
pain,
Sw
eden
, UK
Dire
ction
uncle
ar
Enro
lmen
t not
repo
rted
Patie
nts sa
mpled
fro
m RC
T (1
987–
1990
)
HBeA
g pos
itive c
hron
ic he
patiti
s B
patie
nts:
Plac
ebo f
ollow
ed by
inter
feron
n =
47
Inter
feron
after
pred
nisolo
ne
n = 51
(2 w
eeks
pred
nisolo
ne at
0.6
mg/k
g/d , t
hen 1
wee
k at
0.45 m
g/kg/d
, then
1 we
ek at
0.2
5 mg/k
g/d, w
ith 2
week
s res
t be
fore i
nterfe
ron)
(In
terfer
on at
10 µ
g for
1 we
ek
induc
tion,
then 1
0 µg t
hree
times
pe
r wk f
or 11
wee
ks)
NR
Ampli
cor H
BV
monit
or (R
oche
) Lin
ear d
etecti
on
rang
e = 10
3 to 1
07 co
pies/m
L Se
rum
samp
les
taken
befor
e pr
ednis
olone
tre
atmen
t, befo
re
inter
feron
, at e
nd
of tre
atmen
t and
on
follo
w-up
(mea
n 20
4 day
s afte
r int
erfer
on
cess
ation
)
HBeA
g, an
ti-HBe
Ag
by ra
dio im
muno
assa
y or
enzy
me
immu
noas
say
Index
ed
amino
trans
feras
e va
lue: A
ST or
ALT
(if
no A
ST) in
relat
ion
to UL
N. T
est d
etails
no
t rep
orted
Trea
tmen
t re
spon
se/no
n-re
spon
se
Susta
ined r
espo
nse
defin
ed as
HBV
DNA
lev
el <1
06 cop
ies/m
L at
follow
-up w
ith at
lea
st 1.5
log r
educ
tion
in vir
al loa
d com
pare
d wi
th pr
e-int
erfer
on
treatm
ent
P2 Q
3 Ap
plica
bility
: Lim
ited;
pred
nisolo
ne
pretr
eatm
ent
HBV
DNA
test
regim
en
Quali
ty: P
oor
Index
test
part
of re
feren
ce st
anda
rd
Hepatitis B virus DNA testing 59

Stud
y St
udy d
esig
n Pa
tient
s (N)
Pr
ior t
ests
HB
V DN
A te
st
char
acte
ristic
s Co
mpa
rato
r/ ot
her t
est(s
) ch
arac
teris
tics
Refe
renc
e sta
ndar
d St
udy q
ualit
y
van d
er E
ijk et
al
(200
6)
Nethe
rland
s, Ge
rman
y, Be
lgium
, Un
ited K
ingdo
m,
Denm
ark,
Fran
ce,
Spain
, Italy
, Gre
ece
(16 c
entre
s)
Retro
spec
tive
analy
sis of
data
from
pros
pecti
ve
RCTa :
Af
ter 16
wee
k co
urse
of in
terfer
on-
α (10
milli
on un
its,
3 x pe
r wee
k) HB
eAg p
ositiv
e pa
tients
at w
eek 1
6 we
re ra
ndom
ised—
no fu
rther
trea
tmen
t or
prolo
nged
tre
atmen
t for f
urthe
r 16
wee
ks
(time p
eriod
NR)
Patie
nts: a
ged 1
8–70
year
s; Hb
sAg p
ositiv
e ≥6 m
onths
; HB
eAg p
ositiv
e and
HBV
DNA
po
sitive
(hyb
ridisa
tion
metho
dolog
y); A
ST or
ALT
ele
vatio
n (3 x
in 3
month
s befo
re
study
entry
); liv
er bi
opsy
ev
idenc
e of c
hron
ic he
patiti
s (d
uring
6 mo
nth pe
riod b
efore
stu
dy en
rolm
ent).
Com
pletio
n of
study
regim
en an
d suff
icien
t se
rum
samp
les re
quire
d (n
= 13
3)
Char
acte
ristic
s (N
= 133
at
base
line)
Ag
e (me
dian)
: 34 (
rang
e 16–
70)
Male:
female
: 97:3
6 Et
hnici
ty: C
auca
sian 8
0%; A
sian
16%
; othe
r 5%
Ci
rrhos
is: 16
%
HBV
DNA
(log c
opies
/mL)
(m
edian
): 8.7
(ran
ge 4.
1–10
.0)
AST
(ULN
) (me
dian)
: 1.5
(rang
e 0.5
5–16
.7)
Geno
type:
A 46
%; B
5%; C
12%
; D
32%
; othe
r 6%
HbsA
g; HB
eAg;
HBV
DNA
(hyb
ridisa
tion
metho
dolog
y); A
ST;
ALT;
liver
biop
sy;
anti-H
DV, H
CV, o
r HI
V; se
rum
levels
of
haem
oglob
in,
platel
ets an
d leu
kocy
tes
Real-
time P
CR
assa
y (T
aqMa
n, ca
libra
ted
acco
rding
to
EURO
HEP
HBV
DNA
stand
ards
b )
HBeA
g: Ax
SYM
HBe
2.0 (A
bbott
) Su
staine
d re
spon
ders/
non-
resp
onde
rs Su
staine
d res
pons
e at
wk 52
c : de
fined
as
loss o
f HBe
Ag,
(<0.2
7 PEI
U/m
L),
with
a dec
reas
e in
HBV
DNA
<105
copie
s/mL a
t wee
k 52.
Non r
espo
nder
s wer
e pa
tients
who
did n
ot ful
fil the
se cr
iteria
P2 Q
3 Ap
plica
bility
: Lim
ited
HBV
DNA
testin
g fre
quen
cy di
ffere
nt fro
m Au
strali
an
prac
tice
Quali
ty: P
oor
Retro
spec
tive
analy
sis; in
dex t
est
also p
art o
f refe
renc
e sta
ndar
d
60 Hepatitis B virus DNA testing

Stud
y St
udy d
esig
n Pa
tient
s (N)
Pr
ior t
ests
HB
V DN
A te
st
char
acte
ristic
s Co
mpa
rato
r/ ot
her t
est(s
) ch
arac
teris
tics
Refe
renc
e sta
ndar
d St
udy q
ualit
y
Zolln
er et
al (2
001)
Ge
rman
y
Pros
pecti
ve, c
ohor
t, no
plac
ebo,
longit
udina
l Co
nsec
utive
Trea
tmen
t naïv
e chr
onic
hepa
titis B
patie
nts, H
CV
nega
tive
Lami
vudin
e 100
mg/d
ay
Media
n dur
ation
= 12
mon
ths
(rang
e 6–3
1 mon
ths)
(n =
28)
(25M
:3W)
Mean
age =
45 ye
ars
(rang
e = 17
–69)
Ch
arac
teris
tics a
t bas
eline
: Me
an lo
g HBV
DNA
vira
l load
=
6.71/M
l (ran
ge =
3.47
–7.69
) HB
eAg p
ositiv
e = 24
(86%
)
Test
befor
e stud
y en
try N
R Re
al tim
e PCR
(lig
ht cy
cler D
NA
maste
r SYB
ER
Gree
nI Ro
che)
de
tectio
n lim
it 102
geno
mes/m
L, dy
nami
c ran
ge.
≤109 g
enom
es/m
L (E
UROP
HEP
stand
ard
calib
rated
) HB
V DN
A me
asur
ed ev
ery
three
mon
ths
HBsA
g, HB
eAg,
anti
HBeA
g, an
ti-HBs
Ag,
anti-h
bc —
all b
y EIA
(a
xysm
, Abb
ot)
Clini
cal o
utcom
e Se
roco
nver
sion:
HB
eAg,
anti H
BeAg
(a
xysm
, Abb
ot)
Lam
ivudi
ne
resis
tanc
e:
Defin
ition u
nclea
r, po
ssibl
y HBV
DNA
lev
els ab
ove d
etecti
on
limit a
nd co
ntinu
ously
de
tectab
le HB
eAg
P1 Q
3 Ap
plica
bility
: Ap
plica
ble
Quali
ty: P
oor
Index
test
and
refer
ence
stan
dard
no
t inde
pend
ently
int
erpr
eted
Inade
quate
repo
rting
of re
feren
ce st
anda
rd
Abbr
eviat
ions:
ALT,
alan
ine am
inotra
nsfer
ase;
AST,
aspa
rtate
amino
trans
feras
e; EU
ROHE
P, E
urop
ean c
once
rted a
ction
on vi
ral h
epati
tis; H
AI, h
istolo
gical
activ
ity in
dex;
HBV
DNA,
hepa
titis B
viru
s deo
xyrib
onuc
leic a
cid;
HBeA
g, he
patiti
s B vi
rus e
antig
en; H
BsAg
, hep
atitis
B vi
rus s
antig
en; H
CV, h
epati
tis C
viru
s; HD
V, he
patiti
s delt
a viru
s; HI
V, hu
man i
mmun
odefi
cienc
y viru
s; IN
TREP
ED, e
valua
ting i
nterfe
ron t
reatm
ent w
ith or
with
out
pred
nisolo
ne pr
iming
; LLD
, lowe
r limi
t of d
etecti
on; N
R, no
t rep
orted
; PCR
, poly
mera
se ch
ain, U
LN, u
pper
limit o
f nor
mal
reac
tion;
RCT,
rand
omise
d con
trolle
d tria
l a J
anss
en et
al (1
999)
b H
eerm
an et
al (1
999)
J. C
lin M
icrob
iol 37
(1):6
8–73
c D
efinit
ion of
viro
logic
resp
onse
reco
mmen
ded b
y NIH
wor
ksho
p on c
hron
ic he
patiti
s B: L
ok et
al (2
001)
Gas
troen
terolo
gy 12
0(7)
: 182
8–18
53
d Tre
atmen
t disc
ontin
ued i
f both
resis
tant H
BV (n
ot de
fined
by st
udy a
uthor
s) wi
th ris
ing A
LT le
vels
detec
ted
Hepatitis B virus DNA testing 61

62 Hepatitis B virus DNA testing
Table 25 Predictive ability of negative HBV DNA test for maintained therapy response
Diagnostic performance measure Study Sensitivity
(%) Specificity
(%) Accuracy
(%) PPV (%)
Study quality
Buti et al (2000)
73 88 74 95 P2 Q3 Applicability: Limited Patient selection criteria unknown HBV DNA test outdated, LLD poor Quality: Poor Index test is also reference standard Inadequate data reporting
Abbreviations: NPV, negative predictive value; PPV, positive predictive value
In the study by Zollner et al (2001) the sequential measurement of HBV DNA levels during lamivudine therapy was assessed for its value in predicting HBeAg seroconversion and the emergence of drug resistance. In those patients who had detectable HBeAg at baseline (n = 24), only those patients whose viral load decreased below the detection limit of serum HBV DNA of <log 2 copies/mL lost HBeAg. The PPV and NPV of HBV DNA <log 2 copies/mL for several time points for prediction of HBeAg seroconversion and development of lamivudine resistance was then determined by Zollner et al (2001). The results of this analysis are presented in Table 26.
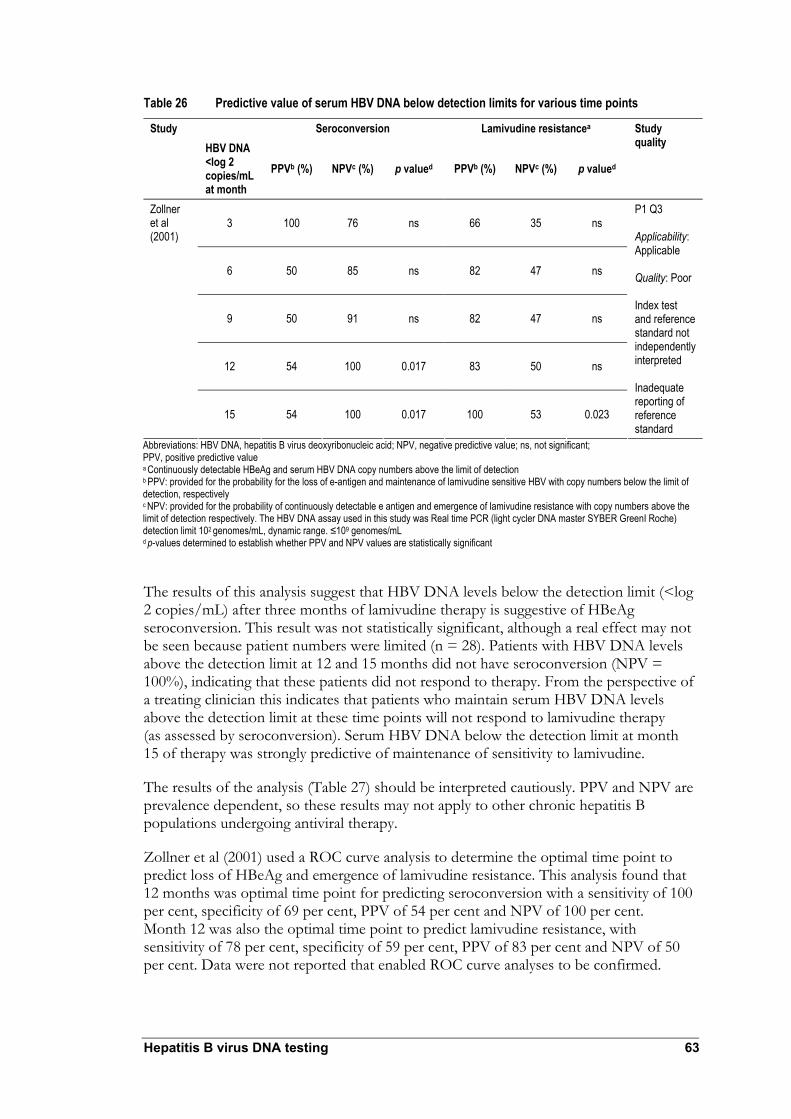
Hepatitis B virus DNA testing 63
Table 26 Predictive value of serum HBV DNA below detection limits for various time points
Seroconversion Lamivudine resistancea Study HBV DNA <log 2 copies/mL at month
PPVb (%) NPVc (%) p valued PPVb (%) NPVc (%) p valued
Study quality
3 100 76 ns 66 35 ns
6 50 85 ns 82 47 ns
9 50 91 ns 82 47 ns
12 54 100 0.017 83 50 ns
Zollner et al (2001)
15 54 100 0.017 100 53 0.023
P1 Q3 Applicability: Applicable Quality: Poor Index test and reference standard not independently interpreted Inadequate reporting of reference standard
Abbreviations: HBV DNA, hepatitis B virus deoxyribonucleic acid; NPV, negative predictive value; ns, not significant; PPV, positive predictive value a Continuously detectable HBeAg and serum HBV DNA copy numbers above the limit of detection b PPV: provided for the probability for the loss of e-antigen and maintenance of lamivudine sensitive HBV with copy numbers below the limit of detection, respectively c NPV: provided for the probability of continuously detectable e antigen and emergence of lamivudine resistance with copy numbers above the limit of detection respectively. The HBV DNA assay used in this study was Real time PCR (light cycler DNA master SYBER GreenI Roche) detection limit 102 genomes/mL, dynamic range. ≤109 genomes/mL d p-values determined to establish whether PPV and NPV values are statistically significant
The results of this analysis suggest that HBV DNA levels below the detection limit (<log 2 copies/mL) after three months of lamivudine therapy is suggestive of HBeAg seroconversion. This result was not statistically significant, although a real effect may not be seen because patient numbers were limited (n = 28). Patients with HBV DNA levels above the detection limit at 12 and 15 months did not have seroconversion (NPV = 100%), indicating that these patients did not respond to therapy. From the perspective of a treating clinician this indicates that patients who maintain serum HBV DNA levels above the detection limit at these time points will not respond to lamivudine therapy (as assessed by seroconversion). Serum HBV DNA below the detection limit at month 15 of therapy was strongly predictive of maintenance of sensitivity to lamivudine.
The results of the analysis (Table 27) should be interpreted cautiously. PPV and NPV are prevalence dependent, so these results may not apply to other chronic hepatitis B populations undergoing antiviral therapy.
Zollner et al (2001) used a ROC curve analysis to determine the optimal time point to predict loss of HBeAg and emergence of lamivudine resistance. This analysis found that 12 months was optimal time point for predicting seroconversion with a sensitivity of 100 per cent, specificity of 69 per cent, PPV of 54 per cent and NPV of 100 per cent. Month 12 was also the optimal time point to predict lamivudine resistance, with sensitivity of 78 per cent, specificity of 59 per cent, PPV of 83 per cent and NPV of 50 per cent. Data were not reported that enabled ROC curve analyses to be confirmed.

64 Hepatitis B virus DNA testing
This study is considered poor quality. For this assessment the clinical outcomes of HBeAg seroconversion and lamivudine resistance were considered to be the reference standards for HBV DNA testing. However, in order to determine the optimal time point for prediction of seroconversion and lamivudine resistance serum HBV DNA levels were not interpreted blind of these clinical outcomes, that is, serum HBV DNA levels were not used to predict outcome independently of the outcome itself. Definition of the reference standard (clinical outcome of lamivudine resistance) was not adequately reported.
This study was considered applicable to Australian clinical practice. HBV DNA test sensitivity and frequency of testing was considered to be applicable to HBV DNA test use in Australia.
According to NHMRC levels of evidence for diagnostic studies (see page 24), the study by Zollner et al (2001) is considered level III–2.
HBV DNA testing and predicting response to interferon treatment Two studies were identified where the serum HBV DNA testing was assessed for predicting response to interferon treatment (Lindh et al 2001; van der Eijk et al 2006). The characteristics of these studies are presented in Table 24.
In the study by Lindh et al (2001) the predictive ability of pre-treatment HBV DNA levels to predict sustained virological response was assessed for patients treated with interferon and prior prednisolone. Lindh et al (2001) reported the diagnostic performance of pre-treatment serum HBV DNA of log 8.7 copies/mL. The PPV of serum HBV DNA level <log 8.7 copies/mL to predict sustained response was 67 per cent; the NPV of >log 8.7 copies/mL to predict non-sustained response was 67 per cent. The sensitivity and specificity of log 8.7 copies/mL to predict sustained response and non-sustained were 60 per cent and 75 per cent, respectively. These results indicate that this threshold value of pre-treatment serum HBV DNA has limited predictive value in differentiating non-sustained responders from sustained responders. It was not possible to determine the additional value of HBV DNA testing over other tests in predicting interferon response.
The results reported by Lindh et al (2001) should be interpreted with caution. For this assessment, the index test (HBV DNA test) was also part of the reference standard (sustained response). This would bias test performance in favour of the test. Assessment of whether the HBV DNA test could predict response was not done independently of the reference standard. The enrolment of patients was not reported, introducing further potential for selection bias. For these reasons this study is considered poor quality. It was not possible to recalculate the diagnostic performance values reported in this study. The applicability of this study to Australian clinical practice may be limited because of prednisolone priming before interferon treatment.
In compliance with the NHMRC levels of evidence for diagnostic studies (see page 24), the study by Lindh et al (2001) is considered level III–2 evidence.
Van der Eijk et al (2006) evaluated HBV DNA testing as a predictor of response or non-response among HBeAg positive chronic hepatitis B patients treated with interferon-α. The study compared quantitative measurement of serum HBV DNA with quantitative measurement of HBeAg. Inadequate data reporting did not enable determination of the additional value of HBV DNA testing over HBeAg testing. Clinical outcome, defined by

Hepatitis B virus DNA testing 65
sustained response (or non-response) to interferon was considered the reference standard for this assessment. The characteristics of this study are presented in Table 24.
This study was a retrospective analysis of an RCT by Janssen et al (1999) designed to establish whether prolonged treatment with interferon–α has increased efficacy. Patients recruited to this study were HBeAg positive. The objectives of the study by van der Eijk et al (2006) were to determine whether treatment response could be predicted by quantitative assessment of serum HBV DNA or HBeAg.
For both serum HBV DNA and HBeAg testing, van der Eijk et al (2006) determined whether treatment response/non-response could be predicted by the following test criteria:
1. Baseline serum HBV DNA or HBeAg levels
2. Decrease between baseline and week 8 or 12 levels of serum HBV DNA or HBeAg
3. The combination of baseline level and decrease between baseline and week 8 or 12 levels of serum HBV DNA or HBeAg
For each test criterion the area under the curve (AUC) was determined from receiver operating characteristic (ROC) plots—this analysis allows the comparative diagnostic performance of different tests or test criteria to be assessed (see page 23). The proportion of sustained responders correctly identified by the test (ie true positives) was plotted against the proportion of non-responders predicted to be responders by the test (ie false positives). The authors reported that this was done for each possible threshold value for test criteria described above. ROC plots could not be reconstructed using data reported in the study. Results of ROC plot analysis were reported for the following test criteria.
When testing for baseline values in combination with decrease from baseline to week 12 was compared for HBV DNA and HBeAg, the AUC were 0.87 and 0.76 respectively. This result is statistically significant (p<0.05) and provides some evidence that HBV DNA testing is a more accurate predictor of treatment response than HBeAg testing among HBeAg positive patients.
ROC plot analysis was also used to investigate whether testing for HBV DNA before week 12 would be a better predictor of treatment response: ROC curves were plotted for log HBV DNA at baseline in combination with decrease between baseline and week 8 versus HBV DNA at baseline in combination with decrease between baseline and week 12. For the combination of baseline testing and decrease between baseline and follow-up tests the AUC were 0.85 for testing at week 8 and 0.86 for week 12 testing.This minor difference was not statistically different (p = 0.60) (the study authors did not provide any explanation for the minor difference in AUC value for the predictive value of HBV DNA at baseline in combination with decrease between baseline and week 12 in this analysis compared with the value determined in the comparison with HBeAg testing).

66 Hepatitis B virus DNA testing
For each test criterion the following measures of diagnostic performance were also determined:
1. Positive predictive value (PPV): percentage observed sustained responders out of all predicted by the test to respond
2. Negative predictive value (NPV): percentage observed non-responders of all predicted by test to be non-responders
3. Sensitivity (true positive rate): percentage sustained responders correctly predicted by the test
4. Specificity (false positive rate): percentage non-responders correctly predicted by the test
5. False negative rate: percentage observed sustained responders not predicted by the test
6. False positive rate: percentage observed non-responders predicted to be sustained responders by the test.
Van der Eijk et al (2006) reported only results of serum HBV DNA testing (Table 27). The test criteria presented in Table 27 were selected by the study investigators to maximise the number of sustained responders correctly predicted by test criteria: ie the true positive rate (or sensitivity) = 100 per cent. The authors reported that this approach was used to maximise the predictive value for non-responders: ie to maximise the negative predictive value (NPV) of the test. The presented NPV values presented in Table 27 are all (apart from one exception) 100 per cent. It is not clear why the authors reported the data presented in Table 27 for log HBV DNA at baseline >8 and <1.0 log decrease between baseline and week 8: the intention was to establish cut-off points with sensitivity of 100 per cent. It is possible that the reported sensitivity of 93 per cent was the optimal sensitivity for the range of baseline values and decrease between baseline and week 8 that were observed in the study.
As measures of diagnostic performance, NPV and PPV generally have poor transferability between study populations as these measures are prevalence dependent: if the test criteria used in this study are applied to predict interferon-α responders and non-responders in another population, differences in patient characteristics could result in differences in predictive ability.
Of the test criteria chosen by the study investigators to optimise the NPV and sensitivity, the log HBV DNA at baseline >8 and <1.0 log decrease between baseline and week 12 had a better ability to predict the proportion of patients who would not respond to treatment (ie highest specificity). Translated to clinical practice this result suggests that this test criterion has the potential to maximise the correct identification of patients least likely to benefit from interferon-α treatment. Specificity of this test criterion was 61 per cent. Due to the absence of complete specificity, there was margin for patient misclassification: if the criteria of log HBV DNA at baseline >8 and <1.0 log decrease between baseline and week 12 were used in clinical practice to predict non-responders, it is possible that patients could be incorrectly classified as potential treatment responders.
Hepatitis B virus DNA testing 67
The study by van der Eijk et al (2006) is considered to be of limited applicability and poor quality. The applicability is limited as HBV DNA testing in Australia is not conducted as frequently as the study. The quality of this study is poor for reasons related to HBV DNA test use as part of the reference standard. If definition of a sustained response according to HBV DNA levels is not itself an accurate measure of final outcome (eg improvement in liver histology, reduced risk of cirrhosis etc), then using HBV DNA levels to predict response to treatment has the potential to overestimate the predictive ability of the test. Because of the retrospective nature of this analysis, the test criteria were interpreted with knowledge of a component of the reference standard. Inadequate data reporting meant that it was not possible to reconstruct the analyses reported in this study.
In compliance with the NHMRC levels of evidence for diagnostic studies (see page 24), the study by van der Eijk et al (2006) is considered level III–2 evidence.
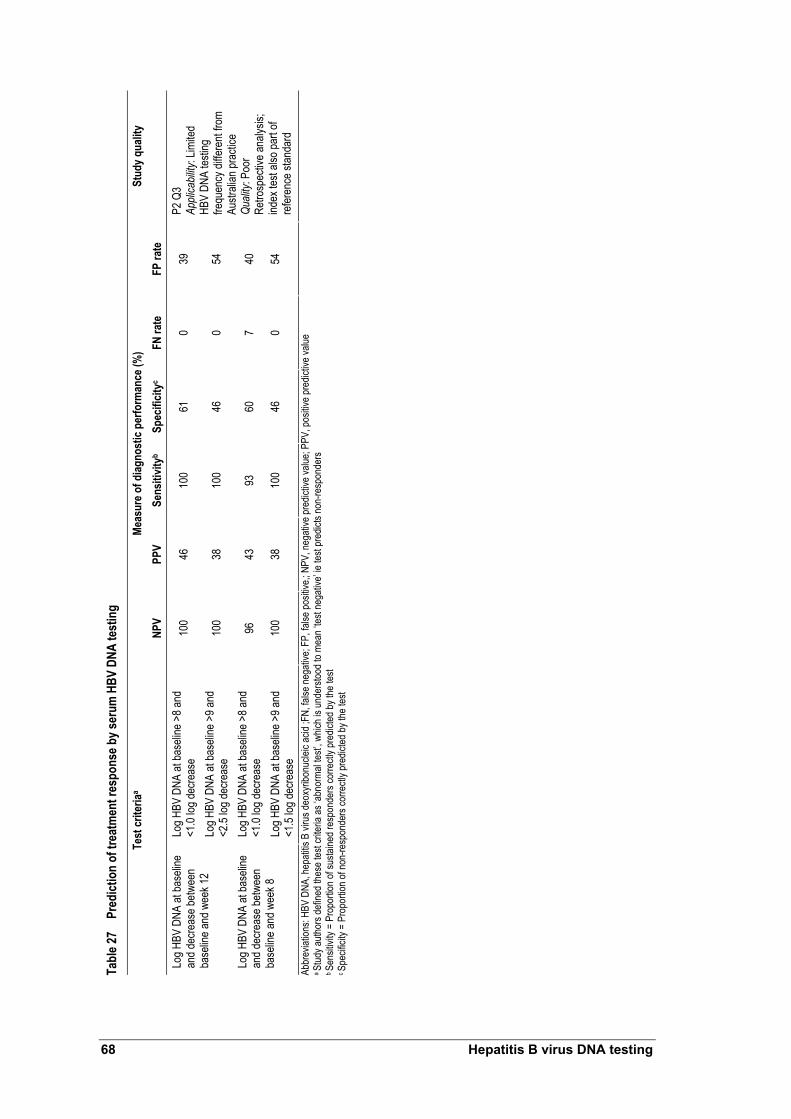
Tabl
e 27
Pred
ictio
n of
trea
tmen
t res
pons
e by s
erum
HBV
DNA
test
ing
Meas
ure o
f diag
nost
ic pe
rform
ance
(%)
Test
crite
riaa
NPV
PPV
Sens
itivit
yb Sp
ecifi
cityc
FN ra
te
FP ra
te
Stud
y qua
lity
Log H
BV D
NA at
base
line >
8 and
<1
.0 log
decre
ase
100
46
100
61
0 39
Lo
g HBV
DNA
at ba
selin
e an
d dec
reas
e betw
een
base
line a
nd w
eek 1
2 Lo
g HBV
DNA
at ba
selin
e >9 a
nd
<2.5
log de
creas
e 10
0 38
10
0 46
0
54
Log H
BV D
NA at
base
line >
8 and
<1
.0 log
decre
ase
96
43
93
60
7 40
Lo
g HBV
DNA
at ba
selin
e an
d dec
reas
e betw
een
base
line a
nd w
eek 8
Lo
g HBV
DNA
at ba
selin
e >9 a
nd
<1.5
log de
creas
e 10
0 38
10
0 46
0
54
P2 Q
3 Ap
plica
bility
: Lim
ited
HBV
DNA
testin
g fre
quen
cy di
ffere
nt fro
m Au
strali
an pr
actic
e Qu
ality:
Poo
r Re
trosp
ectiv
e ana
lysis;
ind
ex te
st als
o par
t of
refer
ence
stan
dard
Ab
brev
iation
s: HB
V DN
A, he
patiti
s B vi
rus d
eoxy
ribon
uclei
c acid
;FN,
false
nega
tive;
FP, fa
lse po
sitive
,; NPV
, neg
ative
pred
ictive
value
; PPV
, pos
itive p
redic
tive v
alue
a Stud
y auth
ors d
efine
d the
se te
st cri
teria
as ‘a
bnor
mal te
st’, w
hich i
s und
ersto
od to
mea
n ‘tes
t neg
ative
’ ie te
st pr
edict
s non
-resp
onde
rs
b Sen
sitivi
ty =
Prop
ortio
n of s
ustai
ned r
espo
nder
s cor
rectl
y pre
dicted
by th
e tes
t c S
pecif
icity
= Pr
opor
tion o
f non
-resp
onde
rs co
rrectl
y pre
dicted
by th
e tes
t
68 Hepatitis B virus DNA testing

Hepatitis B virus DNA testing 69
Do serum HBV DNA levels correlate to clinical outcomes?
Evidence that changes in HBV DNA levels correlate with changes in long term clinical outcomes was considered necessary to inform the linked evidence approach applied in this assessment. The accuracy studies discussed did not provide adequate evidence that using the HBV DNA test provides or predicts improvements in long term clinical outcomes.
The results of the literature search were reviewed again and studies using an appropriate statistical analysis (page 23) to compare serum HBV DNA levels with outcomes were retrieved.

70 Hepatitis B virus DNA testing
Summary of evidence for the relationship between serum HBV DNA levels and clinical outcomes
Systematic review The relationship between serum HBV DNA levels and clinical outcomes was investigated. Although the impact of test use on clinical outcomes was not investigated, there is evidence to support that HBV DNA levels can predict outcome and indicate treatment efficacy. Serum HBV DNA levels (both baseline and change from baseline) were correlated with liver histology and HBeAg seroconversion.
Serum HBV DNA and hepatocellular carcinoma risk The REVEAL-HBV study reported that increased HBV DNA levels at baseline were an independent risk factor for hepatocellular carcinoma. After adjusting for other hepatocellular carcinoma risk factors, participants with serum HBV DNA of ≥1.0×10⁶ copies/mL and 300–9.9×10³ copies/mL had hazard ratios of developing hepatocellular carcinoma of 6.1 (95% CI: [2.9, 12.7]; p<0.01) and 1.1 (95% CI: [0.5, 2.3]; p = 0.86) respectively. The findings of the REVEAL-HBV study were the same for HbeAg negative and positive people, but most participants in this study were HBeAg negative. Participants with increased serum HBV DNA levels, who did not have cirrhosis, also had an increased risk of developing hepatocellular carcinoma.
The increased risk of developing hepatocellular carcinoma with increased HBV DNA levels was evident in this study: increased serum HBV DNA level at study entry was associated with increased cumulative incidence of hepatocellular carcinoma
Most findings from the REVEAL-HBV study were based on serum HBV DNA measured at a single time point. Persistently elevated serum HBV DNA levels were also shown to increase risk of hepatocellular carcinoma: of participants with serum HBV DNA levels of 10,000 to 99,999 copies/mL at study entry, those with serum HBV DNA levels of ≥100 000 at follow-up, had a statistically significant increase in hepatocellular carcinoma risk (multivariate-adjusted HR = 3.5; 95% CI: [1.4, 9.2]; p = 0.01). Okhubo et al (2001) found that when hepatocellular carcinoma was diagnosed, serum HBV DNA levels were an independent prognostic factor for survival. Patient survival increased when serum HBV DNA levels were low.
Harris et al (2003) found that spontaneous HBV DNA seroconversion is a prognostic factor for hepatocellular carcinoma death. Patients who spontaneously became HBV DNA negative (stable or unstable) increased risk of hepatocellular carcinoma death. Low serum HBV DNA levels at baseline were associated with a reduced risk of hepatocellular carcinoma death.
Serum HBV DNA and cirrhosis risk The REVEAL-HBV study also investigated the relationship between serum HBV DNA levels and cirrhosis. Serum HBV DNA levels were shown to be an independent risk factor for cirrhosis. After adjusting for age, sex, smoking, alcohol consumption, HBeAg status and ALT level, participants with serum HBV DNA of ≥1.0×10⁶ had a relative risk of cirrhosis of 6.5 (95% CI: [4.1, 10.2]; p<0.001). This risk was reflected in cirrhosis incidence. Increased baseline serum HBV DNA levels were associated with increased cumulative incidence of cirrhosis.

Hepatitis B virus DNA testing 71
Serum HBV DNA and hepatocellular carcinoma prognosis in cirrhotic patients Ishikawa et al (2001) and Mahmoud et al (2005) examined the association between serum HBV DNA levels and hepatocellular carcinoma development among patients with HBV-related cirrhosis. Elevated serum HBV DNA was the strongest prognostic factor for development of hepatocellular carcinoma among these patients.
Serum HBV DNA and hepatocellular carcinoma recurrence after curative resection Kubo et al (2000) and Kubo et al (2003) assessed the value of HBV DNA testing as a prognostic factor for hepatocellular carcinoma recurrence after surgical resection. It was uncertain if patient cohorts overlapped. Results indicated that high serum HBV DNA levels were significant prognostic indicators of hepatocellular carcinoma recurrence. These analyses were conducted using serum HBV DNA levels taken at a single time-point before surgery. It is possible that fluctuations in serum HBV DNA levels post-hepatocellular carcinoma resection, which may contribute to recurrence, were not considered.
Serum HBV DNA and liver histology Yuen et al (2004) found a weak correlation between serum HBV DNA levels and liver histology in anti-HBeAg positive patients (HBeAg negative). It was suggested that liver damage severity increases as serum HBV DNA levels escalate. No correlation was found between serum HBV DNA levels and liver histology among HBeAg positive patients.
Systematic review
A systematic review by Mommeja-Marin et al (2003) investigated the relationship between serum HBV DNA levels and clinical outcomes. The characteristics of this systematic review are presented in Table 28, and summarised results are presented in Table 29.
The change in median serum HBV DNA level from baseline correlated strongly with the median change in histologic activity index (HAI) from baseline (r = 0.96, p = 10–6) for treated and untreated patients. This correlation was also present in the subset analyses of HBeAg positive patients (r = 0.98, p = 6×10⁻⁶) and nucleoside analogue treated patients (r = 0.98, p = 0.0003).
The absolute level of serum HBV DNA level and the change in median serum HBV DNA level from baseline were both weakly correlated with the proportion of patients with normal ALT levels (see Table 29). Subgroup analyses showed that these correlations were stronger in studies using nucleotides analogues (Table 29).
The absolute level of HBV DNA and incidence of HBeAg seroconversion was strongly correlated in studies where patients were treated with nucleotides analogues (r = 0.92, p = 0.001). There was a moderate correlation between change in HBV DNA level from baseline and incidence of HBeAg seroconversion (r = 0.72, p = 0.0002). Subgroup analysis showed that this correlation was slightly better in the cirrhosis group (r = 0.87, p = 5×10⁻⁵). The absolute level of serum HBV DNA was also correlated with the incidence of HBeAg seroconversion (r = 0.72, p = 0.02).
Absolute HBV DNA level was weakly correlated for all end point comparisons in the subgroup of studies where liquid hybridisation assays had the lower limit of detection

72 Hepatitis B virus DNA testing
corrected (Table 29). The authors did not report whether a similar subgroup analysis was performed for studies where PCR HBV DNA assays were used.
The authors reported that the correlation between loss of HBsAg and HBV DNA change from baseline was not assessable. Analysis correlating absolute HBV DNA levels and loss of HBsAg found that two of 367 (0.5%) patients with viral loads greater than 1000 copies/mL lost HBsAg, and 25 of 74 (33.8%) patients with viral loads less than 1000 copies/mL (p<0.0001). The authors reported that this analysis relied almost entirely on interferon trials, and commented that these findings may not be directly applicable to nucleosides.
The authors also reported a correlation between histologic necroinflammatory index and baseline HBV DNA levels among untreated patients (r = 0.78, p = 0.0001). The authors reported that this correlation was primarily influenced by one study of patients with low viral load levels. A correlation between HAI and serum HBV DNA levels at the end of treatment was also reported patients (r = 0.71, p = 0.003). A weak correlation between HBV DNA levels and the percentage of patients with normal ALT was reported (r = 0.62, p = 0.0004).
The change in serum HBV DNA level from baseline had a stronger correlation with the change of HAI score from baseline (r = 0.96, p = 10–6) than with either the proportion of patients with normal ALT levels (r = 0.5, p = 0.06) or the incidence of HBeAg seroconversion (r = 0.72, p = 0.0002). Findings were similar in the nucleoside analogue treated subgroup (Table 29). These results could potentially be interpreted as providing indirect evidence that changes in serum HBV DNA levels are more indicative of changes in the extent of active liver disease than ALT or HBeAg seroconversion. Comparisons of this kind should be performed in the same patient population.
This systematic review by Mommeja-Marin et al (2003) provides evidence that serum HBV DNA levels (baseline and changes from baseline) correlate to short term outcomes (eg change in HAI score and incidence of HBeAg seroconversion). Significantly changes in serum HBV DNA levels correlate with the incidence of HBeAg seroconversion—which is one of the aims of antiviral therapy. Reported evidence suggests that changes in serum HBV DNA illustrate treatment efficacy. No evidence was presented to indicate that improvement in short term outcomes are provided HBV DNA testing itself, or that short term benefits translate to improvements in long term outcomes. Comparison of the results of the subgroup analyses should be interpreted with caution as differences in the strength of correlation could result from the variation in the patient populations of studies included in this systematic review.
Application of the NHMRC quality criteria (Appendix D) classifies this systematic review as medium quality: importantly heterogeneity was explored by subgroup analyses; but no quality assessment was reported for included studies. Validity was reduced as no subgroup analysis was performed for PCR HBV DNA assays.

Tabl
e 28
Char
acte
ristic
s of a
syst
emat
ic re
view
evalu
atin
g th
e rela
tions
hip
betw
een
seru
m H
BV D
NA le
vels
and
clini
cal o
utco
mes
Syst
emat
ic re
view
Objec
tive
Sear
ch st
rate
gy
Inclu
sion/
exclu
sion
crite
ria
Meth
odol
ogy
Stud
y qua
lity/C
omm
enta
Momm
eja-
Marin
et al
(2
003)
To in
vesti
gate
the
relat
ionsh
ip be
twee
n vir
al loa
d lev
el or
su
ppre
ssion
and
treatm
ent r
espo
nse
Medli
ne
(199
6–20
02)
Sear
ch te
rms:
hepa
titis B
; HBV
; and
HB
V DN
A
Inclus
ion cr
iteria
: Pu
blish
ed in
Eng
lish;
repo
rted H
BV D
NA le
vels;
sp
ecifie
d othe
r end
-poin
ts (A
LT, s
erolo
gy, &
his
tolog
y); re
porte
d med
ians,
mean
s or d
ata fo
r es
timati
on of
med
ian; p
rosp
ectiv
e pati
ent
enro
lmen
t; >25
chro
nicall
y infe
cted p
atien
ts; no
n-im
muno
-dep
ress
ed; v
iral lo
ads r
epor
ted at
star
t an
d/or e
nd of
ther
apy (
includ
ing pl
aceb
o, if
appli
cable
). St
udies
in ch
ildre
n and
cirrh
otic
patie
nts al
so in
clude
d. Ex
clusio
n crite
ria:
Post-
liver
tran
splan
tation
stud
ies; H
IV an
d/or
hepa
titis C
co-in
fectio
n. (2
6 stud
ies m
et fin
al se
lectio
n crite
ria)
Data
abstr
actio
n by t
wo se
para
te (b
linde
d) re
viewe
rs Vi
ral lo
ads r
epor
ted as
pg/m
L wer
e co
nver
ted to
copie
s/mL
Some
stud
y cha
racte
ristic
s su
mmar
ised.
Resu
lts no
t sum
maris
ed
for in
dividu
al stu
dies
An as
sess
ment
of stu
dy qu
ality
was n
ot un
derta
ken
Sour
ces o
f hete
roge
neity
wer
e exp
lored
by
subg
roup
analy
sis
Resu
lts pr
esen
ted as
corre
lation
co-
effici
ents:
expo
nenti
al an
d line
ar
regr
essio
ns co
mpar
ed to
deter
mine
be
st da
ta fit;
stati
stica
l sign
ifican
ce
explo
red b
y p va
lue ca
lculat
ion
Mediu
m qu
ality:
He
terog
eneit
y exp
lored
by
subg
roup
analy
ses
No qu
ality
asse
ssme
nt re
porte
d for
inclu
ded s
tudies
Me
dium
valid
ity:
Subg
roup
analy
sis no
t pe
rform
ed fo
r PCR
HBV
DNA
as
says
Abbr
eviat
ions:
ALT,
Alan
ine am
inotra
nsfer
ase;
HBV
DNA,
hepa
titis B
viru
s deo
xyrib
onuc
leic a
cid
a Sys
temati
c rev
iew ap
prais
ed by
apply
ing th
e qua
lity cr
iteria
desc
ribed
in A
ppen
dix D
b C
onve
rsion
: 1 pg
/mL =
3 x 1
05 cop
ies/m
L+
Hepatitis B virus DNA testing 73

Tabl
e 29
Sum
mar
y of r
esul
ts o
f a sy
stem
atic
revie
w ev
aluat
ing
the r
elatio
nshi
p be
twee
n se
rum
HBV
DNA
leve
ls an
d cli
nica
l out
com
es
Coef
ficien
t of c
orre
latio
n an
d st
atist
ical s
igni
fican
ce b
etwe
en H
BV D
NA an
d en
d po
ints
by s
ubgr
oups
HB
V DN
A ve
rsus
end
poin
ts
Over
all
HBeA
g po
sitive
HB
eAg
nega
tive
Cirrh
osis
Nucle
osid
e an
alogu
e tre
ated
Inte
rfero
n tre
ated
Li
quid
hy
brid
isatio
n as
say L
OD
corre
cted
HA
I sco
re at
base
line
0.78
(p =
0.00
01)
0.61
(p =
0.05
) 0.9
5 (p
= 0.
0004
) ND
NA
NA
0.6
5 (p
= 0.
002)
HA
I sco
re at
end o
f trea
tmen
t 0.7
1 (p
= 0.
003)
0.7
1 (p
= 0.
01)
0.66
(p =
0.3)
ND
0.7
6 (p
= 0.
006)
0.6
5 (p
= 0.
08)
0.67
(p =
0.01
) Pr
opor
tion o
f pati
ents
with
norm
al AL
T lev
els
0.62
(p =
0.00
4)
0.66
(p =
0.00
8)
0.71
(p<0
.05)
0.8
(p =
0.00
3)
0.82
(p =
0.00
1)
0.55
(p =
0.02
) 0.6
1 (p
= 0.
005)
Abso
lute
level
Incide
nce o
f HBe
Ag se
roco
nver
sion
0.72
(p =
0.00
2)
NA
NA
ND
0.92
(p =
0.00
1)
ND
0.55
(p =
0.3)
HA
I sco
re, m
edian
chan
ge fr
om ba
selin
e 0.9
6 (p
= 10
–6)
0.98
(p =
6 x 1
0–6)
ND
ND
0.96
(p =
0.00
03)
ND
NA
Prop
ortio
n of p
atien
ts wi
th no
rmal
ALT
levels
0.5
(p
= 0.
06)
ND
ND
ND
0.76
(p =
0.00
3)
ND
NA
Chan
ge in
me
dian
from
base
line
Incide
nce o
f HBe
Ag se
roco
nver
sion
0.72
(p =
0.00
02)
NA
NA
0.87
(p =
0.00
005)
0.7
(p
= 0.
05)
ND
NA
Abbr
eviat
ions:
ALT,
alan
ine am
inotra
nsfer
ase;
HBeA
g, he
patiti
s e an
tigen
; HBV
DNA
, hep
atitis
B de
oxyri
bonu
cleic
acid;
LOD,
lowe
r limi
t of d
etecti
on; N
A, no
t app
licab
le; N
D, no
t don
e
74 Hepatitis B virus DNA testing

Hepatitis B virus DNA testing 75
Primary studies
Two studies were identified which assessed the relationship between HBV DNA levels and long term clinical outcomes (Chen et al 2006; Iloeje et al 2005). These studies reported different outcomes from the REVEAL-HBV study (Risk Evaluation of Viral Load and Associated Liver Disease/Cancer-in Hepatitis B Virus)—a Taiwanese population-based, long term prospective study. This population represents a natural history cohort, as participants did not undergo HBV antiviral treatment. These treatments were not reimbursed under the universal national health insurance scheme in Taiwan until 2003. The characteristics of the REVEAL-HBV study are presented in Table 30.
Four further studies were identified which assessed the relation between serum HBV DNA levels and the development of HBV-associated hepatocellular carcinoma (Harris et al 2003; Ishikawa et al 2001; Mahmood et al 2005 and Okhubo et al 2001). The characteristics of these studies are presented in Table 30.
Two further studies were identified which assessed the value of HBV DNA testing as a prognostic factor for recurrence after resection for HBV-associated hepatocellular carcinoma (Kubo et al 2000; Kubo et al 2003). The characteristics of these studies are presented in Table 30.
In study by Yuen et al (2004) the relationship between serum HBV DNA levels and liver histology was investigated. The characteristics of this study are presented in Table 30.
REVEAL-HBV study The studies by Chen et al (2006) and Iloeje et al (2006) reported the risk of hepatocellular carcinoma and cirrhosis in relation to serum HBV DNA levels respectively. The characteristics of the REVEAL-HBV study are shown in Table 30. Multivariate-adjusted logistic regression analyses were used to account for other variables which are also potential prognostic factors for hepatocellular carcinoma and cirrhosis. Results from the REVEAL-HBV study are shown in Table 31.
Chen et al (2006) found that increasing baseline serum HBV DNA level is associated with increased cumulative incidence of hepatocellular carcinoma (see Table 31). Patients with undetectable serum HBV DNA (<300 copies/mL) had a cumulative incidence of hepatocellular carcinoma of 1.3 per cent. In contrast patients with serum HBV DNA of ≥1.0×10⁶ had a cumulative incidence of 14.9 per cent. Most participants (80%) in this study were HBeAg negative with normal ALT levels and no liver cirrhosis: these participants had a cumulative incidence of hepatocellular carcinoma of 13.5 per cent and 0.7 per cent when baseline HBV DNA levels were ≥1.0×10⁶ and <300 copies/mL respectively.
Similarly, Iloeje et al (2005) reported that increasing baseline serum HBV DNA level is associated with increased cumulative incidence of cirrhosis (see Table 31). Patients with undetectable serum HBV DNA (<300 copies/mL) had a cumulative incidence of cirrhosis of 4.5 per cent. In contrast, patients with serum HBV DNA of ≥1.0×10⁶ had a cumulative incidence of 36.2 per cent.

Tabl
e 30
Char
acte
ristic
s of s
tudi
es u
sed
to ev
aluat
e the
relat
ion
betw
een
seru
m H
BV D
NA le
vels
and
clini
cal o
utco
mes
Stud
y St
udy
desig
n Pa
tient
s (N)
HB
V DN
A te
st
Char
acte
ristic
s Ot
her t
est(s
) cha
ract
erist
ics
Stud
y qua
lity/c
omm
ent
REVE
AL-H
BV
study
grou
p Re
sults
re
porte
d by
Chen
et al
(2
006)
&
Iloeje
et al
(2
006)
Ta
iwan
Pros
pecti
ve
coho
rt (p
opula
tion-
base
d)
Non-
cons
ecuti
ve
(recru
ited
1991
–199
2)
89,29
3 res
idents
(30–
65 ye
ars)
in 7 t
owns
hips
invite
d to p
artic
ipate:
23,82
0 enr
olled
—41
55
were
HBs
Ag +
ve: o
f thes
e 385
1 had
seru
m sa
mples
froz
en at
enro
lmen
t teste
d for
DNA
19
8 exc
luded
(195
anti-H
CV se
ropo
sitive
, 3
lacke
d ade
quate
samp
le for
anti-H
CV te
st)
Chen
et al
(200
6): f
inal c
ohor
t n =
3653
a Ilo
eje et
al (2
006)
: a fu
rther
71 ex
clude
d fro
m an
alysis
(2 de
aths w
ithin
6 mo o
f coh
ort e
ntry
– non
-hep
atic c
ause
s - 69
diag
nose
d with
cir
rhos
is wi
thin 6
mo o
f enr
olmen
t):
final
coho
rt n =
3582
PCR
(COB
AS A
mplic
or; R
oche
) Lo
wer li
mit o
f dete
ction
of 30
0 co
pies/m
L (te
sted a
t bas
eline
and e
very
6–12
mo
nths d
uring
follo
w-up
ex
amina
tion)
HBsA
G, H
BeAg
by
radio
immu
noas
say,(
Abbo
t);
anti-H
epC
by ra
dioim
muno
assa
y (A
bbott
);
ALT
by se
rum
chem
istry
auto-
analy
ser (
mode
l 736
; Hita
chi)
(teste
d at b
aseli
ne an
d eve
ry 6–
12
month
s dur
ing fo
llow-
up
exam
inatio
n)
Pros
pecti
ve
Poten
tial fo
r sele
ction
bias
: Ma
jority
of in
vited
indiv
iduals
did
not p
artic
ipate
Non-
cons
ecuti
ve en
rolm
ent
Popu
lation
cons
idere
d app
licab
le to
Austr
alian
clini
cal p
racti
ce
Harri
s et a
l (2
003)
Ch
ina
Pros
pecti
ve
coho
rt No
n-co
nsec
utive
(1
992–
2000
)
HbsA
g +ve
, HBV
DNA
+ve
(dot
blot
hybr
idisa
tion)
, with
3 or
mor
e ser
um sa
mples
av
ailab
le for
analy
sis , h
epato
cellu
lar
carci
noma
-free
at st
udy e
ntry
(n =
114)
(su
bjects
selec
ted fr
om α
-fetop
rotei
n int
erve
ntion
arm
of an
early
detec
tion
scre
ening
stud
y)
Dot b
lot hy
bridi
satio
n, qu
antifi
ed by
bio
-imag
ing an
alyse
r sys
tem (F
uji
medic
al sy
stems
) Se
nsitiv
ity lim
it = 3
x 105 v
irions
/mL
AFP
by en
zyme
immu
noas
say
Othe
r tes
ts NR
Pros
pecti
ve
Poten
tial fo
r sele
ction
bias
: non
-co
nsec
utive
patie
nt se
lectio
n Po
tentia
l for s
pectr
um bi
as:
patie
nts se
lected
from
scre
ening
stu
dy
Trea
tmen
t not
appli
cable
to
Austr
alian
clini
cal p
racti
ce
HBV
DNA
test o
utdate
d Ish
ikawa
et al
(2
001)
Ja
pan
Coho
rt Di
recti
on
uncle
ar
Non-
cons
ecuti
ve
(Tim
e per
iod
uncle
ar)
HbsA
g +ve
cirrh
otic p
atien
ts, ex
clude
d pati
ents
with
non-
viral
cirrh
osis
(n =
65)
TMA
and h
ybrid
isatio
n pro
tectio
n as
say
(Deta
ils N
R)
Seru
m sa
mples
take
n at ti
me of
firs
t diag
nosis
of ci
rrhos
is
HbsA
g by e
nzym
e imm
unoa
ssay
(D
ainab
ot)
HbeA
g, an
ti-HBe
Ag, b
y enz
yme
immu
noas
say;
anti-H
Bc by
re
verse
cell A
b kit (
Yama
nouc
hi)
Seru
m sa
mples
take
n at ti
me of
firs
t diag
nosis
of ci
rrhos
is
Dire
ction
uncle
ar
Poten
tial fo
r sele
ction
bias
: non
-co
nsec
utive
patie
nt se
lectio
n Re
duce
d app
licab
ility t
o Aus
tralia
n cli
nical
prac
tice:
less s
ensit
ive
HBVD
NA te
st
76 Hepatitis B virus DNA testing

Stud
y St
udy
desig
n Pa
tient
s (N)
HB
V DN
A te
st
Char
acte
ristic
s Ot
her t
est(s
) cha
ract
erist
ics
Stud
y qua
lity/c
omm
ent
Kubo
et al
(2
000)
Ja
pan
Dire
ction
un
clear
No
n-co
nsec
utive
(1
990–
1998
)
HBV
DNA
posit
ive pa
tients
, neg
ative
for a
nti-
HCV,
who
had c
urati
veb l
iver r
esec
tion f
or
hepa
tocell
ular c
arcin
oma.
(n =
40)
Bran
ched
DNA
assa
y (Ch
iron
Ample
x) (S
erum
samp
les fo
r tes
t obta
ined
befor
e sur
gery)
Anti-H
CV by
ELIS
A; se
rum
HCV
RNA
by P
CR, H
BeAg
, anti
-HBe
Ag,
HBsA
g,and
anti-H
BsAg
by en
zyme
im
muno
assa
y (Int
erna
tiona
l Re
agen
ts Co
rp)
(Ser
um sa
mples
for t
est o
btaine
d be
fore s
urge
ry)
Poten
tial s
electi
on bi
as: d
irecti
on
uncle
ar, n
on-co
nsec
utive
en
rolm
ent
Appli
cabil
ity to
Aus
tralia
n clin
ical
prac
tice p
otenti
ally l
imite
d: les
s se
nsitiv
e HBV
DNA
test
Kubo
et al
(2
003)
Ja
pan
Dire
ction
un
clear
No
n-co
nsec
utive
(1
989–
2001
)
HBV
DNA
posit
ive pa
tients
, neg
ative
for a
nti-
HCV,
who
had c
urati
veb l
iver r
esec
tion f
or
hepa
tocell
ular c
arcin
oma.
(n =
52)
TMA-
HPA
(Chu
gai d
iagno
stics
): se
nsitiv
ity ra
nge =
3.7 –
8.7
LGE/
mLc
Bran
ched
DNA
assa
y (Qu
antip
lex);
detec
tion l
imit 0
.7 mE
q/mL
(7 x
105 c
opies
/mL)
(S
erum
samp
les fo
r tes
t obta
ined
befor
e sur
gery)
Anti-H
CV by
ELIS
A ; H
BeAg
, HB
sAg b
y enz
yme i
mmun
oass
ay
(Inter
natio
nal R
eage
nts C
orp)
(S
erum
samp
les fo
r tes
t obta
ined
befor
e sur
gery)
Poten
tial s
electi
on bi
as: d
irecti
on
uncle
ar, n
on-co
nsec
utive
en
rolm
ent
Appli
cabil
ity to
Aus
tralia
n clin
ical
prac
tice p
otenti
ally l
imite
d: les
s se
nsitiv
e HBV
DNA
test
Mahm
ood e
t al
(200
5)
Japa
n
Dire
ction
un
clear
En
rolm
ent
NR
(Cirr
hosis
dia
gnos
is pe
riod 1
996–
2003
)
Patie
nts di
agno
sed w
ith H
BV re
lated
cirrh
osis
by liv
er bi
opsy
and/o
r per
itone
osco
py. H
bsAg
po
sitive
, anti
-hep
C ne
gativ
e at s
tudy
comm
ence
ment.
Cirr
hotic
patie
nts w
ith
poss
ible h
epato
cellu
lar ca
rcino
ma as
socia
tion
at the
time o
f hep
atoce
llular
carci
noma
dia
gnos
is we
re ex
clude
d fro
m (n
= 91
; 23 p
atien
ts we
re tr
eated
using
int
erfer
ond )
Ampli
cor M
onito
r (Ro
che)
HB
sAg,
anti-H
BsAg
by
chem
ilumi
nesc
ent e
nzym
e im
muno
assa
y (Fu
ji); H
BeAg
, anti
-HB
eAg b
y enz
yme-
linke
d im
muno
sorb
ent a
ssay
(Abb
ot)
ALT
(test
detai
ls NR
)
Poten
tial s
electi
on bi
as: d
irecti
on
uncle
ar an
d enr
olmen
t NR.
HB
V DN
A tes
t app
licab
le to
Austr
alian
clini
cal p
racti
ce
Okhu
bo et
al
(200
2)
Japa
n
Dire
ction
un
clear
En
rolm
ent
NR
(recru
ited
1983
–199
8)
Patie
nts (7
4) w
ith H
BV-a
ssoc
iated
he
patoc
ellula
r car
cinom
a, HB
sAg +
ve an
d an
ti-HCV
–ve (
selec
ted fr
om 40
4 pati
ents
identi
fied w
ith he
patoc
ellula
r car
cinom
a his
topath
ologic
ally o
r clin
ically
) Ex
clude
d: HB
sAg –
ve, a
ntiHC
V +v
e pati
ents
Ob
serva
tion b
egan
at tim
e of h
epato
cellu
lar
carci
noma
diag
nosis
and e
nded
at de
ath or
en
d of O
ct 19
99
Tran
scrip
tion-
media
ted
ampli
ficati
on m
ethod
, deta
ils N
R De
tectio
n lim
ite = 3.
7 LGE
/mL
(Ser
um sa
mple
taken
at tim
e of
hepa
tocell
ular c
arcin
oma
diagn
osis)
HBsA
g, HB
eAg,
and a
nti-H
beAg
as
saye
d by c
omme
rciall
y ava
ilable
ra
dio-im
muno
assa
y kits
(Dain
abot)
; An
ti-HCV
, enz
yme-
linke
d im
muno
abso
rben
t ass
ay
(Orth
o Diag
nosti
cs)
ALT
assa
y meth
ods N
R (S
erum
samp
le tak
en at
time o
f he
patoc
ellula
r car
cinom
a dia
gnos
is)
Poten
tial fo
r sele
ction
bias
: dir
ectio
n unc
lear
Did n
ot inv
estig
ate w
hethe
r he
patoc
ellula
r car
cinom
a tre
atmen
t im
pacte
d on s
urviv
al
Limite
d App
licab
ility:
HBV
DNA
test n
ot ap
plica
ble to
Au
strali
an cl
inica
l pra
ctice
Hepatitis B virus DNA testing 77

Stud
y St
udy
desig
n Pa
tient
s (N)
HB
V DN
A te
st
Char
acte
ristic
s Ot
her t
est(s
) cha
ract
erist
ics
Stud
y qua
lity/c
omm
ent
Yuen
et al
(2
004)
Ch
ina
Dire
ction
un
clear
co
hort
(200
1–20
03)
Chro
nic he
patiti
s B pa
tients
unde
rgoin
g live
r bio
psy;
no an
tivira
l ther
apy;
HbsA
g +ve
≥6
month
s ; ex
clude
d pati
ents
with
conc
omita
nt liv
er di
seas
es in
cludin
g hep
atitis
C or
D,
alcoh
olic l
iver d
iseas
e, au
toimm
une h
epati
tis,
Wils
on’s
disea
se, p
rimar
y bilia
ry cir
rhos
is an
d dr
ug in
duce
d hep
atitis
. (n
= 94
)
Coba
s Amp
licor
, HBV
Mon
itor t
est
(Roc
he)
Lowe
r limi
t of d
etecti
on =
200
copie
s/mL
(HBV
DNA
teste
d in s
erum
sa
mples
take
n 2 w
eeks
befor
e live
r bio
psy)
HBsA
g, HB
eAg,
anti-
HBeA
g by
micro
partic
le en
zyme
im
muno
assa
y (Ab
bot)
ALT
test d
etails
NR
Liver
histo
logy g
rade
d by c
riteria
of
Knod
ell et
al (1
981)
. Hist
ology
as
sess
ed bl
ind to
liver
bioc
hemi
stry
and H
BV D
NA te
st re
sults
Dire
ction
uncle
ar
Poten
tial s
electi
on bi
as –
only
includ
ed pa
tients
with
liver
biop
sies
Blind
ing be
twee
n live
r hist
ology
an
d tes
t res
ults
Patie
nt po
pulat
ion co
nside
red
appli
cable
Ab
brev
iation
s: AF
P, α
-fetop
rotei
n tes
ts; A
LT, a
lanine
amino
trans
feras
e; EL
ISA,
enzy
me lin
ked i
mmun
oass
ay; F
, fema
le; H
BeAg
, hep
atitis
B e-
antig
en; H
BsAg
, hep
atitis
B su
rface
antig
en; H
BV D
NA, h
epati
tis B
viru
s de
oxyri
bonu
cleic
acid;
HCV
, hep
atitis
C vi
rus;
HDV,
hepa
titis D
viru
s; LG
E, lo
garith
m of
geno
me eq
uivale
nt; M
, male
; NR,
not r
epor
ted; P
CR, p
olyme
rase
chain
reac
tion;
REVE
AL-H
BV, T
he R
isk E
valua
tion o
f Vira
l Loa
d and
As
socia
ted Li
ver D
iseas
e/Can
cer-i
n Hep
atitis
B V
irus;
RNA,
ribon
uclei
c acid
; TMA
, tran
scrip
tion m
ediat
ed as
say
a Che
n et a
l (200
6) ex
amine
d the
impa
ct of
chan
ging H
BV D
NA le
vel o
n hep
atoce
llular
carci
noma
risk i
n a su
bset
of the
se pa
rticipa
nts (n
= 16
19) w
ho ha
d ser
um H
BV D
NA le
vel o
f ≥10
000 c
opies
/mL a
t stud
y entr
y. Fo
llow-
up
seru
m sa
mples
we
re ta
ken a
t the l
ast fo
llow-
up ex
amina
tion o
r at th
e foll
ow-u
p exa
mina
tion p
rece
ding t
he di
agno
sis of
hepa
tocell
ular c
arcin
oma
b Cur
ative
rese
ction
defin
ed as
comp
lete r
esec
tion o
f all m
acro
scop
ically
evide
nt tum
our.
Abse
nce o
f tumo
ur ce
lls al
ong t
he pa
renc
hyma
l tran
secti
on lin
e con
firmed
histo
logica
lly
c Kub
o et a
l (200
3) re
porte
d tha
t this
rang
e is e
quiva
lent to
5 x 1
03 to 5
x 10
8 cop
ies/m
Lof s
erum
HBV
DNA
d P
atien
ts we
re tr
eated
with
eithe
r inter
feron
-α or
inter
feron
-β at
6 MU
/day f
or 4
week
s: pr
opor
tions
unde
rgoin
g inte
rfero
n-α o
r inter
feron
- β th
erap
y not
repo
rted
e Okh
ubo e
t al (2
002)
repo
rted t
hat th
e dete
ction
limit o
f the b
ranc
hed D
NA as
say (
0.7 m
illieq
uivale
nt pe
r mL)
corre
spon
ds to
5.8 L
GE/m
L by t
he T
MA m
ethod
78 Hepatitis B virus DNA testing

Tabl
e 31
Relat
ions
hip
betw
een
seru
m H
BV D
NA le
vels
and
long
term
clin
ical o
utco
mes
: res
ults
from
the R
EVEA
L-HB
V st
udy g
roup
Stud
y Pa
tient
char
acte
ristic
s Lo
ng te
rm o
utco
mes
St
udy q
ualit
y/com
men
t Ch
en et
al
(200
6)
REVE
AL-H
BV
study
grou
p Ta
iwan
n = 36
53
Aver
age f
ollow
-up =
11.4
year
sMa
les =
62%
Ag
e >39
year
s = 67
%
Neve
r dra
nk al
coho
l = 87
%
HbeA
g +ve
= 15
%;
ALT ≥4
5 IU
= 6%
No
liver
cirrh
osis
= 98
%
Cum
ulat
ive h
epat
ocell
ular
ca
rcin
oma i
ncid
ence
stra
tified
by
base
line H
BV D
NA L
evel
(cop
ies/m
L)
Unde
tectab
le (<
300)
= 1.
30%
30
0–9.9
x 10
3 = 1.
37%
1.0
– 9.9
x 104 =
3.57
%
1.0–9
.9 x 1
05 = 12
.17%
≥
1.0 x
106 =
14.89
%
Haza
rd ra
tiob o
f hep
atoc
ellul
ar ca
rcin
oma (
95%
CI)
stra
tified
by
bas
eline
HBV
DNA
leve
l (co
pies
/mL)
Un
detec
table
(<30
0) =
1.0 (
refer
ence
) 30
0–9.9
x 10
3 = 1.
1 (0.5
–2.3,
p =
0.86)
1.0
– 9.9
x 10
4 = 2.
3(1.1
–4.9,
p =
0.02)
1.0
–9.9
x 105 =
6.6 (
3.3–1
3.1, p
<0.0
01)
≥1.0
x 10
6 = 6.
1 (2.9
–12.7
, p <
0.001
) Ha
zard
ratio
b of h
epat
ocell
ular
carc
inom
a (95
% C
I) by
oth
er
varia
bles
Hb
eAg –
ve =
1.0 (
refer
ence
) Hb
eAg +
ve =
2.6 (
1.6–4
.2, p<
0.001
) AL
T (IU
) <45
= 1.
0 (re
feren
ce)
ALT ≥4
5 = 1.
5 (1.1
–2.1,
p =
0.64)
Liv
er ci
rrhos
isc = 9.
1 (5.9
–13.9
, p<0
.001)
Ilo
eje et
al
(200
6)
REVE
AL-H
BV
study
grou
p Ta
iwan
n = 35
82
Media
n foll
ow-u
p = 11
year
s (ra
nge N
R)
Media
n age
= 45
Ma
les =
61.3%
; Al
coho
l drin
kers
= 12
%;
HbeA
g +ve
= 15
.2%;
Media
n HBV
DNA
= 10
3 co
pies/m
L (ra
nge N
R)
ALT ≥4
5 IU
= 5.7
%
death
s dur
ing fo
llow-
up 8.
7%
Cum
ulat
ive ci
rrhos
isa inc
iden
ce
stra
tified
by b
aseli
ne H
BV D
NA
Leve
l (co
pies
/mL)
Un
detec
table
(<30
0) =
4.5%
30
0–9.9
x 10
3 = 5.
9%
1.0–9
.9 x 1
04 = 9.
8%
1.0–9
.9 x 1
05 = 23
.5%
≥1.0
x 106 =
36.2%
Relat
ive ri
skb o
f cirr
hosis
(95%
CI)
stra
tified
by b
aseli
ne H
BV
DNA
level
(cop
ies/m
L)
Unde
tectab
le (<
300)
= 1.
0 (re
feren
ce)
300–
9.9 x
103 =
1.4 (
0.9–2
.2, p
value
NR)
1.0
– 9.9
x 10
4 = 2.
5 (1.6
–3.8,
p <
0.01)
1.0
–9.9
x 105 =
5.6 (
3.7–8
.5, p
< 0.0
1)
≥ 1.
0 x 10
6 = 6.
5 (4.1
–10.2
, p <
0.01
) Re
lative
risk
b of c
irrho
sis (9
5% C
I) by
oth
er va
riabl
es
HbeA
g –ve
= 1.
0 (re
feren
ce)
HbeA
g +ve
= 1.
7 (1.2
–2.3,
p <
0.01
) AL
T (IU
) <45
= 1.
0 (re
feren
ce)
ALT ≥4
5 = 1.
5 (1.1
–2.1,
p <
0.05)
Pros
pecti
ve
Poten
tial fo
r sele
ction
bias
: Ma
jority
of in
vited
indiv
iduals
did
not p
artic
ipate.
No
n-co
nsec
utive
enro
lmen
t Po
pulat
ion co
nside
red a
pplic
able
to Au
strali
an cl
inica
l pra
ctice
.
Abbr
eviat
ions:
ALT,
alan
ine am
inotra
nsfer
ase;
HBeA
g, he
patiti
s B e-
antig
en; H
BV D
NA, h
epati
tis B
viru
s deo
xyrib
onuc
leic a
cid;. I
U, in
terna
tiona
l unit
s; NR
, not
repo
rted;
PCR,
polym
eras
e cha
in re
actio
n;
REVE
AL-H
BV, R
isk E
valua
tion o
f Vira
l Loa
d and
Ass
ociat
ed Li
ver D
iseas
e/Can
cer-i
n Hep
atitis
B V
irus
a Cirr
hosis
diag
nose
d by h
igh re
solut
ion re
al tim
e ultra
soun
d, wi
th a q
uanti
tative
scor
ing sy
stem
from
liver
surfa
ce ap
pear
ance
, live
r par
ench
ymal
textur
e, int
rahe
patic
bloo
d ves
sel s
ize, s
plenic
size
. All p
atien
ts ha
d bas
eline
sc
reen
ing ul
traso
und;
ultra
soun
ds al
so pe
rform
ed ev
ery 6
–12 m
onths
at fo
llow-
up. U
ltraso
und b
linde
d to H
BV D
NA te
sting
b M
ultiva
riate-
adjus
ted ha
zard
ratio
and r
elativ
e risk
deter
mine
d by C
ox pr
opor
tiona
l haz
ard r
egre
ssion
analy
sis
c Diag
nose
d with
ultra
sono
grap
hy w
ithin
6 mon
ths of
stud
y entr
y
Hepatitis B virus DNA testing 79

80 Hepatitis B virus DNA testing
Chen et al (2006) reported that increasing serum HBV DNA levels were strongly associated with an increased (multivariate-adjusted) hazard ratio of developing hepatocellular carcinoma (see Table 31). After adjusting for other hepatocellular carcinoma risk factors (age, sex, smoking, alcohol consumption) participants with serum HBV DNA of ≥1.0×10⁶ copies/mL and 300–9.9×10³ copies/mL had hazard ratios of developing hepatocellular carcinoma of 6.1 (95% CI: [2.9, 12.7]; p<0.01) and 1.1 (95% CI: [0.5, 2.3]; p = 0.86) respectively. The adjusted hazard ratio for developing hepatocellular carcinoma for HBeAg positive participants was 2.6 (95% CI: [1.6, 4.2]; p<0.001) and for participants with serum ALT ≥45 IU/mL was 1.1 (95% CI: [0.7, 1.7]; p = 0.64).
Chen et al (2006) also reported an adjusted hazard ratio of developing hepatocellular carcinoma for participants with liver cirrhosis of 9.1 (95% CI: [5.9, 13.9]; p<0.001). This indicates that liver cirrhosis at study entry was a significant risk factor for developing hepatocellular carcinoma. However, when participants with no liver cirrhosis, who were HBeAg negative, with normal serum ALT were compared with participants with serum HBV DNA levels of <300 copies/mL the adjusted hazard ratios for serum HBV DNA levels of 300–9.9×10³ copies/mL was 1.4 (95% CI: [0.5, 3.8]; p = 0.56); 1.0–9.9×10⁴ copies/mL was 4.5 (95% CI: [1.8, 11.4]; p = 0.001); for 1.0–9.9×10⁵ copies/mL was 11.3 (95% CI; [4.5, 28.4]; p<0.001) and for ≥1.0×10⁶ copies/mL was 17.7 (95% CI: [6.8, 46.3]; p<0.001). These data show that in the absence of liver cirrhosis, participants with serum levels of HBV DNA >105copies/mL had an increased risk of developing hepatocellular carcinoma.
Similarly, Iloeje et al (2006) found that the relative risk of cirrhosis (multivariate-adjusted) was also strongly associated with increasing serum HBV DNA levels (see Table 31). After adjusting for age, sex, smoking, alcohol consumption, HBeAg status and ALT level, participants with serum HBV DNA of ≥1.0×10⁶ had a relative risk of cirrhosis of 6.5 (95% CI: [4.1, 10.2]; p<0.001). For comparison multivariate-adjusted relative risks of cirrhosis for participants who were HbeAg positive or had serum ALT ≥45 IU/mLwere 1.7 (95% CI: [1.2, 2.3]; p<0.01) and 1.5 (95% CI: [1.1, 2.1]; p<0.05) respectively. These data suggest that baseline serum HBV DNA levels are a stronger predictor of cirrhosis than either HBeAg status or ALT level.
Chen et al (2006) also examined the impact of changing HBV DNA level on hepatocellular carcinoma risk in a subset of study participants (n = 1619) who had serum HBV DNA level of ≥10 000 copies/mL at study entry. Follow-up serum samples were taken at the last follow-up examination or at the follow-up examination preceding the diagnosis of hepatocellular carcinoma. The results of this analysis are presented in Table 32.
Of the participants who had serum HBV DNA levels of 10 000 to 99 999 copies/mL at study entry, those with serum HBV DNA levels of ≥100 000 at follow-up, had a statistically significant increase in hepatocellular carcinoma risk (multivariate-adjusted HR = 3.5; 95% CI: [1.4, 9.2]; p = 0.01) (Table 32). Of the participants who had serum HBV DNA levels of ≥100 000 copies/mL at study entry, there was a statistically significant increase in hepatocellular carcinoma risk with follow-up HBV DNA levels (p < 0.01). This trend was not changed after additional adjustment for study entry HBeAg seropositivity, serum ALT level and presence of liver cirrhosis (Table 32). These results suggest persistently elevated serum HBV DNA levels lead to an increased risk of hepatocellular carcinoma.

Hepatitis B virus DNA testing 81
The REVEAL-HBV study results reported by Chen et al (2006) and Iloeje et al (2006) provide evidence that serum HBV DNA levels are predictive of long term outcomes—increasing serum HBV DNA levels were associated with increased risk of cirrhosis and hepatocellular carcinoma. Chen et al (2006) also provide evidence that hepatocellular carcinoma risk increases with persistent elevation of HBV DNA. Although the REVEAL-HBV study does not provide evidence that serum HBV DNA testing itself impacts on long term outcomes, there is evidence that serum HBV DNA levels are a better predictor of long term outcomes than HBeAg seropositivity or serum ALT. Comparison with serum ALT levels is limited in the use of a single cut point for analysis of risks. To facilitate comparison with serum HBV DNA levels, reporting relative risks and hazard ratios for different ranges of ALT levels, rather than a single cut point, would have been more informative.
Chronic hepatitis B is a dynamic disorder with periods of intense viral replication interspersed with periods of relative quiescence. The REVEAL-HBV study is somewhat limited in that serum HBV DNA and other markers were not measured at regular time points throughout follow-up—although serum samples were obtained every six to 12 months during the study. Although Chen et al (2006) reported follow-up HBV DNA levels for a subset of participants, a more thorough analysis of HBV DNA levels throughout the entire follow-up period would have provided more information regarding the duration and extent of viral replication and its relation to hepatocellular carcinoma and cirrhosis risk.
The REVEAL-HBV DNA study was a population-based, long term prospective study, with follow-up considered long enough for outcomes to occur. There is potential for selection bias in this study as 73 per cent of individuals invited to take part chose not to participate. Recruitment was non-consecutive and included participants who may not reflect the true spectrum of chronic hepatitis B in the wider population. Only patients who had serum samples for HBV DNA analysis frozen at enrolment were included. This is likely to have resulted in minimal selection bias because 93 per cent of all HBsAg positive patients had serum samples for HBV analysis. Although this study was carried out in Taiwan, the patient population is considered applicable to Australian clinical practice: in a recent prospective cohort study of Australian chronic hepatitis B patients, 65 per cent had Asian ethnicity (Bell et al 2005). The HBV DNA test used in this study is applicable to Australian clinical practice.
The REVEAL-HBV included population represents a natural history cohort. Participants did not undergo HBV antiviral treatment because there was no reimbursement in Taiwan during the study period. This may reduce the applicability of the results to current clinical practice in Australia because suitable antiviral therapy would be available when clinically indicated.

82 Hepatitis B virus DNA testing
Table 32 Risk of hepatocellular carcinoma by serum HBV DNA levels at study entry and last follow-up
Level of serum HBV DNA (copies/mL)
Hazard ratio (95% CI) adjusted for: Study
At study entry At follow-upa Sex, age, cigarette smoking and alcohol consumption
HBeAg positive, liver cirrhosis, ALT level
Study quality/ comment
<10 000 Not tested 1.0 1.0
10 000 to 99 999 <10 000 1.6 (0.7–3.9) 1.3 (0.5–3.1)
10 000 to 99 999 10 000 to 99 999 0.5 (0.1–3.6) 0.4 (0.1–3.2)
10 000 to 99 999 ≥100 000 3.5 (1.4–9.2) 2.9 (1.0–9.8)
≥100 000 <10 000 3.8 (1.7–8.4) 1.9 (0.8–4.4)
≥100 000 10 000 to 99 999 7.3 (3.5–15.3) 4.3 (2.0–9.3)
Chen et al (2006) REVEAL-HBV study group Taiwan
≥100 000 ≥100 000 10.0 (6.3–16.2) 5.3 (2.9–9.7)
Prospective Potential for selection bias: Majority of invited individuals did not participate Non-consecutive enrolment Population considered applicable to Australian clinical practice
Abbreviations: ALT, alanine aminotransferase; CI, confidence intervals; HBeAg, hepatitis B e-antigen; HBV DNA, hepatitis B virus deoxyribonucleic acid; REVEAL-HBV, Risk Evaluation of Viral Load and Associated Liver Disease/Cancer-in Hepatitis B Virus a Median time between study entry and follow-up serum samples was about 10 years
Factors associated with the prognosis of HBV-associated hepatocellular carcinoma Harris et al (2003) and Okhubo et al (2002) examined the relationship between serum HBV DNA levels and hepatocellular carcinoma development. Ishikawa et al (2001) and Mahmoud et al (2005) investigated hepatocellular carcinoma occurrence in HBV-related cirrhotic patients and serum HBV DNA levels. Kubo et al (2000) and Kubo et al (2003) investigated the relationship between serum HBV DNA levels and recurrence after resection of HBV-related hepatocellular carcinoma.
Harris et al (2003) examined the relationship between serum HBV DNA levels and hepatocellular carcinoma in a prospective study of a non-consecutive group of patients (n = 114) selected from the α-fetoprotein intervention arm of an early detection screening. In this study the relationship between the clearance of high titre viremia and subsequent risk of hepatocellular carcinoma was investigated.
Serum samples for HBV DNA analysis were collected between 1992 and 1997. Hepatocellular carcinoma mortality was followed until 2000. During follow-up 54 patients (47.4%) spontaneously converted to HBV DNA negative (defined as one or more subsequent samples HBV DNA negative by dot blot hybridisation). Of these patients 27 (50%) were HBV DNA negative for at least two consecutive observations six months apart, without relapse—these patients were considered to have undergone stable high-titre HBV DNA conversion. The remainder of the patients who spontaneously seroconverted reverted to HBV DNA positive.
Using Cox proportional hazards model the relative risk of hepatocellular carcinoma death (controlled for age and sex) for stable HBV DNA seroconversion was 2.2 (95% CI: [0.9, 5.3]) and for unstable HBV DNA seroconversion was 1.6 (95% CI: [1.1, 7.4]).

Hepatitis B virus DNA testing 83
It was unclear from this study whether this relative risk was determined compared withrisk of hepatocellular carcinoma death of patients who did not seroconvert; but, it is likely that this was the analysis undertaken. The relative risk of hepatocellular carcinoma death associated with any HBV DNA seroconversion (stable or unstable) was not significantly changed (RR: 2.8, 95% CI: [1.1, 7.4]) when other possible hepatocellular carcinoma risk factors (family history of hepatocellular carcinoma, acute hepatitis history, alcohol consumption, cigarette smoking) were accounted for. These data suggest that HBV DNA seroconversion (stable or unstable) is a prognostic factor for hepatocellular carcinoma death. Cumulative hepatocellular carcinoma-free survival was reduced when patients who seroconverted to HBV DNA negative at least once were compared with those who did not (p = 0.02).
Harris et al (2003) also reported that low HBV DNA load at baseline (<1.8 virions/mL) had a relative risk of hepatocellular carcinoma death of 0.51 (95%CI: [0.19, 1.4]), suggesting that low serum HBV DNA levels are associated with reduced risk of hepatocellular carcinoma death (but it was not clear what was compared with the relative risk). The relative risk of hepatocellular carcinoma death for other baseline serum HBV DNA levels was not reported. Application of a single point measure of HBV DNA at baseline does not capture the potential impact of fluctuating HBV DNA levels throughout the follow-up period.
The results of this study have the potential for bias: patient selection was non-consecutive and patients were selected from an early detection screening study. It was possible that patients with more severe chronic hepatitis B were included. The treatment and HBV DNA test are not considered applicable to Australian clinical practice.
In a prospective study Okhubo et al (2002) investigated factors associated with the prognosis of HBV-associated hepatocellular carcinoma. Patients (n = 74) positive for HbsAg and negative for anti-HCV were identified from a wider group of patients diagnosed with hepatocellular carcinoma. To identify factors involved in hepatocellular carcinoma prognosis univariate analysis was performed on variables present at the time of hepatocellular carcinoma diagnosis. The results of this analysis are presented in Table 33.
Serum HBV DNA level <3.7 LGE/mL and serum ALT <30 IU/L at the time of hepatocellular carcinoma diagnosis were reported to be associated with significantly longer survival. Clinical stage of hepatocellular carcinoma, the presence of a solitary tumour, and tumour size <2 cm were all significantly associated with longer survival (Table 33). Age, gender, alcohol intake, and history of blood transfusion did not appear to affect the cumulative survival of patients.
To establish independence of prognostic factors, multivariate analysis was carried out by stepwise logistic regression using the same variables as the univariate analysis. Serum HBV DNA <3.7 LGE/mL (p = 0.0022) and tumour size <2 cm (p = 0.0106) were identified as significant prognostic factors for HBV-associated hepatocellular carcinoma.
Because HBeAg positive patients with hepatocellular carcinoma had a poor prognosis compared withHBeAg negative patients and because all HBeAg positive patients had HBV DNA levels ≥3.7 LGE/mL, Okhubo et al (2002) also compared the cumulative survival after hepatocellular carcinoma diagnosis in HBeAg negative patients. This was compared in HBeAg negative patients with HBV DNA level ≥3.7 LGE/mL and those with levels <3.7 LGE/mL. The cumulative survival curves were different between the

84 Hepatitis B virus DNA testing
two groups (p = 0.0057) suggesting that serum HBV DNA levels at the time of hepatocellular carcinoma diagnosis in HBeAg negative patients have an impact on survival time.
Results from this study suggest that serum HBV DNA levels at diagnosis of HBV-associated hepatocellular carcinoma are a prognostic factor for survival, but they should be interpreted with some caution: Serum HBV DNA was tested by an assay that limits applicability to Australian clinical practice. It was not reported whether serum HBV DNA levels were a prognostic factor independent of hepatocellular carcinoma treatment. These results have potential for bias: the study direction (prospective or retrospective) was unclear and patient enrolment was not reported.
Table 33 Factors associated with prognosis of HBV-associated hepatocellular carcinoma
Study Patient characteristics Variable Median survival time
(years)
p-value Study quality/ comment
Serum HBV DNA <3.7 LGE/mL(n = 15) ≥3.7 LGE/mL(n = 53) Not assessed (n = 6)
5.8 1.2
0.0002
Serum ALT <30 IU/L (n = 24) ≥30 IU/L (n = 48) Not assessed (n = 2)
4.9 0.9
0.0008
Clinical stage I (n = 39) II or III (n = 33) Not assessed (n = 2)
3.2 0.9
0.0007
Liver tumour Solitary (n = 37) Multiple (n = 37)
4.3 0.7
0.0002
Okhubo et al (2002) Japan
Males = 74.3% Female = 25.7% Age range = 32–76 years Cirrhosis = 87.8% Hepatocellular carcinoma diagnosis: Histopathology n = 20 Ultrasonography, CT and hepatic arteriography n = 54 Hepatocellular carcinoma treatment: Surgical resection n = 13 Non-surgicala treatment n = 43No treatment n = 18
Tumour size <2 cm (n = 28) ≥2cm (n = 46)
4.9 1.0
0.0008
Prospective Did not investigate whether hepatocellular carcinoma treatment impacted on survival Limited Applicability: HBV DNA test not applicable to Australian clinical practice
Abbreviations: ALT, alanine aminotransferase; HBV DNA, hepatitis B virus deoxyribonucleic acid; IU, international units; LGE, logarithm of genome equivalent a Transcatheter arterial embolisation, and/or percutaneous ethanol injection
Serum HBV DNA and hepatocellular carcinoma prognosis in cirrhotic patients Two studies were identified where the relationship between serum HBV DNA levels and hepatocellular carcinoma occurrence in HBV related cirrhotic patients was investigated (Ishikawa et al 2001 and Mahmoud et al 2005)
Ishikawa et al (2001) examined several predictive factors for hepatocellular carcinoma, including serum HBV DNA and serum ALT, in a non-consecutive cohort of HbsAg positive compensated cirrhotic patients (n = 65). At the time of first diagnosis of cirrhosis, serum samples were taken for later analysis. During the observation period (mean 75.2 months), 28 patients (43.8%) developed hepatocellular carcinoma.

Hepatitis B virus DNA testing 85
The cumulative hepatocellular carcinoma appearance rates were 1.5 per cent, 9.4 per cent and 18.9 per cent at years 1, 3 and 5, respectively. Univariate analysis identified three factors which influenced hepatocellular carcinoma: ALT ≥100 IU/mL; lactate dehydrogenase (LDH) ≥480 IU/L and serum HBV DNA ≥3.7 LGE/mL. Multivariate analysis indicated that these factors were independent significant risk factors for hepatocellular carcinoma. The results of this analysis are presented in Table 34.
The data presented in Table 34 suggest that serum HBV DNA ≥3.7 LGE/mL is the most prognostic factor for the development of hepatocellular carcinoma in HBsAg positive compensated cirrhosis patients. Serum ALT levels were also prognostic of hepatocellular carcinoma development.
This study has potential for bias: patient selection was non-consecutive and the direction of the study (prospective or retrospective) was unclear. It was possible that included patients represent a group with more severe chronic hepatitis B. The applicability of the results to Australian clinical practice may be limited because an older HBV DNA test was used.
Table 34 Predictive factors for hepatocellular carcinoma in cirrhotic chronic hepatitis B patients (Ishikawa et al 2001)
Study Variable (no of patients)
Relative riska (95% CI)
Study quality/comment
ALT ≥100 IU/L (14) <100 IU/L (51)
4.525 (1.202–17.030) 1
LDH ≥480 IU/L (30) <480 IU/L (35)
2.880 (0.881–9.412) 1
Ishikawa et al (2001)
HBV DNA ≥3.7 LGE/mL (46) <3.7 LGE/mL (19)
7.712 (1.511–39.365) 1
Direction unclear Potential for selection bias: non-consecutive patient selection Reduced applicability to Australian clinical practice: less sensitive HBVDNA test
Abbreviations: ALT, alanine amino transferase; CI, confidence interval; LDH, lactate dehydrogenase; HBV DNA, hepatitis B virus deoxyribonucleic acid a Relative risks calculated using Cox regression analysis Mahmoud et al (2005) examined the association between serum HBV DNA and hepatocellular carcinoma occurrence in HBV related cirrhotic patients (n = 91). Of these patients, 23 (25.3%) developed hepatocellular carcinoma over seven years. Logistic regression analysis found that serum HBV DNA was the only statistically significant predictor of hepatocellular carcinoma occurrence (p<0.029). Serum ALT was somewhat predictive of hepatocellular carcinoma occurrence (p = 0.062). Multivariate analysis indicated that serum HBV DNA level was the only predictor of hepatocellular carcinoma occurrence in this study: odds ratio = 2.33 (95% CI: [5.6, 1.1]; p = 0.033).
The results of the study by Mahmoud et al (2005) indicate that serum HBV DNA is the most significant prognostic factor for hepatocellular carcinoma occurrence among patients with HBV related cirrhosis. It was unclear from this study whether the analysis was done on serum HBV DNA levels measured at a single time point at study entry or whether average serum HBV DNA levels during the follow-up period were used.

86 Hepatitis B virus DNA testing
This study has potential for bias: patient selection was not reported and the direction of the study (prospective or retrospective) was unclear. It was possible that included patients represent a group with more severe HBV-related cirrhosis. The HBV DNA test used in this study is considered applicable to Australian clinical practice.
Serum HBV DNA and hepatocellular carcinoma recurrence after curative resection In two further studies the relationship between serum HBV DNA level and recurrence after resection of HBV-related hepatocellular carcinoma was investigated (Kubo et al 2000; Kubo et al 2003). It was unclear from these studies whether the results reported by Kubo et al (2000) represent patients also included in the more recent study (Kubo et al 2003).
In the study by Kubo et al (2000) recurrence occurred in 19 (47.5%) of the 40 patients who had resection for hepatocellular carcinoma. Post-resection tumour free survival rate was significantly lower among patients with a high serum HBV DNA (≥0.7 mEq/mL) compared withpatients with lower HBV DNA levels (p = 0.0025). There was no tumour free survival at three years post-resection among patients with high serum HBV DNA. In contrast, the tumour free survival rate at nine years post-resection among patients with low serum HBV DNA was 64 per cent. In a multivariate analysis, a high serum HBV DNA level (≥0.7 mEq/mL) was found to be an independent risk factor for hepatocellular carcinoma recurrence after resection: relative risk= 5.13 (95%CI: [1.57, 16.67]; p = 0.0069). A positive surgical margin was also an independent risk factor for hepatocellular carcinoma recurrence after resection: relative risk= 2.14 (95%CI: [1.10, 6.80]; p = 0.0296).
In a similar study, Kubo et al (2003) also investigated the relationship between serum HBV DNA levels and hepatocellular carcinoma recurrence after resection. In this study of 52 patients, serum HBV DNA (by TMA-HPA assay) was ≥3.7 LGE/mL in 38 patients (group 1) and <3.7 LGE/mL in the remaining 14 patients (group 2). Hepatocellular carcinoma recurrence occurred in 24 (63.2%) of group 1 patients and two (14.3%) of group 2 patients. Tumour-free survival rate was significantly lower in group 1 patients with high serum HBV DNA levels (≥3.7 LGE/mL) in comparison with group 2 patients (p = 0.007). In a multivariate analysis, serum HBV DNA ≥3.7 LGE/mL was the most prognostic independent factor for recurrence after hepatocellular carcinoma resection: relative risk= 6.58 (95% CI: [1.52, 28.57]).
The results of the studies by Kubo et al (2000 & 2003) indicate that high serum HBV DNA levels are a significant prognostic indicator of hepatocellular carcinoma recurrence after resection. Analyses reported in these studies were calculated using serum HBV DNA levels taken before surgery. It appears possible that fluctuations in serum HBV DNA levels following surgical resection for hepatocellular carcinoma that may contribute to recurrence were not reported.
The studies by Kubo et al (2000 & 2003) have potential for bias: patient selection was non-consecutive and the direction of the study (prospective or retrospective) was unclear. It was possible that included patients represent a group with more severe chronic hepatitis B. The applicability of this study to Australian clinical practice may be reduced because a less sensitive HBV DNA test was used.
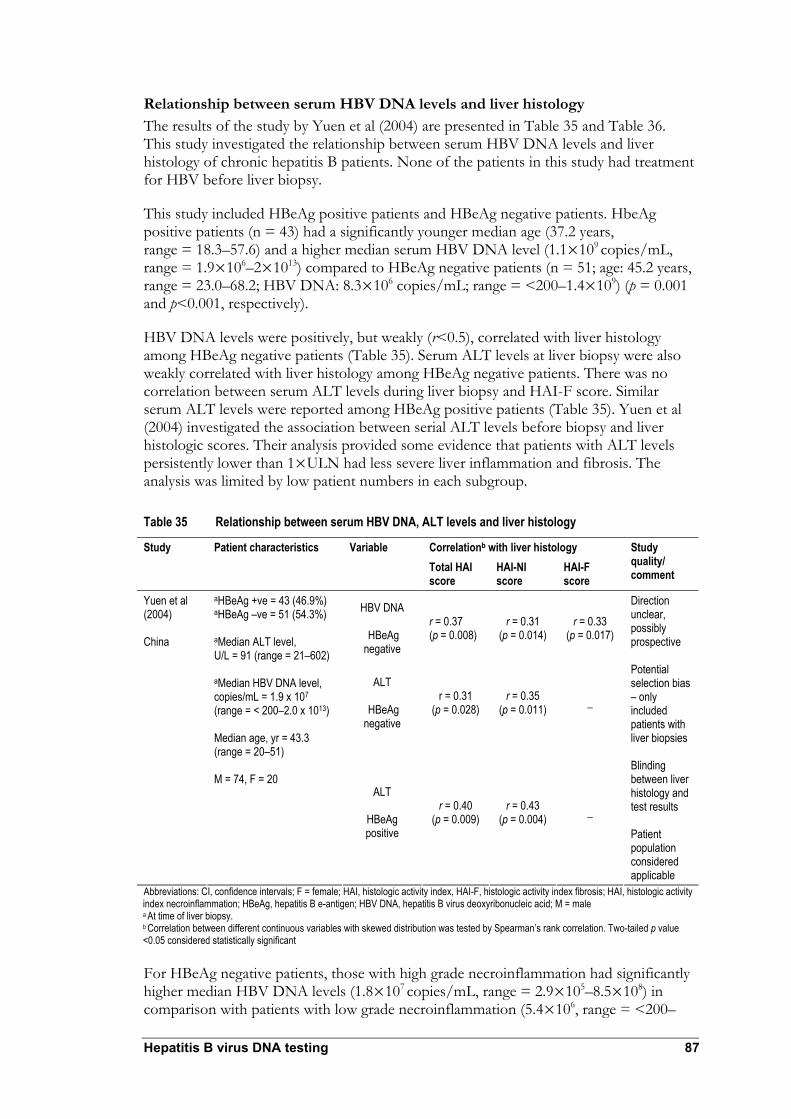
Hepatitis B virus DNA testing 87
Relationship between serum HBV DNA levels and liver histology The results of the study by Yuen et al (2004) are presented in Table 35 and Table 36. This study investigated the relationship between serum HBV DNA levels and liver histology of chronic hepatitis B patients. None of the patients in this study had treatment for HBV before liver biopsy.
This study included HBeAg positive patients and HBeAg negative patients. HbeAg positive patients (n = 43) had a significantly younger median age (37.2 years, range = 18.3–57.6) and a higher median serum HBV DNA level (1.1×10⁹ copies/mL, range = 1.9×10⁶–2×10¹³) compared to HBeAg negative patients (n = 51; age: 45.2 years, range = 23.0–68.2; HBV DNA: 8.3×10⁶ copies/mL; range = <200–1.4×10⁹) (p = 0.001 and p<0.001, respectively).
HBV DNA levels were positively, but weakly (r<0.5), correlated with liver histology among HBeAg negative patients (Table 35). Serum ALT levels at liver biopsy were also weakly correlated with liver histology among HBeAg negative patients. There was no correlation between serum ALT levels during liver biopsy and HAI-F score. Similar serum ALT levels were reported among HBeAg positive patients (Table 35). Yuen et al (2004) investigated the association between serial ALT levels before biopsy and liver histologic scores. Their analysis provided some evidence that patients with ALT levels persistently lower than 1×ULN had less severe liver inflammation and fibrosis. The analysis was limited by low patient numbers in each subgroup.
Table 35 Relationship between serum HBV DNA, ALT levels and liver histology
Correlationb with liver histology Study Patient characteristics Variable Total HAI score
HAI-NI score
HAI-F score
Study quality/ comment
HBV DNA
HBeAg negative
r = 0.37 (p = 0.008)
r = 0.31 (p = 0.014)
r = 0.33 (p = 0.017)
ALT
HBeAg negative
r = 0.31 (p = 0.028)
r = 0.35 (p = 0.011) _
Yuen et al (2004) China
aHBeAg +ve = 43 (46.9%) aHBeAg –ve = 51 (54.3%) aMedian ALT level, U/L = 91 (range = 21–602) aMedian HBV DNA level, copies/mL = 1.9 x 10⁷ (range = < 200–2.0 x 10¹³) Median age, yr = 43.3 (range = 20–51) M = 74, F = 20 ALT
HBeAg positive
r = 0.40 (p = 0.009)
r = 0.43 (p = 0.004) _
Direction unclear, possibly prospective Potential selection bias – only included patients with liver biopsies Blinding between liver histology and test results Patient population considered applicable
Abbreviations: CI, confidence intervals; F = female; HAI, histologic activity index, HAI-F, histologic activity index fibrosis; HAI, histologic activity index necroinflammation; HBeAg, hepatitis B e-antigen; HBV DNA, hepatitis B virus deoxyribonucleic acid; M = male a At time of liver biopsy. b Correlation between different continuous variables with skewed distribution was tested by Spearman’s rank correlation. Two-tailed p value <0.05 considered statistically significant For HBeAg negative patients, those with high grade necroinflammation had significantly higher median HBV DNA levels (1.8×10⁷ copies/mL, range = 2.9×10⁵–8.5×10⁸) in comparison with patients with low grade necroinflammation (5.4×10⁶, range = <200–
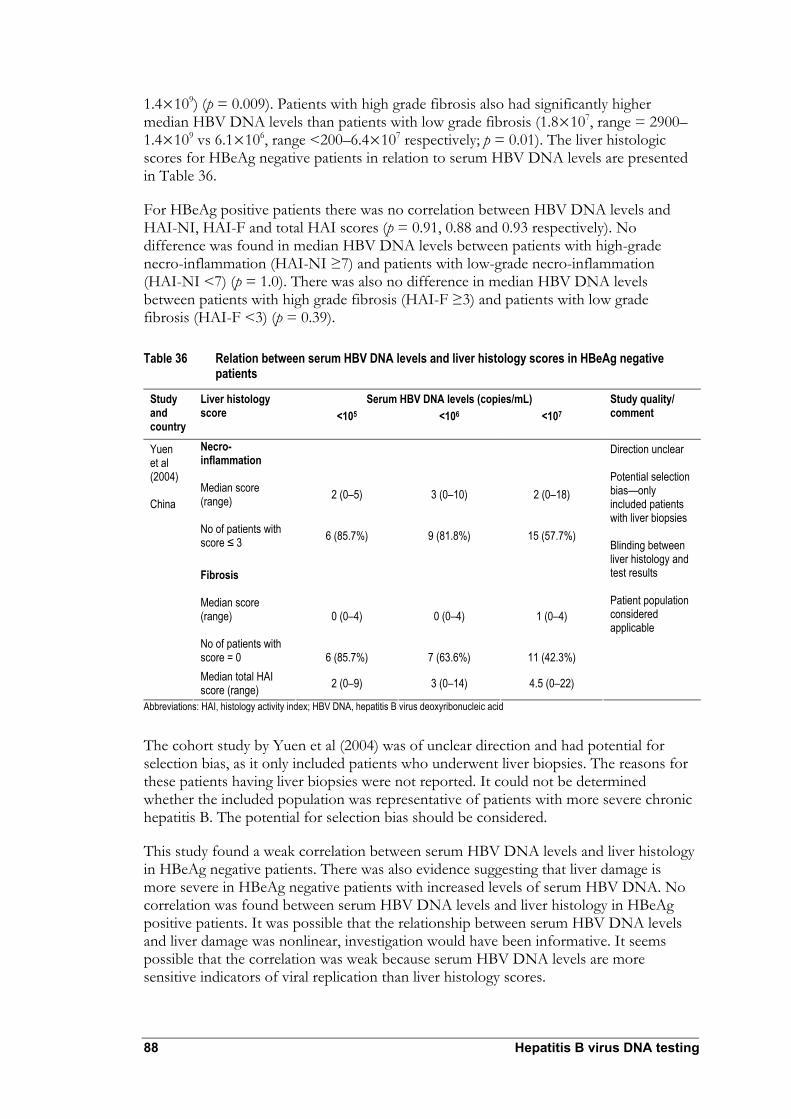
88 Hepatitis B virus DNA testing
1.4×10⁹) (p = 0.009). Patients with high grade fibrosis also had significantly higher median HBV DNA levels than patients with low grade fibrosis (1.8×10⁷, range = 2900–1.4×10⁹ vs 6.1×10⁶, range <200–6.4×10⁷ respectively; p = 0.01). The liver histologic scores for HBeAg negative patients in relation to serum HBV DNA levels are presented in Table 36.
For HBeAg positive patients there was no correlation between HBV DNA levels and HAI-NI, HAI-F and total HAI scores (p = 0.91, 0.88 and 0.93 respectively). No difference was found in median HBV DNA levels between patients with high-grade necro-inflammation (HAI-NI ≥7) and patients with low-grade necro-inflammation (HAI-NI <7) (p = 1.0). There was also no difference in median HBV DNA levels between patients with high grade fibrosis (HAI-F ≥3) and patients with low grade fibrosis (HAI-F <3) (p = 0.39).
Table 36 Relation between serum HBV DNA levels and liver histology scores in HBeAg negative patients
Serum HBV DNA levels (copies/mL) Study and country
Liver histology score <105 <106 <107
Study quality/ comment
Necro-inflammation Median score (range) No of patients with score ≤ 3
2 (0–5)
6 (85.7%)
3 (0–10)
9 (81.8%)
2 (0–18)
15 (57.7%)
Fibrosis Median score (range) No of patients with score = 0
0 (0–4)
6 (85.7%)
0 (0–4)
7 (63.6%)
1 (0–4)
11 (42.3%)
Yuen et al (2004) China
Median total HAI score (range) 2 (0–9) 3 (0–14) 4.5 (0–22)
Direction unclear Potential selection bias—only included patients with liver biopsies Blinding between liver histology and test results Patient population considered applicable
Abbreviations: HAI, histology activity index; HBV DNA, hepatitis B virus deoxyribonucleic acid
The cohort study by Yuen et al (2004) was of unclear direction and had potential for selection bias, as it only included patients who underwent liver biopsies. The reasons for these patients having liver biopsies were not reported. It could not be determined whether the included population was representative of patients with more severe chronic hepatitis B. The potential for selection bias should be considered.
This study found a weak correlation between serum HBV DNA levels and liver histology in HBeAg negative patients. There was also evidence suggesting that liver damage is more severe in HBeAg negative patients with increased levels of serum HBV DNA. No correlation was found between serum HBV DNA levels and liver histology in HBeAg positive patients. It was possible that the relationship between serum HBV DNA levels and liver damage was nonlinear, investigation would have been informative. It seems possible that the correlation was weak because serum HBV DNA levels are more sensitive indicators of viral replication than liver histology scores.

Hepatitis B virus DNA testing 89
In this study serum HBV DNA levels were measured at one point (two weeks before liver biopsy) were compared with liver histology. To clearly establish the relation between liver histology and serum HBV DNA levels serial measurements of HBV DNA levels before biopsy are required. This would enable an assessment of the impact of sustained (low to high) or fluctuating levels of serum HBV DNA on liver histology. This study design was unethical because patients with high levels of viral replication were candidates for antiviral therapy. It is impractical to measure serum HBV DNA levels over a meaningful time scale before liver biopsy.

90 Hepatitis B virus DNA testing
Does HBV DNA testing improve patient management?
To illustrate that changes in clinical decisions can be attributed to information provided by a diagnostic test, evidence is required to show that test information results in decisions which can involve stopping, starting or modifying treatment (MSAC 2005). For example, pre and post-test management studies can be used to provide this type of evidence (MSAC 2005).
No studies were identified which correspond to the study designs recommended in the MSAC guidelines. The study by Lampertico et al (2005) (see page 36) was considered to support that HBV DNA testing can alter management of patients undergoing lamivudine monotherapy. These changes may not be possible in the absence of HBV DNA testing. If ALT testing was the only method to detect lamivudine resistance, all patients identified by HBV DNA testing as genotypically resistant could potentially experience adefovir therapy delays, which may lead to suboptimal outcomes. Evidence was not identified to support that HBV DNA testing impacts change in patient management results for long term chronic hepatitis B clinical outcomes.
Does treatment result in improved health outcomes?
Licensed therapies in Australia for chronic hepatitis B include interferon-α, pegylated interferon, lamivudine, entecavir and adefovir dipivoxil. Government funding for adefovir is only available in cases where lamivudine-resistance has developed. Pre-treatment liver biopsy is required for access to therapies through the Australian Commonwealth Government Highly Specialised Drug Schedule 100 scheme for treatment of chronic hepatitis. HBV DNA testing is an essential part of the criteria to establish patient eligibility for treatment with interferon-α, lamivudine, entecavir or adefovir dipivoxil.
The PBS listing of these treatments indicates that the effectiveness of these therapies has been recognised. Evidence supporting treatment effectiveness for chronic hepatitis B was considered unnecessary for this assessment.
Appendix G presents examples of studies that illustrate treatment effectiveness of antiviral therapies.
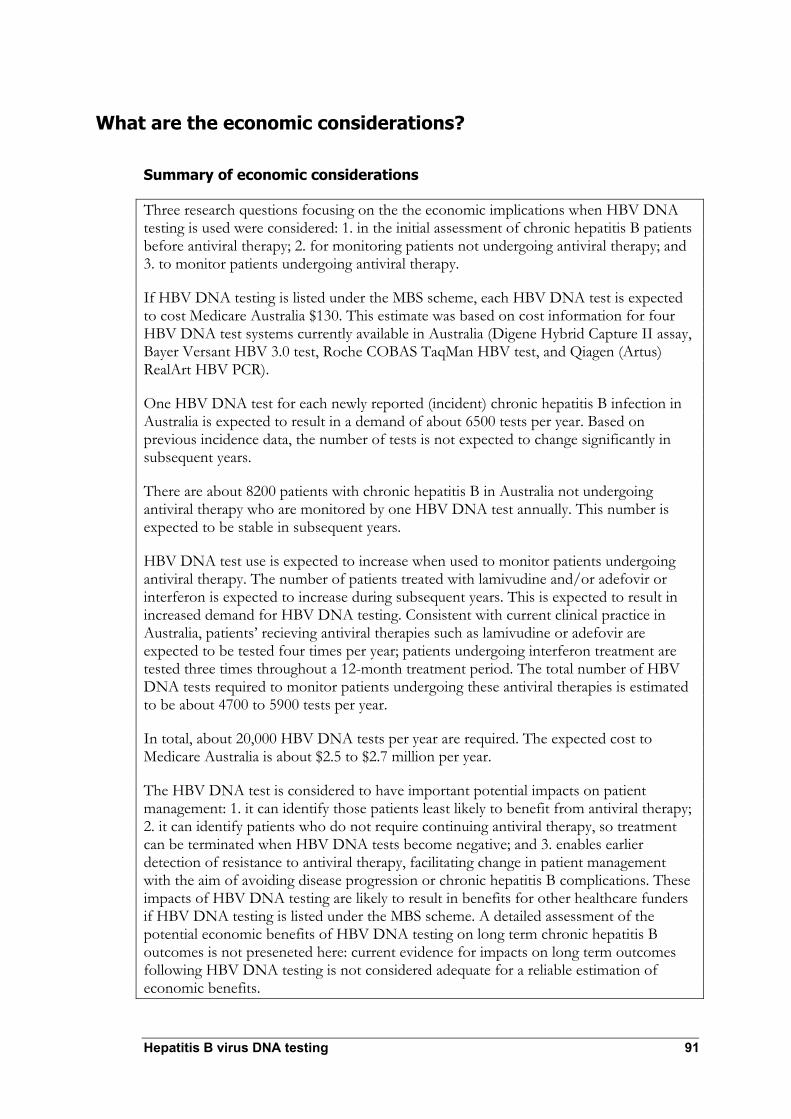
Hepatitis B virus DNA testing 91
What are the economic considerations?
Summary of economic considerations
Three research questions focusing on the the economic implications when HBV DNA testing is used were considered: 1. in the initial assessment of chronic hepatitis B patients before antiviral therapy; 2. for monitoring patients not undergoing antiviral therapy; and 3. to monitor patients undergoing antiviral therapy.
If HBV DNA testing is listed under the MBS scheme, each HBV DNA test is expected to cost Medicare Australia $130. This estimate was based on cost information for four HBV DNA test systems currently available in Australia (Digene Hybrid Capture II assay, Bayer Versant HBV 3.0 test, Roche COBAS TaqMan HBV test, and Qiagen (Artus) RealArt HBV PCR).
One HBV DNA test for each newly reported (incident) chronic hepatitis B infection in Australia is expected to result in a demand of about 6500 tests per year. Based on previous incidence data, the number of tests is not expected to change significantly in subsequent years.
There are about 8200 patients with chronic hepatitis B in Australia not undergoing antiviral therapy who are monitored by one HBV DNA test annually. This number is expected to be stable in subsequent years.
HBV DNA test use is expected to increase when used to monitor patients undergoing antiviral therapy. The number of patients treated with lamivudine and/or adefovir or interferon is expected to increase during subsequent years. This is expected to result in increased demand for HBV DNA testing. Consistent with current clinical practice in Australia, patients’ recieving antiviral therapies such as lamivudine or adefovir are expected to be tested four times per year; patients undergoing interferon treatment are tested three times throughout a 12-month treatment period. The total number of HBV DNA tests required to monitor patients undergoing these antiviral therapies is estimated to be about 4700 to 5900 tests per year.
In total, about 20,000 HBV DNA tests per year are required. The expected cost to Medicare Australia is about $2.5 to $2.7 million per year.
The HBV DNA test is considered to have important potential impacts on patient management: 1. it can identify those patients least likely to benefit from antiviral therapy; 2. it can identify patients who do not require continuing antiviral therapy, so treatment can be terminated when HBV DNA tests become negative; and 3. enables earlier detection of resistance to antiviral therapy, facilitating change in patient management with the aim of avoiding disease progression or chronic hepatitis B complications. These impacts of HBV DNA testing are likely to result in benefits for other healthcare funders if HBV DNA testing is listed under the MBS scheme. A detailed assessment of the potential economic benefits of HBV DNA testing on long term chronic hepatitis B outcomes is not preseneted here: current evidence for impacts on long term outcomes following HBV DNA testing is not considered adequate for a reliable estimation of economic benefits.

92 Hepatitis B virus DNA testing
The results of a recent study by Butler et al (2004), summarised in Table 37, reports the estimated average annual direct cost of managing a patient with chronic hepatitis B (chronic hepatitis B) in Australia. The study was performed as a retrospective chart analysis of 149 patients with varying stages of chronic hepatitis B, which were treated between 1995 and 2002 at four public teaching hospitals in NSW and Victoria. Costs for palliative care for chronic hepatitis B and hepatocellular carcinoma are based on observations in a palliative care unit. Cost components included were outpatient visits, outpatient pathology, outpatient imaging, drug treatment, inpatient admissions, and inpatient procedures. Indirect costs reflecting the value of lost production, and other costs such as time and travel for patients and carers, were not included. Differences in costs were tested to identify influencing factors such as age, gender, marital status, country of birth and duration of follow-up. They were not found to contribute to differences in costs.
Table 37 Direct cost of chronic hepatitis B in Australia
Costs per patient (AUD)1
Chronic hepatitis B subgroup (sample size)
Mean ± SD Median Range 95% CI
Non-cirrhotic chronic hepatitis B (n = 80)
1233 456 120–6295 939, 1544
Active disease (n = 38) 1778 884 125–6295 1212, 2374 Inactive disease (n = 42) 758 373 120–3247 519, 1045 Compensated cirrhosis (n = 20) 1394 1031 119–3176 975, 1797 Decompensated cirrhosis (n = 21) 11,961 5599 120–47,698 6993, 18,503 Liver transplantation (year 1) 144,392 ±
115,374 110,000 61,000–617,000
Liver transplantation (year 2+) 23,160 ± 19,289 17,500 6700–54,700 Hepatocellular carcinoma (n = 27)
11,753 7024 60–56,994 7385, 17,159
Palliative care 6307 4848, 8187 Source: Butler JR, Pianko S, Korda RJ, Nguyen S, Gow PJ, Roberts SK, Strasser SI, Sievert W (2004). ‘The direct cost of managing patients with chronic hepatitis B infection in Australia’. J Clin Gastroenterol. 38: S187–S192. Reproduced with permission of Lippincott, Williams and Wilkins Abbreviations: SD, standard deviation; AUD, Australian dollar 1 Costs estimated for 2001
As shown in this study, the costs of managing chronic hepatitis B patients vary significantly between the early and advanced disease stages, showing markedly higher treatment costs for all advanced stages of chronic hepatitis B. These costs are valid before the introduction of specific anti-HBV therapies and an increasing usage of these services.
No other economic assessment of HBV DNA testing in Australia was identified.
Test costs
Major capital equipment
Capital costs are those required to purchase major medical facilities and equipment required to perform the service under evaluation. For this assessment, ‘capital expenditure’ refers to the outlay required to purchase the automated test systems used

Hepatitis B virus DNA testing 93
for HBV DNA testing, such as luminometer, PC, monitor and software for automatic reading, and other associated equipment. Capital costs are typically investments made at a single point in time (often at outset); whereas running costs occur throughout the equipment’s life cycle.
Capital costs for equipment and buildings are subject to depreciation, reflecting that their value decreases over time (because of technological and material wear). Depreciation can be calculated using one of three approaches— linear, progressive or degressive. Opportunity costs also contribute to overall capital costs. They represent costs of resource options that are no longer available, leading to selecting next-best and (frequently) less cost-effective options. To calculate the current value of an investment, all costs and benefits were discounted to their current values. Discounting is a method to adjust costs and benefits occurring at different points in time to their present values. The underlying principle for discounting is that costs and benefits arising in the future have a lower value than they would if they arose today.
In general, Medicare does not cover laboratory systems and their maintenance costs. Laboratories fund equipment purchases. Equipment may be provided as part of a reagent rental agreement. Some laboratories establish agreements with diagnostic technology manufacturers to purchase their product. Hardware costs are included in the price for the reagent.
The Applicant provided information that three of the four test systems available in Australia are available via reagent rental. For the fourth test system, Qiagen (Artus) RealArt HBV PCR, the reagent is available in different sets specifically tailored to different instruments. No major equipment costs were considered for the total test cost estimate.
Major equipment costs were calculated to indicate pathology lab expenditure needed for purchase of equipment to process HBV DNA samples (Appendix H).
Other equipment costs
The HBV DNA test cost for consumables and professional time was quoted at $70 to $110 per test in the application.
Test costs were re-calculated based on price information provided by the Applicant. Table 38 provides the results of this calculation. The costs for each of the available four test systems are shown separately, considering the number of necessary batch controls, maximum batch size, and assuming a true batch size of 20 tests. Labour costs were calculated based on an average time of four hours for a mid-range scientist plus one minute of a virologist per test for the interpretation of test results. Average equipment costs per HBV DNA test were then calculated assuming an equal market share for each of the available test systems and including a 17 per cent margin for pathology laboratories.
According to this calculation, the average test costs are $130 per HBV DNA test.

Tabl
e 38
HBV
DNA
test
cost
s oth
er th
an ca
pita
l cos
ts
Reso
urce
Un
it co
st
Calcu
latio
n Co
mm
ent
Te
st sy
stem
Re
agen
t cos
t Di
gene
Hyb
rid
Capt
ure I
I ass
ay
Baye
r Ver
sant
HB
V 3.0
test
Ro
che C
obas
Ta
qMan
HBV
te
st
Qiag
en (A
rtus)
Re
alArt
HBV
PCR
A Pu
rchas
e cos
ts pe
r kit
$460
0.00
$640
0.00
$420
0.00
$460
0.00
Pr
ovide
d by
manu
factur
er
B Nu
mber
of te
sts pe
r kit
96
96
48
96
Pr
ovide
d by
manu
factur
er
C Co
st pe
r tes
t $4
7.92
$66.6
7 $8
7.50
$47.9
2 C
= A
/ B
D
Numb
er of
contr
ols ne
eded
per
batch
12
12
3
6
Prov
ided b
y ma
nufac
turer
E
Maxim
um nu
mber
of te
st pe
r batc
h N/
A N/
A 24
32
Prov
ided b
y ma
nufac
turer
F
Assu
med n
umbe
r of te
sts pe
r batc
h 20
20
20
20
Assu
mptio
n G
Reag
ent c
ost p
er ba
tch
$153
3.44
$213
3.44
$2,01
2.50
$1,24
5.92
G =
(Num
ber o
f req
uired
ba
tches
*C*D
) + (C
*F)
H Re
agen
t cos
t per
test
$7
6.67
$106
.67
$100
.63
$62.3
0 H
= G
/ F
Includ
ing co
sts fo
r co
ntrols
La
bour
cost
s
I
Scien
tist to
run s
ample
$6
.05
$6.05
$6
.05
$6.05
Four
hour
s to
proc
ess 2
0 sam
ples
as es
timate
d by A
P J
Viro
logist
to in
terpr
et tes
t res
ults
$1.89
$1
.89
$1.89
$1
.89
On
e minu
te pe
r tes
t To
tal c
osts
K
Total
costs
per t
est s
ystem
$8
4.61
$114
.61
$108
.57
$70.2
4 K
= H
+ I +
J
L
Aver
age c
osts
per t
est
$94.5
1 L =
∑K
/ 4
M
85%
Med
icare
fee
$110
.57
M =
L * 1.
17
17%
mar
gin ad
ded
N 10
0% M
edica
re fe
e $1
30.09
N
= (M
* 10
0%) /
85%
Abbr
eviat
ion: A
P, A
dviso
ry Pa
nel; N
/A, n
ot ap
plica
ble
Anno
tation
s: Ho
spita
l scie
ntist,
4th y
ear, N
SW A
ward,
Micr
opay
job c
ode 0
5.003
.14: $
999.6
0 pw
+15%
= $1
149.5
4 / 38
hours
a we
ek =
$30.2
5 per
hour
; APP
: App
205,0
00 pa
/ (40
hours
per w
eek *
52 w
eeks
) = $1
13.34
per h
our
Ref: h
ttp://w
ww.he
alth.n
sw.go
v.au/p
olicie
s/ib/2
006/p
df/IB
2006
_023
.pdf a
nd ht
tp://w
ww.he
alth.n
sw.go
v.au/j
obs/e
mpco
nd/aw
ards/H
REA/
hosp
ital-s
cienti
sts.pd
f . Re
f: Sala
ry for
APP
prov
ided b
y Pro
fesso
r Syd
Bell
.
94 Hepatitis B virus DNA testing

Hepatitis B virus DNA testing 95
An assessment was made about how much the average costs per HBV DNA test depend on the number of tests per batch. The number of tests per batch was varied and the costs per test re-calculated in order to perform the assessment.
$0.00
$50.00
$100.00
$150.00
$200.00
$250.00
5 10 15 20 25 30 35 40 45 50
Number of tests per batch
Aver
age
cost
s pe
r te
st
Used in base case analysis
Figure 10 Average equipment costs per HBV DNA test, by number of tests per batch
The average equipment costs per HBV DNA test, soon reaches a steady state and does not significantly decrease if the number of tests per batch increases (Figure 10). This effect occurs because the maximum batch size for some of the test systems is restricted. For test systems with no restriction on the maximum batch size (Digene Hybrid Capture II Assay, Bayer Versant HBV 3.0), the costs per test would decrease further if the number of samples per batch increases.
Patient management costs
The following three research questions were defined for this assessment:
• Initial assessment and monitoring of chronic hepatitis B patients before or not undergoing antiviral therapy
• Monitoring chronic hepatitis B patients not undergoing antiviral treatment
• Monitoring chronic hepatitis B patients undergoing antiviral treatment.
Clinical pathways addressing these research questions were developed from Advisory Panel consultation.

96 Hepatitis B virus DNA testing
Initial assessment and monitoring of chronic hepatitis B patients before or not undergoing antiviral therapy
According to the patient management flowcharts shown in Approach to assessment (see Figure 1 and Figure 2); the test would be added to the initial assessment of patients as DNA measurements are useful in assessing the extent of disease in the liver. The additional costs are $130.09 per patient (one test during initial assessment) should the HBV DNA test be listed under the MBS.
The HBV DNA test confirms the presence and course of HBV infections to inform treatment decisions. The test detects active disease in HBeAg negative and ALT normal patients and optimising treatment timing. In a sample of Australian patients described by Bell et al (2005), 47 per cent of all HBeAg negative patients did not exhibit elevated ALT levels at referral. HBeAg negative patients represent half of all patients with active viral replication.
The monitoring of chronic hepatitis B patients not on antiviral therapy would be increased if there were significant levels of viral replication associated as this places patients at a higher risk of developing complications or needing treatment. Patients with high viral load are more likely to have underlying disease that may be detected on biopsy and lead to treatment. At least one HBV DNA test would be performed to detect increasing DNA levels and determine treatment for all patients not undergoing drug treatment and presenting with elevated ALT levels. The test would add $130.09 to the general non-drug management costs.
Monitoring chronic hepatitis B patients undergoing antiviral therapy
Lamivudine and/or adefovir treatment Patient management flowcharts for the treatment with lamivudine and/or adefovir (see Approach to assessment, Figure 3, Figure 4, and Figure 5) were translated into a decision tree as shown in Appendix I.
The HBV DNA test would be performed every three months together with the routinely performed ALT and HBeAg serology. It allows distinction among:
1. Patients presenting with normal ALT and low levels of HBV DNA (the HBV infection is well controlled and patients will continue antiviral treatment for a certain period (depending on HBeAg serology results) before switching to non-drug treatment monitoring)
2. Patients presenting elevated ALT levels, but who are HBeAg negative and show low levels of HBV DNA (the increased ALT levels are likely to be caused not by an HBV infection but other conditions, so patients could be taken off inadequate treatment
3. Patients presenting with normal ALT, HBeAg positive or negative, but increasing levels of HBV DNA. (Lamivudine monotherapy does not control disease due to either primary or secondary treatment failure4. Patients would stop lamivudine treatment and switch to either adefovir (if HBeAg negative) or interferon (if HBeAg positive and not contraindications).
4 Secondary treatment failure = drug resistance

Hepatitis B virus DNA testing 97
The proportion of patients inadequately treated with antivirals cannot be quantified. A comprehensive model for the course of HBV infection was beyond the scope of this assessment. The clinical flowcharts (see Approach to assessment) illustrate that it was not possible to identify patients being treated inadequately with ALT/HBeAg serology only. Lamivudine treatment could not be terminated before two follow-up measurements showing normal ALT and negative HBeAg serology were acquired.
Inadequately treated patients are exposed to unnecessary drug treatment and associated side effects. Both the treatment of side effects and the drug treatment are expenditures that could be avoided by identifying patients whose treatment protocols are inappropriate and making necessary amendments. Annual drug treatment costs with lamivudine reach $1558 per patient5, with adefovir monotherapy $76046.
HBV DNA testing also allows detection of drug resistance among patients adequately treated with either lamivudine or adefovir. At present, drug resistance against lamivudine is more frequently reported compared to resistance rates against adefovir which are reported to be low (Locarnini et al 2004). A future increase in resistance to adefovir also seems to be possible. HBV DNA testing would not necessarily detect more cases of drug resistance but it could allow detecting (genotypic) resistance to antiviral treatment earlier than with ALT/HBsAg serology (which only can measure phenotypic resistance). The median time between genotypic and phenotypic resistance is reported to be four months (Hadziyannis et al 2000). Early diagnosis of drug resistance is important for patients to avoid severe liver damage from disease progression resulting from viral breakthrough. For example, severe exacerbations among patients with cirrhosis may result in organ failure; graft loss and death can occur in liver transplant patients (Locarnini et al 2004). It is not possible to quantify the benefit of earlier detection and improved long term health outcomes based on currently available evidence. Since the alternative antiviral drugs (adefovir, interferon 2a, interferon 2b) are more expensive than lamivudine, earlier switching to these drugs increases overall medication costs per patient. In the longer term, avoiding advanced stages of HBV infection, such as cirrhosis or hepatocellular carcinoma, would provide an economic benefit as they are shown to be more expensive (Butler et al 2004).
The additional (incremental) costs for monitoring in three month intervals would be $520.36 per patient, and a year of antiviral treatment (four times $130.09 per test).
Interferon Patient management flowcharts for the treatment with interferon are presented in the Approach to assessment (see Figure 6 and Figure 7).
Where Interferon treatment is considered in HBsAg positive patients as first line treatment in patients with low HBV DNA and high ALT or as second line treatment after primary drug failure of lamivudine, about a third of all patients would be eligible for interferon treatment. The Advisory Panel indicated that in practice about 20 per cent of these patients are treated.
5 PBS item number 6257H: 28*100 mg = $119.50, recommended dosage = 100 mg per day 6 PBS item number 6450L: 30*10 mg = $625.00, recommended dosage = 10 mg per day

98 Hepatitis B virus DNA testing
An antiviral immune response with interferon can be reached in 20 to 30 per cent of patients treated with interferon-α 2a, and in about 40 per cent of patients treated with interferon-α 2b (within six months after treatment end), respectively (eMIMS 2006). According to the Advisory Panel, interferon treatment would be provided for a total duration of 12 months. Treatment would not be stopped where after six months of treatment, DNA levels are not found to be lowered. This indicates that the HBV DNA test allows continuous disease monitoring, but that treatment decisions would require review after 12 months at the earliest.
HBV DNA testing was considered to be performed at the beginning and the end of a six month treatment cycle and after 12 months of treatment. This would cost $390.27 per patient in addition to routine ALT and HBeAg monitoring.
Financial implications of a positive recommendation
The number of expected HBV DNA tests needed to be first estimated to calculate the financial implication of a positive recommendation. The financial implications of listing HBV DNA testing under the MBS are shown separately for Medicare Australia and other health funders.
Initial testing
HBV incident infections data from the National Notifiable Diseases Surveillance System were used to estimate uptake of HBV DNA testing for the initial assessment. In 2004, the national notification rate for confirmed incident cases was 1.4 per 100,0007 and 1.2 per 100,000 in 2005, showing a declining tendency in recent years. (Yohannes et al 2006) Unspecified cases were reported at a rate of 29.1 per 100,0008 (in 2004) also showing a declining tendency. In total in 2004, new HBV infections were reported at a rate of 30.5 per 100,000.
Based on demographic data, the Australian population size is expected to grow continuously during coming years (Australian Bureau of Statistics 2006). Considering a declining prevalence, but a growing population with continuous immigration from high-risk areas, it was assumed that the number of incident cases would remain stable at the current level of 6475 cases in 2006 (data for 2006 projected based on reported estimates 17 October 2006) (see Figure 11). These cases are considered to require a single initial HBV DNA test.
7 Incident hepatitis B notifications: confirmed incident cases of HBV infection. 8 Unspecified hepatitis B notifications: newly reported HBV infections that do not meet the confirmation criteria for incident HBV notifications.

Hepatitis B virus DNA testing 99
-
1,000
2,000
3,000
4,000
5,000
6,000
7,000
8,000
9,000
2000 2001 2002 2003 2004 2005 2006 2007 2008 2009
Year
Case
num
ber
Newly acquired Unspecified Total
Figure 11 Forecast incident HBV cases, 2007–2010 Reference: Based on National Notifiable Diseases Surveillance System projected figures for 2006, forecast for 2007–2009
Monitoring chronic hepatitis B patients undergoing antiviral therapy
The number of patients undergoing antiviral drug treatment was assessed using Medicare statistics (Medicare Australia, 2006). The total PBS and RPBS benefits for lamivudine (PBS items 6257H, 6271C) and adefovir (6450L); interferon-α 2a (6210W, 6211X, 6212Y, 6213B) and interferon-α 2b (6246R, 6253D, 6218G, 6219H, 6254E, 6255F) were applied and converted into number of packs. Assuming ongoing treatment for the duration of one year, the number of packs was then translated into patient numbers by considering pack size and recommended dosage. In the case of interferon, this approach provides an overestimation of patients treated for chronic hepatitis B, as both interferon-α 2a and 2b are registered for the treatment of other conditions, such as chronic hepatitis and non-Hodgkin’s lymphoma.9
The calculated patient numbers for lamivudine and/or adefovir are shown in Figure 12, for interferon in Figure 13.
9 Also registered for: Hairy cell leukaemia; AIDS-related Kaposi’s sarcoma; cutaneous T cell lymphoma; chronic hepatitis C; chronic myelogenous leukaemia (CML); excessive thrombocytosis associated with CML and other myeloproliferative disorders in patients >18 years; multiple myeloma, non-Hodgkin’s lymphoma; advanced renal cell carcinoma, malignant melanoma.

100 Hepatitis B virus DNA testing
0
200
400
600
800
1000
1200
1400
1600
2001 2002 2003 2004 2005 2006 2007 2008 2009
Year
Patie
nt n
umbe
r
Figure 12 Forecast of patients treated with antivirals
It was assumed that patient numbers would follow past patterns—a linear rather than a damped trend—for antiviral treatment. It was calculated that about 957 patients would be treated using either lamivudine and/or adefovir in 2006 under the PBS or RPBS. Patient numbers are forecast to increase to 1107 (2007), 1265 (2008), and 1423 (2009).

Hepatitis B virus DNA testing 101
0
20
40
60
80
100
120
140
2001 2002 2003 2004 2005 2006 2007 2008 2009
Year
Patie
nt n
umbe
r
Figure 13 Forecast of patients treated with interferon-α 2a or 2b
In relation to interferon treatment, it is assumed that patient numbers will not follow past patterns—showing an exponential declining trend. This assumption is based on the recent changes in interferon listing and indications. The utilisation is rather expected to increase over time, as patients have been waited for pegylated interferon to become available for chronic hepatitis B treatment under the PBS scheme. Since 1 December 2006, Pegintron (Pegasys®) is available as monotherapy for chronic hepatitis B (6439X, 6449K). It was previously restricted to the treatment of chronic HCV only. PBS uptake data were not available to inform calculation of expected numbers of patients receiving interferon treatment, including pegylated interferon. Because alternate estimation is not possible, the number of patients was considered to be stable at the current level of about 82 patients a year (advice from the advisory panel).
Monitoring chronic hepatitis B patients not undergoing antiviral treatment
Based on HBV patients attending St Vincent’s Hospital Melbourne, and drug treatment surveillance data from the Highly Specialised Drugs (HSD) Program presented by the National Centre in HIV Epidemiology and Clinical Research (Yohannes et al 2006), the number of patients in Australia attending liver clinics and who are not treated using drug therapy was calculated and tabulated (Table 39). This is considered as the number of patients who would not undergo antiviral treatment, but require regular monitoring. The calculation assumes that patients undergo drug treatment at the same frequency as provided by St. Vincent’s Hospital Melbourne.
According to the application, testing is recommended for patients undergoing non-drug treatment should ALT levels become elevated. It was assumed that monitoring of HBV DNA is performed once a year in all 8142 patients.

102 Hepatitis B virus DNA testing
Table 39 Estimated number of chronic hepatitis B patients not undergoing antiviral treatment that requires monitoring
Item Data Source A HBV patients presenting to St. Vincent’sHospital Melbourne 2001–2005 850 Advisory Panel B HBV patients treated with antiviral drugs and interferon by St Vincent’s
Hospital Melbourne 2001–2005 365 Advisory Panel
C Probability of undergoing drug-treatment1 43% C = B / A D HBV patients in Australia undergoing drug treatment auspiced by the HSD
program 20052 6129 National Centre in HIV
Epidemiology and Clinical Research 2006
E Estimated number of HBV patients in Australia attending liver clinics 14,253 E = D / C F Estimated number of HBV patients in Australia attending liver clinics and not
who are not being treated using drug therapy (requiring monitoring) 8124 F = E – D
Abbreviation: ALT, serum alanine aminotransferase 1 As provided in St. Vincent’s Hospital Melbourne liver clinic, assumed to be representative for other liver clinics as well 2 Including lamivudine and adefovir, based on the number of prescriptions at the end of 2005, considering ongoing drug treatment
Medicare Australia
The aggregated financial impact of funding the HBV DNA test for Medicare Australia is shown in Table 40. Since Medicare Australia would meet the costs of the pathology test, the financial impact calculation is based on the estimated number of provided services and the cost of test equipment.
Table 40 Aggregated financial impact of HBV DNA test funding to Medicare Australia
Year 1 Year 2 Year 3 Reference Initial testing A Number of incident cases 6475 6475 6475 Figure 11
B Number of HBV DNA tests per year (initial assessments) 6475 6475 6475 One test during
initial assessment Monitoring antiviral treatment
C Number of patients on antiviral treatment under PBS and RPBS 1107 1265 1423 Figure 12
D Number of HBV DNA tests/year for patients on antiviral treatment 4428 5060 5692 Four tests a year
D = C * 4
E Number of patients receiving interferon treatment under PBS and RPBS
82 82 82 Figure 13
F Number of HBV DNA tests/year for patients receiving interferon treatment
246 246 246
Three tests during 12 months treatment F = E * 3
Monitoring patients not on antiviral treatment
G Number of patients presenting to liver clinics and not on drug treatment
8214 8214 8214 Table 39 One test per year
Totals H Total number of HBV DNA tests 19,364 19,995 20,627 H = B + D + F + G
I Cost per HBV DNA test $130.09 $130.09 $130.09 Table 38
J Annual costs HBV DNA test $2,519,063 $2,601,149 $2,683,366 J = H * I Current costs are not shown because HBV DNA testing would be provided as an additional test and would not replace any other test

Hepatitis B virus DNA testing 103
Assuming that the HBV DNA test would reach an uptake rate of 100 per cent and is funded as a pathology test, the financial impact for Medicare Australia would be in the range of $2.65 to $2.7 million per year.
Other healthcare funders
The funding for the HBV DNA test would come from the hospital laboratory funding. The aggregated financial impact of HBV DNA testing is shown in Appendix J.
The PBS budget would also be negatively affected as patients identified with drug resistance to lamivudine would either switch to adefovir or interferon; both treatments are associated with markedly higher treatment costs per patient and year. The impact cannot be further quantified since the number of patients switching drug treatments cannot be estimated. On the other hand, the PBS budget could be positively affected as patients inadequately treated for HBV could stop drug treatment. Annual drug treatment costs with lamivudine reach $1558 per patient (PBS item number 6257H: 28*100 mg = $119.50, recommended dosage = 100 mg per day), with adefovir monotherapy $7604 (PBS item number 6450 L: 30*10 mg = $625.00, recommended dosage = 10 mg per day). By improving the management of chronic hepatitis B patients, such as by detecting drug resistance earlier, disease progression might be positively influenced and complications avoided. Hospital budgets would also be affected by listing the HBV test. These influences could not be evaluated because current evidence supporting a link between HBV DNA testing and long term outcomes is limited.

104 Hepatitis B virus DNA testing
Conclusions
Effectiveness
Previously, measures of serum ALT and liver histology were considered suitable indicators of hepatitis B disease activity. Patients with chronic hepatitis B may have other reasons for elevated ALT and changes in liver histology, such as non-alcoholic fatty liver disease, or concurrent viral infections (hepatitis C). The serological marker HBeAg was previously considered to indicate active HBV replication, but some variants of the hepatitis B virus have a mutation that prevents serological detection of HBeAg. Thus, absence of HBeAg does not necessarily indicate that HBV replication has not occurred. This is so among patients who were previously HBeAg positive, because this mutation can develop during immune clearance of HBeAg. Differentiation of inactive HBeAg negative carriers from HBeAg negative active chronic hepatitis B patients is necessary to determine patients who require antiviral therapy.
Measurements of serum HBV DNA levels, as well as biochemical, serological and histological evaluations, have become widely considered as necessary to determine appropriate management for chronic hepatitis B patients. This is particularly true with respect to the introduction of and monitoring of antiviral therapy. It is important to monitor virological response during antiviral therapy because patients who may become, or are currently resistant to therapy, can be identified. Monitoring also identifies patients whose response to therapy is not optimal. Monitoring is an essential aspect of patient management to identify those who require other antiviral therapy options and to pinpoint patients least likely to benefit from therapy.
The intention of HBV DNA testing is to measure underlying hepatitis B virus replication, rather than its effects on markers, such as elevated liver enzymes. Because drug treatment outcomes are considered to be associated with pre-treatment HBV DNA levels, the test also allows clinicians to select the most appropriate drug treatment for patients. In addition, for HBeAg negative patients with non-elevated ALT levels, testing positive for HBV DNA provides access to some of the drugs listed on the PBS for the treatment of chronic HBV infection (adefovir, entecavir).
The aims of the current assessment were to determine the additional value of serum HBV DNA testing in: the initial assessment of patients before antiviral therapy; monitoring patients not undergoing antiviral therapy; and monitoring patients undergoing antiviral therapy. The aims were to assess the clinical effectiveness (diagnostic performance and the impact of diagnosis on changes in clinical management and changes in clinical outcomes) and cost-effectiveness of serum HBV DNA testing.
Because samples for HBV DNA testing can occur when blood is collected for other tests (eg ALT), it was considered unlikely that there will be any major safety issues for the patient with respect to the HBV DNA test itself—specimens are collected for the test using standard blood collection methods.
Direct evidence
Direct evidence for the impact of serum HBV DNA testing on chronic hepatitis B clinical outcomes was sought. Two studies were identified which allowed an assessment

Hepatitis B virus DNA testing 105
of the impact of serum HBV DNA testing on chronic hepatitis B clinical outcomes. One study provided evidence that short term patient outcomes (virological response and ALT normalisation) are improved when HBV DNA testing is used in addition to ALT testing to alter the management of lamivudine resistant HbeAg negative patients. Long term follow-up of these patients is required to determine whether these short term benefits translate to long term improvements in chronic hepatitis B clinical outcomes.
In another study, the combined strategy of HBV DNA testing and lamivudine therapy improved health outcomes (patient survival; liver-related death) in HBsAg positive renal transplant patients. Results presented in this study did not allow an assessment of the additional value of HBV DNA testing. This study is considered not applicable to clinical practice in Australia, where all HBsAg positive patients are treated pre-emptively with lamivudine to prevent viral reactivation, irrespective of serum HBV DNA levels.
The direct evidence identified in both studies was considered limited: primarily because the studies were not randomised controlled trials and treatment decisions were driven by the availability of antiviral therapy, rather than the results of HBV DNA testing alone. Despite limitations in designs, results from both studies indicate that serum HBV DNA testing has potential to improve health outcomes among chronic hepatitis B patients.
Linked evidence: Accuracy studies
Although direct evidence for the impact of HBV DNA testing on chronic hepatitis B outcomes was identified in the literature review, a linked evidence approach was deemed necessary. This was primarily because the direct evidence was limited to specific chronic hepatitis B patient populations (HBsAg positive renal transplant patients, and HbeAg negative patients undergoing lamivudine therapy) and did not adequately address all the aims of this assessment. Assessment of HBV DNA testing in the absence of a linked evidence approach was considered inadequate because of direct evidence limitations.
HBV DNA testing and initial assessment and monitoring of patients not undergoing antiviral therapy
Five studies were identified which provided evidence indicating the accuracy of serum HBV DNA testing in initial assessment and monitoring of patients not undergoing antiviral therapy.
Two studies provided evidence that HBV DNA testing enables the differentiation of inactive HBeAg negative carriers from HBeAg negative patients with active chronic hepatitis B (eg elevated serum ALT). One of these studies provided evidence that HBV DNA testing adds additional diagnostic performance to the differentiation of these patients by serological testing (IgM anti-HBc complex measurement). Patient classification was based on serum HBV DNA levels alone, introducing potential for misclassification. Further research is necessary to establish additional value provided by HBV DNA testing to differentiate patient groups.
Two studies provide evidence that elevated serum HBV DNA levels are associated with increased liver damage. This was true of HBeAg negative patients, but not HBeAg positive patients. Although increased levels of serum HBV DNA are indicative of increased viral replication, which is considered to be associated with increased liver damage, Patients in the immune tolerant phase of chronic hepatitis B infection are characterised by high HBV DNA, HBeAg positivity, and low levels of liver
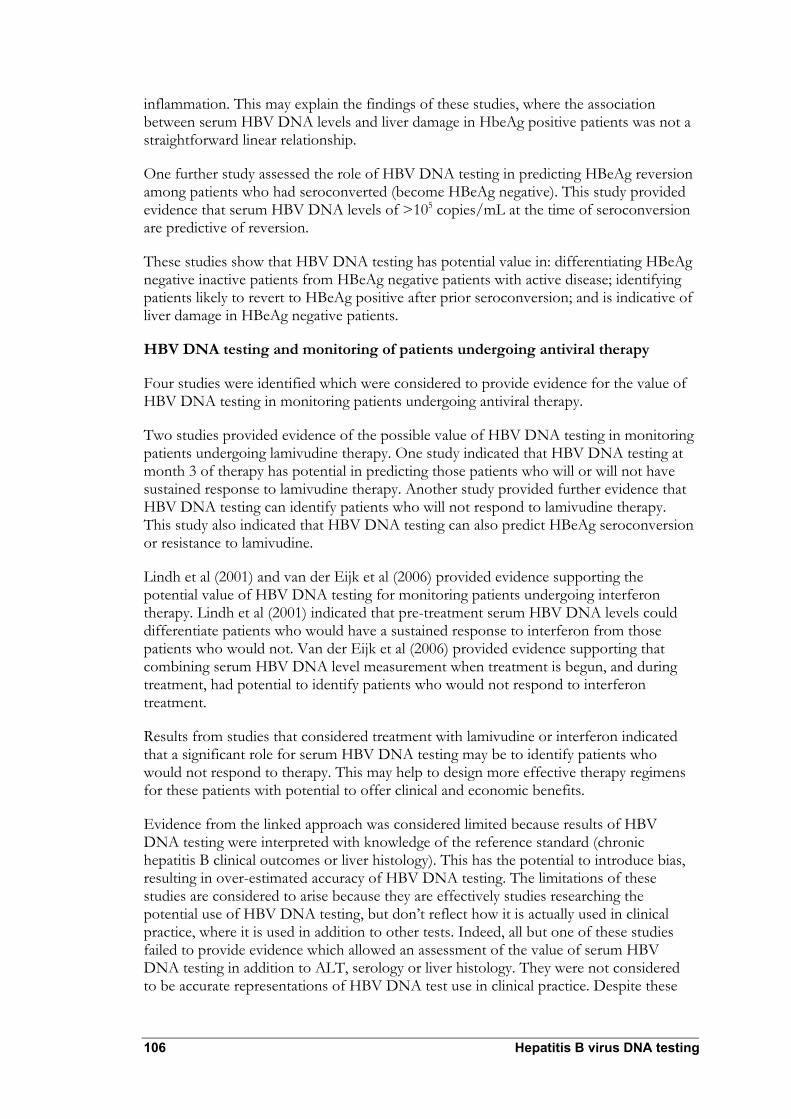
106 Hepatitis B virus DNA testing
inflammation. This may explain the findings of these studies, where the association between serum HBV DNA levels and liver damage in HbeAg positive patients was not a straightforward linear relationship.
One further study assessed the role of HBV DNA testing in predicting HBeAg reversion among patients who had seroconverted (become HBeAg negative). This study provided evidence that serum HBV DNA levels of >105 copies/mL at the time of seroconversion are predictive of reversion.
These studies show that HBV DNA testing has potential value in: differentiating HBeAg negative inactive patients from HBeAg negative patients with active disease; identifying patients likely to revert to HBeAg positive after prior seroconversion; and is indicative of liver damage in HBeAg negative patients.
HBV DNA testing and monitoring of patients undergoing antiviral therapy
Four studies were identified which were considered to provide evidence for the value of HBV DNA testing in monitoring patients undergoing antiviral therapy.
Two studies provided evidence of the possible value of HBV DNA testing in monitoring patients undergoing lamivudine therapy. One study indicated that HBV DNA testing at month 3 of therapy has potential in predicting those patients who will or will not have sustained response to lamivudine therapy. Another study provided further evidence that HBV DNA testing can identify patients who will not respond to lamivudine therapy. This study also indicated that HBV DNA testing can also predict HBeAg seroconversion or resistance to lamivudine.
Lindh et al (2001) and van der Eijk et al (2006) provided evidence supporting the potential value of HBV DNA testing for monitoring patients undergoing interferon therapy. Lindh et al (2001) indicated that pre-treatment serum HBV DNA levels could differentiate patients who would have a sustained response to interferon from those patients who would not. Van der Eijk et al (2006) provided evidence supporting that combining serum HBV DNA level measurement when treatment is begun, and during treatment, had potential to identify patients who would not respond to interferon treatment.
Results from studies that considered treatment with lamivudine or interferon indicated that a significant role for serum HBV DNA testing may be to identify patients who would not respond to therapy. This may help to design more effective therapy regimens for these patients with potential to offer clinical and economic benefits.
Evidence from the linked approach was considered limited because results of HBV DNA testing were interpreted with knowledge of the reference standard (chronic hepatitis B clinical outcomes or liver histology). This has the potential to introduce bias, resulting in over-estimated accuracy of HBV DNA testing. The limitations of these studies are considered to arise because they are effectively studies researching the potential use of HBV DNA testing, but don’t reflect how it is actually used in clinical practice, where it is used in addition to other tests. Indeed, all but one of these studies failed to provide evidence which allowed an assessment of the value of serum HBV DNA testing in addition to ALT, serology or liver histology. They were not considered to be accurate representations of HBV DNA test use in clinical practice. Despite these

Hepatitis B virus DNA testing 107
considerations, the studies were considered to provide supportive, but limited, evidence of the potential value of serum HBV DNA testing in clinical practice.
Linked evidence: Serum HBV DNA levels and chronic hepatitis B clinical outcomes
The evidence from the accuracy studies was considered limited because impact of HBV DNA testing on long term clinical outcomes was not shown. Because these outcomes (cirrhosis, liver cancer) are long term, and widespread HBV DNA testing (combined with therapies requiring assessment of HBV DNA levels) is relatively recent, evidence may not become available for several years. The absence of this evidence required supplementation by studies that examined relationships between serum HBV DNA levels and long term outcomes. Although these studies did not directly assess the ability of HBV DNA testing to change outcomes, evidence was provided that HBV DNA levels can indicate long term outcomes.
Studies that reported serum HBV DNA levels and chronic hepatitis B outcomes were generally limited by reporting measurement of serum HBV DNA levels at one time point. This may not fully capture the dynamic nature of viral replication because periods of intense viral replication can be interspersed with phases of relative quiescence. The impact of fluctuating or sustained increased levels of serum HBV DNA was not assessed. Data from these studies suggest that HBV DNA level measurement at a single time point has potential to fulfil an important prognostic role.
One systematic review was identified which provided evidence that HBV DNA levels are predictive of outcome, illustrates treatment efficacy. Significantly, serum HBV DNA levels (baseline and change from baseline) were correlated with liver histology and HBeAg seroconversion. This indicates that serum HBV DNA levels are potentially important indicators of liver damage and predictors of HbeAg seroconversion.
In a long term population-based study (REVEAL-HBV study) increased levels of serum HBV DNA were found to be associated with an increased cumulative incidence of both cirrhosis and hepatocellular carcinoma. Significantly, serum HBV DNA was found to be an independent risk factor for both cirrhosis and hepatocellular carcinoma. The results from the REVEAL HBV study were true for HbeAg positive and negative participants, but most participants in this study were HbeAg negative. Additional analysis from the REVEAL-HBV study found that persistently elevated levels of serum HBV DNA increase the risk of hepatocellular carcinoma. This was the only example of an analysis which examined serum HBV DNA at more than one time point. Two other studies reported that serum HBV DNA levels were the strongest prognostic factor for hepatocellular carcinoma among patients with HBV-related cirrhosis.
Results from another study indicated that patient survival is increased when serum HBV DNA are low at diagnosis of hepatocellular carcinoma. Two studies provided evidence that increased levels of serum HBV DNA is the most significant prognostic factor for recurrence after hepatocellular carcinoma resection. One study reported that patients who had spontaneous HBV DNA seroconversion (sustained or not sustained) had an increased risk of hepatocellular carcinoma death. Lower levels of serum HBV DNA were also found to be associated with a reduced risk of hepatocellular carcinoma death.
Considered together, the data presented in these studies indicate that serum HBV DNA measurement, even at one time point, is an important prognostic factor of long term

108 Hepatitis B virus DNA testing
chronic hepatitis B clinical outcomes. Further research is required to establish if changes in patient management in response to serum HBV DNA testing result in improved long term outcomes.
Cost-effectiveness
Listing the HBV DNA test on the MBS, would increase the costs of initial assessment of patients presenting with HBV (one test), as well as for the monitoring of patients on drug- or non-drug treatment (three or four test for patients on antivirals or interferon; one test per year for patients not on drug treatment). Each test would cost Medicare Australia about $130.
The overall budget impact is estimated to be at $2.5 million in the first year and is expected to increase slightly over time, reaching $2.7 million in the third year after listing. This increase is caused by an expected increase of patients to be monitored while on drug treatment. The presented calculations were based on conservative estimates of future interferon treatment uptake and there was potential for underestimation.
The HBV DNA test is also beneficial in detecting the development of drug resistance earlier than it would be possible with serological testing only. An earlier switch to other drug treatment options would result in costs incurred to the PBS earlier than without HBV DNA testing, which might have an increasing effect on annual PBS budget in the first year after funding the HBV DNA test under the MBS. On the other hand, the PBS could be positively affected as patients inadequately treated for HBV infection (tested negative for HBV DNA) could be taken off unnecessary drug treatment. In case HBV DNA testing picks up more patients with drug resistance, there would be an overall increase in the PBS budget.
Improvements in the detection of drug resistance can be expected to contribute to improved management of chronic hepatitis B patients, considering that disease progression might be influenced positively and complications could be avoided. Considering the advanced stages of chronic hepatitis B infection are shown to be more expensive to treat, avoiding disease progression or complications could potentially create substantial savings for Medicare Australia as well as other healthcare funders.

Hepatitis B virus DNA testing 109
Recommendation
MSAC has considered the safety, effectiveness and cost effectiveness of the use of hepatitis B assays in the pre-treatment assessment and in the monitoring of patients with chronic hepatitis B.
MSAC finds there is sufficient evidence of the safety, effectiveness and cost effectiveness of hepatitis B assay in the pre-treatment and in the monitoring of patients with chronic hepatitis B.
MSAC recommends that public funding be provided for the use of hepatitis B assay in patients with chronic hepatitis B.
MSAC further recommends that the number of hepatitis B assays for pre-treatment assessment or for the monitoring of patients with chronic hepatitis B who are not on antiviral therapy be restricted to one assay in a twelve month period and for patients on antiviral therapy the number of assays be restricted to four assays in a twelve month period.
–The Minister for Health and Ageing accepted this recommendation on 4 June 2007–
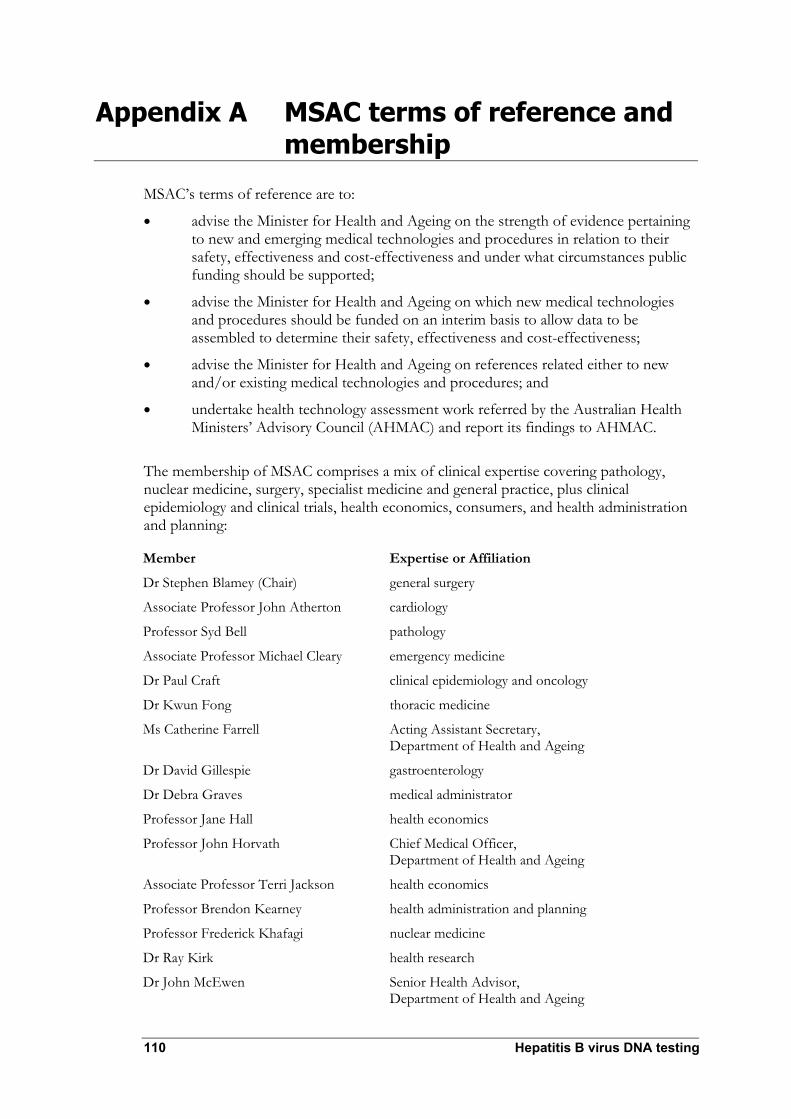
110 Hepatitis B virus DNA testing
Appendix A MSAC terms of reference and membership
MSAC’s terms of reference are to:
• advise the Minister for Health and Ageing on the strength of evidence pertaining to new and emerging medical technologies and procedures in relation to their safety, effectiveness and cost-effectiveness and under what circumstances public funding should be supported;
• advise the Minister for Health and Ageing on which new medical technologies and procedures should be funded on an interim basis to allow data to be assembled to determine their safety, effectiveness and cost-effectiveness;
• advise the Minister for Health and Ageing on references related either to new and/or existing medical technologies and procedures; and
• undertake health technology assessment work referred by the Australian Health Ministers’ Advisory Council (AHMAC) and report its findings to AHMAC.
The membership of MSAC comprises a mix of clinical expertise covering pathology, nuclear medicine, surgery, specialist medicine and general practice, plus clinical epidemiology and clinical trials, health economics, consumers, and health administration and planning:
Member Expertise or Affiliation Dr Stephen Blamey (Chair) general surgery
Associate Professor John Atherton cardiology
Professor Syd Bell pathology
Associate Professor Michael Cleary emergency medicine
Dr Paul Craft clinical epidemiology and oncology
Dr Kwun Fong thoracic medicine
Ms Catherine Farrell Acting Assistant Secretary, Department of Health and Ageing
Dr David Gillespie gastroenterology
Dr Debra Graves medical administrator
Professor Jane Hall health economics
Professor John Horvath Chief Medical Officer, Department of Health and Ageing
Associate Professor Terri Jackson health economics
Professor Brendon Kearney health administration and planning
Professor Frederick Khafagi nuclear medicine
Dr Ray Kirk health research
Dr John McEwen Senior Health Advisor, Department of Health and Ageing

Hepatitis B virus DNA testing 111
Associate Professor Donald Perry-Keene endocrinology
Dr Ewa Piejko general practice
Mrs Sheila Rimmer consumer health issues
Professor Ken Thomson radiology
Dr Douglas Travis urology
Dr Mary Turner Australian Health Ministers’ Advisory Council representative
Dr David Wood orthopaedic sugery

112 Hepatitis B virus DNA testing
Appendix B Advisory panel
Advisory panel for MSAC application 1096 Hepatitis B DNA testing for chronic hepatitis B
Professor Syd Bell (Chair) Area Director of Microbiology South East Sydney Area Health Service NSW
Chair and MSAC member
Professor Peter Angus Medical Director Liver Transplant Unit Austin and Repatriation Medical Centre Heidelberg, Victoria
Co-opted member
Mr Martyn Goddard Australian Hepatitis Council nominee Hobart, Tasmania
Co-opted member
Dr Debra Graves Chief Executive Officer Royal College of Pathologists of Australasia Surry Hills, NSW
MSAC member
Dr Geoff Higgins Chief Pathologist Infectious Diseases Laboratories Institute of Medical and Veterinary Science Adelaide, South Australia
Co-opted member
Ms Sharyn McGregor Director Hepatitis C Section Department of Health and Ageing
Hepatitis C Section Department of Health and Ageing
Dr Janney Wale Consumer representative Claremont, Western Australia
Consumers’ Health Forum of Australia nominee
Dr Katrina Watson Gastroenterologist St Vincent’s Hospital Melbourne, Victoria
Co-opted member

Hepatitis B virus DNA testing 113
Evaluators for MSAC application 1096
Dr John Gillespie BSc (Hons) PhD
M-TAG Pty Ltd A unit of IMS Health
Ms Antje Smala BAgEng (Hons) BEng (Hons)
M-TAG Pty Ltd A unit of IMS Health
Dr Nathan Walters BSc (Hons) PhD
M-TAG Pty Ltd A unit of IMS Health
Dr Liesl Birinyi-Strachan BSc (Hons) PhD
M-TAG Pty Ltd A unit of IMS Health

114 Hepatitis B virus DNA testing
Appendix C Studies included in the review
Table 41 presents characteristics and results extracted from studies that assessed the additional value of HBV DNA testing compared with current clinical practice.
Table 42 presents characteristics and results extracted from studies that assessed the value of serum HBV DNA levels in the initial assessment and monitoring of patients not undergoing antiviral therapy.
Table 43 presents characteristics and results extracted from studies that assessed the predictive value of HBV DNA testing of patients undergoing antiviral therapy.
The systematic review presented in Table 44 investigated the relationship between serum HBV DNA levels and clinical outcomes.
Table 45 presents the characteristics and results extracted from primary studies that evaluated the relationship between HBV DNA levels and clinical outcomes.

Tabl
e 41
Char
acte
ristic
s and
resu
lts o
f stu
dies
asse
ssin
g th
e add
ition
al va
lue o
f HBV
DNA
test
ing
on p
atien
t out
com
es
Stud
y (ye
ar)
Coun
try
Stud
y des
ign
Popu
latio
n (N
) Ot
her t
ests
Te
st
char
acte
ristic
s Tr
eatm
ent
Resu
lts
Stud
y qua
lity
Chan
(200
2)
China
Co
hort
study
: 19
83–2
000
Pros
pecti
ve da
ta co
llecti
on fr
om
Janu
ary 1
996
Uncle
ar pa
tient
enro
lmen
t
Perio
d I c
ohor
t (19
83 to
1995
): HB
sAg
posit
ive tr
ansp
lant p
atien
ts (n
= 52
) Pe
riod
II coh
ort (
1996
to 20
00):
HBsA
g po
sitive
de
novo
tran
splan
t pati
ents
(n =
15)
HBsA
g ne
gativ
e coh
ort (
1983
to 20
00)a :
(n =
442)
Ex
clusio
ns: a
nti-h
epati
tis C
posit
ive
(anti
bodie
s; sig
nifica
nt alc
ohol
cons
umpti
on;
cirrh
osis
on bi
opsy
; dec
ompe
nsate
d live
r dis
ease
ALT;
alka
line
phos
phata
se;
γ-glut
amyl
trans
pepti
dase
; an
d bilir
ubinb
Proth
romb
in tim
e; HB
eAg/a
nti-
HBeA
g stat
us;
anti-h
ep D
; live
r bio
psy
(cons
entin
g pa
tients
only—
not
oblig
atory
criter
ion fo
r lam
ivudin
e tre
atmen
t).
Furth
er te
sts N
R
Inde
x tes
t: Di
gene
Hy
brid
Captu
re II
assa
y. Se
nsitiv
ity
limit o
f 1.4
x 105
copie
s/mLb
Com
para
tor:
ALT
(deta
ils N
R)
Lami
vudin
e (10
0 mg/d
ay)
begu
n if:
- el
evate
d HBV
DNA
leve
ls (>
2.83 x
108 c
opies
/mL)
or
- el
evate
d HBV
DNA
leve
ls (>
2.83 x
107 c
opies
/mL)
wi
th ab
norm
al AL
T/liv
er
biops
y spe
cimen
Pe
riod
I: Tre
atmen
t initia
ted
for el
evate
d HBV
DNA
(n =
7);
treatm
ent in
itiated
for e
levate
d HB
V DN
A wi
th ab
norm
al AL
T/liv
er bi
opsy
spec
imen
(n
= 8)
; pati
ents
with
pre-
empti
ve la
mivu
dine t
reatm
entc
(n =
15d)
Pe
riod
II: Tr
eatm
ent in
itiated
on
elev
ated H
BV D
NA (n
= 5)
; tre
atmen
t initia
ted fo
r elev
ated
HBV
DNA
with
abno
rmal
ALT/
liver
biop
sy sp
ecim
en
(n =
6); p
atien
ts wi
th pr
e-em
ptive
lami
vudin
e tre
atmen
tc
(n =
11e)
Surv
ivalf,g
: Per
iod I 1
00%
; Pe
riod
II 73%
RR
of d
eath
(95%
CI)h :
Perio
d I 9
.7 (4
.7, 19
.9);
Perio
d II N
R RR
of l
iver r
elate
d de
ath
(95%
CI)h :
Pe
riod
I 68.0
(8.7–
533.2
); Pe
riod
II NR
Trea
tmen
t dur
atio
n (w
eeks
) unt
il und
etec
tabl
e HB
V DN
A:
Perio
d I 6
.4 (S
D 2.1
, ran
ge
3–10
) Pe
riod
II 6.4
(SD
4.0, r
ange
3–
14)
Trea
tmen
t dur
atio
n (w
eeks
) unt
il ALT
no
rmali
satio
n:
Perio
d I 1
4.5 (S
D 11
.5,
rang
e 1–3
9)
Perio
d II 1
5.6 (S
D 12
.2,
rang
e 5–3
8)
Poss
ible s
electi
on
bias:
Coho
rt stu
dy,
patie
nt se
lectio
n not
rand
omise
d Po
ssibl
e non
-co
nsec
utive
re
cruitm
ent
Appli
cabil
ity:
Appli
cabil
ity of
HBV
DN
A tes
ting
regim
en to
Au
strali
an cl
inica
l pr
actic
e unk
nown
Hepatitis B virus DNA testing 115

Stud
y (ye
ar)
Coun
try
Stud
y des
ign
Popu
latio
n (N
) Ot
her t
ests
Te
st
char
acte
ristic
s Tr
eatm
ent
Resu
lts
Stud
y qua
lity
Lamp
ertic
o (20
05)
Italy
Coho
rt stu
dy:
1997
–200
3 Pr
ospe
ctive
pa
tient
enro
lmen
t (co
nsec
utive
NR)
HBeA
g-ne
gativ
e dur
ing pr
eviou
s 12 m
onths
; ≥1
8 yea
rs; H
BsAg
carri
ers;
with
histol
ogica
l or
clinic
al dia
gnos
is of
chro
nic he
patiti
s or
cirrh
osis.
Unr
espo
nsive
to or
did n
ot me
et the
cri
teria
for in
terfer
on th
erap
y Pa
tients
deve
loping
lami
vudin
e res
istan
ce
Phen
otyp
ic re
sista
nt co
hort
(n =
46)
Geno
type D
92%
(of 3
9 tes
ted);
pre-
Adefo
vir
seru
m HB
V DN
A lev
els (lo
g 10 c
opies
/mL)
, me
dian 7
.3, ra
nge 4
.3–9.3
; Pre
-Ade
fovir
seru
m AL
T lev
els (I
U/mL
), me
dian 1
45, r
ange
42
–287
0 Ge
noty
pic re
sista
nce c
ohor
t (n =
28)
Geno
type D
94%
(of 1
7 tes
ted);
Pre-
Adefo
vir
seru
m HB
V DN
A lev
els (lo
g 10 c
opies
/mL)
, me
dian 4
.5, ra
nge 3
.4–5.9
; Pre
-Ade
fovir
seru
m AL
T lev
els (I
U/mL
), me
dian 3
8, ra
nge
20–7
0
HbeA
g; an
ti-HB
eAg;
Histo
logica
l or
clinic
al as
sess
ment
of ch
ronic
hepa
titis
B or
cirrh
osis
Inde
x tes
t: Ve
rsant
3.0 (b
DNA)
, Bay
er.
Sens
itivity
limit o
f 20
00 co
pies/m
Lor
3.3 lo
g 10 c
opies
/mL.
Seru
m HB
V DN
A as
saye
d eve
ry 2
month
s Co
mpa
rato
r: AL
T (st
anda
rd la
bora
tory
proc
edur
es, fu
rther
de
tails
NR)
Lami
vudin
e (10
0 mg/d
ay);
adefo
vir 10
mg (
orall
y) ad
ded
to lam
ivudin
e mon
other
apy
Phen
otyp
ic re
sista
nt co
hort:
Ad
efovir
adde
d 33 m
onths
i (a
vera
ge) a
fter la
mivu
dine
initia
tion
Geno
typi
c res
istan
ce co
hort:
Ad
efovir
adde
d 41 m
onths
i (a
vera
ge) a
fter la
mivu
dine
initia
tion
Resp
onse
k : Ph
eno 4
6%;
Geno
100%
Se
rum
ALT
nor
mali
satio
nl : Ph
eno 3
mon
ths 37
%, 6
mo
nths 5
0%, 2
4 mon
ths
93%
; Gen
o 10
0%
2 yea
r clea
ranc
e rat
e of
seru
m H
BV D
NA: P
heno
78
%; G
eno 1
00%
On
set o
f ade
fovir
re
sista
ncem
: Phe
no 0%
; Ge
no 0%
Poten
tial fo
r bias
: pa
tients
who
wer
e tre
ated u
sing
adefo
vir at
diffe
rent
stage
s of
lamivu
dine
resis
tance
wer
e not
rand
omise
d No
n-co
nsec
utive
re
cruitm
ent
Comp
arato
r tes
t not
inter
prete
d ind
epen
dentl
y of
HBV
DNA
test
Redu
ced
appli
cabil
ity: le
ss
frequ
ent H
BV D
NA
testin
g in A
ustra
lian
clinic
al pr
actic
e Ab
brev
iation
s: AL
T, al
anine
amino
trans
feras
e; HB
V DN
A, he
patiti
s B vi
rus d
eoxy
ribon
uclei
c acid
; NR,
not r
epor
ted; R
R, re
lative
risk;
SD, s
tanda
rd de
viatio
n a A
ccep
tance
crite
ria fo
r ren
al tra
nspla
nt pa
tients
did n
ot ch
ange
betw
een 1
983–
2000
b T
estin
g sch
edule
: (1)
Eve
ry 2 t
o 4 w
ks (a
) for
the f
irst 1
2 mon
ths af
ter tr
ansp
lantat
ion on
: (b)
for 4
mon
ths af
ter pu
lse st
eroid
and/o
r anti
-lymp
hocy
te the
rapy
for a
cute
rejec
tion;
(c) w
hen s
erial
HBV
DNA
leve
ls sh
ow in
creas
ing
trend
; (d)
durin
g tre
atmen
t with
lami
vudin
e. (2
) Eve
ry 4 m
onths
in cl
inica
lly st
able
long t
erm
rena
l allo
graft
recip
ients
on lo
w-do
se im
muno
supp
ress
ive m
edica
tions
c P
eriod
1 pa
tients
: Lam
ivudin
e tre
atmen
t star
ted 71
+/–
27 m
onths
(ran
ge 15
to 11
8) af
ter tr
ansp
lantat
ion; P
eriod
II pa
tients
: Lam
ivudin
e tre
atmen
t star
ted 71
+/–
27 m
onths
(ran
ge 1
to 18
) afte
r tra
nspla
ntatio
n. Du
ratio
n of
lamivu
dine t
hera
py w
as 36
.3 +/
– 11.4
mon
ths an
d 32.6
+/–
13.3
month
s for
Per
iod I a
nd P
eriod
II pa
tients
resp
ectiv
ely (p
= 0.
118)
d O
f the 5
2 per
iod I p
atien
ts, 14
died
befor
e Jan
uara
ry 19
96. O
f the r
emain
ing 38
patie
nts, 1
5 sati
sfied
the c
riteria
for p
re-e
mptiv
e lam
ivudin
e tre
atmen
t e O
f the 1
5 per
iod II
patie
nts, 3
wer
e late
refer
rals
who r
eceiv
ed la
mivu
dine a
s salv
age t
hera
py af
ter th
e dev
elopm
ent o
f live
r dec
ompe
nsati
on. T
hese
patie
nts w
ere e
xclud
ed fr
om be
twee
n-gr
oup c
ompa
rison
s f R
enal
allog
raft s
urviv
al wa
s sim
ilar b
etwee
n eac
h coh
ort a
nd H
BsAg
nega
tive p
atien
ts, irr
espe
ctive
of la
mivu
dine t
hera
py
g For
perio
d 1 pa
tients
this
value
for s
urviv
al re
fers t
o the
perio
d befo
re Ja
nuar
y 199
6. Tw
o othe
r pati
ents
(not
treate
d with
lami
vudin
e) di
ed fr
om no
n-liv
er re
lated
caus
es af
ter Ja
nuar
y 199
6 h R
elativ
e risk
s com
pare
d with
HBs
Ag ne
gativ
e ren
al tra
nspla
nt pa
tients
i P
heno
typic
resis
tance
defin
ed as
high
leve
ls of
HBV
DNA
(>6 l
og10
copie
s/mL)
and h
igh A
LT le
vels
(not
repo
rted b
y stud
y) j B
ecau
se ge
notyp
ic re
sistan
ce is
iden
tified
befor
e phe
notyp
ic re
sistan
ce it
is su
spec
ted th
at the
timing
of ad
efovir
addit
ion to
ther
apy h
as no
t bee
n rep
orted
corre
ctly i
n this
stud
y and
that
adefo
vir tr
eatm
ent w
as be
gun a
t 33
month
s for
the g
enoty
pic re
sistan
t coh
ort a
nd at
41 m
onths
for t
he ph
enoty
pic re
sistan
t coh
ort
k Pati
ents
(%) w
ith un
detec
table
seru
m HB
V DN
A aft
er 3
month
s l P
atien
ts (%
) with
grea
ter th
an 1
log re
boun
d of s
erum
HBV
DNA
comp
ared
with
on-tr
eatm
ent (
adefo
vir ad
dition
) nad
ir.
m Non
e of 1
0 pati
ents
with
detec
table
seru
m HB
V DN
A at
the en
d of th
e stud
y had
adefo
vir-re
lated
muta
tions
, rtN
236T
AND
rtA1
81V
116 Hepatitis B virus DNA testing
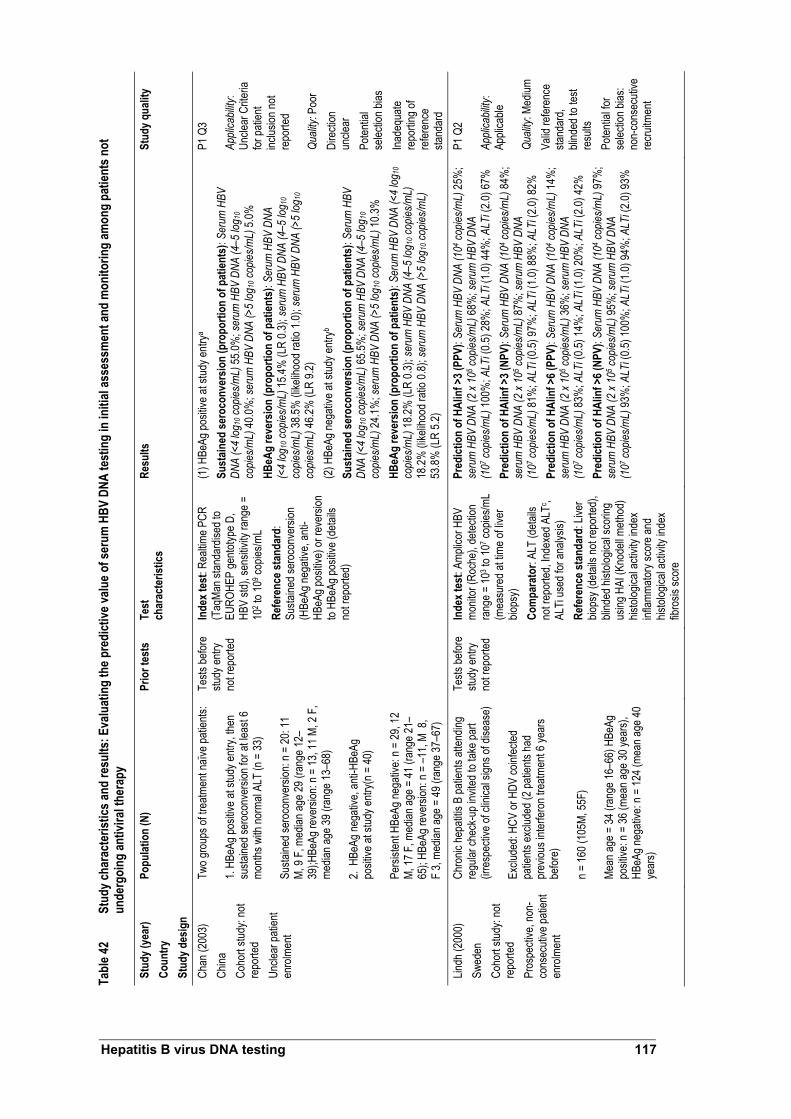
Tabl
e 42
Stud
y cha
ract
erist
ics an
d re
sults
: Eva
luat
ing
the p
redi
ctive
valu
e of s
erum
HBV
DNA
test
ing
in in
itial
asse
ssm
ent a
nd m
onito
ring
amon
g pa
tient
s not
un
derg
oing
antiv
iral t
hera
py
Stud
y (ye
ar)
Coun
try
Stud
y des
ign
Popu
latio
n (N
) Pr
ior t
ests
Te
st
char
acte
ristic
s Re
sults
St
udy q
ualit
y
Chan
(200
3)
China
Co
hort
study
: not
repo
rted
Uncle
ar pa
tient
enro
lmen
t
Two g
roup
s of tr
eatm
ent n
aïve p
atien
ts: 1.
HBeA
g pos
itive a
t stud
y entr
y, the
n su
staine
d ser
ocon
versi
on fo
r at le
ast 6
mo
nths w
ith no
rmal
ALT
(n =
33)
Susta
ined s
eroc
onve
rsion
: n =
20: 1
1 M,
9 F,
med
ian ag
e 29 (
rang
e 12–
39);H
BeAg
reve
rsion
: n =
13, 1
1 M, 2
F,
media
n age
39 (r
ange
13–6
8)
2. H
BeAg
nega
tive,
anti-H
BeAg
po
sitive
at st
udy e
ntry(n
= 40
) Pe
rsiste
nt HB
eAg n
egati
ve: n
= 29
, 12
M, 17
F, m
edian
age =
41 (r
ange
21–
65);
HBeA
g rev
ersio
n: n =
–11,
M 8,
F
3, me
dian a
ge =
49 (r
ange
37–6
7)
Tests
befor
e stu
dy en
try
not r
epor
ted
Inde
x tes
t: Re
altim
e PCR
(T
aqMa
n stan
dard
ised t
o EU
ROHE
P ge
ntotyp
e D,
HBV
std),
sens
itivity
rang
e =
102 t
o 109 c
opies
/mL
Refe
renc
e sta
ndar
d:
Susta
ined s
eroc
onve
rsion
(H
BeAg
nega
tive,
anti-
HBeA
g pos
itive)
or re
versi
on
to HB
eAg p
ositiv
e (de
tails
not r
epor
ted)
(1) H
BeAg
posit
ive at
stud
y entr
ya
Sust
ained
sero
conv
ersio
n (p
ropo
rtion
of p
atien
ts):
Seru
m H
BV
DNA
(<4
log10
copie
s/mL)
55.0%
; ser
um H
BV D
NA (4
–5 lo
g 10
copie
s/mL)
40.0%
; ser
um H
BV D
NA (>
5 log
10 co
pies/m
L) 5.
0%
HBeA
g re
vers
ion
(pro
porti
on o
f pat
ients
): Se
rum
HBV
DNA
(<
4 log
10 co
pies/m
L) 15
.4% (L
R 0.3
); se
rum
HBV
DNA
(4–5
log 1
0 co
pies/m
L) 38
.5% (li
kelih
ood r
atio 1
.0); s
erum
HBV
DNA
(>5
log10
co
pies/m
L) 46
.2% (L
R 9.2
) (2
) HBe
Ag ne
gativ
e at s
tudy e
ntryb
Sust
ained
sero
conv
ersio
n (p
ropo
rtion
of p
atien
ts):
Seru
m H
BV
DNA
(<4
log10
copie
s/mL)
65.5%
; ser
um H
BV D
NA (4
–5 lo
g 10
copie
s/mL)
24.1%
; ser
um H
BV D
NA (>
5 log
10 co
pies/m
L) 10
.3%
HBeA
g re
vers
ion
(pro
porti
on o
f pat
ients
): Se
rum
HBV
DNA
(<4
log10
co
pies/m
L) 18
.2% (L
R 0.3
); se
rum
HBV
DNA
(4–5
log 1
0 cop
ies/m
L)
18.2%
(like
lihoo
d rati
o 0.8)
; ser
um H
BV D
NA (>
5 log
10 co
pies/m
L)
53.8%
(LR
5.2)
P1 Q
3 Ap
plica
bility
: Un
clear
Crite
ria
for pa
tient
inclus
ion no
t re
porte
d Qu
ality:
Poo
r Di
recti
on
uncle
ar
Poten
tial
selec
tion b
ias
Inade
quate
re
portin
g of
refer
ence
sta
ndar
d Lin
dh (2
000)
Sw
eden
Co
hort
study
: not
repo
rted
Pros
pecti
ve, n
on-
cons
ecuti
ve pa
tient
enro
lmen
t
Chro
nic he
patiti
s B pa
tients
atten
ding
regu
lar ch
eck-u
p inv
ited t
o tak
e par
t (ir
resp
ectiv
e of c
linica
l sign
s of d
iseas
e) Ex
clude
d: HC
V or
HDV
coinf
ected
pa
tients
exclu
ded (
2 pati
ents
had
prev
ious i
nterfe
ron t
reatm
ent 6
year
s be
fore)
n =
160 (
105M
, 55F
) Me
an ag
e = 34
(ran
ge 16
–66)
HBe
Ag
posit
ive: n
= 36
(mea
n age
30 ye
ars),
HB
eAg n
egati
ve: n
= 12
4 (me
an ag
e 40
year
s)
Tests
befor
e stu
dy en
try
not r
epor
ted
Inde
x tes
t: Am
plico
r HBV
mo
nitor
(Roc
he),
detec
tion
rang
e = 10
3 to 1
07 cop
ies/m
L (m
easu
red a
t time
of liv
er
biops
y) Co
mpa
rato
r: AL
T (d
etails
no
t rep
orted
, Inde
xed A
LTc ,
ALTi
used
for a
nalys
is)
Refe
renc
e sta
ndar
d: Li
ver
biops
y (de
tails
not r
epor
ted),
blind
ed hi
stolog
ical s
corin
g us
ing H
AI (K
node
ll meth
od)
histol
ogica
l acti
vity i
ndex
inf
lamma
tory s
core
and
histol
ogica
l acti
vity i
ndex
fib
rosis
scor
e
Pred
ictio
n of
HAI
inf >
3 (PP
V): S
erum
HBV
DNA
(104 c
opies
/mL)
25%
; se
rum
HBV
DNA
(2 x
105 c
opies
/mL)
68%
; ser
um H
BV D
NA
(107 c
opies
/mL)
100%
; ALT
i (0.5)
28%
; ALT
i (1.0)
44%
; ALT
i (2.0)
67%
Pr
edict
ion
of H
AIin
f >3 (
NPV)
: Ser
um H
BV D
NA (1
04 cop
ies/m
L) 84
%;
seru
m H
BV D
NA (2
x 10
5 cop
ies/m
L) 87
%; s
erum
HBV
DNA
(1
07 cop
ies/m
L) 81
%; A
LTi (0
.5) 97
%; A
LTi (1
.0) 88
%; A
LTi (2
.0) 82
%
Pred
ictio
n of
HAI
inf >
6 (PP
V): S
erum
HBV
DNA
(104 c
opies
/mL)
14%
; se
rum
HBV
DNA
(2 x
105 c
opies
/mL)
36%
; ser
um H
BV D
NA
(107 c
opies
/mL)
83%
; ALT
i (0.5)
14%
; ALT
i (1.0)
20%
; ALT
i (2.0)
42%
Pr
edict
ion
of H
AIin
f >6 (
NPV)
: Ser
um H
BV D
NA (1
04 cop
ies/m
L) 97
%;
seru
m H
BV D
NA (2
x 10
5 cop
ies/m
L) 95
%; s
erum
HBV
DNA
(1
07 cop
ies/m
L) 93
%; A
LTi (0
.5) 10
0%; A
LTi (1
.0) 94
%; A
LTi (2
.0) 93
%
P1 Q
2 Ap
plica
bility
: Ap
plica
ble
Quali
ty: M
edium
Va
lid re
feren
ce
stand
ard,
blind
ed to
test
resu
lts
Poten
tial fo
r se
lectio
n bias
: no
n-co
nsec
utive
re
cruitm
ent
Hepatitis B virus DNA testing 117
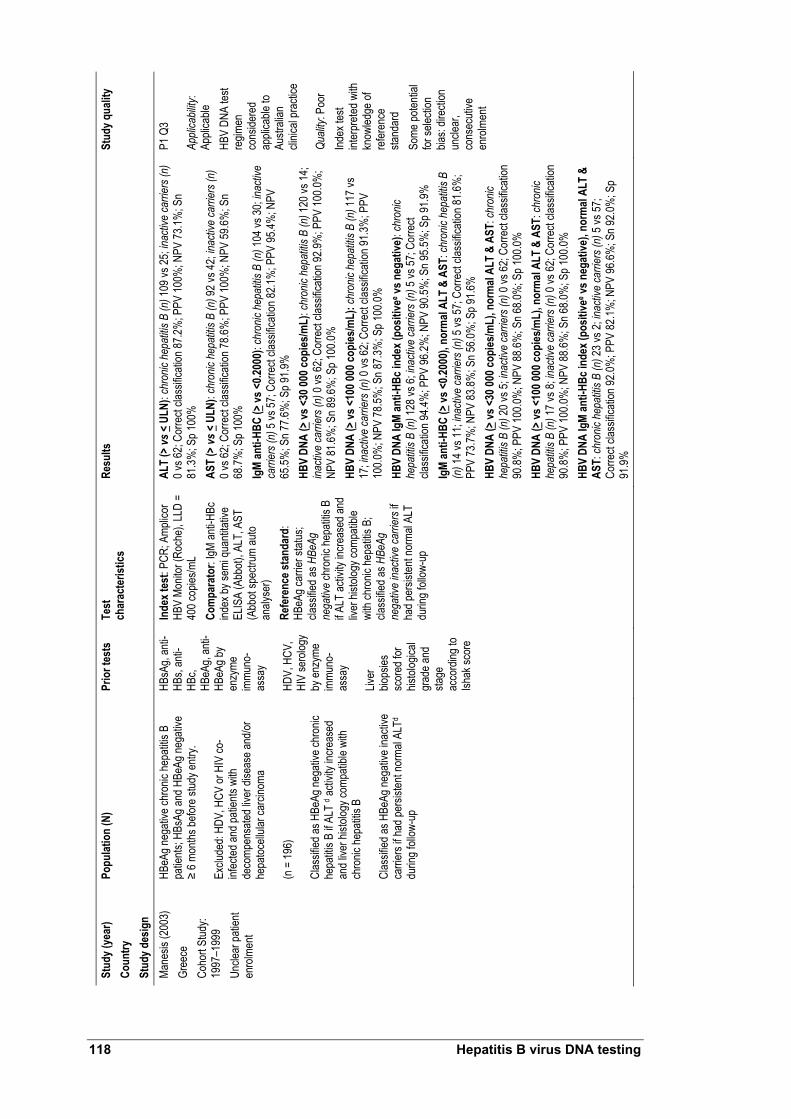
Stud
y (ye
ar)
Coun
try
Stud
y des
ign
Popu
latio
n (N
) Pr
ior t
ests
Te
st
char
acte
ristic
s Re
sults
St
udy q
ualit
y
Mane
sis (2
003)
Gr
eece
Co
hort
Stud
y: 19
97–1
999
Uncle
ar pa
tient
enro
lmen
t
HBeA
g neg
ative
chro
nic he
patiti
s B
patie
nts; H
BsAg
and H
BeAg
nega
tive
≥ 6 m
onths
befor
e stud
y entr
y. Ex
clude
d: HD
V, H
CV or
HIV
co-
infec
ted an
d pati
ents
with
deco
mpen
sated
liver
dise
ase a
nd/or
he
patoc
ellula
r car
cinom
a (n
= 19
6)
Clas
sified
as H
BeAg
nega
tive c
hron
ic he
patiti
s B if
ALT
d acti
vity i
ncre
ased
an
d live
r hist
ology
comp
atible
with
ch
ronic
hepa
titis B
Cl
assif
ied as
HBe
Ag ne
gativ
e ina
ctive
ca
rrier
s if h
ad pe
rsiste
nt no
rmal
ALTd
durin
g foll
ow-u
p
HBsA
g, an
ti-HB
s, an
ti-HB
c, HB
eAg,
anti-
HBeA
g by
enzy
me
immu
no-
assa
y HD
V, H
CV,
HIV
sero
logy
by en
zyme
im
muno
-as
say
Liver
bio
psies
sc
ored
for
histol
ogica
l gr
ade a
nd
stage
ac
cord
ing to
Ish
ak sc
ore
Inde
x tes
t: PC
R; A
mplic
or
HBV
Monit
or (R
oche
), LL
D =
400 c
opies
/mL
Com
para
tor:
IgM an
ti-HBc
ind
ex by
semi
quan
titativ
e EL
ISA
(Abb
ot), A
LT, A
ST
(Abb
ot sp
ectru
m au
to an
alyse
r) Re
fere
nce s
tand
ard:
HB
eAg c
arrie
r stat
us;
class
ified a
s HBe
Ag
nega
tive c
hron
ic he
patiti
s B
if ALT
activ
ity in
creas
ed an
d liv
er hi
stolog
y com
patib
le wi
th ch
ronic
hepa
titis B
; cla
ssifie
d as H
BeAg
ne
gativ
e ina
ctive
carri
ers i
f ha
d per
sisten
t nor
mal A
LT
durin
g foll
ow-u
p
ALT
(> vs
< UL
N): c
hron
ic he
patiti
s B (n
) 109
vs 25
; inac
tive
carri
ers (
n)
0 vs 6
2; Co
rrect
class
ificati
on 87
.2%; P
PV 10
0%; N
PV 73
.1%; S
n 81
.3%; S
p 100
%
AST
(> vs
< UL
N): c
hron
ic he
patiti
s B (n
) 92 v
s 42;
inacti
ve ca
rrier
s (n)
0 v
s 62;
Corre
ct cla
ssific
ation
78.6%
; PPV
100%
; NPV
59.6%
; Sn
68.7%
; Sp 1
00%
Ig
M an
ti-HB
C (>
vs <0
.2000
): ch
ronic
hep
atitis
B (n
) 104
vs 30
; inac
tive
carri
ers (
n) 5
vs 57
; Cor
rect
class
ificati
on 82
.1%; P
PV 95
.4%; N
PV
65.5%
; Sn 7
7.6%
; Sp 9
1.9%
HB
V DN
A (>
vs <3
0 000
copi
es/m
L): c
hron
ic he
patiti
s B (n
) 120
vs 14
; ina
ctive
carri
ers (
n) 0
vs 62
; Cor
rect
class
ificati
on 92
.9%; P
PV 10
0.0%
; NP
V 81
.6%; S
n 89.6
%; S
p 100
.0%
HBV
DNA
(> vs
<100
000 c
opies
/mL)
: chr
onic
hepa
titis B
(n) 1
17 vs
17
; inac
tive
carri
ers (
n) 0
vs 62
; Cor
rect
class
ificati
on 91
.3%; P
PV
100.0
%; N
PV 78
.5%; S
n 87.3
%; S
p 100
.0%
HBV
DNA
IgM
anti-
HBc i
ndex
(pos
itive
e vs n
egat
ive):
chro
nic
hepa
titis B
(n) 1
28 vs
6; in
activ
e ca
rrier
s (n)
5 vs
57; C
orre
ct cla
ssific
ation
94.4%
; PPV
96.2%
; NPV
90.5%
; Sn 9
5.5%
; Sp 9
1.9%
Ig
M an
ti-HB
C (>
vs <0
.2000
), no
rmal
ALT
& AS
T: ch
ronic
hep
atitis
B
(n) 1
4 vs 1
1; ina
ctive
carri
ers (
n) 5
vs 57
; Cor
rect
class
ificati
on 81
.6%
; PP
V 73
.7%; N
PV 83
.8%; S
n 56.0
%; S
p 91.6
%
HBV
DNA
(> vs
<30 0
00 co
pies
/mL)
, nor
mal
ALT
& AS
T: ch
ronic
he
patiti
s B (n
) 20 v
s 5; in
activ
e ca
rrier
s (n)
0 vs
62; C
orre
ct cla
ssific
ation
90
.8%; P
PV 10
0.0%
; NPV
88.6%
; Sn 6
8.0%
; Sp 1
00.0%
HB
V DN
A (>
vs <1
00 00
0 cop
ies/m
L), n
orm
al AL
T &
AST:
chro
nic
hepa
titis B
(n) 1
7 vs 8
; inac
tive
carri
ers (
n) 0
vs 62
; Cor
rect
class
ificati
on
90.8%
; PPV
100.0
%; N
PV 88
.6%; S
n 68.0
%; S
p 100
.0%
HBV
DNA
IgM
anti-
HBc i
ndex
(pos
itive
e vs n
egat
ive),
norm
al AL
T &
AST:
chro
nic h
epat
itis B
(n) 2
3 vs 2
; inac
tive
carri
ers (
n) 5
vs 57
; Co
rrect
class
ificati
on 92
.0%; P
PV 82
.1%; N
PV 96
.6%; S
n 92.0
%; S
p 91
.9%
P1 Q
3 Ap
plica
bility
: Ap
plica
ble
HBV
DNA
test
regim
en
cons
idere
d ap
plica
ble to
Au
strali
an
clinic
al pr
actic
e Qu
ality:
Poo
r Ind
ex te
st int
erpr
eted w
ith
know
ledge
of
refer
ence
sta
ndar
d So
me po
tentia
l for
selec
tion
bias:
direc
tion
uncle
ar,
cons
ecuti
ve
enro
lmen
t
118 Hepatitis B virus DNA testing

Stud
y (ye
ar)
Coun
try
Stud
y des
ign
Popu
latio
n (N
) Pr
ior t
ests
Te
st
char
acte
ristic
s Re
sults
St
udy q
ualit
y
Peng
(200
3)
China
Co
hort
Stud
y: 19
98–2
000
Pros
pecti
ve pa
tient
enro
lmen
t (no
n-co
nsec
utive
test-
base
d enr
olmen
t)
HBsA
g pos
itive;
anti-H
Bs ne
gativ
e; no
an
tivira
l immu
nosu
ppre
ssive
ther
apy
durin
g per
iod ≥
6 mo b
efore
stud
y.
No im
muno
comp
romi
sing d
iseas
es.
Hepa
titis A
, E, C
or D
viru
s co-
infec
ted
or ot
her li
ver d
iseas
e pati
ents
exclu
ded
(n =
743)
HB
eAg p
ositiv
e = 64
.1%; H
BeAg
ne
gativ
e = 35
.9%. H
BeAg
posit
ive
grou
p (27
.1+/-
8.3 ye
ars)
vs H
BeAg
ne
gativ
e gro
up (3
2.7+/
– 15.3
year
s) (p
<0.00
1).
Gend
er ra
tio: H
BeAg
psoit
ive vs
. HB
eAg n
egati
ve gr
oup:
413/6
3 vs
234/3
3 (M/
F)
(647
M, 9
6 F)
Patie
nts w
ith liv
er bi
opsy
spec
imen
s <1
.0 cm
not e
nroll
ed
HBsA
g;
anti-H
Bs
Inde
x tes
t: Do
t-blot
hy
bridi
satio
n-ba
sed,
in-
hous
e ass
ay, S
emi-
quan
titativ
e ran
ges:
<20,
20–
100,
100–
200,
200–
500,
500–
1000
and >
1000
pg/m
Lf Re
fere
nce s
tand
ard:
Live
r bio
psy:
Sure
cut n
eedle
s (1
6G x
70–9
0 mm)
, sp
ecim
ens f
orma
lin fix
ed,
para
ffin em
bedd
ed an
d sta
ined w
ith he
matox
ylin,
eosin
and r
eticu
lin. S
lides
re
ad bl
indly.
Hist
ologic
al sc
oring
using
HAI
(Kno
dell
metho
d) H
AIinf
(in
flamm
atory
scor
e) &
HA
Ifib (f
ibros
is sc
ore)
1. HB
eAg p
ositiv
e pati
ents
Diag
nost
ic pe
rform
ance
com
pare
d to
HAI
inf:
Seru
m H
BV D
NA
(<20
pg/m
L) LR
+ 1.0
0, LR
– 0.00
g ; Se
rum
HBV
DNA
(20–
100p
g/m
L) LR
+ 0.7
5, LR
– 4.84
; Ser
um H
BV D
NA (1
00–2
00pg
/mL)
LR+
0.44,
LR– 2
.86;
Seru
m H
BV D
NA (2
00–5
00pg
/mL)
LR+
0.24,
LR– 1
.61; S
erum
HBV
DN
A (5
00–1
000p
g/m
L) LR
+ 0.4
1, LR
– 1.10
; Ser
um H
BV D
NA
(>10
00pg
/mL)
LR+
0.35,
LR– 1
.03
Diag
nost
ic pe
rform
ance
com
pare
d to
HAI
fib: S
erum
HBV
DNA
(<
20pg
/mL)
LR+
1.00,
LR– 0
.00g ;
Seru
m H
BV D
NA (2
0–10
0pg/
mL)
LR+
0.70,
LR– 3
.83; S
erum
HBV
DNA
(100
–200
pg/m
L) LR
+ 0.3
9, LR
– 2.36
; Se
rum
HBV
DNA
(200
–500
pg/m
L) LR
+ 0.2
7, LR
– 1.41
; Ser
um H
BV
DNA
(500
–100
0pg/
mL)
LR+
0.49,
LR– 1
.07; S
erum
HBV
DNA
(>
1000
pg/m
L) LR
+ 0.7
7, LR
– 1.01
2.
HBeA
g neg
ative
patie
nts
Diag
nost
ic pe
rform
ance
com
pare
d to
HAI
inf:
Seru
m H
BV D
NA
(<20
pg/m
L) LR
+ 1.0
0, LR
– 0.00
g ; Se
rum
HBV
DNA
(20–
100p
g/m
L) LR
+ 2.1
5, LR
– 0.07
; Ser
um H
BV D
NA (1
00–2
00pg
/mL)
LR+
4.18,
LR– 0
.48;
Seru
m H
BV D
NA (2
00–5
00pg
/mL)
LR+
1.21,
LR– 0
.98; S
erum
HBV
DN
A (5
00–1
000p
g/m
L) LR
+ 0.2
6, LR
– 1.06
; Ser
um H
BV D
NA
(>10
00pg
/mL)
LR+
NR, L
R– no
t rep
orted
Di
agno
stic
perfo
rman
ce co
mpa
red
to H
AIfib
: Ser
um H
BV D
NA
(<20
pg/m
L) LR
+ 1.0
0, LR
– 0.00
g ; Se
rum
HBV
DNA
(20–
100p
g/m
L) LR
+ 1.6
5, LR
– 0.17
; Ser
um H
BV D
NA (1
00–2
00pg
/mL)
LR+
2.31,
LR– 0
.60;
Seru
m H
BV D
NA (2
00–5
00pg
/mL)
LR+
1.61,
LR– 0
.97; S
erum
HBV
DN
A (5
00–1
000p
g/m
L) LR
+ 0.0
0, LR
– 1.02
; Ser
um H
BV D
NA
(>10
00pg
/mL)
LR+
NR, L
R– no
t rep
orted
P2 Q
2 Ap
plica
bility
: Lim
ited
In-ho
use a
ssay
Qu
ality:
Med
ium
Poten
tial
selec
tion b
ias
Hepatitis B virus DNA testing 119

Stud
y (ye
ar)
Coun
try
Stud
y des
ign
Popu
latio
n (N
) Pr
ior t
ests
Te
st
char
acte
ristic
s Re
sults
St
udy q
ualit
y
Seo (
2005
) Ja
pan
Coho
rt stu
dy:
1989
–200
2 Re
trosp
ectiv
e pa
tient
enro
lmen
t (co
nsec
utive
NR)
chro
nic he
patiti
s B pa
tients
: HB
eAg n
egati
ve in
activ
e car
riers
(with
pe
rsiste
ntly n
orma
l ALT
leve
ls) (n
= 22
) HB
eAg n
egati
ve ch
ronic
hepa
titis B
(p
ersis
tent o
r inter
mitte
nt AL
T ele
vatio
n) (n
= 26
) Pa
tients
follo
wed u
p for
mea
n 51.5
mo
nths (
rang
e 5–1
57 m
onths
) and
see
ever
y 1–3
mon
ths
HBsA
g; an
ti-HB
s, Hb
eAg,
anti-
HBeA
g en
zyme
im
muno
assa
y (Di
anab
ot);
ALT
meas
urem
ent
NR
Inde
x tes
t: PC
R; A
mplic
or
HBV
Monit
or (R
oche
), de
tectio
n ran
ge =
103 t
o 107
copie
s/mL
Refe
renc
e sta
ndar
d:
HBeA
g car
rier s
tatus
; cla
ssifie
d as H
BeAg
ne
gativ
e ina
ctive
if HB
eAg –
ve an
d nor
mal A
LT;
class
ified a
s HBe
Ag
nega
tive
activ
e if H
BeAg
ne
gativ
e and
persi
stent
on
inter
mitte
nt AL
T ele
vatio
n
Seru
m H
BV D
NA (<
4.5 lo
g co
pies
/mL)
: One
time
point
h Sn 7
7%,
Sp 50
%; T
wo tim
e po
intsi S
n 80%
, Sp 7
1.4%
Se
rum
HBV
DNA
(<5 l
og co
pies
/mL)
: One
time
point
h Sn 8
2%,
Sp 45
%; T
wo tim
e po
intsi S
n 90%
, Sp 7
1.4%
Se
rum
HBV
DNA
(<5.5
log
copi
es/m
L): O
ne tim
e po
inth S
n 91%
, Sp
32%
; Two
time
point
si Sn 1
00%
, Sp 5
7.1%
Se
rum
HBV
DNA
(<6 l
og co
pies
/mL)
: One
time
point
h Sn 1
00%
, Sp
14%
; Two
time
point
si Sn 1
00%
, Sp 3
5.7%
P1 Q
3 Ap
plica
bility
: Ap
plica
ble
Quali
ty: P
oor
No B
lindin
g Po
tentia
l se
lectio
n bias
: pa
tient
selec
tion
criter
ia un
know
n, re
trosp
ectiv
e an
alysis
. Ab
brev
iation
s: AL
T, al
anine
amino
trans
feras
e; AL
Ti, in
dexe
d ALT
; AST
, asp
artat
e ami
notra
nsfer
ase;
chro
nic he
patiti
s B, c
hron
ic he
patiti
s B; E
UROH
EP, E
urop
ean c
once
rted a
ction
on vi
ral h
epati
tis; H
AI, h
istolo
gical
activ
ity
index
; HAI
inf, h
istolo
gical
activ
ity in
dex i
nflam
mator
y sco
re; H
AIfib
, hist
ologic
al ac
tivity
inde
x fibr
osis
scor
e; HB
V DN
A, he
patiti
s B vi
rus d
eoxy
ribon
uclei
c acid
; HBe
Ag, h
epati
tis B
viru
s e an
tigen
; HBs
Ag, h
epati
tis B
viru
s s
antig
en; H
CV, h
epati
tis C
viru
s; HD
V, he
patiti
s delt
a viru
s; HI
V, hu
man i
mmun
odefi
cienc
y viru
s; LR
, like
lihoo
d rati
o; NP
V, ne
gativ
e pre
dictiv
e valu
e; NR
, not
repo
rted;
PPV,
posit
ive pr
edict
ive va
lue; R
CT, r
ando
mise
d con
trolle
d tria
l; ROC
, rec
eiver
oper
ating
char
acter
istic;
Sn,
sens
itivity
; Sp,
spec
ificity
; ULN
, upp
er lim
it of n
orma
l a S
erum
HBV
DNA
leve
ls at
time o
f ser
ocon
versi
on
b Ser
um H
BV D
NA le
vels
at tim
e of s
tudy e
ntry
c ALT
i = A
LT di
vided
by up
per r
efere
nce v
alue (
URV;
0.8 µ
kat–1
for m
ales a
nd 0.
6 µka
t–1 fo
r fem
ales)
d Pati
ents
with
abno
rmal
ALT
levels
at ba
selin
e (>U
LN) f
ollow
ed by
mon
thly A
LT de
termi
natio
n., w
ith liv
er bi
opsy
if inc
reas
ed A
LT at
leas
t twice
. Pati
ents
with
norm
al AL
T fol
lowed
for a
t leas
t 24 m
onths
: ALT
teste
d eve
ry thr
ee
month
s for
first
two y
ears
and e
very
six m
onths
ther
eafte
r
e Pos
itive =
seru
m HB
V DN
A >
30 00
0 cop
ies/m
Lor I
gM an
ti-HBc
>0.2
00. A
ll othe
r cas
es co
nside
red n
egati
ve
f 1 pg
/mL =
3 x 1
05 cop
ies/m
L g W
hen t
he va
lue fo
r tru
e neg
ative
= 0,
this
has b
een a
djuste
d to 0
.1 to
allow
a me
aning
ful LR
– to b
e calc
ulated
h M
easu
red a
t the e
nd of
follo
w-up
(pati
ent m
onito
ring)
. HBe
Ag n
egati
ve in
activ
e pati
ents
(n =
22);
HBeA
g neg
ative
activ
e pati
ents
(n =
26)
i Mea
n tim
e betw
een 2
mea
sure
ments
was
4 +/
– 2 m
onths
. HBe
Ag ne
gativ
e ina
ctive
patie
nts (n
= 10
); HB
eAg n
egati
ve ac
tive p
atien
ts (n
= 14
)
120 Hepatitis B virus DNA testing

Tabl
e 43
Stud
y cha
ract
erist
ics an
d re
sults
: Eva
luat
ing
the p
redi
ctive
valu
e of s
erum
HBV
DNA
test
ing
amon
g pa
tient
s und
ergo
ing
antiv
iral t
hera
py
Stud
y (ye
ar)
Coun
try
Stud
y des
ign
Popu
latio
n (N
) Pr
ior t
ests
Te
st
char
acte
ristic
s Re
sults
St
udy q
ualit
y
Buti (
2001
) Sp
ain
Coho
rt stu
dy: n
ot re
porte
d Pr
ospe
ctive
patie
nt en
rolm
ent
(cons
ecuti
ve no
t re
porte
d)
HBV
DNA
posit
ive ch
ronic
hepa
titis B
pa
tients
La
mivu
dine 1
00 m
g/day
>1 y
ear (
rang
e 12
–24 m
onths
) (N
= 35
) Ch
arac
teris
tics a
t bas
eline
: Me
an ag
e = 46
.1 (ra
nge 2
4–62
year
s);
Seru
m AL
T (m
ean 1
33 U
/L, ra
nge 4
9–36
4 U/L)
; HBe
Ag +
ve =
15 (2
5 M, 1
0 F)
Pre-
treatm
ent
liver
biop
sy in
31
patie
nts
(deta
ils N
R)
Inde
x tes
t: St
udy e
ntry
chem
ilumi
nesc
ent b
DNA
assa
y (Qu
antip
lex, C
hiron
) LLD
= 7.
0 x 10
5 ; m
onth
3
real-
time P
CR as
say,
LLD
= ap
prox
. 1 x
103 g
enom
e co
pies/m
L Co
mpa
rato
r: HB
sAg (
Abbo
t-Aus
zyme
Mc);
HBe
Ag
and a
nti-H
Be de
tected
by ra
dioim
muno
assa
y (D
iasor
in)
Refe
renc
e sta
ndar
d: M
ainta
ined
treat
men
t re
spon
se de
fined
as un
detec
table
seru
m HB
V DN
A thr
ough
out th
erap
y per
iod (≤
1 yea
r); N
on-re
spon
se
persi
stenc
e of s
erum
HBV
DNA
or re
appe
aran
ce
after
initia
l clea
ranc
e
Pred
ictive
abilit
y of H
BV D
NA fo
r m
ainta
ined
ther
apy r
espo
nse:
Sn
73%
, Sp 8
8%, A
cc 74
%, P
PV 95
%
P2 Q
3 Ap
plica
bility
: Lim
ited
Patie
nt se
lectio
n cri
teria
unkn
own
HBV
DNA
test
outda
ted, L
LD
poor
Qu
ality:
Poo
r Ind
ex te
st is
also
refer
ence
sta
ndar
d Ina
dequ
ate da
ta re
portin
g Lin
dh (2
001)
De
nmar
k, Fr
ance
, Sp
ain, S
wede
n, UK
Pa
tients
samp
led
from
RCT:
1987
–19
90
HBeA
g pos
itive c
hron
ic he
patiti
s B
patie
nts:
Plac
ebo f
ollow
ed by
inter
feron
n =
47
Inter
feron
after
pred
nisolo
ne n
= 51
(2
wks
pred
nisolo
ne at
0.6 m
g/kg/d
, the
n 1 w
eek a
t 0.45
mg/k
g/d, th
en 1
week
at 0.
25 m
g/kg/d
, with
2 we
eks r
est
befor
e inte
rfero
n)
(Inter
feron
at 10
µ fo
r 1 w
eek i
nduc
tion,
then 1
0 µ tr
ice w
eek f
or 11
wee
ks)
NR
Inde
x tes
t: Am
plico
r HBV
mon
itor (
Roch
e), li
near
de
tectio
n ran
ge =
103 t
o 107 c
opies
/mL
Seru
m sa
mples
take
n befo
re pr
ednis
olone
tre
atmen
t, befo
re in
terfer
on, a
t end
of tr
eatm
ent a
nd
on fo
llow-
up (m
ean 2
04 da
ys af
ter in
terfer
on
cess
ation
) Co
mpa
rato
r: HB
eAg,
anti-H
BeAg
by ra
dio
immu
noas
say o
r enz
yme i
mmun
oass
ay. In
dexe
d am
inotra
nsfer
ase v
alue A
ST or
ALT
(if no
AST
) in
relat
ion to
ULN
(Tes
t deta
ils no
t rep
orted
) Re
fere
nce s
tand
ard:
Sus
taine
d re
spon
se de
fined
as
HBV
DNA
leve
l <10
6 cop
ies/m
L at fo
llow-
up w
ith
at lea
st 1.5
log r
educ
tion i
n vira
l load
comp
ared
with
pr
e-int
erfer
on tr
eatm
ent. N
on re
spon
ders
wer
e pa
tients
who
did n
ot ful
fil the
se cr
iteria
Pred
ictive
abilit
y of H
BV D
NA (l
og
8.7 co
pies
/mL)
for s
usta
ined
ther
apy
resp
onse
: Sn 6
0%, S
p 75%
, PPV
67%
, NP
V 67
%
P2 Q
3 Ap
plica
bility
: Ap
plica
ble
HBV
DNA
test
regim
en
Quali
ty: P
oor
Index
test
part
of re
feren
ce
stand
ard
Hepatitis B virus DNA testing 121

Stud
y (ye
ar)
Coun
try
Stud
y des
ign
Popu
latio
n (N
) Pr
ior t
ests
Te
st
char
acte
ristic
s Re
sults
St
udy q
ualit
y
van d
er E
ijk(2
006)
Ne
therla
nds,
Germ
any,
Belgi
um,
Unite
d King
dom,
De
nmar
k, Fr
ance
, Sp
ain, It
aly, G
reec
e Re
trosp
ectiv
e an
alysis
of da
ta fro
m pr
ospe
ctive
RC
Ta : no
t rep
orted
Patie
nts: a
ged 1
8–70
year
s; Hb
sAg
posit
ive ≥
6 mon
ths; H
BeAg
posit
ive
and H
BV D
NA po
sitive
(hyb
ridisa
tion
metho
dolog
y); A
ST or
ALT
elev
ation
(3
x in
3 mon
ths be
fore s
tudy e
ntry);
liv
er bi
opsy
evide
nce o
f chr
onic
hepa
titis (
durin
g 6 m
onth
perio
d befo
re
study
enro
lmen
t). C
omple
tion o
f stud
y re
gimen
and s
uffici
ent s
erum
samp
les
requ
ired (
n = 13
3)
Char
acte
ristic
s (N
= 133
at b
aseli
ne)
Age (
media
n): 3
4 (ra
nge 1
6–70
); M
97,:F
36; e
thnici
ty: C
auca
sian 8
0%,
Asian
16%
, othe
r 5%
; cirr
hosis
: 16%
; HB
V DN
A (lo
g cop
ies/m
L) (m
edian
): 8.7
(ra
nge 4
.1–10
.0); A
ST (U
LN) (
media
n):
1.5 (r
ange
0.55
–16.7
) Ge
notyp
e: A
46%
; B 5%
; C 12
%; D
32
%; o
ther 6
%
HbsA
g; HB
eAg;
HBV
DNA
(hyb
ridisa
tion
metho
dolog
y);
AST;
ALT
; live
r bio
psy;
anti-H
DV,
HCV,
or H
IV;
seru
m lev
els of
ha
emog
lobin,
pla
telets
and
leuko
cytes
Inde
x tes
t: Re
al-tim
e PCR
assa
y (Ta
qMan
, ca
libra
ted ac
cord
ing to
EUR
OHEP
HBV
DNA
sta
ndar
dsb )
Com
para
tor:
HBeA
g, Ax
SYM
HBe 2
.0 (A
bbott
) Re
fere
nce s
tand
ard:
Sus
taine
d re
spon
se at
wee
k 52
c : de
fined
as lo
ss of
HBe
Ag, (
<0.27
PEI
U/m
L),
with
a dec
reas
e in H
BV D
NA <
105 c
opies
/mLa
t wee
k 52
. Non
resp
onde
rs w
ere p
atien
ts wh
o did
not fu
lfil
these
crite
ria
Pred
ctio
n of
trea
tmen
t res
pons
e by
HBV
DNA
test
ing
(Log
HBV
DNA
at
base
line >
8 & <1
.0 lo
g de
crea
se) a
t we
ek 12
d : NP
V 10
0%, P
PV 46
%, S
n 10
0%e ,
Sp 61
%f , F
N ra
te 0,
FP ra
te 39
Pr
edct
ion
of tr
eatm
ent r
espo
nse b
y HB
V DN
A te
stin
g (L
og H
BV D
NA at
ba
selin
e >9 &
<2.5
log
decr
ease
) at
week
12d :
NPV
100%
, PPV
38%
, Sn
100%
e , Sp
46%
f , FN
rate
0, FP
rate
54
Pred
ictio
n of
trea
tmen
t res
pons
e by
HBV
DNA
test
ing
(Log
HBV
DNA
at
base
line >
8 & <1
.0 lo
g de
crea
se) a
t we
ek 8d :
NPV
96%
, PPV
43%
, Sn
93%
e , Sp
60%
f , FN
rate
7, FP
rate
40
Pred
ictio
n of
trea
tmen
t res
pons
e by
HBV
DNA
test
ing
(Log
HBV
DNA
at
base
line >
9 & <1
.5 lo
g de
crea
se) a
t we
ek 8d :
NPV
100%
, PPV
38%
, Sn
100%
e , Sp
46%
f , FN
rate
0, FP
rate
54
P2 Q
3 Ap
plica
bility
: Lim
ited
HBV
DNA
testin
g fre
quen
cy
differ
ent fr
om
Austr
alian
pr
actic
e Qu
ality:
Poo
r Re
trosp
ectiv
e an
alysis
; inde
x tes
t also
part
of re
feren
ce
stand
ard
Zolln
er (2
001)
Ge
rman
y Co
hort
study
: not
repo
rted
Pros
pecti
ve pa
tient
enro
lmen
t; co
nsec
utive
en
rolm
ent
Trea
tmen
t naïv
e chr
onic
hepa
titis B
pa
tients
, HCV
nega
tive
Lami
vudin
e 100
/day
Me
dian d
urati
on =
12 m
onths
(ran
ge
6–31
mon
ths);
(n =
28);
M 25
, F:3)
Me
an ag
e = 45
year
s (ra
nge =
17–6
9)
Char
acte
ristic
s at b
aseli
ne:
Mean
log H
BV D
NA vi
ral lo
ad =
6.7
1/mL (
rang
e = 3.
47–7
.69);
HBeA
g po
sitive
= 24
(86%
)
Test
befor
e stud
y en
try N
R In
dex t
est:
Real
time P
CR (li
ght c
ycler
DNA
mas
ter
SYBE
R Gr
eenI
Roch
e) de
tectio
n lim
it 102
geno
mes/m
L, dy
nami
c ran
ge. ≤
109 g
enom
es/m
L. (E
UROP
HEP
stand
ard c
alibr
ated)
. HBV
DNA
me
asur
ed ev
ery 3
mon
ths
Com
para
tor:
HBsA
g, HB
eAg,
anti H
BeAg
, anti
-HB
sAg,
anti-H
BC —
all b
y EIA
(axy
sm, A
bbot)
Re
fere
nce s
tand
ard:
Ser
ocon
vers
ion H
BeAg
, anti
HB
eAg (
axys
m, A
bbot)
; Lam
ivudin
e re
sista
nce:
Defin
ition n
ot cle
ar, p
ossib
ly se
rum
HBV
DNA
abov
e de
tectio
n lim
it and
conti
uouls
y dete
ctable
HBe
Ag
Pred
ictive
valu
e of H
BV D
NA (<
log
2 co
pies
/mL)
for s
eroc
onve
rsio
ng,h :
3 m
onth
s PPV
100%
, NPV
76%
, p va
lue
NS; 6
mon
ths P
PV 50
%, N
PV 85
%,
p valu
e NS;
9 m
onth
s PPV
50%
, NPV
91
%, p
value
NS;
12 m
onth
s PPV
54%
, NP
V 10
0%; p
value
0.01
7; 15
mon
ths
PPV
54%
, NPV
100%
, p va
lue 0.
017
Pred
ictive
valu
e of H
BV D
NA (<
log
2 co
pies
/mL)
for l
amivu
dine
re
sista
nceg,
h : 3
mon
ths P
PV 66
%,
NPV
35%
, p va
lue N
S; 6
mon
ths P
PV
82%
, NPV
47%
, p va
lue N
S; 9
mon
ths
PPV
82%
, NPV
47%
, p va
lue N
S; 12
m
onth
s PPV
83%
, NPV
50%
; p va
lue
NS; 1
5 m
onth
s PPV
100%
, NPV
53%
, p v
alue 0
.023
P1 Q
3 Ap
plica
bility
: Ap
plica
ble
Quali
ty:Po
or
Index
test
and
refer
ence
sta
ndar
d not
indep
ende
ntly
inter
prete
d Ina
dequ
ate
repo
rting o
f re
feren
ce
stand
ard
122 Hepatitis B virus DNA testing

Abbr
eviat
ions:
ALT,
alan
ine am
inotra
nsfer
ase;
Acc,
accu
racy
; AST
, asp
artat
e ami
notra
nsfer
ase;
EURO
HEP,
Eur
opea
n con
certe
d acti
on on
vira
l hep
atitis
; FN,
false
nega
tive;
FP, fa
lse po
sitive
; HAI
, hist
ologic
al ac
tivity
inde
x;
HBV
DNA,
hepa
titis B
viru
s deo
xyrib
onuc
leic a
cid; H
BeAg
, hep
atitis
B vi
rus e
antig
en; H
BsAg
, hep
atitis
B vi
rus s
antig
en; H
CV, h
epati
tis C
viru
s; HD
V, he
patiti
s delt
a viru
s; HI
V, hu
man i
mmun
odefi
cienc
y viru
s; LL
D, lo
wer li
mit o
f de
tectio
n; NP
V, ne
gativ
e pre
dictiv
e valu
e; NR
, not
repo
rted;
NS, n
ot sig
nifica
nt; P
CR, p
olyme
rase
chain
reac
tion;
PPV,
posit
ive pr
edict
ive va
lue; R
CT, r
ando
mise
d con
trolle
d tria
l; Sn,
sens
itivity
; Sp,
spec
ificity
a J
anss
en et
al (1
999)
Hep
atolo
gy 30
(1):
238-
243
b Hee
rman
et al
(199
9) J
Clin
Micr
obiol
37(1
):68–
73
c Defi
nition
of vi
rolog
ic re
spon
se re
comm
ende
d by N
IH w
orks
hop o
n chr
onic
hepa
titis B
: Lok
et al
(200
1) G
astro
ente
rolog
y 120
(7):
1828
–185
3 d S
tudy a
uthor
s defi
ned t
hese
test
criter
ia as
“abn
orma
l test”
, whic
h is u
nder
stood
to m
ean “
test n
egati
ve” ie
test
pred
icts n
on-re
spon
ders
e Pro
portio
n of s
ustai
ned r
espo
nder
s cor
rectl
y pre
dicted
by th
e tes
t f P
ropo
rtion o
f non
-resp
onde
rs co
rrectl
y pre
dicted
by th
e tes
t g P
PV pr
ovide
d for
the p
roba
bility
for t
he lo
ss of
e-an
tigen
and m
ainten
ance
of la
mivu
dine s
ensit
ive H
BV w
ith co
py nu
mber
s belo
w the
limit o
f dete
ction
, res
pecti
vely
h NPV
prov
ided f
or th
e pro
babil
ity of
conti
nuou
sly de
tectab
le e-
antig
en an
d eme
rgen
ce of
lami
vudin
e res
istan
ce w
ith co
py nu
mber
s abo
ve th
e lim
it of d
etecti
on, r
espe
ctive
ly i T
reatm
ent d
iscon
tinue
d if b
oth re
sistan
t HBV
(not
defin
ed by
stud
y auth
ors)
with
rising
ALT
leve
ls de
tected
.
Hepatitis B virus DNA testing 123

Tabl
e 44
Char
acte
ristic
s and
resu
lts o
f a sy
stem
atic
revie
w ev
aluat
ing
the r
elatio
nshi
p be
twee
n se
rum
HBV
DNA
leve
ls an
d cli
nica
l out
com
es
Syst
emat
ic re
view
Objec
tive
Sear
ch st
rate
gy
Inclu
sion/
exclu
sion
crite
ria
(inclu
ded
stud
ies)
Meth
odol
ogy
Resu
lts
Stud
y qua
lity
Com
men
ta
Momm
eja-
Marin
(2
003)
To
inves
tigate
the
re
lation
ship
betw
een v
iral
load l
evel
or
supp
ress
ion
and t
reatm
ent
resp
onse
Medli
ne w
as se
arch
fro
m 19
96–2
002 w
ith th
e fol
lowing
sear
ch te
rms:
hepa
titis B
; HBV
; and
HB
V DN
A In
clusio
n cr
iteria
: Pu
blish
ed in
Eng
lish;
repo
rted H
BV D
NA
levels
; spe
cified
othe
r en
d-po
ints (
ALT,
se
rolog
y, &
histol
ogy);
re
porte
d med
ians,
mean
s or d
ata fo
r es
timati
on of
med
ian;
pros
pecti
ve pa
tient
enro
lmen
t; >25
ch
ronic
ally i
nfecte
d pa
tients
; non
-immu
no-
depr
esse
d; vir
al loa
ds
repo
rted a
t star
t and
/or
end o
f ther
apy (
includ
ing
place
bo, if
appli
cable
). St
udies
in ch
ildre
n and
cir
rhoti
c pati
ents
also
includ
ed.
Exclu
sion
crite
ria:
Post-
liver
tran
splan
tation
stu
dies;
HIV
and/o
r he
patiti
s C co
-infec
tion.
(n =
26)
Data
abstr
actio
n by t
wo
sepa
rate
(blin
ded)
re
viewe
rs Vi
ral lo
ads r
epor
ted as
pg
/mLw
ere c
onve
rted t
o co
pies/m
Lb So
me st
udy c
hara
cteris
tics
summ
arise
d. Re
sults
not
summ
arise
d for
indiv
idual
studie
s An
asse
ssme
nt of
study
qu
ality
was n
ot un
derta
ken
Sour
ces o
f hete
roge
neity
we
re ex
plore
d by
subg
roup
analy
sis
Resu
lts pr
esen
ted as
co
rrelat
ion co
-effic
ients:
ex
pone
ntial
and l
inear
re
gres
sions
comp
ared
to
deter
mine
best
data
fit;
statis
tical
signif
icanc
e ex
plore
d by p
value
ca
lculat
ion
Coef
ficien
t of c
orre
latio
n be
twee
n HB
V DN
A an
d ba
selin
e HAI
scor
e: Ov
erall
0.78
, p =
0.0
001;
HBeA
g po
sitive
subg
roup
0.61
, p =
0.05
; HBe
Ag n
egat
ive su
bgro
up 0.
95, p
= 0.
0004
; Ci
rrhos
is su
bgro
up N
D; N
ucleo
side
analo
gue
treat
ed su
bgro
up N
A; in
terfe
ron
treat
ed su
bgro
up
NA; L
iquid
hybr
idisa
tion
assa
y LOD
corre
cted 0
.65, p
= 0.
002
Coef
ficien
t of
corre
latio
n be
twee
n HB
V DN
A an
d fin
al HA
I sco
re: O
vera
ll 0.71
, p =
0.00
3; HB
eAg
posit
ive su
bgro
up 0.
71, p
= 0.
01; H
BeAg
neg
ative
subg
roup
0.66
, p =
0.3;
Cirrh
osis
subg
roup
ND;
Nuc
leosid
e an
alogu
e tre
ated
subg
roup
0.76
, p =
0.00
6; int
erfe
ron
treat
ed su
bgro
up
0.65,
p =
0.08;
Liquid
hyb
ridisa
tion
assa
y LOD
corre
cted 0
.67, p
= 0.
01
Coef
ficien
t of
corre
latio
n be
twee
n HB
V DN
A an
d pr
opor
tion
of p
atien
ts w
ith n
orm
al AL
T:
Over
all 0.
62, p
= 0.
004;
HBeA
g po
sitive
subg
roup
0.66
, p =
0.00
8; HB
eAg
nega
tive
subg
roup
0.7
1, p
< 0.0
5; Ci
rrhos
is su
bgro
up 0.
8, p
= 0.0
03; N
ucleo
side
analo
gue
treat
ed su
bgro
up 0.
82, p
=
0.001
; inte
rfero
n tre
ated
subg
roup
0.55
, p =
0.02
; Liqu
id hy
bridi
satio
n as
say L
OD co
rrecte
d 0.6
1, p
= 0.0
05
Coef
ficien
t of
corre
latio
n be
twee
n HB
V DN
A an
d in
ciden
ce o
f HBe
Ag se
roco
nver
sion:
Ov
erall
0.72
, p =
0.00
2; HB
eAg
posit
ive su
bgro
up N
A; H
BeAg
neg
ative
subg
roup
NA;
Cirr
hosis
su
bgro
up N
D; N
ucleo
side
analo
gue
treat
ed su
bgro
up 0.
92, p
= 0.
001;
inter
fero
n tre
ated
subg
roup
ND
; Liqu
id hy
bridi
satio
n as
say L
OD co
rrecte
d 0.55
, p =
0.3
Coef
ficien
t of
corre
latio
n be
twee
n HB
V DN
A an
d m
edian
chan
ge in
HAI
scor
e: Ov
erall
0.96
, p
= 10
–6; H
BeAg
pos
itive s
ubgr
oup 0
.98, p
= 6
x 10–6
; HBe
Ag n
egat
ive su
bgro
up N
D; C
irrho
sis
subg
roup
ND;
Nuc
leosid
e an
alogu
e tre
ated
subg
roup
0.96
, p =
0.00
3; int
erfe
ron
treat
ed su
bgro
up
ND; L
iquid
hybr
idisa
tion
assa
y LOD
corre
cted N
A Co
effic
ient
of co
rrelat
ion
betw
een
HBV
DNA
and
med
ian ch
ange
in p
ropo
rtion
of p
atien
ts
with
nor
mal
ALT:
Ove
rall 0
.5, p
= 0.
06; H
BeAg
pos
itive s
ubgr
oup N
D; H
BeAg
neg
ative
subg
roup
ND
; Cirr
hosis
subg
roup
ND;
Nuc
leosid
e an
alogu
e tre
ated
subg
roup
0.76
, p =
0.00
3; int
erfe
ron
treat
ed su
bgro
up N
D; Li
quid
hybr
idisa
tion
assa
y LOD
corre
cted N
A Co
effic
ient
of co
rrelat
ion
betw
een
HBV
DNA
and
med
ian ch
ange
in in
ciden
ce o
f HBe
Ag
sero
conv
ersio
n: O
vera
ll 0.72
, p =
0.00
02; H
BeAg
pos
itive s
ubgr
oup N
A; H
BeAg
neg
ative
su
bgro
up N
A; C
irrho
sis su
bgro
up 0.
87, p
= 0.
0000
5; Nu
cleos
ide a
nalog
ue tr
eate
d su
bgro
up 0.
7, p
= 0.0
5; int
erfe
ron
treat
ed su
bgro
up N
D; Li
quid
hybr
idisa
tion
assa
y LOD
corre
cted N
A
Mediu
m qu
ality:
He
terog
eneit
y ex
plore
d by
subg
roup
an
alyse
s No
quali
ty as
sess
ment
repo
rted f
or
includ
ed
studie
s Me
dium
valid
ity:
Subg
roup
an
alysis
not
perfo
rmed
for
PCR
HBV
DNA
assa
ys
Abbr
eviat
ions:
ALT,
Alan
ine am
inotra
nsfer
ase;
HBeA
g, he
patiti
s e an
tigen
; HBV
DNA
, hep
atitis
B vi
rus d
eoxy
ribon
uclei
c acid
; LOD
, lowe
r limi
t of d
etecti
on; N
A, no
t app
licab
le; N
D, no
t don
e a S
ystem
atic r
eview
appr
aised
by ap
plying
the q
uality
crite
ria de
scrib
ed in
App
endi
x D
b Con
versi
on: 1
pg/m
L = 3
x 105 c
opies
/mL
124 Hepatitis B virus DNA testing

Tabl
e 45
Char
acte
ristic
s and
resu
lts o
f stu
dies
evalu
atin
g th
e rela
tions
hip
betw
een
seru
m H
BV D
NA le
vels
and
clini
cal o
utco
mes
Stud
y (ye
ar)
Coun
try
Stud
y des
ign
Popu
latio
n (N
) Te
st
Char
acte
ristic
s Re
sults
St
udy
quali
ty/C
omm
ent
REVE
AL-H
BV st
udy
grou
p (re
sults
re
porte
d by
Chen
et al
(200
6)
& Ilo
eje et
al
(200
6)
Taiw
an
Coho
rt stu
dy: 1
991–
1992
Pr
ospe
ctive
, non
-co
nsec
utive
patie
nt en
rolm
ent
(pop
ulatio
n bas
ed)
89,29
3 res
idents
(30–
65 ye
ars)
in 7 t
owns
hips i
nvite
d to p
artic
ipate:
23
,820 e
nroll
ed—
4155
wer
e HB
sAg +
ve: o
f thes
e 385
1 had
se
rum
samp
les fr
ozen
at
enro
lmen
t teste
d for
DNA
19
8 exc
luded
(195
Anti
-HCV
se
ropo
sitive
, 3 la
cked
adeq
uate
samp
le for
anti-H
CV te
st)
Chen
et al
(200
6): f
inal c
ohor
t N
= 36
53a ;
Aver
age f
ollow
-up =
11.4
year
s; Ma
les =
62%
; Age
>39
ye
ars =
67%
; Nev
er dr
ank a
lcoho
l =
87%
; Hbe
Ag +
ve =
15%
; AL
T ≥4
5 IU
= 6%
; No l
iver
cirrh
osis
= 98
%
Iloeje
et al
(200
6): a
furth
er 71
ex
clude
d fro
m an
alysis
(2 de
aths
withi
n 6 m
o of c
ohor
t entr
y—no
n-he
patic
caus
es—
69 di
agno
sed
with
cirrh
osis
withi
n 6 m
o of
enro
lmen
t):
final
coho
rt N
= 35
82; M
edian
fol
low-u
p = 11
year
s (ra
nge N
R);
Media
n age
= 45
; Male
s = 61
.3%;
Alco
hol d
rinke
rs =
12%
; Hb
eAg +
ve =
15.2%
; Med
ian H
BV
DNA
= 10
3 cop
ies/m
L (ra
nge N
R);
ALT ≥4
5 IU
= 5.7
%; d
eaths
durin
g fol
low-u
p 8.7%
Inde
x tes
t: PC
R (C
OBAS
Amp
licor
; Ro
che)
, lowe
r limi
t of d
etecti
on of
300
copie
s/mL (
tested
at ba
selin
e and
ever
y 6–
12 m
onths
durin
g foll
ow-u
p exa
mina
tion)
Ot
her t
ests
: HBs
AG, H
BeAg
by
radio
immu
noas
say,(
Abbo
t); an
ti-Hep
C by
ra
dioim
muno
assa
y (Ab
bott)
; AL
T by
seru
m ch
emist
ry au
to-an
alyse
r (m
odel
736;
Hitac
hi) (t
ested
at ba
selin
e and
ev
ery 6
–12 m
onths
durin
g foll
ow-u
p ex
amina
tion)
Cum
ulat
ive h
epat
ocell
ular
carc
inom
a inc
iden
ce st
ratif
ied b
y ba
selin
e HBV
DNA
Lev
el (c
opies
/mL)
: Und
etec
table
(<30
0) =
1.3
0% ; s
erum
HBV
DNA
(300
–9.9
x 10
3 ) =
1.37%
; ser
um H
BV
DNA
(1.0
– 9.
9 x 1
04 ) =
3.57%
; ser
um H
BV D
NA (1
.0–9
.9 x
105 )
= 12
.17%
; ser
um H
BV D
NA ( ≥1
.0 x
106 )
= 14
.89%
HR
b of h
epat
ocell
ular
carc
inom
a (95
% C
I) st
ratif
ied b
y bas
eline
HB
V DN
A lev
el (c
opies
/mL)
: Und
etecta
ble (<
300)
= 1.
0 (re
feren
ce);
seru
m H
BV D
NA (3
00–9
.9 x
103 )
= 1.1
(0.5–
2.3, p
=
0.86)
; ser
um H
BV D
NA (1
.0 –
9.9
x 10
4 ) =
2.3 (1
.1–4.9
, p =
0.02
); se
rum
HBV
DNA
(1.0
–9.9
x 10
5 ) =
6.6 (3
.3–13
.1, p
<0.0
01);
seru
m
HBV
DNA
(≥1.
0 x 1
06 ) =
6.1 (2
.9–12
.7, p
<0.0
01)
HRb o
f hep
atoc
ellul
ar ca
rcin
oma (
95%
CI)
by o
ther
varia
bles
: Hb
eAg –
ve =
1.0 (
refer
ence
); Hb
eAg +
ve =
2.6 (
1.6–4
.2, p<
0.001
) AL
T (IU
) <45
= 1.
0 (re
feren
ce);
ALT ≥4
5 = 1.
5 (1.1
–2.1,
p =
0.64
) Liv
er ci
rrhos
isc = 9.
1 (5.9
–13.9
, p<0
.001)
Cu
mul
ative
cirrh
osisd i
ncid
ence
stra
tified
by b
aseli
ne H
BV
DNA
level
(cop
ies/m
L):
Unde
tecta
ble (<
300)
= 4.
5%; s
erum
HBV
DNA
(300
–9.9
x 10
3 ) =
5.9%
; ser
um H
BV D
NA (1
.0–9
.9 x
104 )
= 9.8
%; s
erum
HBV
DNA
(1
.0–9
.9 x
105 )
= 23
.5%; s
erum
HBV
DNA
(≥1.
0 x 1
06 ) =
36.2%
RR
b of c
irrho
sis (9
5% C
I) st
ratif
ied b
y bas
eline
HBV
DNA
leve
l (c
opies
/mL)
: Und
etec
table
(<30
0) =
1.0 (
refer
ence
); se
rum
HBV
DN
A (3
00–9
.9 x
103 )
= 1.4
(0.9–
2.2, p
value
NR)
; ser
um H
BV D
NA
(1.0
– 9
.9 x
104 )
= 2.5
(1.6–
3.8, p
< 0.
01);
seru
m H
BV D
NA (1
.0–9
.9
x 105 )
= 5.6
(3.7–
8.5, p
< 0.
01);
seru
m H
BV D
NA (≥
1.0
x 106 )
= 6.5
(4
.1–10
.2, p
< 0.
01)
RRb o
f cirr
hosis
(95%
CI)
by o
ther
varia
bles
: Hbe
Ag –v
e = 1.
0 (re
feren
ce);
HbeA
g +ve
= 1.
7 (1.2
–2.3,
p <
0.01
) AL
T (IU
) <45
= 1.
0 (re
feren
ce);
ALT ≥
45 =
1.5 (
1.1–2
.1, p
< 0.0
5)
HR o
f hep
atoc
ellul
ar ca
rcin
oma (
95%
CI)e :
Seru
m H
BV D
NA
(bas
eline
< 1
0 00
0) lif
estyl
e adju
sted 1
.0, liv
er da
mage
adjus
ted 1.
0; Se
rum
HBV
DNA
(bas
eline
10
000–
99 9
99, f
inal <
10 0
00))
lifesty
le ad
justed
1.6 (
0.7–3
.9), li
ver d
amag
e adju
sted 1
.3 (0
.5–3.1
); Se
rum
HB
V DN
A (b
aseli
ne 1
0 00
0–99
999
, fina
l 10
000–
99 9
99) li
festyl
e
Pros
pecti
ve
Poten
tial fo
r sele
ction
bia
s:
Major
ity of
invit
ed
indivi
duals
did n
ot pa
rticipa
te No
n-co
nsec
utive
en
rolm
ent
Popu
lation
cons
idere
d ap
plica
ble to
Au
strali
an cl
inica
l pr
actic
e
Hepatitis B virus DNA testing 125

Stud
y (ye
ar)
Coun
try
Stud
y des
ign
Popu
latio
n (N
) Te
st
Char
acte
ristic
s Re
sults
St
udy
quali
ty/C
omm
ent
adjus
ted 0.
5 (0.1
–3.6)
, live
r dam
age a
djuste
d 0.4
(0.1–
3.2);
Seru
m
HBV
DNA
(bas
eline
10
000–
99 9
99, f
inal >
100
000)
lifes
tyle
adjus
ted 3.
5 (1.4
–9.2)
, live
r dam
age a
djuste
d 2.9
(1.0–
9.8);
Seru
m
HBV
DNA
(bas
eline
>10
0 00
0, fin
al <1
0 00
0) lif
estyl
e adju
sted 3
.8 (1
.7–8.4
), liv
er da
mage
adjus
ted 1.
9 (0.8
–4.4)
; Ser
um H
BV D
NA
(bas
eline
>10
0 00
0, fin
al 10
000
–99
999)
lifes
tyle a
djuste
d 7.3
(3.5–
15.3)
, live
r dam
age a
djuste
d 4.3
(2.0–
9.3);
Seru
m H
BV D
NA
(bas
eline
>10
0 00
0, fin
al >1
00 0
00) li
festyl
e adju
sted 1
0.0 (6
.3–16
.2), li
ver d
amag
e adju
sted 5
.3 (2
.9–9.7
) Ha
rris (
2003
) Ch
ina
Coho
rt stu
dy: 1
992–
2000
Pr
ospe
ctive
, non
-co
nsec
utive
patie
nt en
rolm
ent
HbsA
g +ve
, HBV
DNA
+ve
(dot
blot h
ybrid
isatio
n), w
ith 3
or m
ore
seru
m sa
mples
avail
able
for
analy
sis , h
epato
cellu
lar
carci
noma
-free
at st
udy e
ntry
(n =
114)
(su
bjects
selec
ted fr
om α
-fet
opro
tein i
nterve
ntion
arm
of an
ea
rly de
tectio
n scre
ening
stud
y)
Inde
x tes
t: Do
t blot
hybr
idisa
tion,
quan
tified
by
bio-
imag
ing an
alyse
r sys
tem (F
uji
medic
al sy
stems
), se
nsitiv
ity lim
it = 3
x 105
virion
s/mL (
= co
pies/m
L?)
Othe
r tes
ts: A
FP by
enzy
me im
muno
assa
y
RR o
f hep
atoc
ellul
ar ca
rcin
oma d
eath
amon
g pa
tient
s with
st
able
HBV
DNA
sero
conv
ersio
n (9
5% C
I): 2.
2 (0.9
, 5.3)
RR
of h
epat
ocell
ular
carc
inom
a dea
th am
ong
patie
nts w
ith
unst
able
HBV
DNA
sero
conv
ersio
n (9
5% C
I): 1.
6 (1.1
, 7.4)
Ad
just
edf R
R of
hep
atoc
ellul
ar ca
rcin
oma d
eath
in p
atien
ts
with
HBV
sero
conv
ersio
n (9
5% C
I): 2.
8 (1.1
, 7.4)
RR
of h
epat
ocell
ular
carc
inom
a dea
th am
ong
patie
nts w
ith
HBV
DNA
load
of <
1.8 vi
rions
/mL(
95%
CI):
0.51
(0.19
, 1.4)
Pros
pecti
ve
Poten
tial fo
r sele
ction
bia
s: no
n-co
nsec
utive
pa
tient
selec
tion
Poten
tial fo
r spe
ctrum
bia
s: pa
tients
selec
ted
from
scre
ening
stud
y Tr
eatm
ent n
ot ap
plica
ble to
Au
strali
an cl
inica
l pr
actic
e HB
V DN
A tes
t ou
tdated
Ish
ikawa
(200
1)
Japa
n Co
hort
study
: NR
Uncle
ar pa
tient
enro
lmen
t (no
n-co
nsec
utive
)
HbsA
g +ve
cirrh
otic p
atien
ts,
exclu
ded p
atien
ts wi
th no
n-vir
al cir
rhos
is (n
= 65
)
Inde
x tes
t: TM
A an
d hyb
ridisa
tion
prote
ction
assa
y (de
tails
NR),
seru
m sa
mples
take
n at ti
me of
first
diagn
osis
of cir
rhos
is Ot
her t
ests
: Hbs
Ag by
enzy
me
immu
noas
say (
Daina
bot)
HbeA
g, an
ti-HBe
Ag, b
y enz
yme
immu
noas
say;
anti-H
Bc by
reve
rsece
ll Ab
kit (Y
aman
ouch
i), se
rum
samp
les ta
ken a
t tim
e of fi
rst di
agno
sis of
cirrh
osis
RRg o
f hep
tace
llular
carc
inom
a (95
% C
I): A
LT le
vels
(>10
0 IU
/L)
4.525
(1.20
2–17
.030)
; LDH
leve
ls (>
480
IU/L
) 2.88
0 (0.8
81–9
.412)
; HB
V DN
A (>
3.7 LG
E/mL
) 7.71
2 (1.5
11–3
9.365
)
Dire
ction
uncle
ar
Poten
tial fo
r sele
ction
bia
s: no
n-co
nsec
utive
pa
tient
selec
tion
Redu
ced a
pplic
abilit
y to
Austr
alian
clini
cal
prac
tice:
less s
ensit
ive
HBVD
NA te
st
126 Hepatitis B virus DNA testing

Stud
y (ye
ar)
Coun
try
Stud
y des
ign
Popu
latio
n (N
) Te
st
Char
acte
ristic
s Re
sults
St
udy
quali
ty/C
omm
ent
Kubo
(200
0)
Japa
n Co
hort
study
: 199
0–19
98
Uncle
ar pa
tient
enro
lmen
t (no
n-co
nsec
utive
)
HBV
DNA
posit
ive pa
tients
, ne
gativ
e for
anti-H
CV, w
ho ha
d cu
rativ
eh live
r res
ectio
n for
he
patoc
ellula
r car
cinom
a. (n
= 40
)
Inde
x tes
t: Br
anch
ed D
NA as
say (
Chiro
n Am
plex)
(Ser
um sa
mples
for t
est o
btaine
d be
fore s
urge
ry)
Othe
r tes
ts: A
nti-H
CV by
ELIS
A; se
rum
HCV
RNA
by P
CR, H
BeAg
, anti
-HBe
Ag,
HBsA
g,and
anti-H
BsAg
by en
zyme
im
muno
assa
y (Int
erna
tiona
l Rea
gents
Cor
p)
(Ser
um sa
mples
for t
est o
btaine
d befo
re
surg
ery)
Tum
our f
ree s
urviv
al ra
te am
ong
patie
nts w
ith h
igh
(≥0.7
m
Eq/m
L) H
BV D
NA le
vels
afte
r thr
ee ye
ars:
0%
Tum
our f
ree s
urviv
al ra
te am
ong
patie
nts w
ith lo
w (<
0.7
mEq
/mL)
HBV
DNA
leve
ls af
ter n
ine y
ears
: 64%
RR
of h
epat
ocell
ular
carc
inom
a rec
urre
nce a
mon
g pa
tient
s wi
th h
igh
(≥0.7
mEq
/mL)
HBV
DNA
leve
ls (9
5% C
I): 5.
13 (1
.57,
16.67
) RR
of h
epat
ocell
ular
carc
inom
a rec
urre
nce a
mon
g pa
tient
s wo
th p
ositi
ve su
rgica
l mar
gins
(95%
CI):
2.14
(1.10
, 6.80
)
Poten
tial s
electi
on
bias:
direc
tion u
nclea
r, no
n-co
nsec
utive
en
rolm
ent
Appli
cabil
ity to
Au
strali
an cl
inica
l pr
actic
e pote
ntiall
y lim
ited:
less s
ensit
ive
HBV
DNA
test
Kubo
(200
3)
Japa
n Co
hort
study
: 198
9–20
01
Uncle
ar pa
tient
enro
lmen
t (no
n-co
nsec
utive
)
HBV
DNA
posit
ive pa
tients
, ne
gativ
e for
anti-H
CV, w
ho ha
d cu
rativ
eh live
r res
ectio
n for
he
patoc
ellula
r car
cinom
a. (n
= 52
)
Inde
x tes
t: TM
A-HP
A (C
huga
i diag
nosti
cs):
sens
itivity
rang
e = 3.
7 –8.7
LGE/
mLi
Bran
ched
DNA
assa
y (Qu
antip
lex);
detec
tion l
imit 0
.7 mE
q/mL(
7 x 10
5 co
pies/m
L) (S
erum
samp
les fo
r tes
t ob
taine
d befo
re su
rger
y) Ot
her t
ests
: Anti
-HCV
by E
LISA
; HBe
Ag,
HBsA
g by e
nzym
e imm
unoa
ssay
(In
terna
tiona
l Rea
gents
Cor
p)
(Ser
um sa
mples
for t
est o
btaine
d befo
re
surg
ery)
Hepa
toce
llular
carc
inom
a rec
urre
nce i
n pr
opor
tion
of p
atien
ts
with
low
seru
m H
BV D
NA (<
3.7 L
GE/m
L) vs
pro
porti
on o
f pa
tient
s hig
h se
rum
HBV
DNA
(≥3.7
LGE
/mL)
: 14.3
% (n
= 2)
vs
63.2
(n =
24)
RR o
f hep
atoc
ellul
ar ca
rcin
oma r
ecur
renc
e am
ong
patie
nts
with
hig
h (≥
3.7 L
GE/m
L) H
BV D
NA le
vels
(95%
CI):
6.58
(1
.52, 2
8.57)
Poten
tial s
electi
on
bias:
direc
tion u
nclea
r, no
n-co
nsec
utive
en
rolm
ent
Appli
cabil
ity to
Au
strali
an cl
inica
l pr
actic
e pote
ntiall
y lim
ited:
less s
ensit
ive
HBV
DNA
test
Mahm
ood (
2005
) Ja
pan
Coho
rt stu
dy: 1
996–
2003
Un
clear
patie
nt en
rolm
ent
Patie
nts di
agno
sed w
ith H
BV
relat
ed ci
rrhos
is by
liver
biop
sy
and/o
r per
itone
osco
py. H
bsAg
po
sitive
, anti
-hep
C ne
gativ
e at
study
comm
ence
ment.
Cirr
hotic
pa
tients
with
poss
ible
hepa
tocell
ular c
arcin
oma
asso
ciatio
n at th
e tim
e of
hepa
tocell
ular c
arcin
oma
diagn
osis
were
exclu
ded f
rom
(n =
91; 2
3 pati
ents
were
trea
ted
using
inter
feron
j )
Inde
x tes
t: Am
plico
r Mon
itor (
Roch
e)
Othe
r tes
ts: H
BsAg
, anti
-HBs
Ag by
ch
emilu
mine
scen
t enz
yme i
mmun
oass
ay
(Fuji
); HB
eAg,
anti-H
BeAg
by en
zyme
-lin
ked i
mmun
osor
bent
assa
y (Ab
bot)
ALT
(test
detai
ls NR
)
Logi
stic
regr
essio
n an
alysis
of H
BV D
NA le
vels
to p
redi
ct
hepa
toce
llular
carc
inom
a occ
urre
nce:
p =
0.029
Lo
gist
ic re
gres
sion
analy
sis o
f ALT
leve
ls to
pre
dict
he
pato
cellu
lar ca
rcin
oma o
ccur
renc
e: p
= 0.0
62
OR o
f hep
atoc
ellul
ar ca
rcin
oma o
ccur
renc
e by s
erum
HBV
DN
A lev
el (9
5% C
I): 2.
33 (1
.1, 5.
6)
Poten
tial s
electi
on
bias:
direc
tion u
nclea
r an
d enr
olmen
t NR
HBV
DNA
test
appli
cable
to
Austr
alian
clini
cal
prac
tice
Hepatitis B virus DNA testing 127
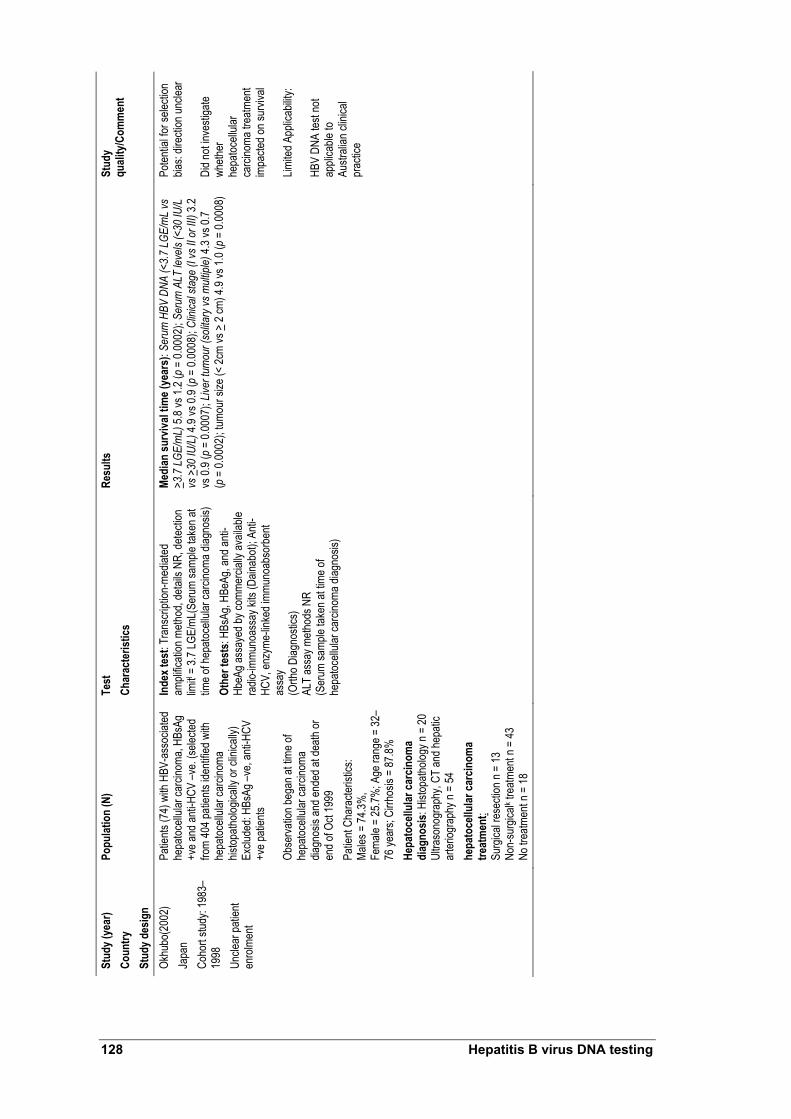
Stud
y (ye
ar)
Coun
try
Stud
y des
ign
Popu
latio
n (N
) Te
st
Char
acte
ristic
s Re
sults
St
udy
quali
ty/C
omm
ent
Okhu
bo(2
002)
Ja
pan
Coho
rt stu
dy: 1
983–
1998
Un
clear
patie
nt en
rolm
ent
Patie
nts (7
4) w
ith H
BV-a
ssoc
iated
he
patoc
ellula
r car
cinom
a, HB
sAg
+ve a
nd an
ti-HCV
–ve.
(selec
ted
from
404 p
atien
ts ide
ntifie
d with
he
patoc
ellula
r car
cinom
a his
topath
ologic
ally o
r clin
ically
) Ex
clude
d: HB
sAg –
ve, a
nti-H
CV
+ve p
atien
ts
Obse
rvatio
n beg
an at
time o
f he
patoc
ellula
r car
cinom
a dia
gnos
is an
d end
ed at
death
or
end o
f Oct
1999
Pa
tient
Char
acter
istics
: Ma
les =
74.3%
, Fe
male
= 25
.7%; A
ge ra
nge =
32–
76 ye
ars;
Cirrh
osis
= 87
.8%
Hepa
toce
llular
carc
inom
a di
agno
sis: H
istop
atholo
gy n
= 20
Ul
traso
nogr
aphy
, CT
and h
epati
c ar
teriog
raph
y n =
54
hepa
toce
llular
carc
inom
a tre
atm
ent:
Su
rgica
l rese
ction
n =
13
Non-
surg
icalk t
reatm
ent n
= 43
No
trea
tmen
t n =
18
Inde
x tes
t: Tr
ansc
riptio
n-me
diated
am
plific
ation
meth
od, d
etails
NR,
detec
tion
limitl =
3.7 L
GE/m
L(Se
rum
samp
le tak
en at
tim
e of h
epato
cellu
lar ca
rcino
ma di
agno
sis)
Othe
r tes
ts: H
BsAg
, HBe
Ag, a
nd an
ti-Hb
eAg a
ssay
ed by
comm
ercia
lly av
ailab
le ra
dio-im
muno
assa
y kits
(Dain
abot)
; Anti
-HC
V, en
zyme
-linke
d imm
unoa
bsor
bent
assa
y (O
rtho D
iagno
stics
) AL
T as
say m
ethod
s NR
(Ser
um sa
mple
taken
at tim
e of
hepa
tocell
ular c
arcin
oma d
iagno
sis)
Medi
an su
rviva
l tim
e (ye
ars)
: Ser
um H
BV D
NA (<
3.7
LGE/
mL
vs
>3.7
LGE
/mL)
5.8 v
s 1.2
(p =
0.00
02);
Seru
m A
LT le
vels
(<30
IU/L
vs
>30
IU/L
) 4.9
vs 0.
9 (p =
0.00
08);
Clini
cal s
tage
(I vs
II o
r III)
3.2
vs 0.
9 (p =
0.00
07);
Liver
tum
our (
solita
ry vs
mult
iple)
4.3 v
s 0.7
(p
= 0.
0002
); tum
our s
ize (<
2cm
vs >
2 cm
) 4.9
vs 1.
0 (p =
0.00
08)
Poten
tial fo
r sele
ction
bia
s: dir
ectio
n unc
lear
Did n
ot inv
estig
ate
wheth
er
hepa
tocell
ular
carci
noma
trea
tmen
t im
pacte
d on s
urviv
al
Limite
d App
licab
ility:
HBV
DNA
test n
ot ap
plica
ble to
Au
strali
an cl
inica
l pr
actic
e
128 Hepatitis B virus DNA testing

Stud
y (ye
ar)
Coun
try
Stud
y des
ign
Popu
latio
n (N
) Te
st
Char
acte
ristic
s Re
sults
St
udy
quali
ty/C
omm
ent
Yuen
(200
4)
China
Co
hort
study
: 200
1–20
03
Uncle
ar pa
tient
enro
lmen
t
chro
nic he
patiti
s B pa
tients
un
derg
oing l
iver b
iopsy
; no
antiv
iral th
erap
y; Hb
sAg +
ve ≥
6 mo
nths ;
exclu
ded p
atien
ts wi
th co
ncom
itant
liver
dise
ases
inc
luding
hepa
titis C
or D
, alc
oholi
c live
r dise
ase,
autoi
mmun
e hep
atitis
, Wils
on’s
disea
se, p
rimar
y bilia
ry cir
rhos
is an
d dru
g ind
uced
hepa
titis.
(n =
94)
m HBe
Ag +
ve =
43 (4
6.9%
); m H
BeAg
–ve =
51 (5
4.3%
); m M
edian
ALT
leve
l, U/L
= 91
(ra
nge =
21–6
02);
m Med
ian H
BV
DNA
level,
copie
s/mL =
1.9 x
107
(rang
e = <
200–
2.0 x
1013
); Me
dian
age,
yr =
43.3
(rang
e = 20
–51)
; M
= 74
, F =
20
Inde
x tes
t: Co
bas A
mplic
or, H
BV M
onito
r tes
t (Ro
che)
, lowe
r limi
t of d
etecti
on =
200
copie
s/mL (
HBV
DNA
tested
in se
rum
samp
les ta
ken 2
wee
ks be
fore l
iver b
iopsy
) Ot
her t
ests
: HBs
Ag, H
BeAg
, anti
- HBe
Ag
by m
icrop
artic
le en
zyme
immu
noas
say
(Abb
ot)
ALT
test d
etails
NR
Liver
histo
logy g
rade
d by c
riteria
of K
node
ll et
al (1
981)
. Hist
ology
asse
ssed
blind
to
liver
bioc
hemi
stry a
nd H
BV D
NA te
st re
sults
Corre
latio
nn of H
BV D
NA (A
nti-H
BeAg
pos
itive
) with
liver
hi
stol
ogy:
Tota
l HAI
scor
e 0.3
7 (p =
0.00
8); H
AI-N
I sco
re 0.
31
(p =
0.01
4); H
AI-F
scor
e 0.33
(p =
0.01
7)
Corre
latio
nn of A
LT le
vels
(Ant
i-HBe
Ag p
ositi
ve) w
ith liv
er
hist
olog
y: To
tal H
AI sc
ore 0
.31 (p
= 0.
028)
; HAI
-NI s
core
0.35
(p
= 0.
011)
Co
rrelat
ionn o
f ALT
leve
ls (H
beAg
pos
itive
) with
liver
hist
olog
y: To
tal H
AI sc
ore 0
.40 (p
= 0.
009)
; HAI
-NI s
core
0.4
3 (p =
0.00
4)
Relat
ion
betw
een
seru
m H
BV D
NA an
d m
edian
ne
croi
nflam
mat
ory s
core
(ran
ge):
Seru
m H
BV D
NA
(<10
5 cop
ies/m
L) 2
(0–5
); se
rum
HBV
DNA
(<10
6 cop
ies/m
L)
3 (0–
10);
seru
m H
BV D
NA (<
107 c
opies
/mL)
2 (0
–18)
Re
latio
n be
twee
n se
rum
HBV
DNA
pro
porti
on o
f pat
ients
with
ne
croi
nflam
mat
ory s
core
< 3:
Seru
m H
BV D
NA (<
105 c
opies
/mL)
n =
6 (8
5.7%
); se
rum
HBV
DNA
(<10
6 cop
ies/m
L) n
= 9 (
81.8%
); se
rum
HBV
DNA
(<10
7 cop
ies/m
L) n
= 15
(57.7
%)
Relat
ion
betw
een
seru
m H
BV D
NA an
d m
edian
fibr
osis
scor
e (ra
nge)
: Ser
um H
BV D
NA (<
105 c
opies
/mL)
0 (0
–4);
seru
m H
BV
DNA
(<10
6 cop
ies/m
L) 0
(0–4
); se
rum
HBV
DNA
(<10
7 cop
ies/m
L) 1
(0–4
) Re
latio
n be
twee
n se
rum
HBV
DNA
pro
porti
on o
f pat
ients
with
fib
rosis
scor
e = 0:
Ser
um H
BV D
NA (<
105 c
opies
/mL)
n =
6 (8
5.7%
); se
rum
HBV
DNA
(<10
6 cop
ies/m
L) n
= 7 (
63.6%
); se
rum
HB
V DN
A (<
107 c
opies
/mL)
n =
11 (4
2.3%
)
Dire
ction
uncle
ar,
poss
ibly p
rosp
ectiv
e Po
tentia
l sele
ction
bia
s – on
ly inc
luded
pa
tients
with
liver
bio
psies
Bl
inding
betw
een l
iver
histol
ogy a
nd te
st re
sults
Pa
tient
popu
lation
co
nside
red a
pplic
able
Abbr
eviat
ions:
AFP,
α-fe
topro
tein t
ests;
ALT
, alan
ine am
inotra
nsfer
ase;
CHB,
chro
nic he
patiti
s B, C
I, con
fiden
ce in
terva
l; ELIS
A, en
zyme
linke
d imm
unoa
ssay
; F, fe
male;
HAI
, hist
ologic
activ
ity in
dex;
HAI-F
, hist
ologic
activ
ity
index
fibro
sis; H
AI-N
I, hist
ologic
activ
ity in
dex n
ecro
inflam
matio
n; HB
eAg,
hepa
titis B
e-an
tigen
; HBs
Ag, h
epati
tis B
surfa
ce a
ntige
n; HB
V DN
A, he
patiti
s B vi
rus d
eoxy
ribon
uclei
c acid
;. HCV
, hep
atitis
C vi
rus;
HDV,
hepa
titis D
vir
us; H
R, H
azar
d rati
o; U,
inter
natio
nal u
nits;
LDH,
lacta
te de
hydr
ogen
ase;
LGE,
loga
rithm
of ge
nome
equiv
alent;
M, m
ale; N
R, no
t rep
orted
; PCR
, poly
mera
se ch
ain re
actio
n; RE
VEAL
-HBV
, The
Risk
Eva
luatio
n of V
iral L
oad
and A
ssoc
iated
Live
r Dise
ase/C
ance
r-in H
epati
tis B
Viru
s; RN
A, rib
onuc
leic a
cid; R
R, re
lative
risk;
TMA,
tran
scrip
tion m
ediat
ed as
say
a Che
n et a
l (200
6) ex
amine
d the
impa
ct of
chan
ging H
BV D
NA le
vel o
n hep
atoce
llular
carci
noma
risk i
n a su
bset
of the
se pa
rticipa
nts (n
= 16
19) w
ho ha
d ser
um H
BV D
NA le
vel o
f ≥ 10
000 c
opies
/mLa
t stud
y entr
y. Fo
llow-
up
seru
m sa
mples
were
take
n at th
e las
t follo
w-up
exam
inatio
n or a
t the f
ollow
-up e
xami
natio
n pre
cedin
g the
diag
nosis
of he
patoc
ellula
r car
cinom
a b M
ultiva
riate-
adjus
ted ha
zard
ratio
and r
elativ
e risk
deter
mine
d by C
ox pr
opor
tiona
l haz
ard r
egre
ssion
analy
sis
c Diag
nose
d with
ultra
sono
grap
hy w
ithin
6 mon
ths of
stud
y entr
y d C
irrho
sis di
agno
sed b
y high
reso
lution
real
time u
ltraso
und,
with
a qua
ntativ
e sco
ring s
ystem
from
liver
surfa
ce ap
pear
ance
, live
r par
ench
ymal
textur
e, int
rahe
patic
bloo
d ves
sel s
ize, s
plenic
size
. All p
atien
ts ha
d bas
eline
sc
reen
ing ul
traso
und;
ultra
soun
ds al
so pe
rform
ed ev
ery 6
–12 m
onths
at fo
llow-
up. U
ltraso
und b
linde
d to H
BV D
NA te
sting
e T
he ha
zard
ratio
s wer
e adju
sted f
or lif
estyl
e (se
x, ag
e, cig
arett
e smo
king &
alco
hol c
onsu
mptio
n) an
d live
r dam
age (
HBeA
g pos
itive,
liver
cirrh
osis,
ALT
leve
l) f T
he re
lative
risk w
as ad
justed
for f
actor
s suc
h as f
amily
histo
ry of
hepa
tocell
ular c
arcin
oma,
acute
hepa
titis h
istor
y, alc
ohol
cons
umpti
on, c
igare
tte sm
oking
g R
elativ
e risk
s calc
ulated
by C
ox re
gres
sion a
nalys
is h C
urati
ve re
secti
on de
fined
as co
mplet
e res
ectio
n of a
ll mac
rosc
opica
lly ev
ident
tumou
r. Ab
senc
e of tu
mour
cells
alon
g the
pare
nchy
mal tr
anse
ction
line c
onfirm
ed hi
stolog
ically
Hepatitis B virus DNA testing 129

i Kub
o et a
l (200
3) re
porte
d tha
t this
rang
e is e
quiva
lent to
5 x 1
03 to 5
x 10
8 cop
ies/m
L of s
erum
HBV
DNA
j P
atien
ts re
ceive
d eith
er Iin
terfer
on-α
or in
terfer
on-β
at 6
MU/da
y for
4 we
eks:
prop
ortio
ns re
ceivi
ng in
terfer
on-α
or in
terfer
on-β
not r
epor
ted
k Tra
nsca
theter
arter
ial em
bolis
ation
, and
/or pe
rcutan
eous
etha
nol in
jectio
n l O
khub
o et a
l (200
2) re
porte
d tha
t the d
etecti
on lim
it of th
e bra
nche
d DNA
assa
y (0.7
milli
equiv
alent
per m
L) co
rresp
onds
to 5.
8 LGE
/mL b
y the
TMA
meth
od
m At ti
me of
liver
biop
sy
n Cor
relat
ion be
twee
n con
tinuo
us va
riable
s with
skew
ed di
stribu
tion w
as te
sted b
y Spe
arma
n’s ra
nk co
rrelat
ion. T
wo ta
iled p
value
<0.0
5 con
sider
ed st
atisti
cally
sign
ifican
t
130 Hepatitis B virus DNA testing

Hepatitis B virus DNA testing 131
Appendix D Quality criteria
Study design Quality checklist Systematic review
Was the research question specified?
Was the search strategy documented and adequate?
Were the inclusion and exclusion criteria specified, appropriate and applied in an unbiased way?
Was a quality assessment of included studies undertaken?
Were the methods of the study appraisal reproducible?
Were the characteristics and results of the individual studies summarised?
Were the methods for pooling the data appropriate?
Were sources of heterogeneity explored?
Was a summary of the main results and precision estimates reported?
Studies evaluating effectiveness of an intervention on health outcomes Randomised controlled trial
Were the inclusion and exclusion criteria specified?
Was the assignment to the treatment groups really random?
Was the treatment allocation concealed from those responsible for recruiting subjects?
Was there sufficient description about the distribution of prognostic factors for the treatment and control groups?
Were the groups comparable at baseline for these factors?
Were outcome assessors blinded to the treatment allocation?
Were the care providers blinded?
Were the subjects blinded?
Were all randomised participants included in the analysis?
Was a point estimates and measure of variability reported for the primary outcome?
Cohort study Were subjects selected prospectively or retrospectively?
Was the intervention reliably ascertained?
Was there sufficient description about how the subjects were selected for the new intervention and comparison groups?
Was there sufficient description about the distribution of prognostic factors for the new intervention and comparison groups? Were the groups comparable for these factors?
Did the study adequately control for potential confounding factors in the design or analysis?
Was the measurement of outcomes unbiased (ie blinded to
treatment group and comparable across groups)?
Was follow-up long enough for outcomes to occur?
What proportion of the cohort was followed-up and were there exclusions from the analysis?
Were drop-out rates and reasons for drop-out similar across intervention and unexposed groups?
Case-control study
Was there sufficient description about how subjects were defined and selected for the case and control groups?
Was the disease state of the cases reliably assessed and validated?
Were the controls randomly selected from the source of population of the cases? Was there sufficient description about the distribution of prognostic factors for the case and control groups? Were the groups comparable for these factors?
Did the study adequately control for potential confounding factors in the design or analysis?

132 Hepatitis B virus DNA testing
Was the new intervention and other exposures assessed in the same way for cases and controls and kept blinded to case/control status?
How was the response rate defined?
Were the non-response rates and reasons for non-response the same in both groups?
Was an appropriate statistical analysis used?
If matching was used, is it possible that cases and controls were matched on factors related to the intervention that would compromise the analysis because of over-matching?
Case series Was the study based on a representative sample selected from a relevant population?
Were the criteria for inclusion and exclusion explicit?
Did all subjects enter the survey at a similar point in their disease progression?
Was follow-up long enough for important events to occur?
Were the techniques used adequately described?
Were outcomes assessed using objective criteria or was blinding used?
If comparisons of sub-series were made, was there sufficient description of the series and the distribution of prognostic factors?
Study of diagnostic accuracy
Was the patient spectrum representative of those who would undergo the test in practice?
Were selection criteria clearly described?
Is the reference standard likely to correctly classify the target condition?
Is the time period between reference standard and index test short enough to be reasonably sure that the target condition did not change between the two tests?
Did the whole sample or a random selection of the sample receive verification using a reference standard of diagnosis?
Did patients receive the same reference standard regardless of the index test result?
Was the reference standard independent of the index test (i.e. the index test did not form part of the reference standard)?
Was the execution of the index test described in sufficient detail to permit replication of the test?
Was the execution of the reference standard described in sufficient detail to permit its replication?
Were the index test results interpreted without knowledge of the results of the reference standard?
Were the reference standard results interpreted without knowledge of the results of the index test?
Were the same clinical data available when test results were interpreted as would be available when the test is used in practice?
Were uninterpretable/ intermediate test results reported?
Were withdrawals from the study explained?

Hepatitis B virus DNA testing 133
Appendix E Literature search strategies
Table 46 PreMedline and Medline search for HBV DNA testing, 1966 to April Week 1 2006
Search history References retrieved 1 exp hepatitis b/ 31281 2 hepatitis b.ti,ab. 34703 3 or/1-2 45243 4 dna, viral/ 60324 5 (dna or deoxyribonucleic acid).ti,ab. 484140 6 or/4-5 504997 7 3 and 6 8143 8 hepatitis b virus/ 11728 9 hepatitis b surface antigens/ 12831 10 (hepatitis b virus or hbv).ti,ab. 21810 11 or/8-10 31040 12 7 and 11 7566 13 dna, viral/an,bl 21699 14 (hbv dna or HBV DNA or hbv deoxyribonucleic acid).ti,ab. 3739 15 (hepatitis b virus dna or hepatitis b virus deoxyribonucleic acid).ti,ab. 1091 16 or/14-15 4309 17 16 and (test$ or assay$).ti,ab. 1509 18 exp nucleic acid amplification techniques/ or gene amplification/ 204572 19 nucleic acid hybridisation/ 44353 20 polymerase chain reaction/ 138175 21 20 and exp reagent kits, diagnostic/ 690 22 20 and polymerase chain reaction/mt 29441 23 (versant or amplification).ti,ab. 49574 24 (hybrid capture or digene).ti,ab. 543 25 cobas.ti,ab. 822 26 roche pcr.ti,ab. 21 27 or/13,17-19,21-26 277696 28 12 and 27 4213 29 viral load/ 7811 30 (viral adj (burden or load or dynamics or decline)).ti,ab. 6395 31 virolog$.ti,ab. 12307 32 or/29-31 21752 33 28 and 32 453 34 28 and comparative study/ 531 35 or/33-34 899
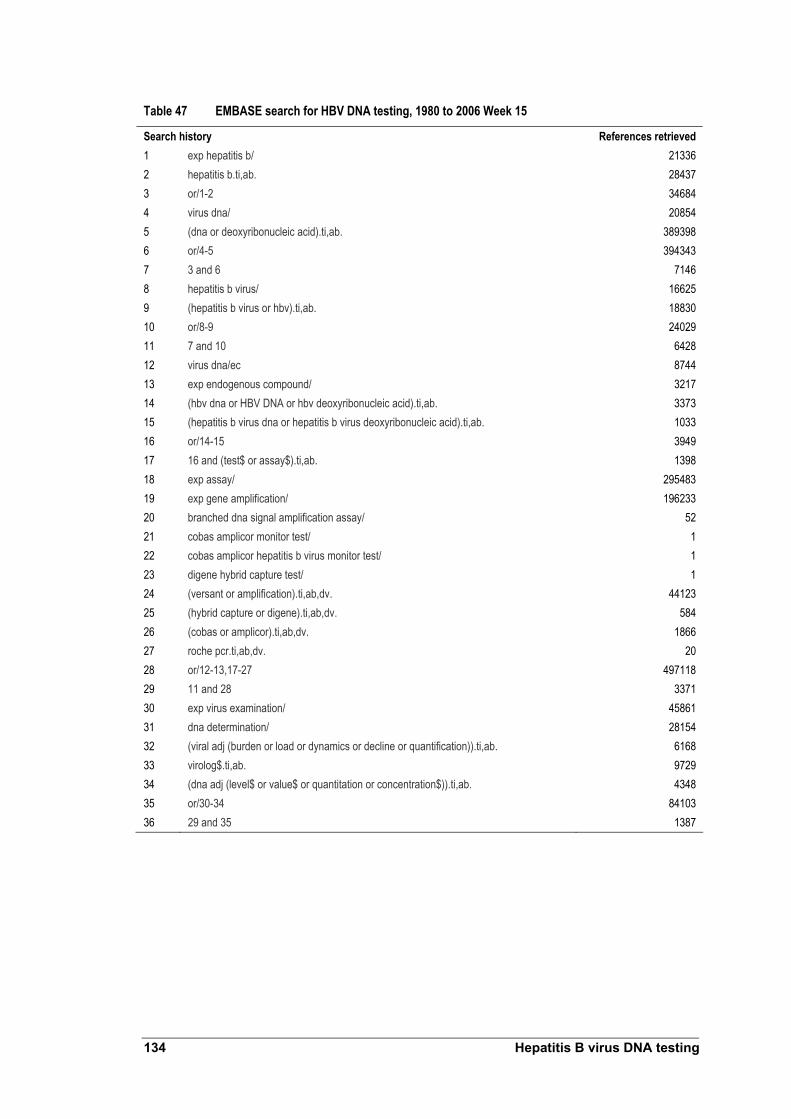
134 Hepatitis B virus DNA testing
Table 47 EMBASE search for HBV DNA testing, 1980 to 2006 Week 15
Search history References retrieved 1 exp hepatitis b/ 21336 2 hepatitis b.ti,ab. 28437 3 or/1-2 34684 4 virus dna/ 20854 5 (dna or deoxyribonucleic acid).ti,ab. 389398 6 or/4-5 394343 7 3 and 6 7146 8 hepatitis b virus/ 16625 9 (hepatitis b virus or hbv).ti,ab. 18830 10 or/8-9 24029 11 7 and 10 6428 12 virus dna/ec 8744 13 exp endogenous compound/ 3217 14 (hbv dna or HBV DNA or hbv deoxyribonucleic acid).ti,ab. 3373 15 (hepatitis b virus dna or hepatitis b virus deoxyribonucleic acid).ti,ab. 1033 16 or/14-15 3949 17 16 and (test$ or assay$).ti,ab. 1398 18 exp assay/ 295483 19 exp gene amplification/ 196233 20 branched dna signal amplification assay/ 52 21 cobas amplicor monitor test/ 1 22 cobas amplicor hepatitis b virus monitor test/ 1 23 digene hybrid capture test/ 1 24 (versant or amplification).ti,ab,dv. 44123 25 (hybrid capture or digene).ti,ab,dv. 584 26 (cobas or amplicor).ti,ab,dv. 1866 27 roche pcr.ti,ab,dv. 20 28 or/12-13,17-27 497118 29 11 and 28 3371 30 exp virus examination/ 45861 31 dna determination/ 28154 32 (viral adj (burden or load or dynamics or decline or quantification)).ti,ab. 6168 33 virolog$.ti,ab. 9729 34 (dna adj (level$ or value$ or quantitation or concentration$)).ti,ab. 4348 35 or/30-34 84103 36 29 and 35 1387

Hepatitis B virus DNA testing 135
Table 48 Cochrane Library search for HBV DNA testing (Issue 2, 5 May 2006)
Search history References retrieved 1 MeSH descriptor Hepatitis B explode all trees in MeSH products 1102 2 "hepatitis b" in All Fields in all products 2719 3 (#1 OR #2) 2719 4 MeSH descriptor DNA, Viral explode all trees in MeSH products� 467 5 dna or "deoxyribonucleic acid" in All Fields in all products 2892 6 (#4 OR #5 2892 7 (#3 AND #6) 570 8 MeSH descriptor Hepatitis B virus explode all trees in MeSH products 365 9 MeSH descriptor Hepatitis B Surface Antigens explode all trees in MeSH products 395 10 "hepatitis b virus" or hbv in All Fields in all products 1229 11 (#8 OR #9 OR #10) 1389 12 (#7 AND #11) 502 13 "hbv dna" or "HBV DNA" or "hbv deoxyribonucleic acid" in All Fields in all products 422
14 "hepatitis b virus dna" or "hepatitis b virus deoxyribonucleic acid" in All Fields in all products 74
15 (#13 OR #14) 471 16 test* or assay* in All Fields in all products 100406 17 (#15 AND #16) 180 18 versant or amplification in All Fields in all products 405 19 "hybrid capture" or digene in All Fields in all products 50 20 cobas or amplicor or "roche pcr" in All Fields in all products 104 21 viral near (burden, load, dynamics, decline, quantification) in All Fields in all products 1075 22 dna near (level*, value*, quantification, concentration*) in All Fields in all products 311 23 virolog* or compar* in All Fields in all products 244191 24 MeSH descriptor Viral Load explode all trees in MeSH products 593 25 comparative study in All Fields in all products 118940 26 (#17 OR #18 OR #19 OR #20 OR #21 OR #22 OR #23 OR #24 OR #25)� 244672 27 (#12 AND #26) 423

136 Hepatitis B virus DNA testing
Secondary databases
Searches of the following secondary databases/sites were also performed:
• Agencia de Evaluación de Tecnologías Sanitarias, España (Spain)
• Agence d’Evaluation des Technologies et des Modes d’Intervention en Santé (AETMIS) (Quebec, Canada)
• Agence Nationale d’Accreditation et d’Evaluation en Santé (France)
• Agency for Healthcare Research and Quality (USA)
• Alberta Heritage Foundation for Medical Research (Canada)
• Austrian Institute of Technology Assessment
• British Columbia Office of Health Technology Assessment (Canada)
• Blue Cross Blue Shield Association Technology Evaluation Center (USA)
• Canadian Agency for Drugs and Technologies in Health (CADTH) [formerly Coordinating Office for Health Technology Assessment (CCOHTA)]
• Catalan Agency for Health Technology Assessment (CAHTA)
• Centre for Health Program Evaluation (Monash University, Australia), Monash University Evidence Centre Reports (Australia)
• Centers for Medicare and Medicaid Services (USA)
• Centre for Reviews and Dissemination (University of York, UK)
• Current Controlled Trials metaRegister and ISRTCN register
• Danish Centre for Evaluation and Health Technology Assessment (DACEHTA)
• Department of Health Publications (UK)
• ECRI (formerly Emergency Care Research Institute) (USA)
• Finnish Office for Health Technology Assessment (FinOHTA)
• German Institute for Medical Documentation and Information (DIMDI)
• Harvard Centre for Risk Analysis: Program on the Economic Evaluation of Health Technology (USA)
• Health Council of the Netherlands
• Health Economics Research Group (Brunel University, UK)

Hepatitis B virus DNA testing 137
• Health Information Research Unit (HIRU) internal database (McMaster University, Canada)
• Health Technology Advisory Committee (Minnesota Department of Health, USA)
• Health Technology Assessment International Conference Proceedings
• Health Technology Board for Scotland (UK)
• Institute for Clinical Evaluative Sciences (Canada)
• Institute for Medical Technology Assessment Erasmus MC (Netherlands)
• International Network of Agencies for Health Technology Assessment (INAHTA)(Sweden)
• International Society of Technology Assessment in Health Care (Montreal, Canada)
• Israel Centre for Technological Assessment of Health Care Services
• Medion Database (Netherlands)
• Monash University Evidence Centre Reports (Australia)
• National Guidelines Clearinghouse (USA)
• National Health and Medical Research Council Australia publication list
• National Health Service Health Technology Assessment Programme (UK)
• National Information Center on Health Services Research and Health Care Technology (HSTAT database) (USA), National Library of Medicine Health Services/Technology Assessment Text (HSTAT) (USA)
• New Zealand Health Technology Assessment
• Scottish Intercollegiate Guidelines Network (SIGN) (Scotland)
• Swedish Council on Technology Assessment in Health Care (SBU)
• Swiss Centre for Technology Assessment (TA-SWISS)
• Swiss Network for Health Technology Assessment (SNHTA)
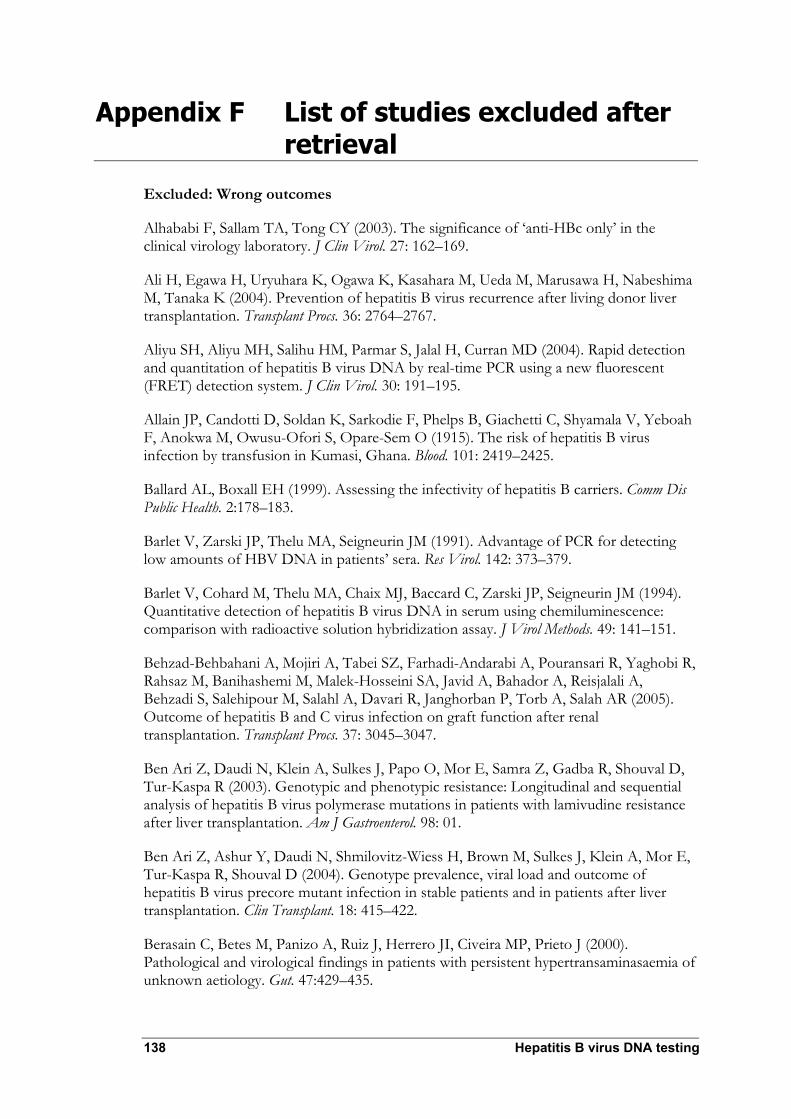
138 Hepatitis B virus DNA testing
Appendix F List of studies excluded after retrieval
Excluded: Wrong outcomes
Alhababi F, Sallam TA, Tong CY (2003). The significance of ‘anti-HBc only’ in the clinical virology laboratory. J Clin Virol. 27: 162–169.
Ali H, Egawa H, Uryuhara K, Ogawa K, Kasahara M, Ueda M, Marusawa H, Nabeshima M, Tanaka K (2004). Prevention of hepatitis B virus recurrence after living donor liver transplantation. Transplant Procs. 36: 2764–2767.
Aliyu SH, Aliyu MH, Salihu HM, Parmar S, Jalal H, Curran MD (2004). Rapid detection and quantitation of hepatitis B virus DNA by real-time PCR using a new fluorescent (FRET) detection system. J Clin Virol. 30: 191–195.
Allain JP, Candotti D, Soldan K, Sarkodie F, Phelps B, Giachetti C, Shyamala V, Yeboah F, Anokwa M, Owusu-Ofori S, Opare-Sem O (1915). The risk of hepatitis B virus infection by transfusion in Kumasi, Ghana. Blood. 101: 2419–2425.
Ballard AL, Boxall EH (1999). Assessing the infectivity of hepatitis B carriers. Comm Dis Public Health. 2:178–183.
Barlet V, Zarski JP, Thelu MA, Seigneurin JM (1991). Advantage of PCR for detecting low amounts of HBV DNA in patients’ sera. Res Virol. 142: 373–379.
Barlet V, Cohard M, Thelu MA, Chaix MJ, Baccard C, Zarski JP, Seigneurin JM (1994). Quantitative detection of hepatitis B virus DNA in serum using chemiluminescence: comparison with radioactive solution hybridization assay. J Virol Methods. 49: 141–151.
Behzad-Behbahani A, Mojiri A, Tabei SZ, Farhadi-Andarabi A, Pouransari R, Yaghobi R, Rahsaz M, Banihashemi M, Malek-Hosseini SA, Javid A, Bahador A, Reisjalali A, Behzadi S, Salehipour M, Salahl A, Davari R, Janghorban P, Torb A, Salah AR (2005). Outcome of hepatitis B and C virus infection on graft function after renal transplantation. Transplant Procs. 37: 3045–3047.
Ben Ari Z, Daudi N, Klein A, Sulkes J, Papo O, Mor E, Samra Z, Gadba R, Shouval D, Tur-Kaspa R (2003). Genotypic and phenotypic resistance: Longitudinal and sequential analysis of hepatitis B virus polymerase mutations in patients with lamivudine resistance after liver transplantation. Am J Gastroenterol. 98: 01.
Ben Ari Z, Ashur Y, Daudi N, Shmilovitz-Wiess H, Brown M, Sulkes J, Klein A, Mor E, Tur-Kaspa R, Shouval D (2004). Genotype prevalence, viral load and outcome of hepatitis B virus precore mutant infection in stable patients and in patients after liver transplantation. Clin Transplant. 18: 415–422.
Berasain C, Betes M, Panizo A, Ruiz J, Herrero JI, Civeira MP, Prieto J (2000). Pathological and virological findings in patients with persistent hypertransaminasaemia of unknown aetiology. Gut. 47:429–435.

Hepatitis B virus DNA testing 139
Bozdayi AM, Uzunalimoglu O, Turkyilmaz AR, Aslan N, Sezgin O, Sahin T, Bozdayi G, Cinar K, Pai SB, Pai R, Bozkaya H, Karayalcin S, Yurdaydin C, Schinazi RF (2003). YSDD: a novel mutation in HBV DNA polymerase confers clinical resistance to lamivudine. J Viral Hep. 10:256–265.
Brook MG, Chan G, Yap I, Karayiannis P, Lever AM, Jacyna M, Main J, Thomas HC (1989). Randomised controlled trial of lymphoblastoid interferon alfa in Europid men with chronic hepatitis B virus infection. BMJ. 299:652–656.
Brook MG, Karayiannis P, Thomas HC (1989). Which patients with chronic hepatitis B virus infection will respond to alpha-interferon therapy? A statistical analysis of predictive factors. Hepatology 10:761–763.
Buti M, Cotrina M, Jardi R, de C, Rodriguez-Frias F, Sanchez-Avila F, Esteban R, Guardia J (2001). Two years of lamivudine therapy in anti-HBe-positive patients with chronic hepatitis B. J Vir Hep. 8: 270–275.
Carreno V, Marcellin P, Hadziyannis S, Salmeron J, Diago M, Kitis GE, Vafiadis I, Schalm SW, Zahm F, Manzarbeitia F, Jimenez FJ, Quiroga JA (1999). Retreatment of chronic hepatitis B e antigen-positive patients with recombinant interferon alfa-2a. The European Concerted Action on Viral Hepatitis (EUROHEP). Hepatology. 30: 277–282.
Chan HL, Hui AY, Wong VW, Chim AM, Wong ML , Sung JJ (2005). Long term follow-up of peginterferon and lamivudine combination treatment in HBeAg-positive chronic hepatitis B. Hepatology. 41:1357–1364.
Chan TM (2004). Antiviral therapy for hepatitis B after kidney transplantation. Transplant Procs. 36:2124–2125.
Chang ML, Chien RN, Yeh CT, Liaw YF (2005). Virus and transaminase levels determine the emergence of drug resistance during long term lamivudine therapy in chronic hepatitis B. J Hepatol. 43:72–77.
Changotra H, Sehajpal PK (2005). Quantitative detection of serum HBV DNA levels employing a new S gene based cPCR assay. Arch Virol. 150: 481–491.
Chien RN, Yeh CT, Tsai SL, Chu CM, Liaw YF (2003). Determinants for sustained HBeAg response to lamivudine therapy. Hepatology. 38: 1267–1273.
Chopra GS, Gupta PK, Anand AC, Varma PP, Nair V, Rai R (2005). Real time-PCR HBV DNA analysis: Significance and first experience in Armed Forces. M J Armed Forces India. 61: 234–237.
Cooley L, Ayres A, Bartholomeusz A, Lewin S, Crowe S, Mijch A, Locarnini S, Sasadeusz J (2003). Prevalence and characterization of lamivudine-resistant hepatitis B virus mutations in HIV-HBV co-infected individuals. AIDS. 17:1649–1657.
Corden S, Ballard AL, Ijaz S, Barbara JAJ, Gilbert N, Gilson RJC, Boxall EH, Tedder RS (2003). HBV DNA levels and transmission of hepatitis B by health care workers. J Clin Virol. 27: 52–58.

140 Hepatitis B virus DNA testing
Di M, Di S, Ferraro D, Almasio PL, Bonura C, Giglio M, Parisi P, Cappello M, Alaimo G, Craxi A (2005). HBV DNA suppression and disease course in HBV cirrhosis patients on long term lamivudine therapy. Antivir Ther. 10: 431–439.
Dienstag JL, Schiff ER, Wright TL, Perrillo RP, Hann HW, Goodman Z, Crowther L, Condreay LD, Woessner M, Rubin M, Brown NA (1999). Lamivudine as initial treatment for chronic hepatitis B in the United States. NEJM. 341:1256–1263.
Dienstag JL, Goldin RD, Heathcote EJ, Hann HW, Woessner M, Stephenson SL, Gardner S, Gray DF, Schiff ER (2003). Histological outcome during long term lamivudine therapy. Gastroenterology. 124: 105–117.
Gerken G, Gomes J, Lampertico P, Colombo M, Rothaar T, Trippler M, Colucci G (1998). Clinical evaluation and applications of the Amplicor HBV Monitor test, a quantitative HBV DNA PCR assay. J Virol Meth. 74:155–165.
Grandjacques C, Pradat P, Stuyver L, Chevallier M, Chevallier P, Pichoud C, Maisonnas M, Trepo C, Zoulim F (2000). Rapid detection of genotypes and mutations in the pre-core promoter and the pre-core region of hepatitis B virus genome: Correlation with viral persistence and disease severity. J Hepatol. 33: 430–439.
Gregorek H, Dzierzanowska-Fangrat K, Woynarowski M, Jozwiak P, Witkowska-Vogtt E, Socha J, Syczewska M, Madalinski K (2005). Persistence of HBV DNA in children with chronic hepatitis B who seroconverted to anti-HBs antibodies after interferon-α therapy: Correlation with specific IgG subclass responses to HBsAg. J Hepatol. 42: 486–490.
Guptan RC, Thakur V, Kazim SN, Sarin SK (2002). Efficacy of granulocyte-macrophage colony-stimulating factor or lamivudine combination with recombinant interferon in non-responders to interferon in hepatitis B virus-related chronic liver disease patients. J Gastroenterol Hepatol. 17:765–771.
Hadziyannis SJ, Tassopoulos NC, Heathcote EJ, Chang TT, Kitis G, Rizzetto M, Marcellin P, Lim SG, Goodman Z, Wulfsohn MS, Xiong S, Fry J, Brosgart CL (2003). Adefovir dipivoxil for the treatment of hepatitis B e antigen-negative chronic hepatitis B. NEJM. 348:27.
Hadziyannis SJ, Tassopoulos NC, Heathcote EJ, Chang TT, Kitis G, Rizzetto M, Marcellin P, Lim SG, Goodman Z, Ma J, Arterburn S, Xiong S, Currie G, Brosgart CL, Adefovir D (2005). Long term therapy with adefovir dipivoxil for HBeAg-negative chronic hepatitis B. NEJM. 352:2673–2681.
Hochberger S, Althof D, De S, Nachbaur N, Rock H, Leying H (2006). Fully automated quantitation of hepatitis B virus (HBV) DNA in human plasma by the COBAS AmpliPrep/COBAS TaqMan System. J Clin Virol. 35: 373–380.
Hoofnagle JH (1987). Levamisole in chronic hepatitis: A favorable trend is not enough. Hepatol. 7:597–598.
Hope RL, Weltman M, Dingley J, Fiatarone J, Hope AH, Craig PI, Grierson JM , Bilous M, Williams SJ, Farrell GC (1995). Interferon alfa for chronic active hepatitis B. Long term follow-up of 62 patients: outcomes and predictors of response. MJA. 162:8–11.

Hepatitis B virus DNA testing 141
Hosaka T, Suzuki F, Suzuki Y, Saitoh S, Kobayashi M, Someya T, Sezaki H, Akuta N, Tsubota A, Arase Y, Ikeda K, Kumada H (2004). Adefovir dipivoxil for treatment of breakthrough hepatitis caused by lamivudine-resistant mutants of hepatitis B virus. Intervirol. 47:362–369.
Ide T, Kumashiro R, Koga Y, Tanaka E, Hino T, Hisamochi A, Murashima S, Ogata K, Tanaka K, Kuwahara R, Sata M (2003). A real-time quantitative polymerase chain reaction method for hepatitis B virus in patients with chronic hepatitis B treated with lamivudine. Am J Gastroenterol. 98: 2048–2051.
Ito K, Tanaka Y, Orito E, Hirashima N, Ide T, Hino T, Kumashiro R, Kato A, Nukaya H, Sakakibara K, Mukaide M, Ito H, Sata M, Ueda R, Mizokami M (2004). Predicting relapse after cessation of Lamivudine monotherapy for chronic hepatitis B virus infection. Clin Infect Dis. 38: 490–495.
Kato M, Yuki N, Kaneko A, Yamamoto K, Masuzawa M, Hayashi N (2004). Changes in virus loads and precore mutations in chronic hepatitis B patients treated with 4 weeks of daily interferon alfa-2a therapy. Hepatol Res. 28: 73–78.
Kobayashi M, Akuta N, Suzuki F, Suzuki Y, Arase Y, Ikeda K, Hosaka T, Saitoh S, Kobayashi M, Someya T, Sato J, Watabiki S, Miyakawa Y, Kumada H (2006). Virological outcomes in patients infected chronically with hepatitis B virus genotype A in comparison with genotypes B and C. J Med Virol. 78: 60–67.
Kohmoto M, Enomoto M, Yano Y, Otani S, Minamitani S, Tamori A, Habu D, Takeda T, Shiomi S, Seki S, Arakawa T, Nishiguchi S (2003). Detection of serum hepatitis B virus DNA by real-time quantitative polymerase chain reaction (TaqMan PCR) during lamivudine treatment: Comparison with three other assays. Hepatol Res. 26: 125–133.
Kuhns MC, McNamara AL, Perrillo RP, Cabal CM, Campbel CR (1989). Quantitation of hepatitis B viral DNA by solution hybridization: comparison with DNA polymerase and hepatitis B e antigen during antiviral therapy. J Med Virol. 27: 274–281.
Kumashiro R, Kuwahara R, Ide T, Koga Y, Arinaga T, Hisamochi A, Ogata K, Tanaka K, Sata M (2003). Subclones of drug-resistant hepatitis B virus mutants and the outcome of breakthrough hepatitis in patients treated with lamivudine. Intervirol. 46: 350–354.
Kurihara T, Imazeki F, Yokosuka O, Fukai K, Kanda T, Kawai S, Saisho H (2005). Effect of lamivudine in HBeAg-positive chronic hepatitis B: Discordant effect on HBeAg and HBV DNA according to pretreatment ALT level. World JGastroenterol. 11:3346–3350.
Lai CL, Dienstag J, Schiff E, Leung NWY, Atkins M, Hunt C, Brown N, Woessner M, Boehme R, Condreay L (2003). Prevalence and clinical correlates of YMDD variants during lamivudine therapy for patients with chronic hepatitis B. Clin Infect Dis. 36: 687–696.
Liaw YF, Tsai SL, Sheen IS, Chao M, Yeh CT , Hsieh SY, Chu CM (1998). Clinical and virological course of chronic hepatitis B virus infection with hepatitis C and D virus markers. Am J Gastroenterol. 93: 354–359.

142 Hepatitis B virus DNA testing
Liaw YF, Leung NW, Chang TT, Guan R, Tai DI, Ng KY, Chien RN, Dent J, Roman L, Edmundson S, Lai CL (2000). Effects of extended lamivudine therapy in Asian patients with chronic hepatitis B. Asia Hepatitis Lamivudine Study Group. Gastroenterol. 119:172–180.
Lin CL, Liao LY, Wang CS, Chen PJ, Lai MY, Chen DS, Kao JH (2004). Evolution of hepatitis B virus precore/basal core promoter gene in HBeAg-positive chronic hepatitis B patients receiving lamivudine therapy. Liver Int. 24: 9–15.
Lindh M, Furuta Y, Ljunggren KK, Norkrans G, Horal P (1995). Detection of hepatitis B virus precore TAG mutant by an amplification- created restriction site method. J Infect Dis. 171:194–197.
Marcellin P, Chang TT, Lim S, Sievert W, Tong M, Arterburn S, Xiong S, Brosgart CL, Currie G (2004). Long term efficacy and safety of adefovir dipivoxil (ADV) 10 mg in HBeAg+ chronic hepatitis B (CHB) patients: increasing serologic, virologic and biochemical response over time. Hepatol. 40: 655A.
Marrone A, Zampino R, Luongo G, Utili R, Karayiannis P, Ruggiero G (2003). Low HBeAg serum levels correlate with the presence of the double A1762T/G1764A core promoter mutation and a positive response to interferon in patients with chronic hepatitis B virus infection. Intervirol. 46: 222–226.
Mellerup MT, Krogsgaard K, Mathurin P, Gluud C, Poynard T (2005). Sequential combination of glucocorticosteroids and alfa interferon versus alfa interferon alone for HBeAg-positive chronic hepatitis B.The Cochrane.Database of Systematic Reviews: Reviews 200.
Naoumov NV, Lopes AR, Burra P, Caccamo L, Iemmolo RM, de Man RA, Bassendine M, O’Grady JG, Portmann BC, Anschuetz G, Barrett CA, Williams R, Atkins M (2001). Randomized trial of lamivudine versus hepatitis B immunoglobulin for long term prophylaxis of hepatitis B recurrence after liver transplantation. J Hepatol. 34: 888–894.
Rodriguez IE, Bartolome J, Lopez-Alcorocho JM, Contonat T, Oliva H, Carreno V (1997). Activation of liver disease in healthy hepatitis B surface antigen carriers during interferon-alpha treatment. J Med Virol. 53: 76–80.
Santantonio T, Niro GA, Sinisi E, Leandro G, Insalata M, Guastadisegni A, Facciorusso D, Gravinese E, Andriulli A, Pastore G (2002). Lamivudine/interferon combination therapy in anti-HBe positive chronic hepatitis B patients: A controlled pilot study. J Hepatol. 36: 799–804.
Scotto G, Palumbo E, Fazio V, Saracino A, Angarano G (2006). Extended lamivudine treatment in patients affected by chronic active anti-Hbe positive hepatitis. J Chemo. 18:43–48.
Shouval D, Lai CL, Cheinquer H, Lok A, Arbor A, DeHertogh D, WilberR, Cross A, Zink R, Fernandes L (2004). Entecavir shows superior histologic and virologic efficacy over lamivudine in nucleoside-naive HBeAg(-) chronic hepatitis B: results of phase III trial ETV-027. Hepatol. 40:728A.

Hepatitis B virus DNA testing 143
Soderstrom A, Lindh M, Ekholm K, Conradi N, Horal P, Krantz M, Hultgren C, Norkrans G (2005). Predictive factors and virological response to interferon treatment in children with chronic hepatitis B. Scand J Infect Dis. 37:40–47.
Sun J, Wang Z, Ma S, Zeng G, Zhou Z, Luo K, Hou J (2005). Clinical and virological characteristics of lamivudine resistance in chronic hepatitis B patients: a single center experience. J Med Virol. 75: 391–398.
Thomas HC, Karayiannis P, Brook G (1991). Treatment of hepatitis B virus infection with interferon. Factors predicting response to interferon. J Hepatol. 13 Suppl 1: S4–S7.
Yang H, Westland CE, Delaney WE, Heathcote EJ, Ho V, Fry J, Brosgart C, Gibbs CS, Miller MD, Xiong S (2002). Resistance surveillance in chronic hepatitis B patients treated with adefovir dipivoxil for up to 60 weeks. Hepatol. 36: 464–473.
Zhou DY, Lin LY, Wang H, Huang JS (2003). The relationship between HBV lamivudine resistance and HBV genotypes or basic core promoter mutations. Hepatobil Pancreat Dis Int. 2: 85–89.
Excluded: Wrong usage
Aras C, Ozdamar A, Ergin S, Ozturk R, Midilli K, Karacorlu M, Ozkan S (2005). Failure to detect hepatitis B virus in vitreous by polymerase chain reaction. Ophthalmologica. 219:93–96.
Berger A, Doerr HW, Rabenau HF, Weber B (2000). High frequency of HCV infection in individuals with isolated antibody to hepatitis B core antigen. Intervirol. 43:71–76.
Chemin I, Zoulim F, Merle P, Arkhis A, Chevallier M, Kay A, Cova L, Chevallier P, Mandrand B, Trepo C (2001). High incidence of hepatitis B infections among chronic hepatitis cases of unknown aetiology. J Hepatol. 34: 447–454.
Kannangai R, Molmenti E, Arrazola L, Klein A, Choti M, Thomas DL, Torbenson M, Torbenson M (2004). Occult hepatitis B viral DNA in liver carcinomas from a region with a low prevalence of chronic hepatitis B infection. J Vir Hep. 11: 297–301.
Kasprzak A, Biczysko W, Zabel M, Wysocki J, Surdyk-Zasada J (1999). Studies on tissue expression of HBV in children with chronic hepatitis type B using Immunomax technique. Pol J Pathol. 50: 249–258.
Excluded: No reference standard
Chen CH, Lee CM, Wang JH, Tung HD, Hung CH , Lu SN (2004). Correlation of quantitative assay of hepatitis B surface antigen and HBV DNA levels in asymptomatic hepatitis B virus carriers. Euro J Gastroenterol Hepatol. 16: (11):1213-8
Chun YK, Kim JY, Woo HJ, Oh SM, Kang I, Ha J, Kim SS (2000). No significant correlation exists between core promoter mutations, viral replication, and liver damage in chronic hepatitis B infection. Hepatol. 32:1154–1162.
Hasan KN, Rumi MA, Hasanat MA, Azam MG, Ahmed S, Salam MA, Islam LN, Hassan MS (2002). Chronic carriers of hepatitis B virus in Bangladesh: a comparative analysis of

144 Hepatitis B virus DNA testing
HBV DNA, HBeAg/anti-HBe, and liver function tests. Southeast Asian J Trop Med Public Health. 33: 110–117.
Sakugawa H, Nakasone H, Nakayoshi T, Kawakami Y, Yamashiro T, Maeshiro T, Kinjo F, Saito A (2001). Correlation between serum transaminase activity and virus load among patients with chronic liver disease type B. Hepatol Res. 21:159–168.
Zoulim F, Mimms L, Floreani M, Pichoud C, Chemin I, Kay A, Vitvitski L, Trepo C (1992). New assays for quantitative determination of viral markers in management of chronic hepatitis B virus infection. J Clin Microbiol. 30(5):1111-1119
Excluded: Inadequate data separation/reporting
Ahmed SNS, Tavan D, Pichoud C, Berby F, Stuyver L, Johnson M, Merle P, Abidi H, Trepo C, Zoulim F (2000). Early detection of viral resistance by determination of hepatitis B virus polymerase mutations in patients treated by lamivudine for chronic hepatitis B. Hepatol. 32:1078–1088.
Ahn SH, Park YN, Park JY, Chang HY, Lee JM , Shin JE, Han KH, Park C, Moon YM, Chon CY (2005). Long term clinical and histological outcomes in patients with spontaneous hepatitis B surface antigen seroclearance. J Hepatol. 42:188–194.
Akdogan M, Senturk H, Mert A, Tabak F, Ozbay G (2003). Acute exacerbation during interferon alfa treatment of chronic hepatitis B: Frequency and relation to serum beta-2 microglobulin levels. J Gastroenterol. 38: 01.
Arase Y, Ikeda K, Murashima N, Chayama K, Tsubota A, Koida I, Suzuki Y, Saitoh S, Kobayashi M, Kobayashi M, Kumada H (1999). Time course of histological changes in patients with a sustained biochemical and virological response to corticosteroid withdrawal therapy for chronic hepatitis B. Am J Gastroenterol. 94: 3304–3309.
Arase Y, Ikeda K, Suzuki F, Suzuki Y, Saitoh S, Kobayashi M, Akuta N, Someya T, Hosaka T, Sezaki H, Kobayashi M, Kumada H (2006). Long term outcome after hepatitis B surface antigen seroclearance in patients with chronic hepatitis B. Am J Med. 119:71–16.
Barbaro G, Zechini F, Pellicelli AM, Francavilla R, Scotto G, Bacca D, Bruno M, Babudieri S, Annese M, Matarazzo F, Di S, Barbarini G, Lamivudine I (2001). Long term efficacy of interferon alpha-2b and lamivudine in combination compared to lamivudine monotherapy in patients with chronic hepatitis B. An Italian multicenter, randomized trial. J Hepatol. 35:406–411.
Bell SJ, Lau A, Thompson A, Watson KJ, Demediuk B, Shaw G, Chen RY, Ayres A, Yuen L, Bartholomeusz A, Locarnini SA, Desmond PV (2005). Chronic hepatitis B: recommendations for therapy based on the natural history of disease in Australian patients. J Clin Virol. 32:122–127.
Benhamou Y, Bochet M, Thibault V, Di M, Caumes E, Bricaire F, Opolon P, Katlama C, Poynard T (1999). Long term incidence of hepatitis B virus resistance to lamivudine in human immunodeficiency virus-infected patients. Hepatol. 30:1302–1306.

Hepatitis B virus DNA testing 145
Bozkaya H, Yurdaydin C, Idilman R, Tuzun A, Cinar K, Erkan O, Bozdayi AM, Erden E, Uzun Y, Cetinkaya H, Uzunalimoglu O (2005). Lamivudine treatment in HBeAg-negative chronic hepatitis B patients with low level viraemia. Antivir Ther. 10:319–325.
Brissot P, Jacquelinet C, Jouanolle H, David V, Guyader D, Gueguen M, Blayau M, Lescoat G, Messner M, Deugnier Y (1991). Short term prednisolone followed by recombinant human alpha-interferon alone or combined with adenine-arabinoside in chronic hepatitis B. A prospective and randomized trial. J Hepatol. 12:181–189.
Brook MG, Petrovic L, McDonald JA, Scheuer PJ, Thomas HC (1989). Histological improvement after anti-viral treatment for chronic hepatitis B virus infection. J Hepatol. 8:218–225.
Buti M, Jardi R, Rodriguez-Frias F, Allende H, Cotrina M, Esteban R, Guardia J (1996). Interferon vs. adenine arabinoside 5'-monophosphate in patients with anti-HBe-positive chronic hepatitis. J Med Virol. 49: 325–328.
Catterall AP, King R, Lau JY, Daniels HM, Alexander GJ, Murray L, I, Williams R (1993). Interferon-alpha therapy with and without interferon-alpha priming in patients with chronic hepatitis B infection. J Antimicrob Chemo. 31:777–782.
Chan HL, Tsang SW, Liew CT, Tse CH, Wong ML, Ching JY, Leung NW, Tam JS, Sung JJ (2002). Viral genotype and hepatitis B virus DNA levels are correlated with histological liver damage in HBeAg-negative chronic hepatitis B virus infection. Am J Gastroenterol. 97:406–412.
Chan HY, Hui AY, Wong VS, Chim AL, Wong ML , Sung JY (2005). Long term follow-up of peginterferon and lamivudine combination treatment in HBeAg-positive chronic hepatitis B. Hepatol. 41: 1357–1364.
Chan HY, Leung NY, Hui AY, Wong VS, Liew CT, Chim AL, Chan FL, Hung LT, Lee YT, Tam JL, Lam CK, Sung JY (2005). A randomized, controlled trial of combination therapy for chronic hepatitis B: Comparing pegylated interferon-a2b and lamivudine with lamivudine alone. Ann Int Med. 142:15.
Chang TT, Gish RG, de M, Gadano A, Sollano J, Chao YC, Lok AS, Han KH, Goodman Z, Zhu J, Cross A, DeHertogh D, Wilber R, Colonno R, Apelian D (2006). A comparison of entecavir and lamivudine for HBeAg-positive chronic hepatitis B. NEJM. 354:1001–1011.
Chen JY, Wang LW, Sun XM, Gong ZJ (2005). Effects of HBV gene variations on disease development and antiviral therapy for patients with chronic hepatitis B. Hepatobil Pancreat Dis Int. 4: 393–397.
Chu CJ, Hussain M, Lok ASF (2002). Quantitative serum HBV DNA levels during different stages of chronic hepatitis B infection. Hepatol. 36:1408–1415.
Dai CY, Yu ML, Chuang WL, Lin ZY, Chen SC, Hsieh MY, Wang LY, Tsai JF, Chang WY (2001). Influence of hepatitis C virus on the profiles of patients with chronic hepatitis B virus infection. J Gastroenterol Hepatol. 16:636–640.
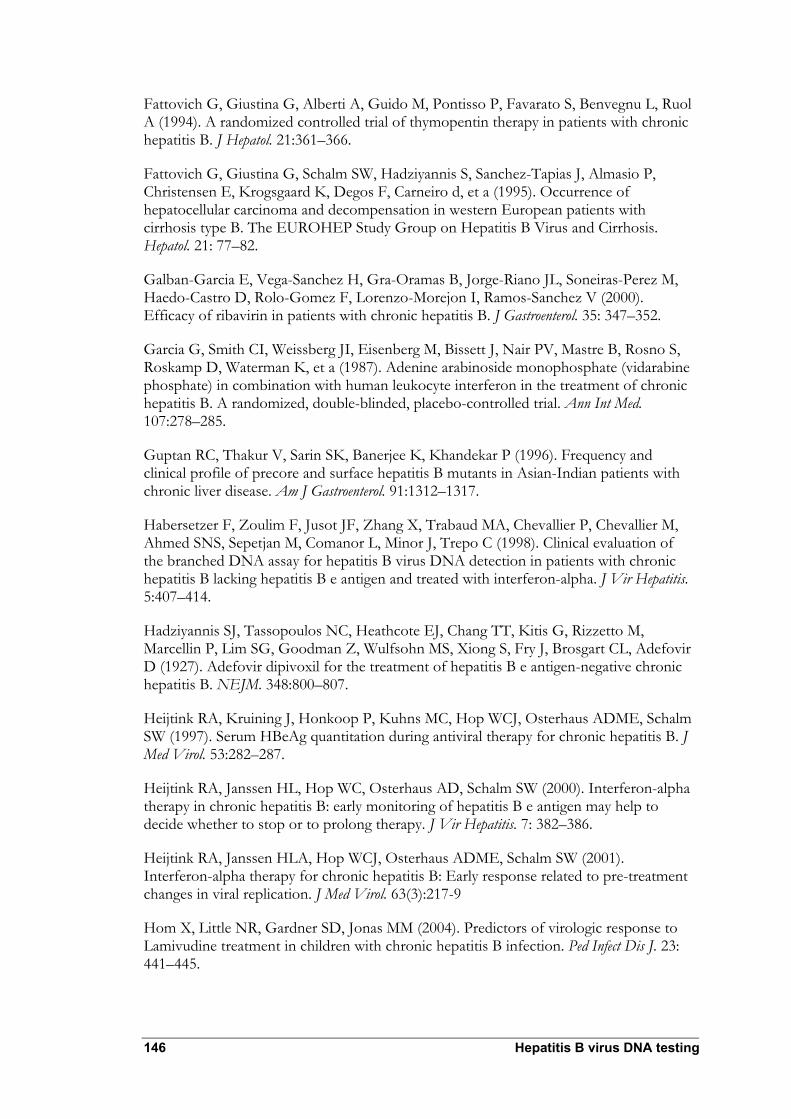
146 Hepatitis B virus DNA testing
Fattovich G, Giustina G, Alberti A, Guido M, Pontisso P, Favarato S, Benvegnu L, Ruol A (1994). A randomized controlled trial of thymopentin therapy in patients with chronic hepatitis B. J Hepatol. 21:361–366.
Fattovich G, Giustina G, Schalm SW, Hadziyannis S, Sanchez-Tapias J, Almasio P, Christensen E, Krogsgaard K, Degos F, Carneiro d, et a (1995). Occurrence of hepatocellular carcinoma and decompensation in western European patients with cirrhosis type B. The EUROHEP Study Group on Hepatitis B Virus and Cirrhosis. Hepatol. 21: 77–82.
Galban-Garcia E, Vega-Sanchez H, Gra-Oramas B, Jorge-Riano JL, Soneiras-Perez M, Haedo-Castro D, Rolo-Gomez F, Lorenzo-Morejon I, Ramos-Sanchez V (2000). Efficacy of ribavirin in patients with chronic hepatitis B. J Gastroenterol. 35: 347–352.
Garcia G, Smith CI, Weissberg JI, Eisenberg M, Bissett J, Nair PV, Mastre B, Rosno S, Roskamp D, Waterman K, et a (1987). Adenine arabinoside monophosphate (vidarabine phosphate) in combination with human leukocyte interferon in the treatment of chronic hepatitis B. A randomized, double-blinded, placebo-controlled trial. Ann Int Med. 107:278–285.
Guptan RC, Thakur V, Sarin SK, Banerjee K, Khandekar P (1996). Frequency and clinical profile of precore and surface hepatitis B mutants in Asian-Indian patients with chronic liver disease. Am J Gastroenterol. 91:1312–1317.
Habersetzer F, Zoulim F, Jusot JF, Zhang X, Trabaud MA, Chevallier P, Chevallier M, Ahmed SNS, Sepetjan M, Comanor L, Minor J, Trepo C (1998). Clinical evaluation of the branched DNA assay for hepatitis B virus DNA detection in patients with chronic hepatitis B lacking hepatitis B e antigen and treated with interferon-alpha. J Vir Hepatitis. 5:407–414.
Hadziyannis SJ, Tassopoulos NC, Heathcote EJ, Chang TT, Kitis G, Rizzetto M, Marcellin P, Lim SG, Goodman Z, Wulfsohn MS, Xiong S, Fry J, Brosgart CL, Adefovir D (1927). Adefovir dipivoxil for the treatment of hepatitis B e antigen-negative chronic hepatitis B. NEJM. 348:800–807.
Heijtink RA, Kruining J, Honkoop P, Kuhns MC, Hop WCJ, Osterhaus ADME, Schalm SW (1997). Serum HBeAg quantitation during antiviral therapy for chronic hepatitis B. J Med Virol. 53:282–287.
Heijtink RA, Janssen HL, Hop WC, Osterhaus AD, Schalm SW (2000). Interferon-alpha therapy in chronic hepatitis B: early monitoring of hepatitis B e antigen may help to decide whether to stop or to prolong therapy. J Vir Hepatitis. 7: 382–386.
Heijtink RA, Janssen HLA, Hop WCJ, Osterhaus ADME, Schalm SW (2001). Interferon-alpha therapy for chronic hepatitis B: Early response related to pre-treatment changes in viral replication. J Med Virol. 63(3):217-9
Hom X, Little NR, Gardner SD, Jonas MM (2004). Predictors of virologic response to Lamivudine treatment in children with chronic hepatitis B infection. Ped Infect Dis J. 23: 441–445.

Hepatitis B virus DNA testing 147
Hoofnagle JH, Hanson RG, Minuk GY, Pappas SC, Schafer DF, Dusheiko GM, Straus SE, Popper H, Jones EA (1984). Randomized controlled trial of adenine arabinoside monophosphate for chronic type B hepatitis. Gastroenterol. 86: 150–157.
Hsia CC, Scudamore CH, Di B, Tabor E (2003). Molecular and serological aspects of HBsAg-negative hepatitis B virus infections in North America. J Med Virol. 70: 20–26.
Hsu YS, Chien RN, Yeh CT, Sheen IS, Chiou HY, Chu CM, Liaw YF (2002). Long term outcome after spontaneous HBeAg seroconversion in patients with chronic hepatitis B. Hepatol. 35: 1522–1527.
Huy TTT, Ushijima H, Quang VX, Ngoc TT, Hayashi S, Sata T, Abe K (2004). Characteristics of core promoter and precore stop codon mutants of hepatitis B virus in Vietnam. J Med Virol. 74: 228–236.
Jiang JJ, Dubois F, Driss F, Carnot F, Thepot V, Pol S, Berthelot P, Brechot C, Nalpas B (1995). Clinical impact of drug addiction in alcoholics. Alcohol Alcoholism. 30: 55–60.
Kamito H, Nakata K, Hamasaki K, Daikoku M, Mawatari F, Ueki T, Hayashida Y , Nakao K, Kato Y, Nagataki S (1996). Detection of hepatitis B virus genome in hepatocellular carcinoma from both hepatitis B surface antigen- and antibody to hepatitis C virus-negative patients: A study using polymerase chain reaction. Oncology Reports. 3:619–623.
Kanno A, Ohori H, Matsuda K, Nakayama H, Miyazaki Y, Ishii M, Suzuki H, Ohtsuki M, Goto Y (1987). Virological significance of HBeAg subtypes (HBeAg/1 and HBeAg/2) in patients with type B hepatitis. Hepatol. 7: 15–19.
Karabay O, Tamer A, Tahtaci M, Vardi S, Celebi H (2005), Effectiveness of lamivudine and interferon-a combination therapy versus interferon-a monotherapy for the treatment of HBeAg-negative chronic hepatitis B patients: A randomized clinical trial. J Microbiol Immunol Infect. 38: 262–266.
Komori M, Yuki N, Nagaoka T, Yamashiro M, Mochizuki K, Kaneko A, Yamamoto K, Hikiji K, Kato M (2001). Long term clinical impact of occult hepatitis B virus infection in chronic hepatitis B patients. J Hepatol. 35: 798–804.
Lai CL, Chien RN, Leung NW, Chang TT, Guan R, Tai DI, Ng KY, Wu PC, Dent JC, Barber J, Stephenson SL, Gray DF (1998). A one-year trial of lamivudine for chronic hepatitis B. Asia Hepatitis Lamivudine Study Group. NEJM. 339:61–68.
Lai CL, Shouval D, Lok AS, Chang TT, Cheinquer H, Goodman Z, DeHertogh D, Wilber R, Zink RC, Cross A, Colonno R, Fernandes L, BEHoLD AI (2006). Entecavir versus lamivudine for patients with HBeAg-negative chronic hepatitis B. NEJM. 354: 1011–1020.
Lampertico P, Del Ninno E, Manzin A, Donato MF, Rumi MG, Lunghi G, Morabito A, Clementi M, Colombo M (1997). A randomized, controlled trial of a 24-month course of interferon alfa 2b in patients with chronic hepatitis B who had hepatitis B virus DNA without hepatitis B e antigen in serum. Hepatol. 26:1621–1625.

148 Hepatitis B virus DNA testing
Lau DT, Khokhar MF, Doo E, Ghany MG, Herion D, Park Y, Kleiner DE, Schmid P, Condreay LD, Gauthier J, Kuhns MC, Liang TJ, Hoofnagle JH (2000). Long term therapy of chronic hepatitis B with lamivudine. Hepatol. 32:828–834.
Leung NWY, Lai CL, Chang TT, Guan R, Lee CM, Ng KY, Lim SG, Wu PC, Dent JC, Edmundson S, Condreay LD, Chien RN (2001). Extended lamivudine treatment in patients with chronic hepatitis B enhances hepatitis B e antigen seroconversion rates: Results after 3 years of therapy. Hepatol. 33:1527–1532.
Liaw YF, Pao CC, Chu CM, et al (1987). Changes of serum hepatitis B virus DNA in two types of clinical events preceding spontaneous hepatitis B e antigen seroconversion in chronic type B hepatitis. Hepatol. 7: 1–3.
Liaw YF, Chien RN, Yeh CT, Tsai SL, Chu CM (1999). Acute exacerbation and hepatitis B virus clearance after emergence of YMDD motif mutation during lamivudine therapy. Hepatol. 30:567–572.
Lim SG, Ng TM, Kung N, Krastev Z, Volfova M, Husa P, Lee SS, Chan S, Shiffman ML, Washington MK, Rigney A, Anderson J, Mondou E, Snow A, Sorbel J, Guan R, Rousseau F, Emtricitabine FTCB (2006). A double-blind placebo-controlled study of emtricitabine in chronic hepatitis B. Arch Int Med. 166:49–56.
Madan K, Batra Y, Panda SK, Dattagupta S, Hazari S, Jha JK, Acharya SK (2004). Role of polymerase chain reaction and liver biopsy in the evaluation of patients with asymptomatic transaminitis: Implications in diagnostic approach. J Gastroenterol Hepatol. 19: 1291–1299.
Manno M, Camma C, Schepis F, Bassi F, Gelmini R, Giannini F, Miselli F, Grottola A, Ferretti I, Vecchi C, De P, Villa E (2004). Natural history of chronic HBV carriers in northern Italy: morbidity and mortality after 30 years. Gastroenterol. 127:756–763.
Manolakopoulos S, Bethanis S, Elefsiniotis J, Karatapanis S, Triantos C, Sourvinos G, Touloumi G, Economou M, Vlachogiannakos J, Spandidos D, Avgerinos A, Tzourmakliotis D (2006). Lamivudine monotherapy in HBeAg-negative chronic hepatitis B: Prediction of response-breakthrough and long term clinical outcome. Aliment Pharmacol Thera. 23:787–795.
Marcellin P, Chang TT, Lim SG, Tong MJ, Sievert W, Shiffman ML, Jeffers L, Goodman Z, Wulfsohn MS, Xiong S, Fry J, Brosgart CL (2003). Adefovir dipivoxil for the treatment of hepatitis B e antigen-positive chronic hepatitis B. NEJM. 348: 27.
Maruyama T, Iino S, Koike K, Yasuda K, Milich DR (1993). Serology of acute exacerbation in chronic hepatitis B virus infection. Gastroenterol. 105: 1141–1151.
Molina J, Bartolome J, Moraleda G, Ruiz MM, Rua MJ, Moreno A, Carreno V (1992). Persistence of hepatitis B virus DNA after reduction of viral replication in serum and liver. J Med Virol. 38:11–15.
Morimitsu Y, Kleiner DE, Jr., Conjeevaram HS, Hsia CC, Di Bisceglie AM, Tabor E (1995). Expression of transforming growth factor alpha in the liver before and after interferon alfa therapy for chronic hepatitis B. Hepatol. 22: 1021–1026.

Hepatitis B virus DNA testing 149
Mutchnick MG, Lindsay KL, Schiff ER, Cummings GD, Appelman HD, Peleman RR, Silva M, Roach KC, Simmons F, Milstein S, Gordon SC, Ehrinpreis MN (1999). Thymosin alpha1 treatment of chronic hepatitis B: results of a phase III multicentre, randomized, double-blind and placebo-controlled study. J Vir Hep. 6:397–403.
Mutluay R, Ozenirler S, Poyraz A (2005). The expression of bcl-2 in chronic liver diseases. Saudi Med J. 26(8):1245-9.
Pawlotsky JM, Bastie A, Lonjon I, Remire J, Darthuy F, Soussy CJ, Dhumeaux D (1997). What technique should be used for routine detection and quantification of HBV DNA in clinical samples? J Virolog Meth. 65: 245–253.
Pawlowska M, Halota W (2005). Clearance of HBV serologic markers in children as a putative result of HCV superinfection. Int Rev Allergol Clin Immunol. 11: 104–107.
Perrillo R, Mimms L, Schechtman K, Robbins D, Campbell C (1993). Monitoring of antiviral therapy with quantitative evaluation of HBeAg: a comparison with HBV DNA testing. Hepatol. 18: 1306–1312.
Perrillo RP, Lai CL, Liaw YF, Dienstag JL, Schiff ER, Schalm SW, Heathcote EJ, Brown NA, Atkins M, Woessner M, Gardner SD (2002). Predictors of HBeAg loss after lamivudine treatment for chronic hepatitis B. Hepatol. 36:186–194.
Rodriguez I, Mariscal L, Bartolome J, Castillo I, Navacerrada C, Ortiz-Movilla N, Pardo M, Carreno V (2003). Distribution of hepatitis B virus in the liver of chronic hepatitis C patients with occult hepatitis B virus infection, J Med Virol. 70:571–580.
Sakhuja P, Malhotra V, Gondal R, Sarin SK, Guptan R, Thakur V (2004). Histological spectrum of chronic hepatitis in precore mutants and wild-type hepatitis B virus infection. Trop Doc. 34: 147–149.
Simon K, Rotter K, Zalewska M, Gladysz A (2000). HBV DNA level in blood serum as a predictor of good response to therapy with interferon-alpha-2b of patients with chronic hepatitis B. Med Sci Mon. 6:971–975.
Suzuki Y, Arase Y, Ikeda K, Saitoh S, Tsubota A, Suzuki F, Kobayashi M, Akuta N, Someya T, Miyakawa Y, Kumada H (2003). Histological improvements after a three-year lamivudine therapy in patients with chronic hepatitis B in whom YMDD mutants did not or did develop. Intervirol. 46:164–170.
Tanaka Y, Yeo AET, Orito E, Ito K, Hirashima N, Ide T, Sata M, Mizokami M (2004). Prognostic indicators of breakthrough hepatitis during lamivudine monotherapy for chronic hepatitis B virus infection. J Gastroenterol. 39:769–775.
Ter B, Ten K, Cuypers HTM, Leentvaar-Kuijpers A, Oosting J, Wertheim-van D, Honkoop P, Rasch MC, de M, Van H, Chamuleau RAF, Reesink HW, Jones EA (1998). Relation between laboratory test results and histological hepatitis activity in individuals positive for hepatitis B surface antigen and antibodies to hepatitis B e antigen. Lancet. 351:27.
Thakeb F, El Serafy M, Zakaria S, Monir B, Lashin S, Marzaban R, El Awady M (2005). Evaluation of liver tissue by polymerase chain reaction for hepatitis B virus in patients with negative viremia. World J Gastroenterol. 11:6853–6857.

150 Hepatitis B virus DNA testing
Tulek N, Saglam SK, Saglam M, Turkyilmaz R, Yildiz M (2000). Soluble interleukin-2 receptor and interleukin-10 levels in patients with chronic hepatitis B infection. Hepato-Gastroenterol. 47:828–831.
Weller IV, Lok AS, Mindel A, Karayiannis P, Galpin S, Monjardino J, Sherlock S, Thomas HC (1985). Randomised controlled trial of adenine arabinoside 5-monophosphate (ARA-AMP) in chronic hepatitis B virus infection. Gut. 26:745–751.
Wu JC, Lee SD, Wang JY, et al (1987). Correlation between hepatic hepatitis B core antigen and serum hepatitis B virus-DNA levels in patients with chronic hepatitis B virus infections in Taiwan. Arch Pathol Lab Med. 111:181–184.
Yalcin K, Yildiz F, Degertekin H, Celik Y (2002). A 12 months course of interferon and lamivudine combination therapy versus interferon monotherapy for untreated chronic hepatitis B infection. J Hepatol. 36:138.
Yalcin K, Degertekin H, Yildiz F, Celik Y (2003). Markers of disease activity in chronic hepatitis B virus infection. Clin Invest Med. 26:27–34.
Yoon SK, Jang JW, Kim CW, Bae SH, Choi JY, Choi SW, Lee YS, Lee CD, Chung KW, Sun HS, Kim BS (2005). Long term results of lamivudine monotherapy in Korean patients with HBeAg-positive chronic hepatitis B: response and relapse rates, and factors related to durability of HBeAg seroconversion. Intervirol. 48:341–349.
Yuan HJ, Yuen MF, Ka-Ho W, Sablon E, Lai CL (2005). The relationship between HBV DNA levels and cirrhosis-related complications in Chinese with chronic hepatitis B. J Vir Hepatitis. 12:373–379.
Yuen MF, Sablon E, Hui CK, Yuan HJ, Decraemer H, Lai CL (2001). Factors associated with hepatitis B virus DNA breakthrough in patients receiving prolonged lamivudine therapy. Hepatol. 34:785–791.
Yuen MF, Wong DK, Sablon E, Tse E, Ng IO, Yuan HJ, Siu CW, Sander TJ, Bourne EJ, Hall JG, Condreay LD, Lai CL (2004). HBsAg seroclearance in chronic hepatitis B in the Chinese: virological, histological, and clinical aspects. Hepatol. 39:1694–1701.
Zacharakis GH, Koskinas J, Kotsiou S, Papoutselis M, Tzara F, Vafeiadis N, Archimandritis AJ, Papoutselis K (2005), Natural history of chronic HBV infection: A cohort study with up to 12 years follow-up in North Greece (part of the interreg I-II/EC-project). J Med Virol. 77:173–179.
Zarski JP, Causse X, Cohard M, Cougnard J, Trepo C (1994). A randomized, controlled trial of interferon alfa-2b alone and with simultaneous prednisone for the treatment of chronic hepatitis B. French Multicenter Group. J Hepatol. 20:735–741.
Zhao W, Wan JM, Liu W, Liu QJ, Zhang L, Zhou ZX, Liu XJ, Zhang HR (2003). Hepatitis gene chip in detecting HBV DNA, HCV RNA in serum and liver tissue samples of hepatitis patients. Hepatobil Pancreatic Dis Int. 2:234–241.
Zhou DY, Cao YJ, Lin LY, Wang H, Huang JS (2002). HBV resistant to lamivudine: Experimental and clinical studies. Hepatobil Pancreatic Dis Int. 1:519–522.

Hepatitis B virus DNA testing 151
Excluded: Case referent:
Martinot-Peignoux M, Boyer N, Colombat M, Akremi R, Pham BN, Ollivier S, Castelnau C, Valla D, Degott C, Marcellin P (2002). Serum hepatitis B virus DNA levels and liver histology in inactive HBsAg carriers. J Hepatol. 36:543–546.
Excluded: Case control
Yu MW, Yeh SH, Chen PJ, Liaw YF, Lin CL, Liu CJ, Shih WL, Kao JH, Chen DS, Chen CJ (2005). Hepatitis B virus genotype and DNA level and hepatocellular carcinoma: a prospective study in men. J Nat Cancer Inst. 97:265–272.

152 Hepatitis B virus DNA testing
Appendix G Examples of treatment studies
Treatment effectiveness of Lamivudine has been illustrated in studies by Dienstag et al 1999 and Liaw et al 2004. Patients were given Lamivudine for 52 weeks (Dienstag et al 1999) or were planned to undergo lamivudine treatment for a maximum of five years (Liaw et al 2004). The characteristics and outcomes of these studies are presented in Table 49.
The study by Diensteg at el (1999) included HBeAg positive patients with liver biopsy confirmation of chronic hepatitis B. In this prospective double-blind RCT, 52 weeks of lamivudine treatment resulted in an improvement in HAI score in a significantly greater proportion of lamivudine patients than placebo patients (52% and 23% respectively, p<0.001). Histological deterioration occurred in a significantly greater proportion of the placebo group compared with the lamivudine group (24% and 11% respectively, p<0.001). Significantly different favourable outcomes in terms if necroinflammatory activity and fibrosis were also found in the lamivudine group compared with the placebo group (see Table 49). Lamivudine treatment resulted in a significantly greater cumulative proportion of patients with sustained suppression of serum HBV DNA levels throughout the 52 week treatment period (44% for lamivudine and 16% for placebo p<0.001). Suppression of HBV DNA levels was paralleled with HBeAg seroconversion: by week 52, 17 per cent of the lamivudine group had seroconverted compared with 6 per cent of the placebo group (p<0.04). Serum ALT levels returned to normal in a significantly greater proportion of patients in the lamivudine group than in the placebo group (41% and 7% respectively, p<0.001). To illustrate that the favourable outcomes reported for the lamivudine group did not result from differences in baseline variables, odds ratios for the likelihood of histologic response and HBeAg seroconversion were calculated after adjusting for several variables (see Table 49). The odds ratios remained significantly different after adjustment.
The study by Diensteg et al (1999) indicates that 52 weeks of lamivudine therapy results in improved health outcomes for HBeAg positive chronic hepatitis B patients.
The study by Liaw et al (2004) included patients who were HBeAg negative or positive and had histologically confirmed cirrhosis or advanced liver disease (see Table 49). Liaw et al (2004) planned to give patients lamivudine (100 mg daily) up to a maximum of five years. Treatment was stopped for patients who reached a clinically confirmed endpoint (disease progression) or had HBeAg seroconversion during the double-blind phase. Patients who reached an endpoint were offered open label lamivudine for one year and patients who had seroconversion were offered further lamivudine therapy if they suffered serologic relapse. If the trial was terminated according to predefined criteria patients were offered open label treatment for one year. Overall, the median duration of treatment was 32.4 months (range 0–42 months): at study termination 71 per cent of patients underwent medication for at least 30 months.
Overall disease progression was less in the lamivudine group compared withthe placebo group: 7.8 per cent versus 17.7 per cent; with a hazard ratio of 0.45 (95% CI: [0.28, 0.73]) (p<0.001). This finding was paralleled by changes in Child-Pugh score: an increase was reported in 3.4 per cent of the lamivudine group versus 7.4 per cent of the placebo group and the hazard ratio for the lamivudine group was 0.45 (95% CI: [0.22, 0.90]) (p<0.02).

Hepatitis B virus DNA testing 153
Similarly, a smaller proportion of patients in the lamivudine group developed hepatocellular carcinoma compared withthe placebo group: 3.9 per cent versus 7.4 per cent respectively; hazard ratio = 0.49 (95% CI: [0.25, 0.99]) (p<0.047).
Covariate modelling of time to disease progression was used to investigate factors other than treatment that significantly affected outcome: the incidence of disease progression in relation to several baseline variables was investigated. Liaw et al (2004) found that baseline serum HBV DNA levels (see Table 49) were not significant factors that affected outcome. The investigators did not report if baseline HBV DNA levels would make a difference depending on whether a patient is HBeAg positive or negative. Although serum samples were taken for HBV DNA level measurements throughout the study (Liaw et al 2004) the authors did not report these data. It was not possible to determine whether the degree of change from baseline HBV DNA levels is correlated with time to disease progression and so forth.
The results of this study indicate that lamivudine therapy can produce favourable outcomes in chronic hepatitis B and advanced liver disease patients who are either HBeAg negative or positive.

Tabl
e 49
Chro
nic h
epat
itis B
trea
tmen
t stu
dies
: effi
cacy
of l
amivu
dine
ther
apy
Stud
y St
udy
desig
n In
clusio
n/Ex
clusio
n cr
iteria
Pa
tient
char
acte
ristic
s Tr
eatm
ent
Outc
omes
St
udy q
ualit
y
Dien
stag
et al
1999
Multic
entre
(3
4, US
A)
pros
pecti
ve
doub
le-bli
nd
RCT
(199
5–19
97)
Inclu
sion
crite
ria: ≥
18ye
ars
of ag
e; no
prior
ther
apy;
HBsA
g +ve
(≥6 m
o); H
BeAg
+v
e (≥1
mo)
; ALT
= 1.
3 to 1
0 x
ULN
(≥3 m
o); li
ver b
iopsy
ev
idenc
e of c
hron
ic he
patiti
s; de
tectab
le se
rum
HBV
DNA
(by h
ybrid
isatio
n ass
ay: A
bbot,
de
tectio
n lim
it = 1.
6pg,
106
geno
mes p
er m
L)
Exclu
sion
crite
ria: p
revio
us
antiv
iral th
erap
y for
chro
nic
hepa
titis B
; trea
tmen
t with
an
tivira
l age
nts,
immu
nomo
dulat
ory d
rugs
or
cortic
oster
oids w
ithin
6 mo
befor
e the
stud
y; bil
irubin
>2.5
mg
/dl; p
rothr
ombin
time
>3se
cs lo
nger
than
norm
al;
album
in lev
el of
<3.5g
/dl;
histor
y of a
scite
s, va
ricea
l ha
emor
rhag
e or h
epati
c en
ceph
alopa
thy, c
oinfec
tion
with
hep C
viru
s, he
p D or
HIV
; nu
clear
antib
ody t
iter o
f >1
:160;
a cre
atine
leve
l of >
1.5
mg pe
r dl.;
haem
oglob
in lev
el <1
1 g/dl
and w
hite c
ell co
unt
<300
0 per
cubic
mL;
neutr
ophil
co
unt o
f <15
00 pe
r cub
ic mL
; pla
telet
coun
t <10
0,000
per
cubic
mL;
confo
undin
g illn
ess
or ot
her t
ypes
of liv
er di
seas
e.
Lam
ivudi
ne g
roup
(n =
66):
Media
n age
40 yr
(ran
ge =
18
–73)
; 86%
male
; ethn
icity:
59
% w
hite,
24%
Asia
n, 15
%
black
, 2%
othe
r/unk
nown
; cir
rhos
is 6%
, HAI
scor
e me
dian 1
0 (ra
nge 0
–15)
; se
rum
HBV
DNA
(pg/m
L)
media
n 102
.2, (r
ange
0.8–
1753
); se
rum
ALT
(U/l),
me
dian 1
25 (r
ange
46–4
01)
Plac
ebo
grou
p (n
= 71
): Me
dian a
ge 38
year
s (ra
nge
20–6
7); 8
0% m
ale; e
thnici
ty:
white
56%
, 17%
Asia
n, 18
%
black
, 9%
othe
r/unk
nown
; cir
rhos
is 14
%; H
AI sc
ore,
media
n 11 (
rang
e 3–1
7);
seru
m HB
V DN
A (p
g/mL)
, me
dian 5
6.5 (r
ange
0.8–
653)
; ser
um A
LT, m
edian
13
5 (ra
nge 3
3–59
2)
100 m
g lam
ivudin
e or
place
bo da
ily fo
r 52
wks
(m
onito
red f
or
addit
ional
16wk
s po
st the
rapy
)
Hist
olog
ic re
spon
se:
HAI s
core
redu
ction
(dec
reas
e ≥2p
ts): la
mivu
dine g
roup
=
52%
, plac
ebo g
roup
= 23
% (p
<0.00
1). M
edian
HAI
scor
e re
ducti
on: la
mivu
dine g
roup
= 3,
plac
ebo g
roup
= 0.
Hi
stolog
ic wo
rsenin
g (HA
I sco
re in
creas
e ≥2p
ts): la
mivu
dine
grou
p = 11
%, p
laceb
o gro
up =
24%
(p<0
.001)
Ne
croinf
lamma
tory a
ctivit
y dec
reas
e: lam
ivudin
e gro
up =
64
%, p
laceb
o gro
up =
34%
(p =
0.00
1)
Incre
ased
fibro
sis: la
mivu
dine g
roup
= 5%
, plac
ebo g
roup
=
20%
(p =
0.01
) Vi
rolo
gica
l res
pons
e:
Lami
vudin
e gro
up: s
erum
HBV
DNA
supp
ress
ion
(und
etecta
ble le
vels
in ne
arly
all tr
eated
) with
med
ian of
4 wk
s. Cu
mulat
ive %
of pa
tients
with
unde
tectab
le HB
V DN
A at
least
once
durin
g tre
atmen
t: lam
ivudin
e gro
up =
98%
, pla
cebo
grou
p = 33
%.
Cumu
lative
% w
ith su
staine
d sup
pres
sion o
f ser
um H
BV
DNA
levels
thro
ugh w
k 52 l
amivu
dine g
roup
= 44
%, p
laceb
o gr
oup =
16%
(p<0
.001)
. Me
dian l
evel
of su
ppre
ssion
of se
rum
HBV
DNA:
lami
vudin
e gr
oup =
95 to
99%
thru
52 w
ks of
ther
apy.
Plac
ebo g
roup
=
appr
ox 40
%.
HBeA
g ser
ocon
versi
on (b
y wk 5
2): la
mivu
dine g
roup
= 17
%,
place
bo gr
oup =
6% (p
= 0.
04).
Bi
oche
mica
l res
pons
e:
Seru
m AL
T re
turne
d to n
orma
l (52 w
k): la
mivu
dine g
roup
=
41%
, plac
ebo g
roup
= 7%
. (p<
0.001
)
Rand
omise
d co
ntroll
ed tr
ial
Spec
trum
of dis
ease
in
patie
nts
cons
idere
d co
mpar
able
to ac
cura
cy st
udy
popu
lation
s Ap
prop
riate
blind
ing: li
ver
biops
y slid
es re
ad
blind
of tr
eatm
ent
grou
p
154 Hepatitis B virus DNA testing

Stud
y St
udy
desig
n In
clusio
n/Ex
clusio
n cr
iteria
Pa
tient
char
acte
ristic
s Tr
eatm
ent
Outc
omes
St
udy q
ualit
y
Effe
ct o
f bas
eline
varia
bles
: Lik
eliho
od of
histo
logic
resp
onse
: lami
vudin
e gro
up, O
R =
7.5
(95%
CI, 2
.7–20
.9, p<
0.001
) Hb
eAg s
eroc
onve
rsion
; lami
vudin
e gro
up O
R =
9.7 (9
5% C
I, 1.7
– 56
.1, p
= 0.
01)
(Sign
ifican
tly hi
gher
than
plac
ebo g
roup
, afte
r adju
stmen
t for
base
line c
ovar
iates
of se
rum
ALT,
HBV
DNA
leve
ls, H
AI
scor
e, ra
ce, a
ge, s
ex, w
eight,
pres
ence
or ab
senc
e of
cirrh
osis)
Lia
w et
al 20
04
Multic
entre
(9
), do
uble-
blind
RCT
.
Inclu
sion
crite
ria:
>16y
ears
of ag
e; HB
sAg
posit
ive (≥
6 mo)
; HBe
Ag –v
e or
+ve
and d
etecta
ble se
rum
HBV
DNA
at sc
reen
ing; li
ver
biops
y with
Isha
k fibr
osis
scor
e ≥4
(0 =
no fib
rosis
, 6 =
cir
rhos
is) at
scre
ening
/durin
g pr
eviou
s 2 ye
ars.
Ex
clusio
n cr
iteria
: he
patoc
ellula
r car
cinom
a ev
idenc
e; AL
T >1
0x U
LN;
hepa
tic de
comp
ensa
tion;
autoi
mmun
e hep
atitis
; hep
atitis
C,
D or
HIV
co-in
fectio
n; se
rious
conc
urre
nt illn
ess;
panc
reati
c amy
lase o
r lipa
se
levels
>2 x
ULN;
elev
ated
seru
m cre
atinin
e kina
se;
hemo
globin
<8g
/dl; tr
eatm
ent
with
immu
nomo
dulat
ory o
r ch
ronic
antiv
iral th
erap
y with
in 6 m
o befo
re sc
reen
ing,
treatm
ent w
ith an
y inv
estig
ation
al dr
ug w
ithin
the
6 mo b
efore
scre
ening
; pr
eviou
s lam
ivudin
e tre
atmen
t; pr
egna
nt wo
men
Lam
ivudi
ne g
roup
(n =
436)
: 85
% m
ale; 9
8% A
sian;
media
n age
43ye
ars (
rang
e 17
–74)
; Chil
d-Pu
gh sc
ore 5
=
78%
, 6 =
17%
, ≥ 7
= 5%
. Ish
ak fib
rosis
scor
e 4 =
40%
, 5 =
29%
, 6 =
31%
. HBV
DN
A mE
q/mLM
edian
11.7,
ra
nge <
0.7–1
09,80
0. HB
V DN
A ≥
0.7 m
Eq/m
L– 79
%
HbeA
g +ve
= 58
% A
LT U
/l –
media
n = 70
, ran
ge =
14–
959.
ALT
>1 U
LN, 7
8%.
Plac
ebo
grou
p (n
= 21
5):
85%
male
; 98%
Asia
n; me
dian a
ge 44
year
s (ra
nge
22–7
1), C
hild-
Pugh
scor
e 5
= 73
%, 6
= 19
%, ≥
7 =
8%;
Ishak
fibro
sis sc
ore 4
= 35
%,
5 = 26
%, 6
= 39
%; m
edian
HB
V DN
A (m
Eq/m
L) 21
.5,
(rang
e <0.7
–423
4). H
BV
DNA ≥
0.7 m
Eq/m
L = 81
%;
HbeA
g +ve
= 58
%; A
LT U
/l, me
dian =
68 (r
ange
= 7–
821)
ALT
>1 U
LN =
80%
.
Lami
vudin
e 100
mg
daily
. Dou
ble
blind
phas
e ter
mina
ted at
2nd
inter
im an
alysis
(2
4mo)
as re
sults
re
ache
d pr
edefi
ned
boun
dary
for
effica
cy M
edian
du
ratio
n of
treatm
ent w
as
32.4
mo (r
ange
, 0–
42 m
o), 7
1%
patie
nts ha
d re
ceive
d stud
y me
dicati
on fo
r at
least
30mo
whe
n stu
dy te
rmina
ted
Over
all d
iseas
e pro
gres
sion:
La
mivu
dine g
roup
= 7.
8%
Plac
ebo g
roup
= 17
.7%
Lami
vudin
e vs p
laceb
o gro
up: h
azar
d rati
o = 0.
45 (9
5% C
I, 0.2
8–0.7
3) (p
<0.00
1)
Incr
ease
in C
hild
-Pug
h sc
ore:
La
mivu
dine g
roup
= 3.
4%
Plac
ebo g
roup
= 8.
8%,
Lami
vudin
e vs p
laceb
o gro
up: h
azar
d rati
o = 0.
45 (9
5% C
I, 0.2
2–0.9
0) (p
<0.02
). He
pato
cellu
lar ca
rcin
oma:
La
mivu
dine g
roup
= 3.
9%
Plac
ebo g
roup
= 7.
4%
Lami
vudin
e vs p
laceb
o gro
up: h
azar
d rati
o = 0.
49 (9
5% C
I, 0.2
5–0.9
9) (p
<0.04
7)
(Haz
ard r
atios
deriv
ed fr
om C
ox M
odel
adjus
ted fo
r cou
ntry,
sex,
base
line A
LT, C
P sc
ore a
nd Is
hak f
ibros
is sc
ore.)
Ba
selin
e HBV
DNA
& In
ciden
ce o
f dise
ase p
rogr
essio
n La
mivu
dine G
roup
: Un
detec
table:
4%
0.7–1
0 meq
/mL:
11%
>1
0–10
0 meq
/mL:6
%
>100
meq
/mL:
8%
Plac
ebo g
roup
Rand
omise
d co
ntroll
ed tr
ial
Spec
trum
of dis
ease
in
patie
nts
cons
idere
d co
mpar
able
to ac
cura
cy st
udy
popu
lation
s Ap
prop
riate
blind
ing: li
ver
biops
y slid
es re
ad
blind
of tr
eatm
ent
grou
p
Hepatitis B virus DNA testing 155

Stud
y St
udy
desig
n In
clusio
n/Ex
clusio
n cr
iteria
Pa
tient
char
acte
ristic
s Tr
eatm
ent
Outc
omes
St
udy q
ualit
y
Unde
tectab
le: 22
%
0.7–1
0 meq
/mL:
18%
>1
0–10
0 meq
/mL:
16%
>1
00 m
eq/m
L: 16
%
Abbr
eviat
ions:
ALT,
alan
ine am
inotra
nsfer
ase;
HBeA
g, he
patiti
s B e-
antig
en; H
BV D
NA, h
epati
tis B
viru
s deo
xyrib
onuc
leic a
cid;. I
U, in
terna
tiona
l unit
s; NR
, not
repo
rted;
PCR,
polym
eras
e cha
in re
actio
n
156 Hepatitis B virus DNA testing

Hepatitis B virus DNA testing 157
Appendix H Major capital equipment cost
There is probably no need for the pathology labs to finance major capital equipment in addition to already their existing equipment or outside a reagent rental agreement with the HBV DNA test manufacturer(s).
For illustration purposes, the costs presented here describe the situation that a pathology lab would need to purchase major equipment to process a HBV DNA sample:
To calculate major capital cost, a linear depreciation over an estimated equipment lifespan of four years, with a residual value of zero, has been applied. Maintenance costs of 10 per cent were considered for three years as well as a one-year warranty period. Opportunity costs were considered as interest to be paid for the undepreciated investment costs and maintenance costs (8.2%, based on data provided by Medfin Finance, Sydney, November 2006). A discount rate of 5 per cent per annum was applied to the undepreciated investment costs, maintenance costs, opportunity costs, as well as a returned benefit in terms of tests performed.
Based on the described calculation, capital costs amount to $20 per HBV DNA test, if 20 tests are performed per week (see Table 50).10
10 The capital costs would be $13 per test where 30 tests were performed each week and $10 per test where 40 tests were performed per week.

158 Hepatitis B virus DNA testing
Table 50 Calculation of capital costs per HBV DNA test
Life cycle year
1 2 3 4 Investment Value of investment $55,000 $41,250 $27,500 $13,750 Depreciation, per yeara $13,750 $13,750 $13,750 $13,750 Maintenance costs, per yearb $0 $5000 $5000 $5000
Interest costs of investment and maintenancec
$4510 $3793 $2665 $1538
Total costs per year $18,260 $22,543 $21,415 $20,288 Present value of costsd $17,384 $20,446 $18,503 $16,697 Total present value of costs $73,029
Return on investment Number of procedures 1040 1040 1040 1040 Present value of procedurese 990 943 899 856
Total present value of procedures 3,688
Present capital costs per procedure $20
a Linear depreciation, no residual value, lifetime four years b First year: warranty period, no maintenance costs c Calculated by considering an interest rate of 8.2% for purchase and maintenance costs d Discounted at 8.2% per annum to reflect current value of investment e Discounted at 5% to reflect current value of procedures

Hepatitis B virus DNA testing 159
Appendix I Decision tree
Figure 14 Decision-tree model for monitoring of patients on lamivudine treatment
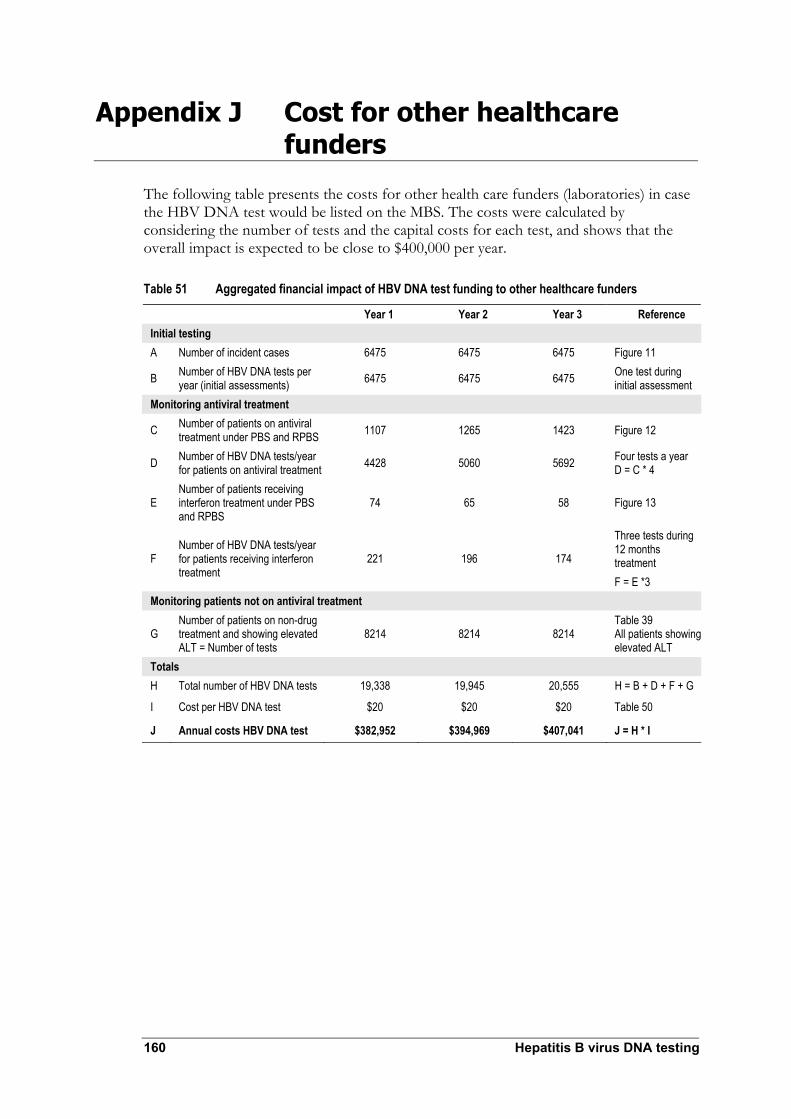
160 Hepatitis B virus DNA testing
Appendix J Cost for other healthcare funders
The following table presents the costs for other health care funders (laboratories) in case the HBV DNA test would be listed on the MBS. The costs were calculated by considering the number of tests and the capital costs for each test, and shows that the overall impact is expected to be close to $400,000 per year.
Table 51 Aggregated financial impact of HBV DNA test funding to other healthcare funders
Year 1 Year 2 Year 3 Reference Initial testing A Number of incident cases 6475 6475 6475 Figure 11
B Number of HBV DNA tests per year (initial assessments) 6475 6475 6475 One test during
initial assessment Monitoring antiviral treatment
C Number of patients on antiviral treatment under PBS and RPBS 1107 1265 1423 Figure 12
D Number of HBV DNA tests/year for patients on antiviral treatment 4428 5060 5692 Four tests a year
D = C * 4
E Number of patients receiving interferon treatment under PBS and RPBS
74 65 58 Figure 13
F Number of HBV DNA tests/year for patients receiving interferon treatment
221 196 174
Three tests during 12 months treatment F = E *3
Monitoring patients not on antiviral treatment
G Number of patients on non-drug treatment and showing elevated ALT = Number of tests
8214 8214 8214 Table 39 All patients showing elevated ALT
Totals H Total number of HBV DNA tests 19,338 19,945 20,555 H = B + D + F + G
I Cost per HBV DNA test $20 $20 $20 Table 50
J Annual costs HBV DNA test $382,952 $394,969 $407,041 J = H * I
Hepatitis B virus DNA testing 161
Abbreviations
AASLD American Association for the Study of Liver Disease
ADV adefovir dipivoxil
AFP α-fetoprotein tests
AHMAC Australian Health Ministers’ Advisory Council
ALT alanine aminotransferase
ALTi indexed alanine aminotransferase
AST aspartate aminotransferase
AUC area under the curve
AUD Australian dollar
CHB chronic hepatitis B
CI confidence interval
CT computed tomography
DNA deoxyribonucleic acid
DOR diagnostic odds ratio
ELISA enzyme-linked immunosorbent assay
EUROHEP European Concerted Action on Viral Hepatitis
FN false negative
FP false positive
HAI histological activity index
HAI-fib histological activity index fibrosis score
HAI-Infl histolofical activity index (necro)inflammatory score
HBeAg hepatitis B envelope antigen
HBsAg hepatitis B surface antigen
HCC hepatocellular carcinoma
HBV hepatitis B virus

162 Hepatitis B virus DNA testing
HCV hepatitis C virus
HDV hepatitis D virus
HIV human immunodefiency virus
HR hazard ratio
IgM immunoglobulin
INF interferon
INTREPED interferon treatment with or without prednisolone priming
IU international units
LAM lamivudine
LDH lactate dehydrogenase
LGE logarithm of gene equivalent
LLD lower limit of detection
LR likelihood ratio
MBS Medicare Benefits Schedule
MSAC Medical Services Advisory Committee
NHMRC National Health and Medical Research Council
NPV negative predictive value
NA not applicable
ND not done
NR not reported
NS not significant
OR odds ratio
PBS Pharmaceutical Benefits Scheme
PCR polymerase chain reaction
PPICO population, prior tests, intervention, comparator, outcomes
PPV positive predictive value
QUOROM quality of reporting of meta-analyses

Hepatitis B virus DNA testing 163
RCT randomised controlled trial
REVEAL-HBV The risk evaluation of viral load and associated liver disease/cancer in hepatitis B virus
RNA ribonucleic acid
ROC reciever operating characteristic
RPBS Repatriation Pharmaceutical Benefits Scheme
RR relative risk
SD standard deviation
Sn sensitivity
Sp specificity
TGA Therapeutic Goods Administration
TMA-HPA Transcription-mediated amplification and hybridisation protection assay
ULN upper limit of normal
US ultrasound
WHO World Health Organization

164 Hepatitis B virus DNA testing
References
Australian Bureau of Statistics (2006). Population Projections. [Internet] Available from: http://www.ausstats.abs.gov.au/ausstats/subscriber.nsf/0/73D26920772F929ECA25718C001518FB/$File/32220_2004%20to%202101reissue.pdf
Bell SJ, Lau A, Thompson A, Watson KJ, Demediuk B, Shaw G, Chen RY, Ayres A, Yuen L, Bartholomeusz A, Locarnini SA, Desmond PV (2005). ‘Chronic hepatitis B: recommendations for therapy based on the natural history of disease in Australian patients’. J Clin Virol. 32: 122–127.
Brunt EM (2000). ‘Grading and staging the histopathological lesions of chronic hepatitis: The Knodell histology activity index and beyond’. Hepatology 31: 241–246.
Buti M, Sanchez F, Cotrina M, Jardi R, Rodriguez F, Esteban R, Guardia J (2001). ‘Quantitative hepatitis B virus DNA testing for the early prediction of the maintenance of response during lamivudine therapy in patients with chronic hepatitis B’. J Infect Dis. 183: 1277–1280.
Butler JR, Pianko S, Korda RJ, Nguyen S, Gow PJ, Roberts SK, Strasser SI, Sievert W (2004). ‘The direct cost of managing patients with chronic hepatitis B infection in Australia’. J Clin Gastroenterol. 38: S187–S192.
Chan TM, Fang GX, Tang CSO, Cheng IKP, Lai KN, Ho SKN (2002). ‘Pre-emptive lamivudine therapy based on HBV DNA level in HBsAg-positive kidney allograft recipients’. J Hepatol. 36: 1246–1252.
Chan HL, Wong ML, Hui AY, Hung LC, Chan FK, Sung JJ (2003). ‘Use of hepatitis B virus DNA quantitation to predict hepatitis B e antigen reversion in cases of chronic hepatitis B’. J Clin Microbiol. 41: 4793–4795.
Chen CJ, Yang HI, Su J, Jen CL, You SL, Lu SN, Huang GT, Iloeje UH (2006). ‘Risk of hepatocellular carcinoma across a biological gradient of serum hepatitis B virus DNA level’. JAMA. 295: 01.
Chu CJ, Lok AF (2002). ‘Clinical utility in quantifying serum HBV DNA levels using PCR assays’. J Hepatol. 36: 549–551.
Dienstag JL, Schiff ER, Wright TL, Perrillo RP, Hann HW, Goodman Z, Crowther L, Condreay LD, Woessner M, Rubin M, Brown NA (1999). ‘Lamivudine as initial treatment for chronic hepatitis B in the United States’. NEJM 341: 1256–1263.
Dore G, Wallace J, Locarnini S, Desmond P, Gane E, Crawford, D (2006). Hepatitis B in Australia: Responding to a Diverse Epidemic [Internet] Available from: http://www.ashm.org.au/uploads/Hep-B-in-Australia.pdf
Gust ID (1996). ‘Epidemiology of hepatitis B infection in the Western Pacific and South East Asia’. Gut. 38 Suppl 2:S18–23.

Hepatitis B virus DNA testing 165
Hadziyannis SJ, Papatheodoridis GV, Dimou E, Laras A, Papaioannou C (2000). ‘Efficacy of long term lamivudine monotherapy in patients with hepatitis B e antigen-negative chronic hepatitis B’. J Hepatol. 32: 847–851.
Harris RA, Chen G, Lin WY, Shen FM, London WT, Evans AA (2003). ‘Spontaneous clearance of high-titer serum HBV DNA and risk of hepatocellular carcinoma in a Chinese population’. Cancer Causes Control. 14: 995–1000.
Iloeje UH, Yang HI, Su J, Jen CL, You SL, Chen CJ (2006). ‘Predicting cirrhosis risk based on the level of circulating hepatitis B viral load’. Gastroenterol. 130: 678–686.
Ishikawa T, Ichida T, Yamagiwa S, Sugahara S, Uehara K, Okoshi S, Asakura H (2001). ‘High viral loads, serum alanine aminotransferase and gender are predictive factors for the development of hepatocellular carcinoma from viral compensated liver cirrhosis’. J Gastroent Hepat. 16: 1274–1281.
Kao JH, Chen DS (2002). ‘Global control of hepatitis B virus infection’. Lancet Infect Dis. 2:395–403. Keeffe EB, Dieterich DT, Han SH, Jacobson IM, Martin P, Schiff ER, Tobias H, Wright TL (2004). ‘A treatment algorithm for the management of chronic hepatitis B virus infection in the United States’. Clin Gastroent Hepat. 2: 87–106.
Keeffe EB, Dieterich DT, Han SH, Jacobson IM, Martin P, Schiff ER, Tobias H, Wright TL (2006). A treatment algorithm for the management of chronic hepatitis B virus infection in the United States: an update. Clin Gastroenterol Hepatol. 4: 936–962.
Kubo S, Hirohashi K, Tanaka H, Tsukamoto T, Shuto T, Yamamoto T, Ikebe T, Wakasa K, Nishiguchi S, Kinoshita H (2000). ‘Effect of viral status on recurrence after liver resection for patients with hepatitis B virus-related hepatocellular carcinoma’. Cancer. 88: 1016–1024.
Kubo S, Hirohashi K, Tanaka H, Shuto T, Takemura S, Yamamoto T, Uenishi T , Kinoshita H, Nishiguchi S (2003). ‘Usefulness of viral concentration measurement by transcription-mediated amplification and hybridization protection as a prognostic factor for recurrence after resection of hepatitis B virus-related hepatocellular carcinoma’ Hepat Res. 25: 71–77.
Lampertico P, Vigano M, Manenti E, Iavarone M, Lunghi G, Colombo M (2005). ‘Adefovir rapidly suppresses hepatitis B in HBeAg-negative patients developing genotypic resistance to lamivudine’. Hepatology 42: 1414–1419.
Liaw YF, Sung JJ, Chow WC, Farrell G, Lee CZ, Yuen H, Tanwandee T, Tao QM, Shue K, Keene ON, Dixon JS, Gray DF , Sabbat J (2004). ‘Lamivudine for patients with chronic hepatitis B and advanced liver disease’. NEJM 351: 1521–1531.
Lindh M, Horal P, Dhillon AP, Norkrans G (2000). ‘Hepatitis B virus DNA levels, precore mutations, genotypes and histological activity in chronic hepatitis B’. J Vir Hep. 7: 258–267.

166 Hepatitis B virus DNA testing
Lindh M, Hannoun C, Horal P, Krogsgaard K, Interpred S (2001). ‘Virological response to interferon therapy of chronic hepatitis B as measured by a highly sensitive assay’. J Vir Hep. 8: 349–357.
Locarnini S, Hatzakis A, Heathcote J, Keeffe EB, Liang TJ, Mutimer D, Pawlotsky JM, Zoulim F (2004). ‘Management of antiviral resistance in patients with chronic hepatitis B’. Antivir Ther. 9: 679–693.
Lok AS, McMahon BJ (2004). AASLD Practice Guidelines. ‘Chronic hepatitis B: update of therapeutic guidelines’. Rom J Gastroenterol. 13:150–154.
McMahon JM, Simm M, Milano D, Clatts M (2004). ‘Detection of hepatitis C virus in the nasal secretions of an intranasal drug-user’. Ann Clin Microbiol Antimicrob. 3:6.
Medical Services Advisory Committee (MSAC) (2005). Guidelines for the assessment of diagnostic technologies. Canberra, Commonwealth of Australia.
Medicare Australia (2006). Statistical Reporting: Pharmaceutical Benefits Scheme. [Internet] Available from: http://www.medicareaustralia.gov.au/providers/health_statistics/statistical_reporting/pbs.htm
Mahmood S, Niiyama G, Kamei A, Izumi A, Nakata K, Ikeda H, Suehiro M, Kawanaka M, Togawa K, Yamada G (2005). ‘Influence of viral load and genotype in the progression of hepatitis B-associated liver cirrhosis to hepatocellular carcinoma’. Liver Int. 25: 220–225.
Manesis EK, Papatheodoridis GV, Sevastianos V, Cholongitas E, Papaioannou C, Hadziyannis SJ (2003). ‘Significance of hepatitis B viremia levels determined by a quantitative polymerase chain reaction assay in patients with hepatitis B e antigen-negative chronic hepatitis B virus infection’. Am J Gastroenterol. 98: 2261–2267.
Mommeja-Marin H, Mondou E, Blum MR, Rousseau F (2003). ‘Serum HBV DNA as a marker of efficacy during therapy for chronic HBV infection: analysis and review of the literature’. Hepatology. 37: 1309–1319.
NHMRC (1999). A guide to the development, implementation and evaluation of clinical practice guidelines. National Health and Medical Research Council, Canberra.
NHMRC (2000). How to use the evidence: assessment and application of scientific evidence. National Health and Medical Research Council, Canberra.
NHMRC (2005). ‘NHMRC additional levels of evidence and grades for recommendations for developers of guidelines. Pilot Program 2005–2006’. [Internet] National Health and Medical Research Council, Canberra. Available from: www.nhmrc.gov.au/consult/docfeedback.htm
Ohkubo K, Kato Y, Ichikawa T, Kajiya Y, Takeda Y, Higashi S, Hamasaki K , Nakao K, Nakata K, Eguchi K (2002). ‘Viral load is a significant prognostic factor for hepatitis B virus-associated hepatocellular carcinoma’. Cancer. 94: 2663–2668.
O’Sullivan BG, Gidding HF, Law M, Kaldor JM, Gilbert GL, Dore GJ (2004). ‘Estimates of chronic hepatitis B virus infection in Australia, 2000’. ANZJ Pub Health. 28: 212–216.

Hepatitis B virus DNA testing 167
Peng J, Luo K, Zhu Y, Guo Y, Zhang L, Hou J (2003). ‘Clinical and histological characteristics of chronic hepatitis B with negative hepatitis B e-antigen’. Chin Med J 116: 1312–1317.
Perrillo RP (2001). ‘Acute flares in chronic hepatitis B: the natural and unnatural history of an immunologically mediated liver disease’. Gastroenterol. 120:1009–1022.
Perrillo RP (2004). ‘Overview of treatment of hepatitis B: key approaches and clinical challenges’. Sem Liver Dis. 24 Suppl 1:23–29.
Realdi G, Fattovich G, Hadziyannis S, Schalm SW, Almasio P, Sanchez-Tapias J, Christensen E, the Investigators of the European Concerted Action on Viral Hepatitis (EUROHEP) (1994). ‘Survival and prognostic factors in 366 patients with compensated cirrhosis type B: a multicenter study’. J Hepatol. 21:656–666.
Seo Y, Yoon S, Truong BX, Kato H, Hamano K , Kato M, Yano Y, Katayama M, Ninomiya T, Hayashi Y, Kasuga M (2005). ‘Serum hepatitis B virus DNA levels differentiating inactive carriers from patients with chronic hepatitis B’. Eur J Gastroenterol Hepatol. 17(7):753-7
Van der Eijk AA, Niesters HG, Hansen BE, Heijtink RA, Janssen HL, Schalm SW, de Man RA (2006). ‘Quantitative HBV DNA levels as an early predictor of nonresponse in chronic HBe-antigen positive hepatitis B patients treated with interferon-alpha’. J Viral Hepat. 13: 96–103.
Villeneuve JP, Desrochers M, Infante-Rivard C, Willems B, Raymond G, Bourcier M, Cote J, et al (1994). ‘A long term follow-up study of asymptomatic hepatitis B surface antigen-positive carriers in Montreal’. Gastroenterology. 106:1000–1005.
Yang H, Westland CE, Delaney WEt, Heathcote EJ, Ho V, Fry J, Brosgart C, et al (2002). ‘Resistance surveillance in chronic hepatitis B patients treated with adefovir dipivoxil for up to 60 weeks’. Hepatology. 36:464–473.
Yohannes K, Roche PW, Roberts A, Liu C, Firestone SM, Bartlett M, East I, Hull BP, Kirk MD, Lawrence GL, McDonald A, McIntyre PB, Menzies RI, Quinn HE, Vadjic C (2006.) ‘HIV/AIDS, viral hepatitis and sexually transmissible infections in Australia. Annual Surveillance Report. Australia’s notifiable diseases status, 2004, Annual report of the National Notifiable Diseases Surveillance System’. [Internet] CDI 30 (National Centre in HIV Epidemiology and Clinical Research) Available: http://web.med.unsw.edu.au/nchecr/Downloads/06_ansurvrp.pdf
Yuen MF, Ng IL, Fan ST, Yuan HJ, Wong DH, Yuen JH, Sum SM, Chan AO, Lai CL (2004). ‘Significance of HBV DNA levels in liver histology of HBeAg and anti-HBe positive patients with chronic hepatitis B’. Am J Gastroenterol. 99(10):2032-2037
Zaman A, Ingram K (2006). ‘Diagnostic liver biopsy’. [Internet]. http://www.emedicine.com/med/topic2969.htm. Accessed 16 January 2007.
Zollner B, Schafer P, Feucht HH, Schroter M, Petersen J, Laufs R (2001). ‘Correlation of hepatitis B virus load with loss of e antigen and emerging drug-resistant variants during lamivudine therapy’. J Med Virol. 65: 659–663.