UAE Gems and Jewelry Market Forecast & Opportunities, 2022- brochure
Upload
scalar-market-researchCategory
view
26download
0
1
Global Heparin Market By Product
(Unfractionated Heparin, Low
Molecular Weight Heparin (LMWH),
Ultra Lower Molecular Weight
Heparin (ULMWH)), Route of
Administration (IV Injection,
Subcutaneous Injection),
Applications (Clinical Trials, Medical
Devices, Venous Thromboembolism)
and Geography (North America,
Europe, Asia Pacific, Middle East &
Africa, Latin America)-Market
Revenue and Forecast (2014-2022)
Scalar Market Research Inc.
September 2016

2
Table of Contents
1 Introduction .................................................................................................................................. 13
2 Market Overview .......................................................................................................................... 14
2.1 Definitions ............................................................................................................................. 14
2.2 Research Methodology ......................................................................................................... 15
2.3 Market Segmentation ........................................................................................................... 18
2.4 Assumptions .......................................................................................................................... 19
3 Executive Summary ....................................................................................................................... 20
3 Market Dynamics .......................................................................................................................... 24
3.1 Drivers ................................................................................................................................... 25
3.2 Restraints .............................................................................................................................. 26
3.3 Opportunities ........................................................................................................................ 28
3.4 Trends ................................................................................................................................... 29
4 Industry Analysis ........................................................................................................................... 30
4.1 Supply Chain Analysis ............................................................................................................ 30
4.2 Suppliers Analysis .................................................................................................................. 31
4.3 Pricing Analysis ...................................................................................................................... 34
5 Heparin Market, by Product Segments ......................................................................................... 36
5.1 Market Overview .................................................................................................................. 36
5.2 Market Share Segmentation ................................................................................................. 38
5.3 Revenue Segmentation ......................................................................................................... 39
5.4 Volume Segmentation .......................................................................................................... 40
5.5 Products ................................................................................................................................ 42
5.5.1 Unfractionated Heparin (UFH) ...................................................................................... 42
5.5.2 Low Molecular Weight Heparin (LMWH) ...................................................................... 44
5.5.3 Ultra Low Molecular Weight Heparin (ULMWH) .......................................................... 46
6 Heparin Market, by Route of Administration (ROA) ..................................................................... 48
6.1 Market Overview .................................................................................................................. 48
6.2 Market Share Segmentation ................................................................................................. 49
6.3 Revenue Segmentation ......................................................................................................... 50
SAMPLE

3
6.4 Route of Administration........................................................................................................ 51
6.4.1 Intravenous Injection .................................................................................................... 51
6.4.2 Subcutaneous Injection ................................................................................................. 53
7 Heparin Market, by Applications .................................................................................................. 55
7.1 Market Overview .................................................................................................................. 55
7.2 Market Share Segmentation ................................................................................................. 56
7.3 Revenue Segmentation ......................................................................................................... 57
7.4 Volume Segmentation .......................................................................................................... 58
7.5 Applications ........................................................................................................................... 60
7.5.1 Clinical Trials.................................................................................................................. 60
7.5.2 Medical Devices ............................................................................................................ 61
7.5.3 Venous Thromboembolism ........................................................................................... 62
8 Heparin Market, By Regions ......................................................................................................... 63
8.1 Geographic Overview ............................................................................................................ 63
8.2 Market Share Segmentation ................................................................................................. 65
8.3 Revenue Segmentation ......................................................................................................... 66
8.4 Volume Segmentation .......................................................................................................... 68
8.5 North America ....................................................................................................................... 70
8.5.1 By Regions ..................................................................................................................... 71
8.5.1.1 U.S. ............................................................................................................................ 71
8.5.1.2 Canada ...................................................................................................................... 71
8.5.2 By Product Segments .................................................................................................... 71
8.5.3 By Route of Administration ........................................................................................... 72
8.5.4 By Applications .............................................................................................................. 73
8.6 Europe ................................................................................................................................... 74
8.6.1 By Regions ..................................................................................................................... 75
8.6.1.1 Germany .................................................................................................................... 75
8.6.1.2 U.K ............................................................................................................................. 75
8.6.1.3 France ........................................................................................................................ 75
8.6.1.4 Italy ............................................................................................................................ 75
8.6.1.5 Rest of Europe ........................................................................................................... 75
SAMPLE

4
8.6.2 By Product Segments .................................................................................................... 76
8.6.3 By Route of Administration ........................................................................................... 77
8.6.4 By Applications .............................................................................................................. 78
8.7 Asia-Pacific ............................................................................................................................ 79
8.7.1 By Regions ..................................................................................................................... 80
8.7.1.1 China ......................................................................................................................... 80
8.7.1.2 India........................................................................................................................... 80
8.7.1.3 Russia ........................................................................................................................ 80
8.7.1.4 Australia .................................................................................................................... 80
8.7.1.5 Indonesia ................................................................................................................... 81
8.7.1.6 Rest of Asia-Pacific .................................................................................................... 81
8.7.2 By Product Segments .................................................................................................... 81
8.7.3 By Route of Administration ........................................................................................... 82
8.7.4 By Applications .............................................................................................................. 83
8.8 Middle East & Africa ............................................................................................................. 84
8.8.1 By Regions ..................................................................................................................... 85
8.8.1.1 Saudi Arabia .............................................................................................................. 85
8.8.1.2 Iran ............................................................................................................................ 85
8.8.1.3 Egypt ......................................................................................................................... 85
8.8.1.4 South Africa ............................................................................................................... 85
8.8.1.5 Nigeria ....................................................................................................................... 85
8.8.1.6 Kenya ......................................................................................................................... 86
8.8.1.7 Rest of Middle East & Africa ..................................................................................... 86
8.8.2 By Product Segments .................................................................................................... 86
8.8.3 By Route of Administration ........................................................................................... 87
8.8.4 By Applications .............................................................................................................. 88
8.9 Latin America ........................................................................................................................ 89
8.9.1 By Regions ..................................................................................................................... 90
8.9.1.1 Brazil .......................................................................................................................... 90
8.9.1.2 Argentina ................................................................................................................... 90
8.9.1.3 Columbia ................................................................................................................... 90
SAMPLE

5
8.9.1.4 Rest of Latin America ................................................................................................ 90
8.9.2 By Product Segments .................................................................................................... 91
8.9.3 By Route of Administration ........................................................................................... 92
8.9.4 By Applications .............................................................................................................. 93
9 Competitive Landscape ................................................................................................................. 94
9.1 Market Share Analysis ........................................................................................................... 94
10 Key Market Players ....................................................................................................................... 96
10.1 Sanofi S.A. ............................................................................................................................. 96
10.1.1 Overview ....................................................................................................................... 96
10.1.2 Key Strategies ................................................................................................................ 96
10.1.3 Recent Developments ................................................................................................... 96
10.2 Glaxo SmithKline plc ............................................................................................................. 98
10.2.1 Overview ....................................................................................................................... 98
10.2.2 Key Strategies ................................................................................................................ 98
10.2.3 Recent Developments ................................................................................................... 98
10.3 Pfizer Inc. ............................................................................................................................... 99
10.3.1 Overview ....................................................................................................................... 99
10.3.2 Key Strategies ................................................................................................................ 99
10.3.3 Recent Developments ................................................................................................... 99
10.4 Leo Pharma A/S ................................................................................................................... 100
10.4.1 Overview ..................................................................................................................... 100
10.4.2 Key Strategies .............................................................................................................. 100
10.4.3 Recent Developments ................................................................................................. 100
10.5 Aspen Holdings.................................................................................................................... 101
10.5.1 Overview ..................................................................................................................... 101
10.5.2 Key Strategies .............................................................................................................. 101
10.5.3 Recent Developments ................................................................................................. 101
10.6 Fresenius Kabi AG ............................................................................................................... 102
10.6.1 Overview ..................................................................................................................... 102
10.6.2 Key Strategies .............................................................................................................. 102
10.6.3 Recent Developments ................................................................................................. 102
SAMPLE

6
10.7 Baxter International Inc. ..................................................................................................... 103
10.7.1 Overview ..................................................................................................................... 103
10.7.2 Key Strategies .............................................................................................................. 103
10.7.3 Recent Developments ................................................................................................. 104
11 Last Word: Scalar 360 Degree Market Perspective .................................................................... 105
12 Appendix ..................................................................................................................................... 107
SAMPLE
7
List of Tables
Table 1. Research Methodology ..................................................................................................... 15
Table 2. Assumptions ...................................................................................................................... 19
Table 3. Global Heparin Market Size (US$ million), (2016-2022) ................................................... 21
Table 4. Global Heparin API Production Capacity (trillion units), (2014-2022) .............................. 31
Table 5. Global Heparin API Production Capacity (trillion units), By Geography (2014-2022) ....... 31
Table 6. Pricing of Top Heparin Products with Average Market Price (2015) ................................ 34
Table 7. Global Heparin Market Size (US$ million), By Product Segments (2014-2022) ................ 39
Table 8. Global Heparin Volume (million units), By Product Segments (2014-2022) ..................... 41
Table 9. Global Unfractionated Heparin Market Size (US$ million), By Regions (2014-2022) ....... 43
Table 10. Global Low Molecular Weight Heparin Market Size (US$ million), By Regions (2014-2022)
........................................................................................................................................... 45
Table 11. Global Ultra Low Molecular Weight Market Size (US$ million), By Regions (2014-2022) ....
........................................................................................................................................... 47
Table 12. Global Heparin Market Size (US$ million), By Route of Administration (2014-2022) ...... 50
Table 13. Global Heparin Market for Intravenous Injection; Market Size (US$ million) (2014-2022)
........................................................................................................................................... 52
Table 14. Global Heparin Market for Subcutaneous Injection; Market Size (US$ million) (2014-
2022) ........................................................................................................................................... 54
Table 15. Global Heparin Market Size (US$ million), By Applications (2014-2022) ......................... 57
Table 16. Global Heparin Volume (million units), By Applications (2014-2022) .............................. 59
Table 17. Global Heparin Market for Clinical Trials; Market Size (US$ million) (2014-2022) ........... 60
Table 18. Global Heparin Market for Medical Devices; Market Size (US$ million) (2014-2022) ..... 61
Table 19. Global Heparin Market for Venous Thromboembolism; Market Size (US$ million) (2014-
2022) ........................................................................................................................................... 62
Table 20. Heparin Market Prospects, by Geography (2016-2022) ................................................... 64
Table 21. Global Heparin Market Size (US$ million), By Regions (2014-2022)................................. 66
Table 22. Global Heparin Market; Market Size (US$ million), By Major Countries (2014-2022) ..... 67
Table 23. Global Heparin Volume (million units), By Regions (2014-2022) ..................................... 69
Table 24. Heparin Market in North America; Market Size (US$ million) and Annual Growth Rate
(2014-2022). .......................................................................................................................................... 70
Table 25. Heparin Market in U.S; Market Size (US$ million), (2014-2022) ...................................... 71
SAMPLE

8
Table 26. Heparin Market in Canada; Market Size (US$ million), (2014-2022) ................................ 71
Table 27. Heparin Market in North America; Market Size (US$ million), By Product Segments
(2014-2022) ........................................................................................................................................... 72
Table 28. Heparin Market in North America; Market Size (US$ Million), By Route of Administration
(ROA) (2014-2022) ................................................................................................................................ 72
Table 29. Heparin Market in North America; Market Size (US$ million), By Applications (2014-
2022) ........................................................................................................................................... 73
Table 30. Heparin Market in Europe; Market Size (US$ million) and Annual Growth Rate (2014-
2022) ........................................................................................................................................... 74
Table 31. Heparin Market in Germany; Market Size (US$ million), (2014-2022) ............................. 75
Table 32. Heparin Market in U.K; Market Size (US$ million), (2014-2022) ...................................... 75
Table 33. Heparin Market in France; Market Size (US$ million), (2014-2022) ................................. 75
Table 34. Heparin Market in Italy; Market Size (US$ million), (2014-2022) ..................................... 75
Table 35. Heparin Market in Rest of Europe; Market Size (US$ million), (2014-2022) .................... 75
Table 36. Heparin Market in Europe; Market Size (US$ million), By Product Segments (2014-2022)
........................................................................................................................................... 76
Table 37. Heparin Market in Europe; Market Size (US$ million), By Route of Administration (ROA)
(2014-2022). .......................................................................................................................................... 77
Table 38. Heparin Market in Europe; Market Size (US$ million), By Applications (2014-2022) ...... 78
Table 39. Heparin Market in Asia-Pacific; Market Size (US$ million) and Annual Growth Rate (2014-
2022) ........................................................................................................................................... 79
Table 40. Heparin Market in China; Market Size (US$ million), (2014-2022) ................................... 80
Table 41. Heparin Market in India; Market Size (US$ million), (2014-2022) .................................... 80
Table 42. Heparin Market in Russia; Market Size (US$ million), (2014-2022).................................. 80
Table 43. Heparin Market in Australia; Market Size (US$ million), (2014-2022) ............................. 80
Table 44. Heparin Market in Indonesia; Market Size (US$ million), (2014-2022) ............................ 81
Table 45. Heparin Market in Rest of Asia-Pacific; Market Size (US$ million), (2014-2022) ............. 81
Table 46. Heparin Market in Asia-Pacific; Market Size (US$ million), By Product Segments (2014-
2022) ........................................................................................................................................... 82
Table 47. Heparin Market in Asia-Pacific; Market Size (US$ million), By Route of Administration
(ROA) (2014-2022) ................................................................................................................................ 82
Table 48. Heparin Market in Asia-Pacific; Market Size (US$ million), By Applications (2014-2022) ....
........................................................................................................................................... 83
Table 49. Heparin Market in Middle East & Africa; Market Size (US$ million) and Annual Growth
Rate (2014-2022) .................................................................................................................................. 84
SAMPLE

9
Table 50. Heparin Market in Saudi Arabia; Market Size (US$ million), (2014-2022) ....................... 85
Table 51. Heparin Market in Iran; Market Size (US$ million), (2014-2022) ..................................... 85
Table 52. Heparin Market in Egypt; Market Size (US$ million), (2014-2022) ................................... 85
Table 53. Heparin Market in South Africa; Market Size (US$ million), (2014-2022) ........................ 85
Table 54. Heparin Market in Nigeria; Market Size (US$ million), (2014-2022) ................................ 85
Table 55. Heparin Market in Kenya; Market Size (US$ million), (2014-2022) .................................. 86
Table 56. Heparin Market in Rest of Middle East & Africa; Market Size (US$ million), (2014-2022) ...
........................................................................................................................................... 86
Table 57. Heparin Market in Middle East & Africa; Market Size (US$ million), By Product Segments
(2014-2022). .......................................................................................................................................... 87
Table 58. Heparin Market in Middle East & Africa; Market Size (US$ million), By Route of
Administration (ROA) (2014-2022) ....................................................................................................... 87
Table 59. Heparin Market in Middle East & Africa; Market Size (US$ million), By Applications
(2014-2022) ........................................................................................................................................... 88
Table 60. Heparin Market in Latin America; Market Size (US$ million) and Annual Growth Rate
(2014-2022). .......................................................................................................................................... 89
Table 61. Heparin Market in Brazil; Market Size (US$ million), (2014-2022) ................................... 90
Table 62. Heparin Market in Argentina; Market Size (US$ million), (2014-2022) ............................ 90
Table 63. Heparin Market in Columbia; Market Size (US$ million), (2014-2022) ............................ 90
Table 64. Heparin Market in Rest of Latin America; Market Size (US$ million), (2014-2022) ......... 90
Table 65. Heparin Market in Latin America; Market Size (US$ million), By Product Segments (2014-
2022) ........................................................................................................................................... 91
Table 66. Heparin Market in North America; Market Size (US$ million), By Route of Administration
(ROA) (2014-2022) ................................................................................................................................ 92
Table 67. Heparin Market in Latin America; Market Size (US$ million), By Applications (2014-2022)
........................................................................................................................................... 93
Table 68. Revenue from Heparin (US$ million), By Major Players (2014 & 2015) ........................... 95
Table 69. Acronyms ........................................................................................................................ 107
SAMPLE
10
List of Figures
Figure 1. Research Methodology ..................................................................................................... 16
Figure 2. Global Heparin Market Share (%), By Regions (2015) ...................................................... 22
Figure 3. Global Heparin Market Share (%), By Product Segments (2015) ...................................... 22
Figure 4. Global Heparin Market Share (%), By Route of Administration (2015) ............................ 23
Figure 5. Global Heparin Market Share (%), By Applications (2015) ............................................... 23
Figure 6. Global Heparin API Production Market Share (%), By Major Suppliers (2015) ................. 32
Figure 7. Heparin API Production Capacity (trillion units), By Major Suppliers (2015) ................... 32
Figure 8. Heparin Pricing Analysis, By Product Segments ................................................................ 35
Figure 9. Market Attractiveness for different Heparin Product Segments ...................................... 36
Figure 10. Global Heparin Market By Product Segments: Market Size & Market
Penetration(2015).... ............................................................................................................................. 37
Figure 11. Global Heparin Market Share(%), By Product Segments (2015 & 2022) ...................... 38
Figure 12. Global Heparin Market Size (US$ million), By Product Segments (2014-2022) ............ 39
Figure 13. Global Heparin Market By Volume (million units), By Product Segments (2015) ........ 40
Figure 14. Global Heparin Volume (Million Units), By Product Segments (2015 & 2022) ............. 40
Figure 15. Global Unfractionated Heparin Market Size (US$ million), By Regions (2015 & 2022) 42
Figure 16. Global Low Molecular Weight Heparin Market Size (US$ million), By Regions (2015 &
2022) ....................................................................................................................................... 44
Figure 17. Global Ultra Low Molecular Heparin Market Size (US$ million), By Regions (2015 &
2022) ....................................................................................................................................... 46
Figure 18. Global Heparin Market Size (US$ million), By Route of Administration (2015) ............ 48
Figure 19. Global Heparin Market Share (%), By Route of Administration (2015 & 2022) ............ 49
Figure 20. Global Heparin Market Size (US$ million), By Route of Administration (2014-2022) .. 50
Figure 21. Global Heparin Market for Intravenous Injection; Market Size (US$ million) (2015 &
2022) ....................................................................................................................................... 51
Figure 22. Global Heparin Market for Subcutaneous Injection; Market Size (US$ million) (2015 &
2022) ....................................................................................................................................... 53
Figure 23. Global Heparin Market Size (US$ million), By Applications (2015) ............................... 55
Figure 24. Global Heparin Market Share (%), By Applications (2015 & 2022) ............................... 56
Figure 25. Global Heparin Market Size (US$ million), By Applications (2014-2022) ..................... 57
Figure 26. Global Heparin Market By Volume (million units) (2015) ............................................. 58
SAMPLE

11
Figure 27. Global Heparin Volume (million units), By Applications (2015 & 2022) ....................... 58
Figure 28. Global Heparin Market for Clinical Trials; Market Size (US$ million) (2015 & 2022) .. 60
Figure 29. Global Heparin Market for Medical Devices; Market Size (US$ million) (2015 & 2022) .
....................................................................................................................................... 61
Figure 30. Global Heparin Market for Venous Thromboembolism; Market Size (US$ million)
(2015 & 2022) ....................................................................................................................................... 62
Figure 31. Global Heparin Market Share (%), By Major Regions(2015 & 2022) ............................ 65
Figure 32. Top 5 Countries, By Market Share (%) (2015) ............................................................... 65
Figure 33. Top 5 Countries with Highest CAGR % (2016-2022) ..................................................... 66
Figure 34. Global Heparin Volume (million units), By Regions (2015) ........................................... 68
Figure 35. Heparin Market in North America; Snapshot (2015) .................................................... 70
Figure 36. Heparin Market in North America; Market Size (US$ million)(2014-2022) .................. 70
Figure 37. Heparin Market in North America; Market Size (US$ million), By Product Segments
(2014-2022) ....................................................................................................................................... 71
Figure 38. Heparin Market in North America; Market Size (US$ million), By Route of
Administration (2014-2022) .................................................................................................................. 72
Figure 39. Heparin Market in North America; Market Size (US$ million), By Applications (2014-
2022) ....................................................................................................................................... 73
Figure 40. Heparin Market in Europe; Snapshot (2015) ................................................................ 74
Figure 41. Heparin Market in Europe; Market Size (US$ million) (2014-2022) ............................. 74
Figure 42. Heparin Market in Europe; Market Size (US$ million), By Product Segments (2014-
2022) ....................................................................................................................................... 76
Figure 43. Heparin Market in Europe; Market Size (US$ million), By Route of Administration
(2014-2022) ....................................................................................................................................... 77
Figure 44. Heparin Market in Europe; Market Size (US$ million), By Applications (2014-2022) .. 78
Figure 45. Heparin Market in Asia-Pacific; Snapshot (2015) ......................................................... 79
Figure 46. Heparin Market in Asia-Pacific; Market Size (US$ million) (2014-2022) ...................... 79
Figure 47. Heparin Market in Asia-Pacific; Market Size (US$ million), By Product Segments (2014-
2022) ....................................................................................................................................... 81
Figure 48. Heparin Market in Asia-Pacific; Market Size (US$ million), By Route of Administration
(2014-2022) ....................................................................................................................................... 82
Figure 49. Heparin Market in Asia-Pacific; Market Size (US$ million), By Applications (2014-2022)
....................................................................................................................................... 83
Figure 50. Heparin Market in Middle East & Africa; Snapshot (2015) ........................................... 84
Figure 51. Heparin Market in Middle East & Africa; Market Size (US$ million) (2014-2022) ........ 84
SAMPLE

12
Figure 52. Heparin Market in Middle East & Africa; Market Size (US$ million), By Product
Segments(2014-2022) ........................................................................................................................... 86
Figure 53. Heparin Market in Middle East & Africa; Market Size (US$ million), By Route of
Administration (2014-2022) .................................................................................................................. 87
Figure 54. Heparin Market in Middle East & Africa; Market Size (US$ million), By Applications
(2014-2022) ....................................................................................................................................... 88
Figure 55. Heparin Market in Middle Latin America; Snapshot (2015) ......................................... 89
Figure 56. Heparin Market in Latin America; Market Size (US$ million) (2014-2022)................... 89
Figure 57. Heparin Market in Latin America; Market Size (US$ million), By Product Segments
(2014-2022) ......................................................................................................................................91
Figure 58. Heparin Market in Latin America; Market Size (US$ million), By Route of
Administration (2014-2022) .................................................................................................................. 92
Figure 59. Heparin Market in Latin America; Market Size (US$ million), By Applications (2014-
2022) ....................................................................................................................................... 93
Figure 60. Market Share (%) of Major Players (2015) .................................................................... 94
Figure 61. Dominant Players .......................................................................................................... 95
SAMPLE

14
2 Market Overview
2.1 Definitions
Global Heparin market is defined as the market size and market share estimation of
the various segments of the heparin market, capturing ongoing drivers, trends,
challenges of the market, industry analysis involving the supply chain, and studying
about the major participants and players in heparin market environment.
The 'Global Heparin Market – Market Size and Forecast (2014–2022)' report
includes market size and forecast estimates for the period 2014 to 2022. The scope
of this report is unfractionated heparin, low molecular weight heparin and ultra low
molecular weight heparin, and its applications in clinical trials, medical devices, and
venous thromboembolism. The report has 2014 as the base year, 2015 as current
year and years 2016 to 2022 as forecast years.
This report defines the heparin product type as-
Unfractionated Heparin (UFH) is a type of blood thinner widely used in thrombotic
disorders and in the treatment of deep vein thrombosis (DVT) and Pulmonary
Embolism (PE). The average molecular weight of unfractionated heparin is 15000
Daltons.
Low Molecular Weight Heparin (LMWH) is a type of anticoagulant which is derived
from depolymerization and fractionation of polymeric heparin and having an average
molecular weight ranging between 4500 to 8000 Daltons.
Ultra Low Molecular Weight Heparin (ULMWH) is a type of anticoagulant widely used
for cancer patients undergoing chemotherapy and having an average molecular
weight of 2500 Daltons.
SAMPLE

15
2.2 Research Methodology
The market study of heparin market incorporates two-way prolonged approaches,
secondary and primary research to collect the information commercially and study
the market. The data collection part was focused, and related to capturing whole
market from various perspective. Data collected from multiple sources was logically
linked and analyzed by our analysts.
Secondary Data
Secondary data gathering procedure, with subsequent references such as company
websites, journals, magazines, directories, databases such as Bloomberg, Hoovers,
Factiva, company annual reports, press releases, white papers, and government
publishing sources also have been taken into consideration. Data from these
sources have been used to obtain industry supply chain, company profiles and other
key areas such as market drivers, opportunities, trends from Heparin market
perspective
Table 1. Research Methodology
Report Parameter Secondary Source
Market Size, Share, Revenue Company Annual Reports, SEC Filings,
Financials, Press Releases, Directories,
Journals.
Industry Analysis, Supplier Analysis Company websites, market Journals, White
papers, magazines, other market studies.
Competitive Landscape Company Annual Reports, Financials, Press
Releases, Investors Relations, Directories,
Journals.
Primary Data
Primary data is the most important data in the research study. Primary data has
been considered and linked to the report in order to make study more crisp and
informative. Structured interviews with industry specialists, VPs, CEOs, directors,
technology consultants were taken in order to collect the key primary data. The
SAMPLE

16
primary data was focused on both the demand and supply side of the market. Market
engineering was carried out from the data, and excessive analysis has been done on
it. Primary data was also considered extensively in validating the secondary content.
Market engineering process involved both top-down and bottom-up approach to
estimate the market size and market forecast, and segment the market into more
sub-segments.
Market size estimation
Both, top-down and bottom-up approaches were used to estimate the size of the
global heparin market.
Figure 1. Research Methodology
Global
Market
Size
Market-specific Revenues of Key Market
Players
Revenues of Key Market Players
Global Market
Size
Segment-specific Market Size
Regional
Market
Size
Bottom-up
Top-down
SAMPLE

17
Economic Indicators
Scalar Market Research has conducted a comprehensive study of the global
economic conditions and economic indicators to evaluate their impact on the current
market conditions and forecast the market scenarios.
SAMPLE

18
2.3 Market Segmentation
Heparin Market
ProductRoute of
AdministrationApplications Regions
•UnfractionatedHeparin
• Low Molecular Weight Heparin
•Ultra Low Molecular Weight Heparin
• Intravenous Injection
•Subcutaneous Injection
• Clinical Trials
• Medical Devices
•Venous Thromboembolism
• North America
• Europe
• Asia-Pacific
• Middle East & Africa
•Latin America
SAMPLE
20
3 Executive Summary
Heparin refers to the anticoagulant which is stored in the mast cells and secreted at
the injury site and is intended towards prevention of blood clots. Heparin, primarily is
derived from pig intestine or bovine (cow) lungs, but after the crisis of bovine heparin
in 1980s, porcine heparin is widely adopted across the globe. Heparin is widely
applied in thrombotic and cardiovascular disorders, surgery and kidney dialysis, and
anticoagulant coatings.
Heparin market exhibits significant growth and value due to growing population of
VTE (venous thromboembolism), obesity, declining imports from China and growing
adoption of new oral anticoagulants. In addition to this, the possibility of regulatory
approval of synthetic heparin and the comeback of bovine heparin in the United
States will create new opportunities for manufacturers of heparin, crude heparin
suppliers to make strides in this market.
The major revenue opportunities are expected to come from application sectors such
as clinical trials, medical devices, retail, and venous thromboembolism disorders.
Whereas venous thromboembolism will account for 58.59% of the total revenue
generated by 2022, clinical trials and medical devices will demand a great potential
towards heparin market. Low molecular weight heparin (LMWH) will continue to
dominate in the heparin market while ultra low molecular weight heparin will see
increasing growth rate due to rising number of cancer patients. Areas for investment
in the heparin market will focus on improving research and development for synthetic
heparin, improving supply chain, and looking for new sources such as sheep heparin
than heparin from porcine.
China continues to be the largest supplier for crude heparin and is expected to
dominate during the forecast period. The demand for finished heparin products are
expected to shift to countries such as India, Australia, Russia, and major countries of
Middle East and Africa by 2022. The demand from European countries will remain
same mainly due to their acquaintance with cold climate.
The Global Heparin market was estimated to be US$ XX million in 2015. This market
is expected to grow at a CAGR of XX% in the forecast period and is expected to be
SAMPLE

22
Figure 2. Global Heparin Market Share (%), By Regions (2015)
52.09%
21.84%
14.67%
3.69%7.71%
NA
EUROPE
APAC
LA
MEA
Source: Scalar Market Research Analysis
Figure 3. Global Heparin Market Share (%), By Product Segments (2015)
92.50%
1.61%
5.89%
Low Molecular Weight Heparin(LMWH)
Ultra Low Molecular Weight Heparin(ULMWH)
Unfractionated Heparin(UFH)
Source: Scalar Market Research Analysis
SAMPLE

24
3 Market Dynamics
SAMPLE

25
3.1 Drivers
Drivers
Impact on the Market
2014-2016 2017-2019 2020-2022
Increase in ageing population
and life expectancy
●=High ◑=Medium ◔=Low
1. Increase in ageing population and life expectancy–
a. .
SAMPLE

30
4 Industry Analysis
4.1 Supply Chain Analysis
Slaughter Houses
Intestines
Casting Workshops
Crude Heparin
ConsolidatorsHeparin API
Finished Heparin
Pharma Buyers/End Users
Source: Scalar Market Research Analysis
China is the main market for crude heparin and heparin API.
There are more than 25000 slaughter houses with around 2 millions kills per
day.
More than 1000 casting workshops who buys around 10000 kg of intestinal
mucosa and produce on an average of 200 kg of crude heparin per month.
Mixing, dosing, precipitation, drying is done by consolidators who are majorly
heparin pharmaceutical companies.
Consolidators turn crude heparin to heparin API which is then purchased by
major vendors.
These vendors turn heparin API to finished dosage form and send them to the
market.
SAMPLE

31
4.2 Suppliers Analysis
One of the main ingredients for the finished heparin product is the Heparin API. With
the increasing demand of finished heparin products across the globe, the global
heparin API production increased from XX trillion units in 2014 to XX trillion units
approximating XX tons (measured by 140IU/mg). The global heparin API production
capacity is expected to reach to XX trillion units by 2022 growing at a CAGR of XX%.
Table 4. Global Heparin API Production Capacity (trillion units), (2014-2022)
Global Heparin
API Production
2014 2015 2016 2017 2018 2019 2020 2021 2022 CAGR%
(2016-
2022)
Trillion Units
Y-o-Y
Source: Scalar Market Research Analysis
Table 5. Global Heparin API Production Capacity (trillion units), By Geography
(2014-2022)
Region 2014 2015 2016 2017 2018 2019 2020 2021 2022 CAGR% (2016-2022)
NA
EUROPE
APAC
LA
MEA
TOTAL
Source: Scalar Market Research Analysis
Asia-Pacific was the largest region of the heparin API production in 2015. This region
is expected to grow at a CAGR of xx% from xx trillion units in 2015 to xx trillion units
in 2022.This is mainly due to China being the largest exporter and producer of crude
heparin and heparin API and accounts for almost xx% of the global demand for
heparin. Scalar Market Research estimates that the MEA region is expected to grow
at a higher rate for heparin API production due to the possibility of regulatory
approval of sheep derived heparin.
SAMPLE

34
4.3 Pricing Analysis
Table 6. Pricing of Top Heparin Products with Average Market Price (2015)
No. Product Major Companies/Vendors Product
Segment
Average Market
Price (US$)
1
2
4
6
7
8
9
10
11
12
13
14
15
16
Source: Scalar Market Research Analysis
SAMPLE

36
5 Heparin Market, by Product Segments
5.1 Market Overview
The Product segments of the Heparin market included in this report are
Unfractionated Heparin (UFH), Low Molecular Weight Heparin (LMWH), and Ultra
Low Molecular Weight Heparin (ULMWH). Low Molecular Weight Heparin (LMWH)
continues to be the largest product in 2015, while Ultra Low Molecular Weight
Heparin (ULMWH) is expected to grow at a faster rate during the forecast period.
Figure 9. Market Attractiveness for different Heparin Product Segments
Characteristics Unfractionated
Heparin(UFH)
Low Molecular
Weight Heparin
(LMWH)
Ultra Low Molecular
Weight Heparin
(ULMWH)
Market Size
Growth Rate
Cost Savings
Overall Attractiveness
●=Significantly Attractive ◑=Attractive ◔=Less Attractive
With the advent of more generics such as enoxaparin, nadroparin, tinzaparin, the
market for low molecular weight heparin continues to grow. Moreover, comparatively
lesser costs of treatment in deep vein thrombosis (DVT) compared to unfractionated
heparin, home monitoring is further expected to spur the demand for LMWHs. Ultra
low molecular weight heparin currently has a smaller market share, but with the rise
of cancer patients adopting chemotherapy, the ULMWH market is expected to see
significant growth by 2022, especially in the Europe and Asia-Pacific. The market for
unfractionated heparin is expected to decrease as most of the hospitals are
considering for replacing it with LMWHs as it proves more effective and cost efficient.
SAMPLE

37
Figure 10. Global Heparin Market By Product Segments: Market Size & Market
Penetration (2015)
Market Penetration
Ma
rke
t Siz
e
High
Hig
h
Low Molecular
Weight Heparin(LMWH)
Unfractionated Heparin(UFH)
Ultra LowMolecular Weight Heparin(ULMWH)
Source: Scalar Market Research Analysis SAMPLE

48
6 Heparin Market, by Route of Administration (ROA)
6.1 Market Overview
Figure 18. Global Heparin Market Size (US$ million), By Route of Administration
(2015)
USD7230
Million
Source: Scalar Market Research Analysis
The Route of Administration segments of the Heparin market included in this report
are IV (Intravenous) injection and SC (Subcutaneous) injection.
The subcutaneous injection was the largest Route of Administration segment in
2015, and it’s also expected to be the fastest-growing formulation segment in the
forecast period. The rise in the self-injected heparin products, the upsurge in the
consumer preferences for the same and home monitoring are factors responsible for
the growth of this segment. Also, the growth is directly proportional to the growth of
LMWHs.
Subcutaneous Injection | US$ XX
Million
IV Injection | US$ XX Million
SAMPLE

49
6.2 Market Share Segmentation
Figure 19. Global Heparin Market Share (%), By Route of Administration (2015 & 2022)
31.64%
68.36%
IV Injection
Subcutaneous Injection
Market Share ,2015
31.08%
68.92%
IV Injection
Subcutaneous Injection
Market Share ,2022
Source: Scalar Market Research Analysis
Subcutaneous injection was the largest segment in the global heparin market for Route of
Administration accounting for XX% market share. This was mainly due to the rise of low
molecular weight heparins.
Scalar Market Research Analysis predicts that the market for subcutaneous injection in heparin
market for Route of Administration will continue to dominate during the forecast period, while
the market for intravenous injection in heparin market for Route of Administration will have
no effect and is expected to be stable.
SAMPLE

55
7 Heparin Market, by Applications
7.1 Market Overview
Figure 23. Global Heparin Market Size (US$ million), By Applications (2015)
USD7230
Million
Source: Scalar Market Research Analysis
The application segments of the heparin market included in this report are clinical
trials, medical devices, and venous thromboembolism.
Venous thromboembolism was the largest application segment in 2015, and it’s also
expected to be the growing application segment in the forecast period. The rise in
the ageing population, increasing diabetic patients, and rise of hospital acquired
infection patients globally are factors responsible for the growth of this application
segment.
Clinical Trials | US$ XX Million
Medical Devices |US$ XX Million
Venous Thromboembolism | US$ XX Million
SAMPLE

63
8 Heparin Market, By Regions
8.1 Geographic Overview
The regional segments of the heparin market included in this report are North
America (NA), Europe (EU), Asia-Pacific (APAC), Latin America (LA), and Middle
East & Africa (MEA). North America was the largest regional segment in 2015, while
Asia-Pacific is expected to be the fastest-growing regional segment in the forecast
period.
SAMPLE

64
Table 20. Heparin Market Prospects, by Geography (2016-2022)
Geography Growth Prospects Indicators
North America
Europe
Asia-Pacific
Latin America
Middle East &
Africa
Source: Scalar Market Research Analysis
SAMPLE

65
8.2 Market Share Segmentation
Figure 31. Global Heparin Market Share (%), By Major Regions (2015 & 2022)
52%
22%
14%
4%8%
45%
22%
19%
4%
10%
North America
Europe
Asia Pacif ic
Latin America
Middle East & Africa
Inside circle shows the market share for the year 2015 & outside circle shows market share
for the year 2022.
North America was the largest regional segment of the heparin market in 2015. The
market had a XX% share of the global market in 2015. However, North America is
expected to lose its market share to Asia Pacific and Middle East & Africa by 2022.
Figure 32. Top 5 Countries, By Market Share (%) (2015)
49.31%7.69%
4.43%
4.42%
3.74%
United States
Germany
China
United Kingdom
India
Source: Scalar Market Research Analysis
SAMPLE
94
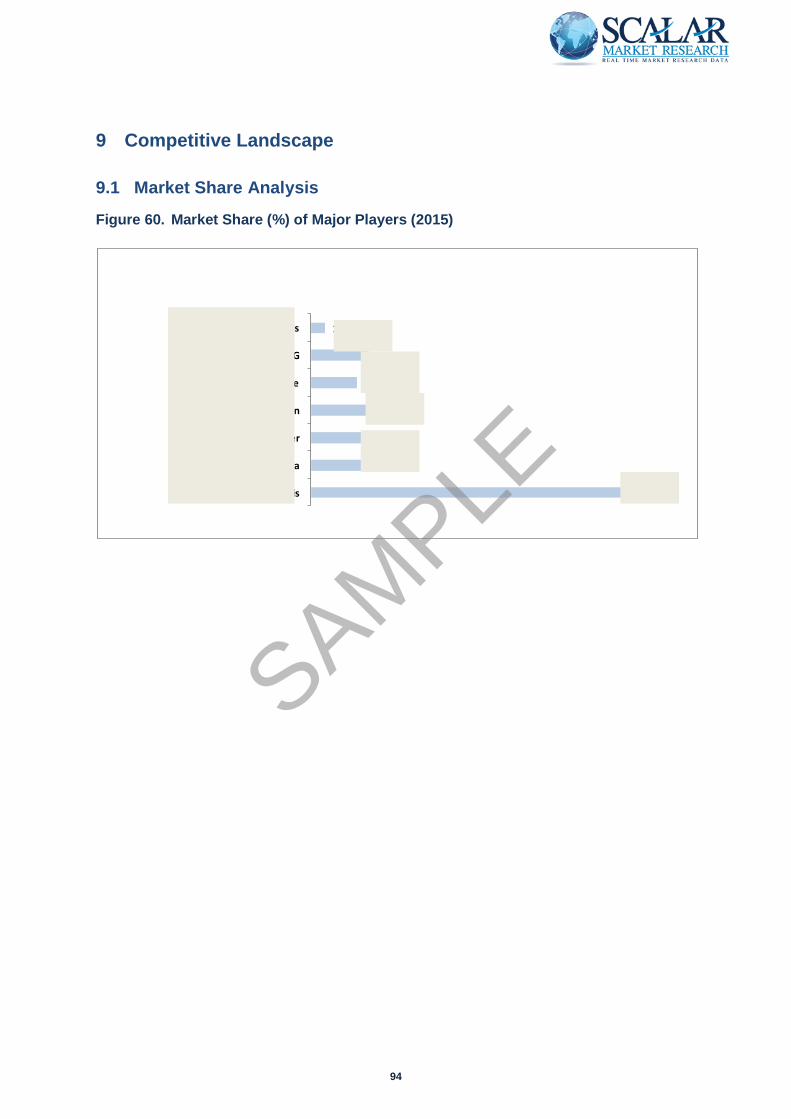
9 Competitive Landscape
9.1 Market Share Analysis
Figure 60. Market Share (%) of Major Players (2015)
26.83%
4.84%
4.70%
5.04%
3.93%
4.96%
1.17%
Sanofi Aventis
Leo Pharma
Pfizer
Aspen
Baxter Healthcare
Fresnius Kabi AG
Amphastar Pharmaceuticals
SAMPLE

107
12 Appendix
Table 69. Acronyms
CAGR Compounded Annual Growth Rate
NA North America
EU Europe
APAC Asia-Pacific
MEA Middle East & Africa
LA Latin America
LMWH Low Molecular Weight Heparin
ULMWH Ultra Low Molecular Weight Heparin
UFH Unfractionated Heparin
ROA Route of Administration
IV Intravenous
SC Subcutaneous
HAI Hospital Acquired Infections
SAMPLE