Hennepin County Data visualization
10
Hennepin County Data visualization
Transcript of Hennepin County Data visualization

Hennepin County Data visualization
2 Hennepin County Data visualization guide
Understanding how the data supports the main insights you want to share will help you choose the chart type that will most effectively help you achieve your goal.
By maintaining consistent styles and format, you ensure that data is useful and also strengthens and reinforces the Hennepin County brand style.
Accurate
A chart is only as good as the honesty and clarity of its data. Always present data in a way that does not distort information.
Use clear and accurate copy, labels, units and timelines.
Helpful
Make sure you understand the data story before selecting the visual. Provide enough context to ensure your audience will be able to follow the data story. Key tools include accurate and clear labels and consistent units and timeframes.
Accessible
Charts, graphs and maps can effectively use visuals to convey complex images. However, images can create serious barriers for vision-impaired people who use screen readers. Always follow best practices to make the data accessible to more readers.
Data visualizationDisplaying and annotating data in a clear, direct and accessible way engages the viewer and helps them comprehend the information quickly.
Charts aren’t your only choice. Remember, sometimes a well-written statement or table can be equally or more effective in conveying your point.
hennepin.us/brand 3
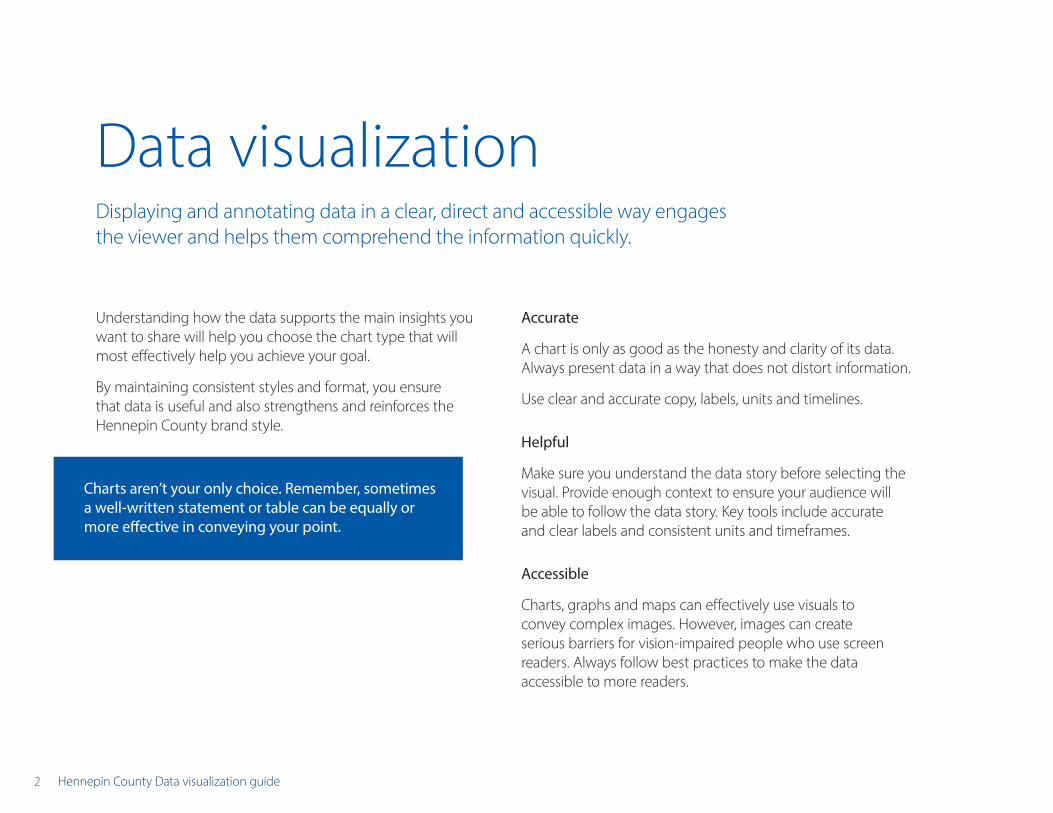
End goals drive chart choice
Similarities and differences
Comparison charts show differences and similarities in data values. Readers are particularly good at contrasting differing values in a bar chart.
Examples:
Survey results, participation numbers
Suggested chart styles:
Change over time
Change over time charts show data over a period of time, such as trends or comparisons across multiple categories. A clearly defined time period is important context for the reader.
Examples:
Chronologies, participation changes
Suggested chart styles:
Relationships
Relationship charts show relationships and compare size or volume. They are best used to show numbers rather than percentages.
Examples:
Number of participants, volumes
Suggested chart styles:
Part-to-whole
Composition charts show relative value, or represent relative makeup of a value, across a group. If the reader’s interest is solely in the size of the components consider using a relationship chart.
Examples:
Budget, types of program participants
Suggested chart styles:
Data visualization
Column chart Column chart
Bar chartLine chart
Column and line chart
Area chart
Scatterplot chart
Bubble chart
Stacked bar chart
Pie chart
Tree map
4 Hennepin County Data visualization guide
Consistent use of color allows you to easily lean into our brand equity. Data-set-specific color palettes were designed to hearken back to the Hennepin palette – anchoring in the traditional Hennepin blue – but are expanded to meet unique needs in data delivery.
We have optimized our data visualization palettes for users with color vision deficiencies and for reproduction in gray scale.
Use color consistently across charts.
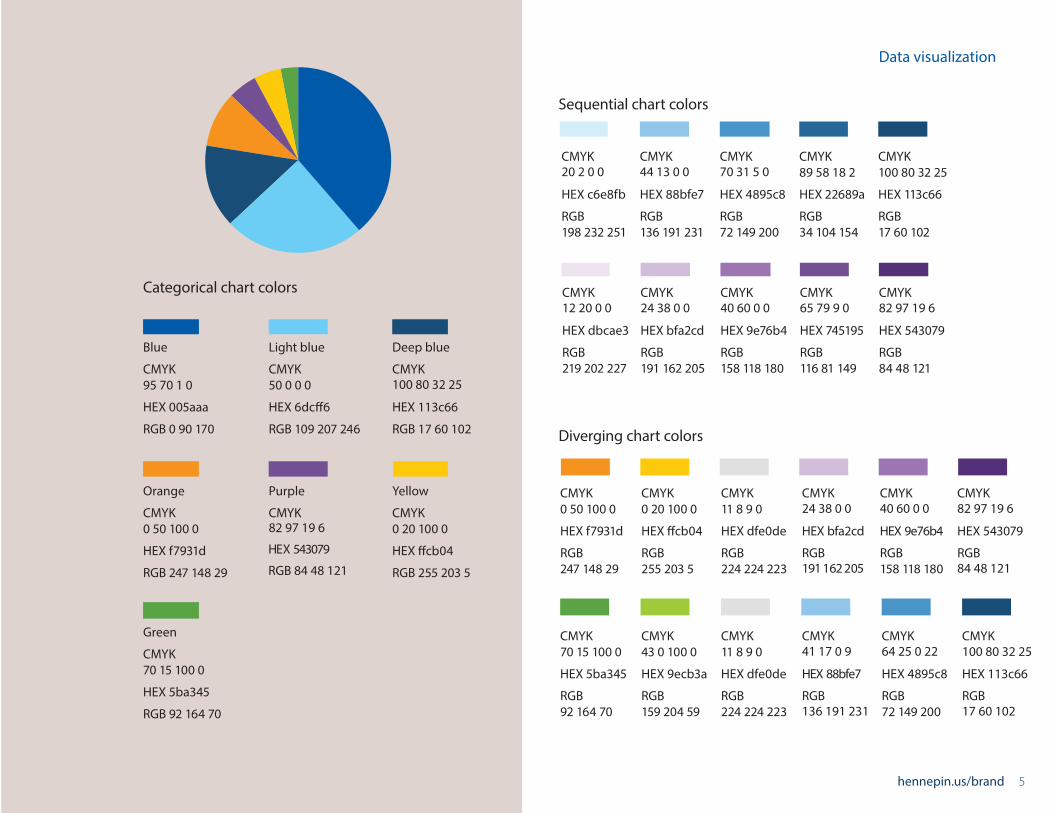
Categorical data
Color usage for displaying categorical data is intended to show clear distinction between elements. This distinction is visible without persuading or showing value; saturation levels are roughly equal to each other. Colors should be used in the order presented.
Sequential color palettes
Colors with numeric meaning go from light to dark; darker colors indicate larger numbers. Anchored in our core colors, five color palettes are available that leverage blue and purple.
Diverging color palettes
Like sequential shifts, these patterns also have a numeric meaning. Diverging palettes are a pair of gradients that meet in the center.
This method is useful when you are working with data that have two extremes and a middle baseline.
Data visualization
Use of color
Considerations for successful color usage
hennepin.us/brand 5
Purple
CMYK 82 97 19 6
HEX 543079
RGB 84 48 121
Yellow
CMYK 0 20 100 0
HEX ffcb04
RGB 255 203 5
Green
CMYK 70 15 100 0
HEX 5ba345
RGB 92 164 70
Blue
CMYK 95 70 1 0
HEX 005aaa
RGB 0 90 170
CMYK 20 2 0 0
HEX c6e8fb
RGB 198 232 251
CMYK 0 50 100 0
HEX f7931d
RGB 247 148 29
CMYK 70 15 100 0
HEX 5ba345
RGB 92 164 70
CMYK 0 20 100 0
HEX ffcb04
RGB 255 203 5
CMYK 43 0 100 0
HEX 9ecb3a
RGB 159 204 59
CMYK 11 8 9 0
HEX dfe0de
RGB 224 224 223
CMYK 11 8 9 0
HEX dfe0de
RGB 224 224 223
CMYK 24 38 0 0
HEX bfa2cd
RGB 191 162 205
CMYK 41 17 0 9
HEX 88bfe7
RGB 136 191 231
CMYK 40 60 0 0
HEX 9e76b4
RGB 158 118 180
CMYK 64 25 0 22
HEX 4895c8
RGB 72 149 200
CMYK 82 97 19 6
HEX 543079
RGB 84 48 121
CMYK 100 80 32 25
HEX 113c66
RGB 17 60 102
CMYK 44 13 0 0
HEX 88bfe7
RGB 136 191 231
CMYK 70 31 5 0
HEX 4895c8
RGB 72 149 200
CMYK 89 58 18 2
HEX 22689a
RGB 34 104 154
CMYK 100 80 32 25
HEX 113c66
RGB 17 60 102
CMYK 12 20 0 0
HEX dbcae3
RGB 219 202 227
CMYK 24 38 0 0
HEX bfa2cd
RGB 191 162 205
CMYK 40 60 0 0
HEX 9e76b4
RGB 158 118 180
CMYK 65 79 9 0
HEX 745195
RGB 116 81 149
CMYK 82 97 19 6
HEX 543079
RGB 84 48 121
Orange
CMYK 0 50 100 0
HEX f7931d
RGB 247 148 29
Light blue
CMYK 50 0 0 0
HEX 6dcff6
RGB 109 207 246
Deep blue
CMYK 100 80 32 25
HEX 113c66
RGB 17 60 102
Categorical chart colors
Sequential chart colors
Diverging chart colors
Data visualization
6 Hennepin County Data visualization guide
When assigning type and rules to data sets it is important to be as helpful and accurate as possible. Avoid acronyms and use language that is simple, concise and clear. Use the county writing style guide and plain language standards.
Assign a hierarchy to the information, ensuring that the audience sees the most critical information first. You can add significance to a selection using scale, color or tone.
Sentence case is the preferred capitalization style for titles, labels and legends.
Titles and subtitles
Titles should be accurate and easily scannable. Best practice is to break long titles into heads and subheads. Use Myriad Pro Regular to set off the main title and Myriad Pro Light for any subtitles.
Axis, labels and rules
Direct labeling individual data points or bars is best practice. Data point labels should be presented above or to the right of the data point in Myriad Pro Regular. This practice is especially helpful to people with visual impairments.
When you need an axis title, orient the title with the axis, either horizontally or vertically. Axis titles should be simple, concise and understandable.
Axis labels should be located to the left or bottom of the chart and should read left to right in warm gray. Sometimes this information is critical for understanding – in those instances black or even regular weight is allowed.
Less is more when it comes to applying rules on charts and graphs. Choose where and when they are necessary to help the viewer – it is often OK to simply omit them.
Legends
Locate legends to the right or below a chart or graph. Left-align text with any color or shape indicator preceding the text.
Data visualization
Type and rules in data sets
Titles, labels and legends
hennepin.us/brand 7
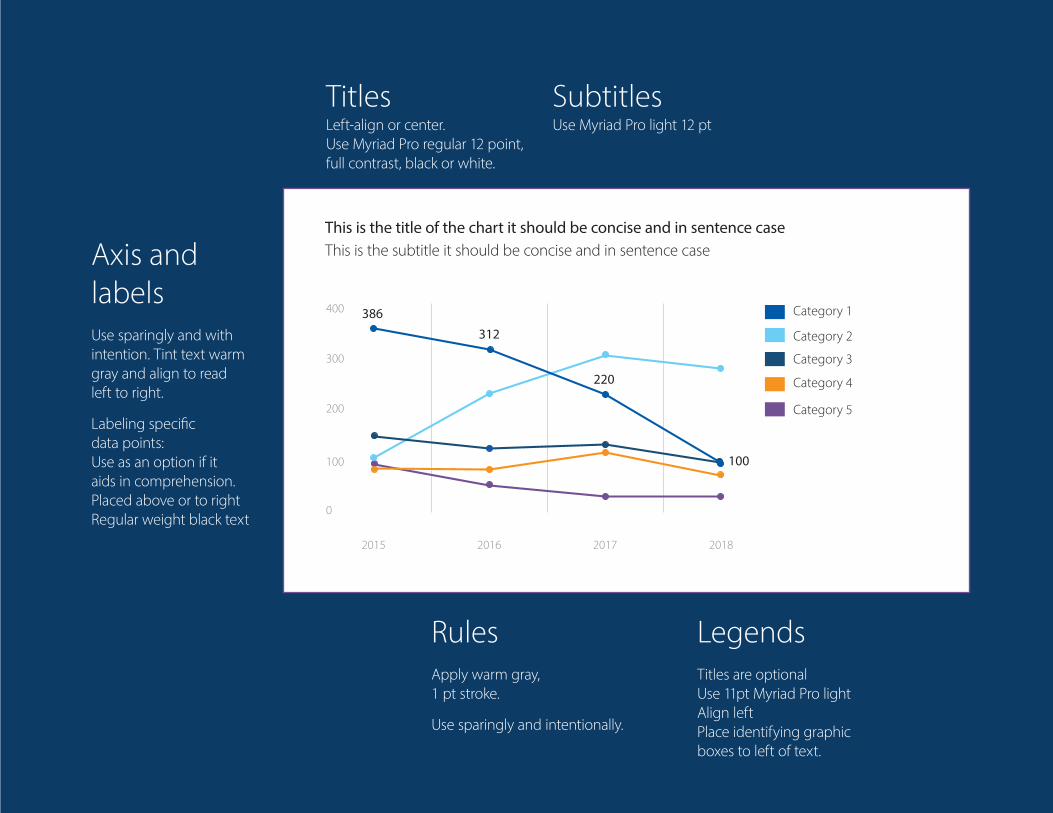
This is the title of the chart it should be concise and in sentence case This is the subtitle it should be concise and in sentence case
2015 2016 2017 2018
0
100
200
300
400
Category 5
Category 3
Category 2
Category 4
Category 1386
100
220
312
Titles
LegendsTitles are optional Use 11pt Myriad Pro light Align left Place identifying graphic boxes to left of text.
RulesApply warm gray, 1 pt stroke.
Use sparingly and intentionally.
Axis and labelsUse sparingly and with intention. Tint text warm gray and align to read left to right.
Labeling specific data points: Use as an option if it aids in comprehension. Placed above or to right Regular weight black text
SubtitlesLeft-align or center. Use Myriad Pro regular 12 point, full contrast, black or white.
Use Myriad Pro light 12 pt

8 Hennepin County Data visualization guide
It is important to practice good design principles and follow the county’s overall brand philosophy when you create data visualizations for discovery or communication.
Understand the Hennepin County brand
These are the elements that shape our style:
• Language that is easy to understand
• Type that feels approachable rather than overwhelming
• Ample use of white space and consistent use of contrastand color to enhance readability and understanding
• Imagery that is inviting, relatable and meaningful
Apply light type
Hennepin County’s corporate type face is Myriad Pro. Segoe is a widely available substitute font. In either font, we prefer to use the lighter weight.
Size fonts appropriately: 12 point for titles and 11 point for other elements. It is OK to use type in regular weight or boldface to highlight the most significant data, but do so sparingly.
Reserve ample white space
Remove any unneccessary elements, including backgrounds, redundant labels, borders or special effects. Use a light touch when applying labels or lines. Only add them as necessary, using an appropriate light-weight typeface and gray tones.
Use contrast and color consistently
Designing within the supplied color palettes ensures that you apply adequate contrast. It’s important to be consistent with color when there are multiple charts in the same view. If a color is used to represent a concept in one chart, the same color should represent the concept in all the charts.
Use color in a limited and intentional way; use categorical colors only in certain cases, because a simple one-color chart is often effective.
Inviting, relatable and meaningful imagery
Sometimes icons or images can be used to enhance charts and graphs – use this technique sparingly and for maximum impact.
Data visualization
Design considerations
Make information clear, direct and accessible

hennepin.us/brand 9
Title of this chart Subtitle of this chart
0 10000 20000 30000 40000 50000 60000 70000 80000
Residential organics tons collected
0
1000
2000
3000
4000
5000
6000
2018201720162015201420132012201120102009
Receiving public assistance
Formerly receiving public assistance
Never received public assistance
Breakdown of child support families by public assistance status Current support paid may or may not be paid in full Federal Fiscal Year 2020
9,939
1,374
7,712
Data visualization
Hennepin County
Communication and Engagement Services 612-348-3848
hennepin.us/brand
© 2021 Hennepin County