
Hemodynamic Assessment Series by Transonic -- Part 1: PV Loop Case Study
54
-
Upload
insidescientific -
Category
Science
-
view
806 -
download
1
description
Session 3 of our PV Loop Webseries was a case study review in Pressure-Volume loops, sponsored by Transonic. Guest speakers, Dr. Craig Emter, Dr. Robert Hamlin, Dr. Timothy Hacker, and Dr. Filip Konecny discussed the role of PV loops in HFpEF, Drug-Discovery and Safety Testing, Right Ventricular PV Loops in Pulmonary HTN, and Medical Device Testing using LVADs as an example. The over riding topic linking all four of these short lectures was how PV loops work in concert with other techniques, permitting complete hemodynamic evaluation. Case Study 1: Integrating Coronary Vascular & Myocardial Function in Mini-swine with Heart Failure (an aortic banding model of HFpEF) -- Dr. Craig Emter Case Study 2: What are the properties of this compound? (reviewing the value and need for PV loops in drug-discovery and safety testing in pharmaceutical research labs) -- Dr. Robert Hamlin Case Study 3: The Utility of Right Ventricular PV Loops (a mouse model of Pulmonary Arterial Hypertension that transitions from compensatory RV remodeling to right heart failure) Dr. Timothy Hacker Case Study 4: Synergy of Pressure-Volume Technology with Left Ventricular Assisted Devices (why PV loops are valuable when conducting LVAD testing in both pre and post operation situations)
Transcript of Hemodynamic Assessment Series by Transonic -- Part 1: PV Loop Case Study

Craig Emter, PhD
Assistant Professor, University of Missouri,
Columbia
Robert Hamlin, PhD
DVM, DACVIM, DSPS QTest Labs and The Ohio
State University
Timothy Hacker, PhD
Director, Cardiovascular Physiology Core Facility UW-Madison
Filip Konecny, PhD
Applications Scientist,
Transonic Systems

InsideScientific is an online educational environment designed
for life science researchers. Our goal is to aid in the sharing and
distribution of scientific information regarding innovative
technologies, protocols, research tools and laboratory services.

Integrating Coronary
Vascular & Myocardial
Function in Mini-swine
with Heart Failure Craig A. Emter, Ph.D.
Assistant Professor
University of Missouri, Columbia
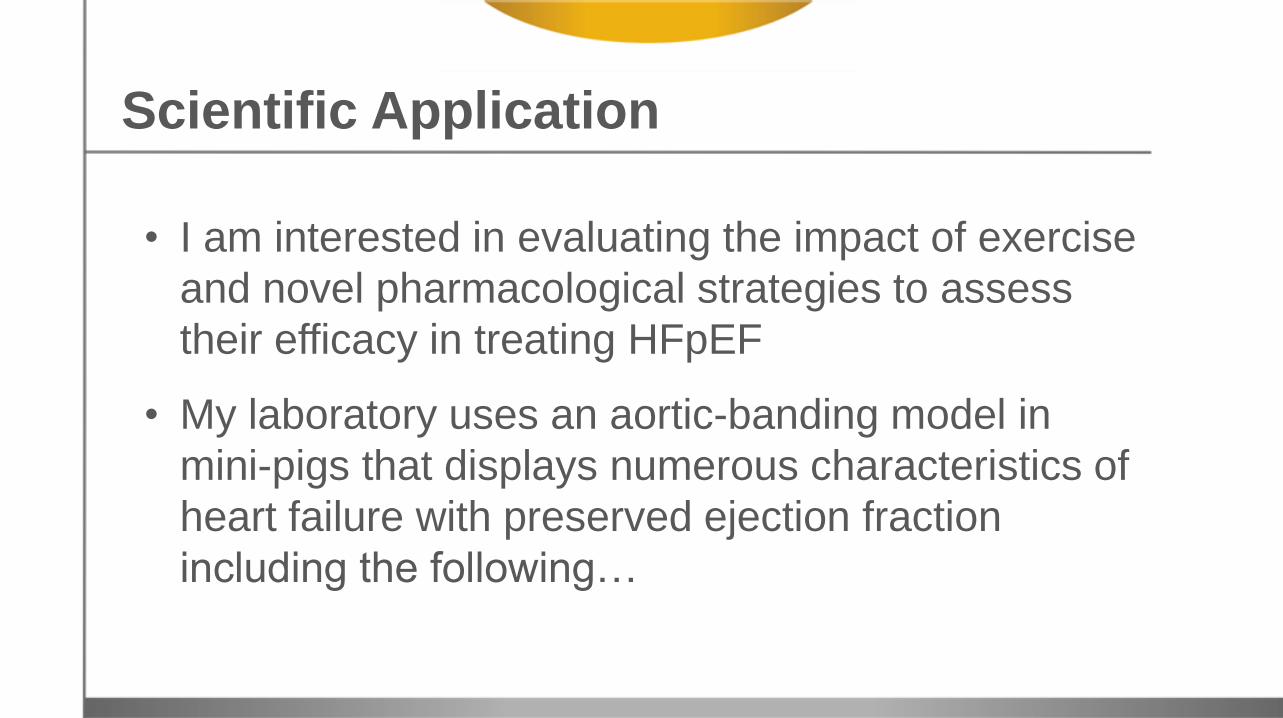
Scientific Application
• I am interested in evaluating the impact of exercise
and novel pharmacological strategies to assess
their efficacy in treating HFpEF
• My laboratory uses an aortic-banding model in
mini-pigs that displays numerous characteristics of
heart failure with preserved ejection fraction
including the following…

① Depressed LV Contractile Reserve
② Diastolic Dysfunction
③ LV Fibrosis
④ LV Hypertrophy
⑤ Increased BNP levels
⑥ Impaired LV Bioenergetics
Scientific Application
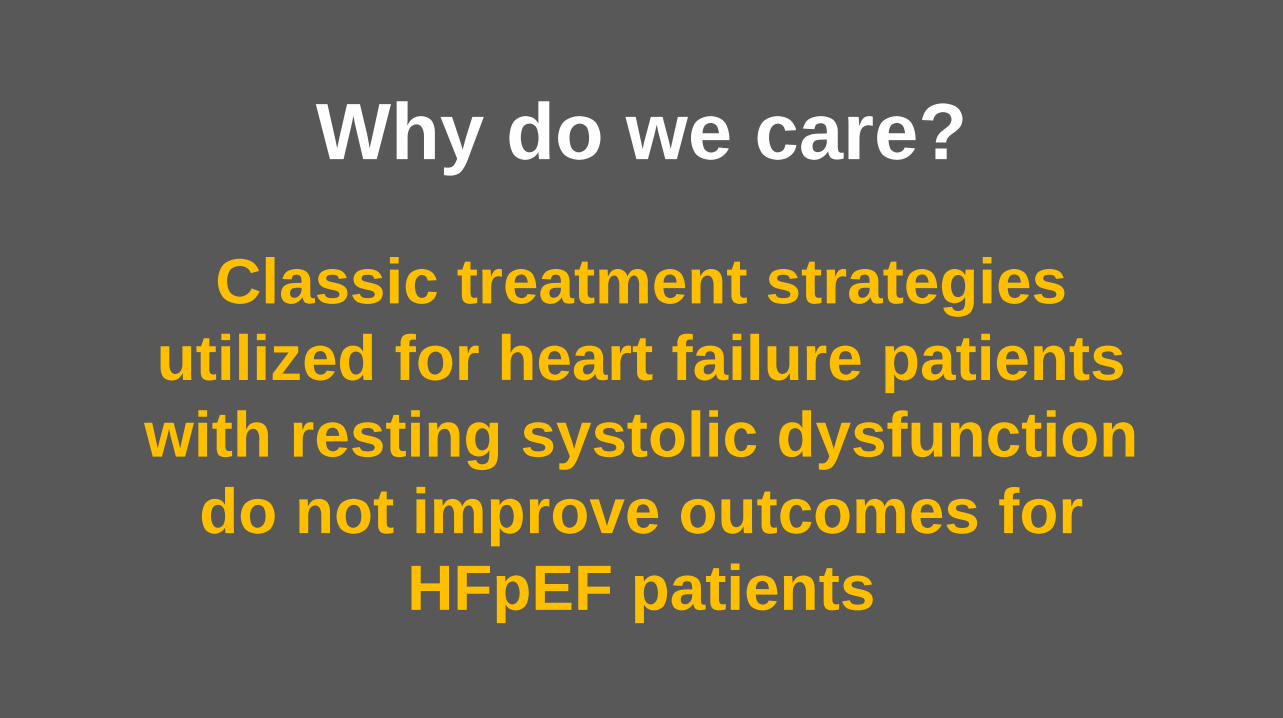
Classic treatment strategies
utilized for heart failure patients
with resting systolic dysfunction
do not improve outcomes for
HFpEF patients
Why do we care?

In the present study, we tested
two hypotheses in treadmill
trained aortic-banded Yucatan
miniature swine:
① Chronic low-intensity interval training
preserves normal myocardial oxygen
supply/demand balance
② Training-dependent attenuation of LV
fibrotic remodeling improves
diastolic function
Scientific Study

① Pressure-Volume loops
② Echocardiography
③ Coronary blood flow
④ Myocardial blood gas
PV loops are essential to providing a comprehensive examination of both systolic & diastolic function in vivo
They provide key measures allowing my lab to assess the functional integration of the myocardium, blood flow, and
metabolism
What methods did we use?

Brachiocephalic Artery
Band
Descending Aorta
Ascending Aorta
Heart
Aortic-Banding Location and Hemodynamics
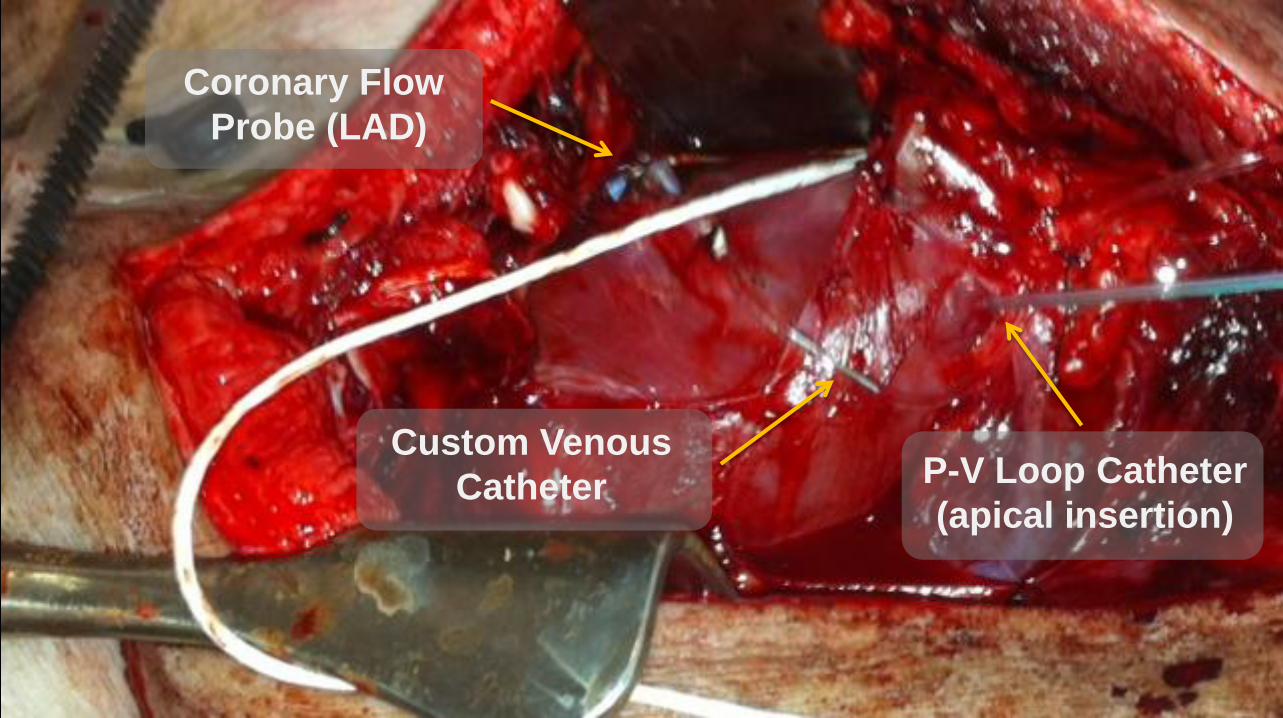
Coronary Flow
Probe (LAD)
P-V Loop Catheter
(apical insertion)
Custom Venous
Catheter

Here we use the P-V loop to
integrate blood flow &
metabolism

0
10
20
30
40
50
60
70
80
90
100 U
ntw
isti
ng
- P
ea
k G
lob
al E
R
ota
tio
n R
ate
(d
eg
ree
/se
c)
CON
HF
HF-TR
y = -0.3286x + 102.37 R = -0.45 P = 0.05
0
20
40
60
80
100
120
0 20 40 60 80 100
Un
twis
tin
g-
Pe
ak
Glo
bal E
R
ota
tio
n R
ate
(d
eg
ree
/se
c)
tau Glantz (msec)
CON
HF
HF-TR
y = -0.3131x + 102.78 R = -0.61 P < 0.05
0
20
40
60
80
100
120
0 50 100 150
Un
twis
tin
g-
Pe
ak
Glo
bal E
R
ota
tio
n R
ate
(d
eg
ree
/se
c)
LVESV (mL)
*
Marshall K D et al. J Appl Physiol 2013;114:131-147
Here we use P-V loops to
integrate diastolic function &
LV volumes with ultrasound
exercise
exercise

Here we use the P-V loop to assess LV contractile reserve
① Chronic low-intensity interval exercise training prevented diastolic impairment assessed by multiple integrated measures (pressure, volume, ultrasound)
② Chronic low-intensity interval exercise training improved cardiac efficiency
③ Chronic low-intensity interval exercise training preserved LV systolic functional reserve
What were we able to conclude?

PV loops allowed us to integrate functional and hemodynamic data
from multiple methodologies to provide a comprehensive look into global cardiovascular coupling in a large animal setting of heart failure
Meaningful results…

PV loops are essential to providing a
comprehensive examination of both systolic &
diastolic function in vivo and provide key measures
allowing my lab to assess the functional integration
of the myocardium, blood flow, and metabolism…
What is the lab doing next?
We’re currently planning to examine exercise of different intensities and if exercise
benefits can are preserved in the presence of some clinical therapies that have recently
seen an increase in use for heart failure patients…
Summary & Next Steps

What are the
properties of
this compound? Robert Hamlin, PhD
DVM, DACVIM, DSPS
QTest Labs and The
Ohio State University

Global Concepts and Objectives
1. All properties affected by a test article that may
translate to morbidity and/or mortality must be
explored to protect patients (lives) and the
manufacturer's reputation
2. Determine potential therapeutic and/or harmful
effects of test articles; determine putative
mechanism(s) of action

1. Electrocardiography and cardiac electrography (recording from the heart itself)
including electrophysiological testing with programmed electrical stimulation
2. Recording of pressure pulses and their derivatives from all cardiac chambers
using fluid-filled and solid state devices
3. Recording of cardiac output and regional blood flows and vascular resistances
4. Measuring myocardial contractility and both static and dynamic ease of filling
5. Calculating function of high- and low-pressure baroreceptors
6. Calculating venous volume and reactivity
7. Quantifying heart rate variability and other expressions of autonomic tone
8. Myocardial energetics: determinants of oxygen demand and oxygen delivery
Essential Measurements

Remember…
A "good" animal model shares, with man, the physiology
and pathophysiology of target diseases, and molecular
targets of the test articles.
Different models may be required for differing targets;
variability of species and/or strains is essential to optimize
chances of having appropriate polymorphisms of targets.
"One man is not even a good surrogate for another!"

What properties does this drug have?
dose

Inotrope?
What properties does this drug have?
Arteriolar
Vasoconstrictor,
Vasodilator?
Energetic Imbalance or Balance?
Chronotrope? Lusitrope?
Arterial
Vasoconstrictor,
Vasodilator?

How about dLVP/dt?
If you aren’t sure, what else do
you want to know?
Remember… a change in any
one of these may kill!

What
more do
you
know
now?
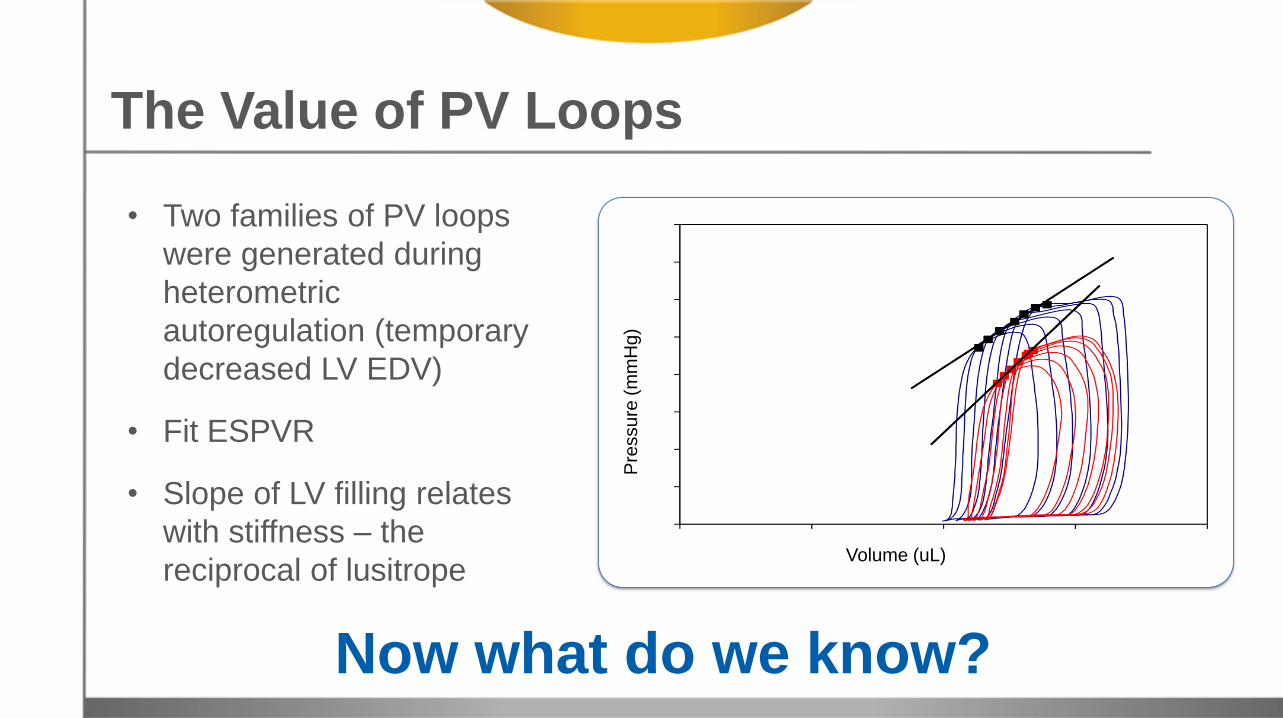
The Value of PV Loops
• Two families of PV loops
were generated during
heterometric
autoregulation (temporary
decreased LV EDV)
• Fit ESPVR
• Slope of LV filling relates
with stiffness – the
reciprocal of lusitrope
Now what do we know? P
ressu
re (
mm
Hg
)
Volume (uL)
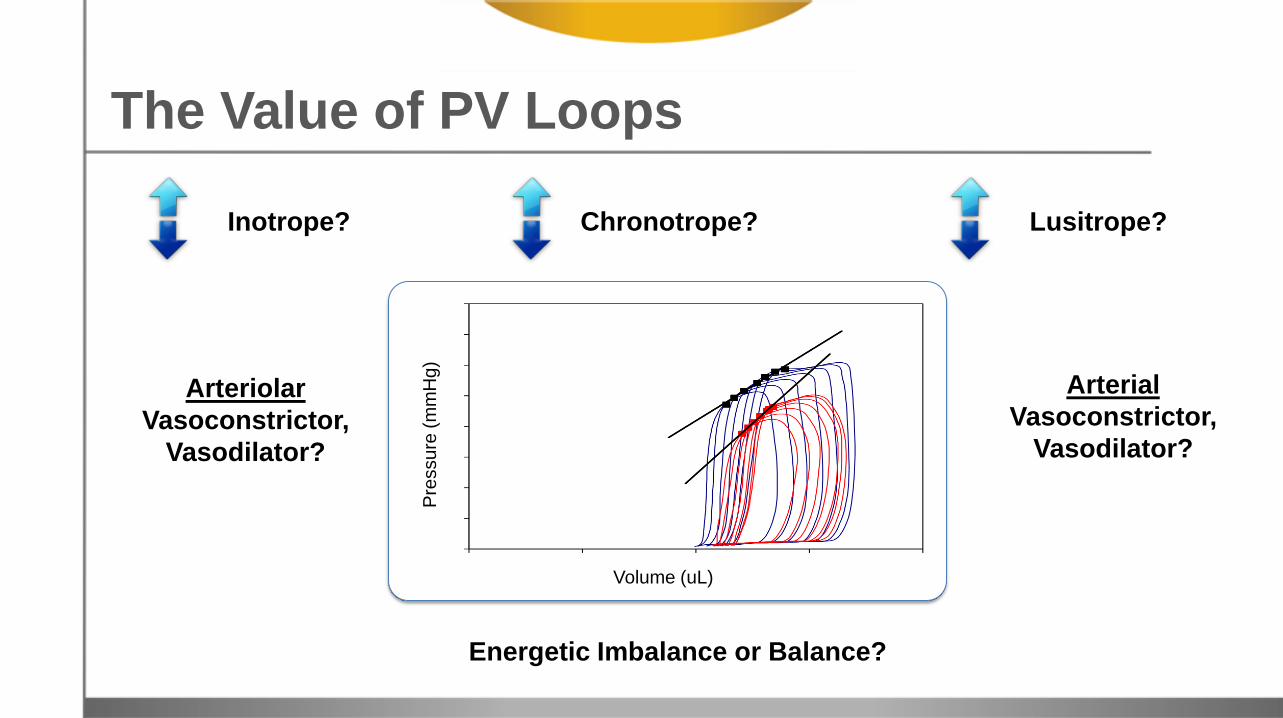
Inotrope?
Arteriolar
Vasoconstrictor,
Vasodilator?
Energetic Imbalance or Balance?
Chronotrope? Lusitrope?
Arterial
Vasoconstrictor,
Vasodilator? P
ressu
re (
mm
Hg
)
Volume (uL)
The Value of PV Loops

Inotrope
Class of Drug: Inodilator!
Arteriolar
Vasodilator
Energetic Balance
Chronotrope Lusitrope
Arterial
Vasoconstrictor
Stroke Volume
Pre
ssu
re (
mm
Hg
)
Volume (uL)
Preload
• Quantifying inotrope and lusitrope (dynamic and static).
• Measuring stroke volume and cardiac output, end-diastolic volume and end-systolic volume
• Quantifying aortic and mitral regurgitation, shunt through
• interventricular septal defect, quantifying dilated and hyper-trophic cardiomyopathy
• Calculating determinants of myocardial oxygen consumption
The Value of PV Loops

The Bigger Picture in Pharma
• PV loop data can affect your decision(s) to advance test
articles.
• Top administrators, clinical investigators, and venture
capitalists want it.
• Don’t subjects or patients deserve it?
• What does it require
(technology, surgical competency, time & effort)
Time = 2 days ; Cost < $18,000/£12,000
So, is this a Good or Bad investment?

The Utility of
Right Ventricular
PV Loops Timothy Hacker, PhD
Director of Cardiovascular
Physiology Core Facility
University of Wisconsin-
Madison

Pulmonary Arterial Hypertension (PAH)
• Marked by arterial remodeling (stiffening) and occlusion (small distal arterioles)
• Median survival of PAH is 2.8 years
• Current treatment targets vascular changes, but outcomes are poor.

Image from J Am Coll Cardio 2013:62(25_s)
• What are the molecular
mechanisms that
govern the transition
from RV adaptation to
RV maladaptation and
failure in PAH?
Critical Knowledge Gap
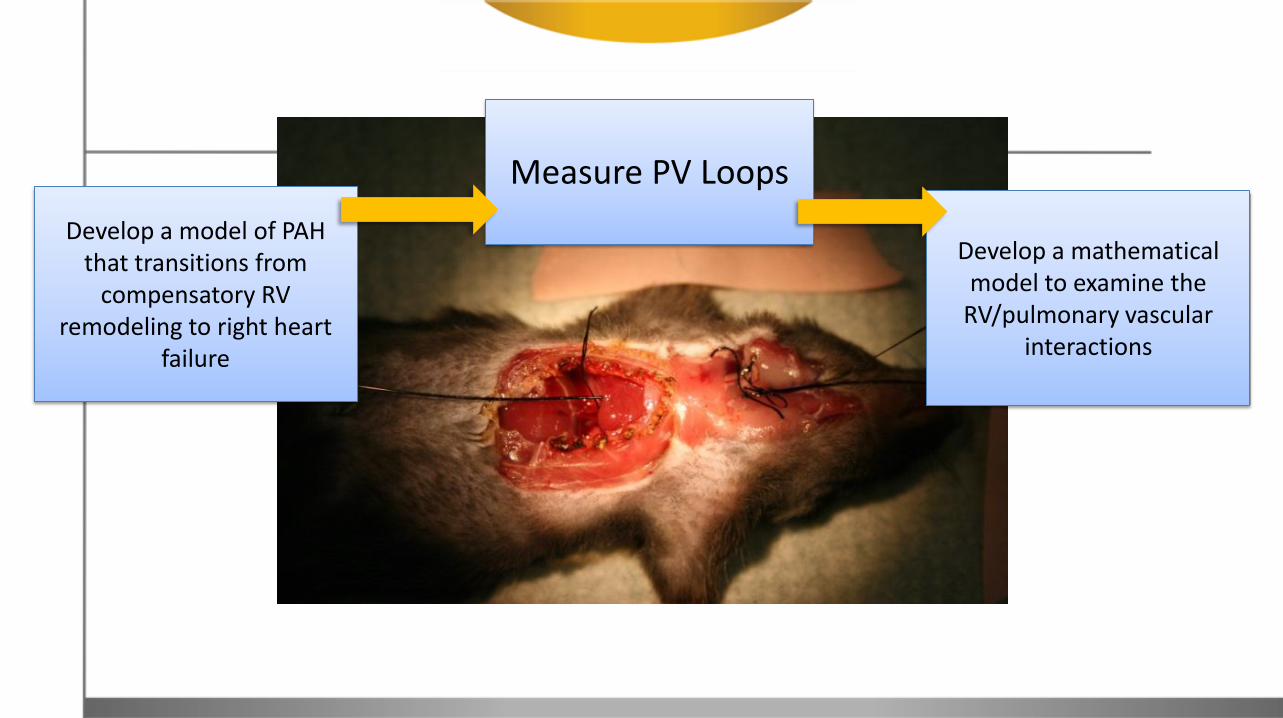
Develop a model of PAH that transitions from
compensatory RV remodeling to right heart
failure
Measure PV Loops
Develop a mathematical
model to examine the RV/pulmonary vascular
interactions

Methods…
1. Mice
– Normobaric hypoxia (10% oxygen) for 14, 21 or 28 days
– Treated with SUGEN (SU5416, Sigma) (20 mg/Kg, IP once weekly)
2. Hemodymanics
– Right ventricular pressure-volume analysis
3. Echocardiography
– Wall thickness, tricuspid regurgitation, pulmonary artery blood velocity
4. Ex vivo
– Arterial viscoelastic measurements
– Isolated myocyte cross bridge kinetics
0
10
20
30
40
50
60
0 10 20 30 40 50
Pre
ss
ure
(m
mH
g)
Volume (µL)
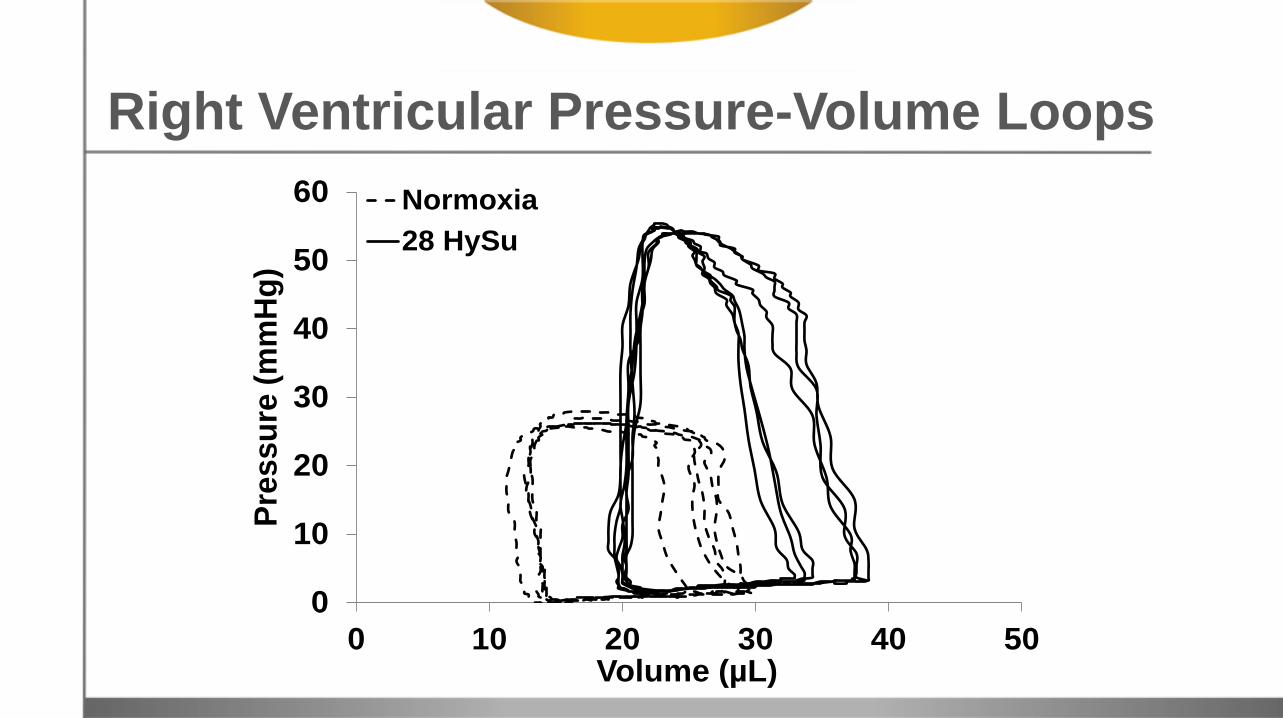
Normoxia
28 HySu
Right Ventricular Pressure-Volume Loops

0.0
0.5
1.0
1.5
2.0
2.5
3.0
3.5
4.0
21% O2 8% O2
Ees
(mm
Hg
/µl)
Normoxia14 HySu21 HySu28 HySu
0
5
10
15
20
25
30
35
40
45
21% O2 8% O2
Pre
load
re
cru
itab
le s
tro
ke w
ork
(m
mH
g)
Normoxia14 HySu21 HySu28 HySu
0
500
1000
1500
2000
2500
3000
3500
4000
4500
5000
21% O2 8% O2
dP/
dt
max
(m
mH
g/s
)
Normoxia14 HySu21 HySu28 HySu
A B C
*
**
20
25
30
35
40
45
50
55
60
65
70
21% O2 8% O2
Eje
ctio
n F
ract
ion
(%
)
Normoxia14 HySu21 HySu28 HySu
2
3
4
5
6
7
8
9
10
11
12
21% O2 8% O2
Car
dia
c O
utp
ut
(mL
/min
)
Normoxia14 HySu21 HySu28 HySu
A B
0.0
0.2
0.4
0.6
0.8
1.0
1.2
21% O2 8% O2
Ees/
Ea
Normoxia14 HySu21 HySu28 HySu
0
1
2
3
4
5
6
7
8
21% O2 8% O2
tota
l PV
R (
mm
Hg/
mL
· m
in)
Normoxia14 HySu21 HySu28 HySu
A
†*
0.0
0.5
1.0
1.5
2.0
2.5
3.0
3.5
4.0
21% O2 8% O2
Ea (
mm
Hg
/µl)
Normoxia14 HySu21 HySu28 HySu
B
*C

Discussion
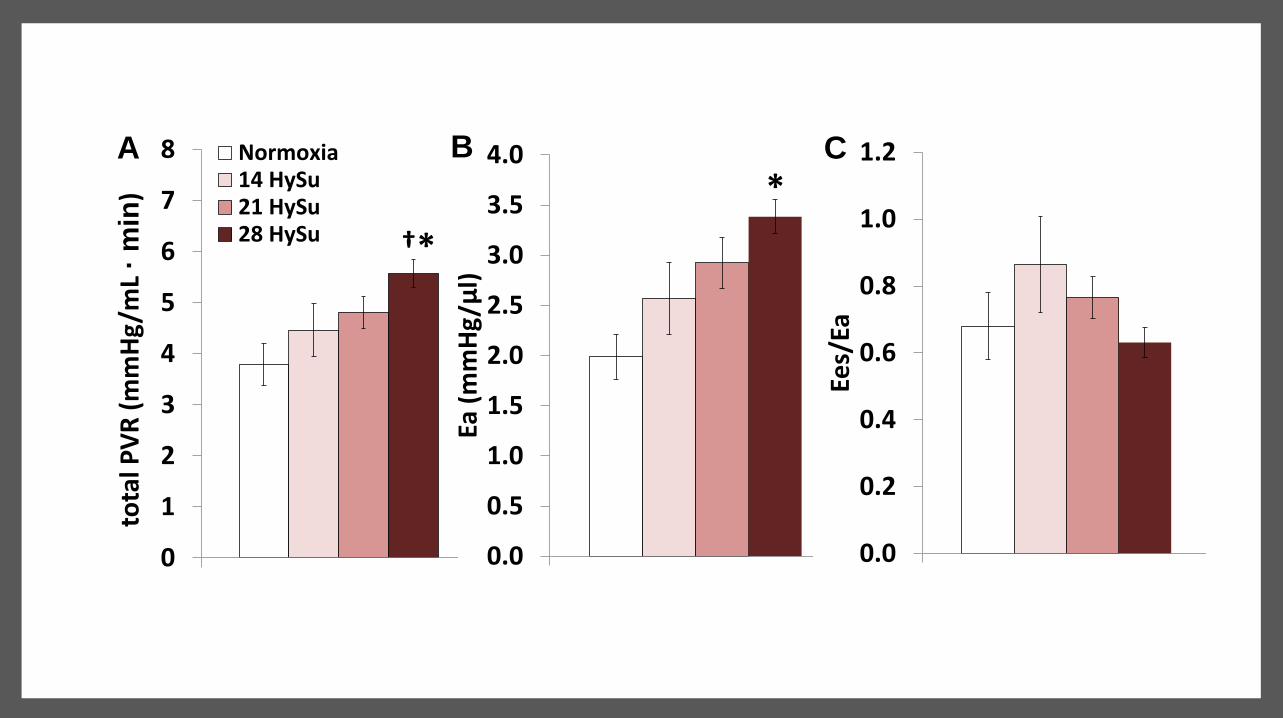
• Only PV analysis shows when the RV starts to fail – PV analysis shows an initial increase in contractility (Ees,
PRSW), then decreases
– Initial increases in ventricular vascular coupling (Ees/Ea) then decreases
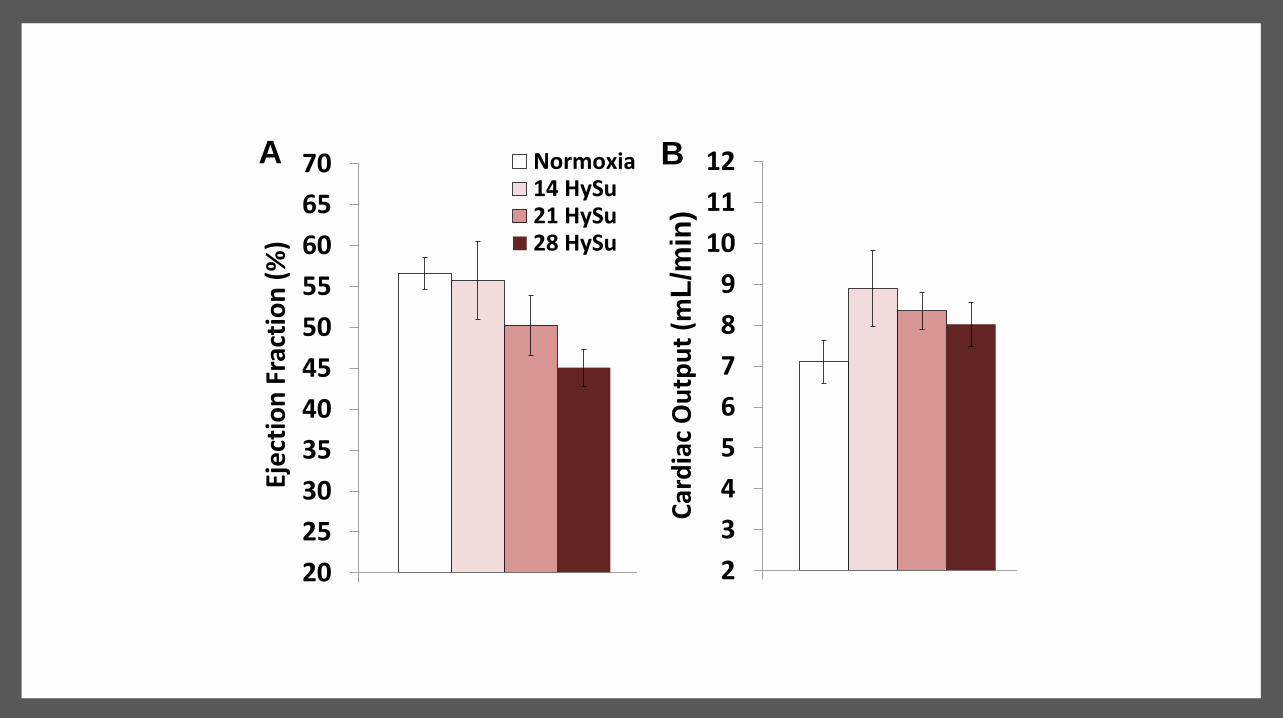
• Other measurements do not show the transition – Continual increase in RV pressure
– Continual decline in ejection fraction
– Continual increase in RV mass
– By Echo » No changes in tricuspid regurgitation
» Continual increases in RV wall thickness
» Continual increases in PA velocity acceleration
Normoxia
14 HySu 21 HySu 28 HySu

Discussion
Mathematical modeling
• Of the 26 different inputs, most gathered from the PV data, a significant increase in the stiffness of the right free wall must be added to the above model to make it work as compared to the value at 14 or 21 days
• May be due to the increased RV collagen accumulation found experimentally Mathematical
Front Physiol. 2013
Dec 11;4:355

Summary
PV loops are critical to determining the change
from compensated to decompensated RV function
Echocardiography did not have a similar
delineation
Next Steps: Compare global function by PV data to
ex-vivo vascular and isolated myocyte changes

Synergy of
Pressure-Volume
Technology with
Left Ventricular
Assisted Devices Filip Konecny, DVM PhD
Application Scientist
Transonic

Essential Parts:
1. pump
2. controller
3. tubing carrying blood out of heart
chamber(s) to controller
4. tubing carrying blood to artery(ies)
5. power source
What is a Ventricular Assist Device (VAD)?
Types:
• Continuous flow & Pulsatile flow
• LVAD (LV to aorta or artery ; e.g. Fem. Subclavian)
• RVAD (RV to PA; only short term)
• Bi VAD or TAH (total artificial heart; replaces both
chambers with pumps )
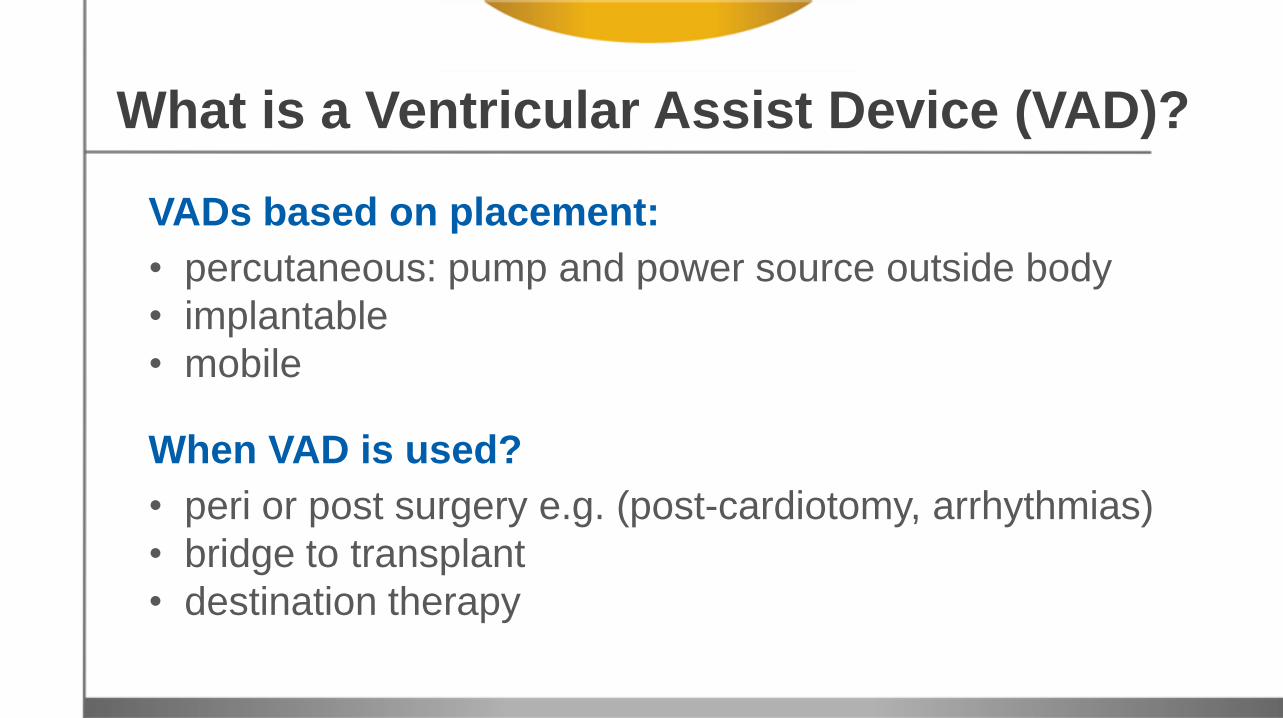
VADs based on placement:
• percutaneous: pump and power source outside body
• implantable
• mobile
When VAD is used?
• peri or post surgery e.g. (post-cardiotomy, arrhythmias)
• bridge to transplant
• destination therapy
What is a Ventricular Assist Device (VAD)?
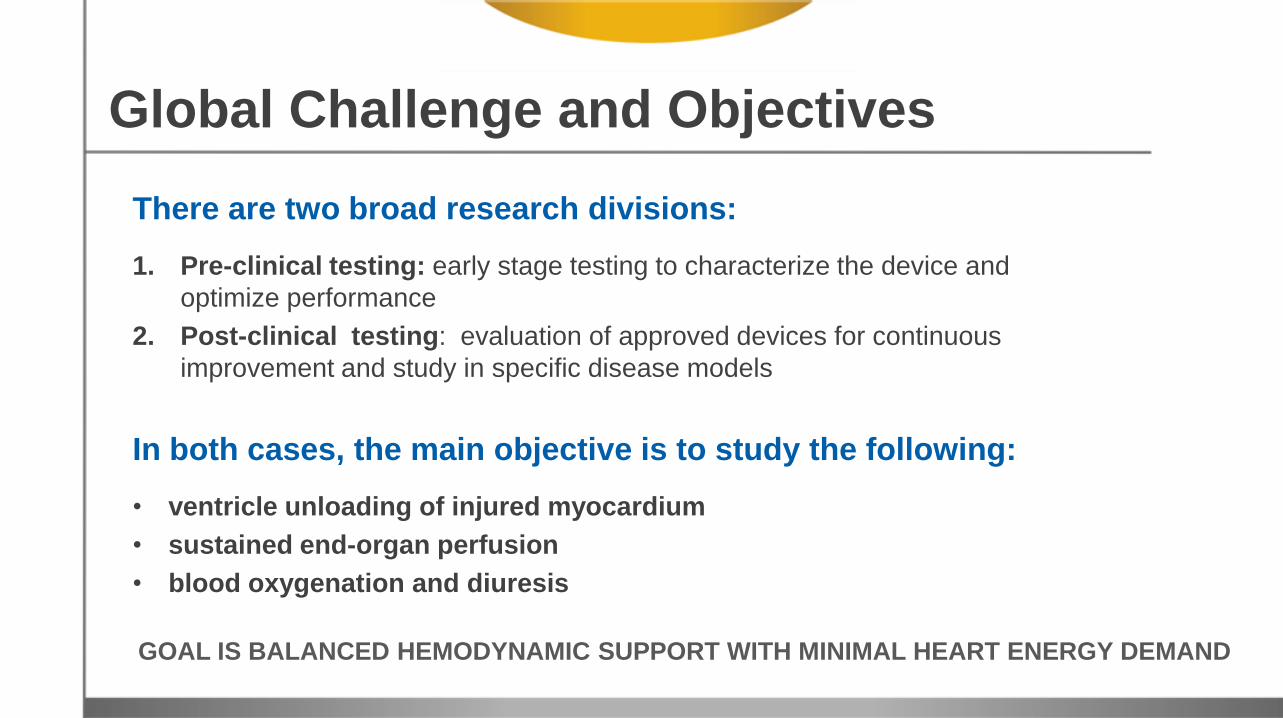
There are two broad research divisions:
1. Pre-clinical testing: early stage testing to characterize the device and
optimize performance
2. Post-clinical testing: evaluation of approved devices for continuous
improvement and study in specific disease models
In both cases, the main objective is to study the following:
• ventricle unloading of injured myocardium
• sustained end-organ perfusion
• blood oxygenation and diuresis
Global Challenge and Objectives
GOAL IS BALANCED HEMODYNAMIC SUPPORT WITH MINIMAL HEART ENERGY DEMAND
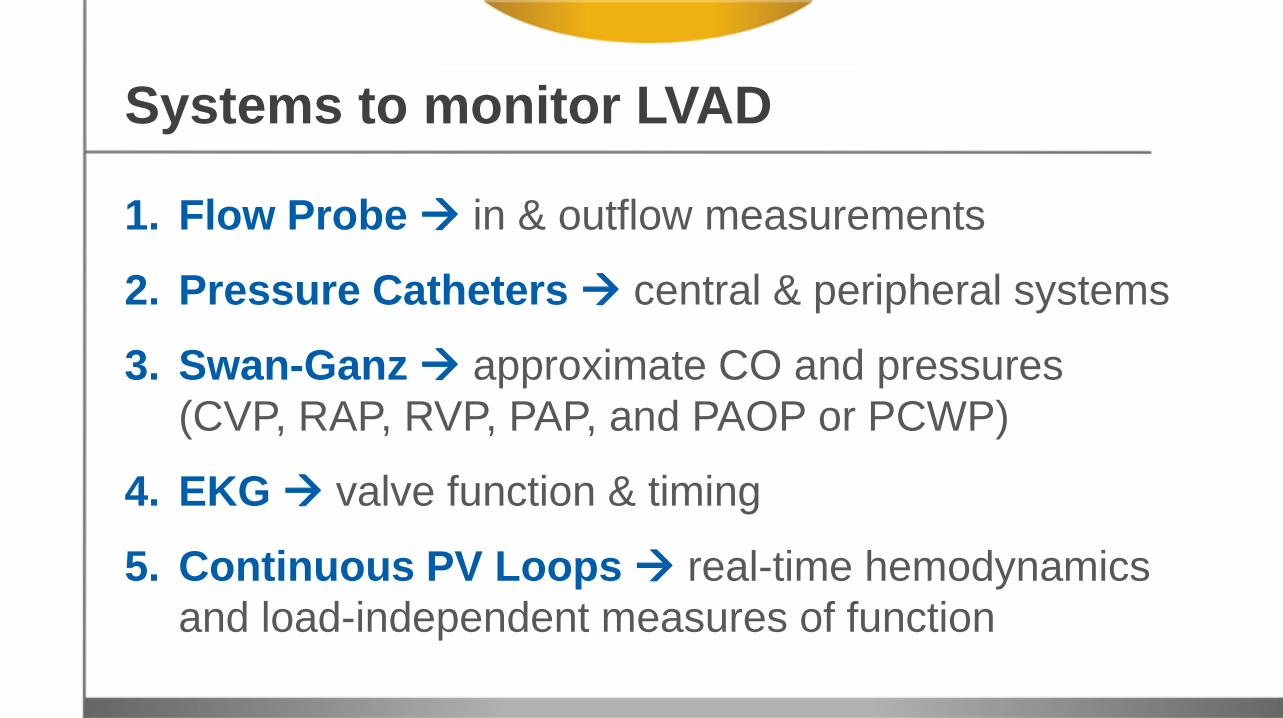
Systems to monitor LVAD
1. Flow Probe in & outflow measurements
2. Pressure Catheters central & peripheral systems
3. Swan-Ganz approximate CO and pressures
(CVP, RAP, RVP, PAP, and PAOP or PCWP)
4. EKG valve function & timing
5. Continuous PV Loops real-time hemodynamics
and load-independent measures of function

You are about to influence
hemodynamic parameters –
it is warranted to monitor central and
peripheral pressure and volume to
prevent suction on the system and/or
blood stasis and congestion.

LVAD Challenges
Ideally a VAD provides perfect balance -- in reality, resulting hemodynamics will fall
somewhere between “under-accomplished” and “excessive” support, and will vary
depending on heart and device function…
Inadequate Unloading Ao Regurgitation,
haemolysis, thrombosis, infection,
LVAD failure
Excessive Unloading Possible suction, may lead to post LVAD right HF
Balanced Condition
encourage cardiac recovery, decrease apoptosis, reduce
infarct size

PV Loops: Disease Progression to LVAD
• Total CO *
• ESP (mmHg)
• EDV
• SV (ml)
• SW (Joule)
• ESP (BSL>Injury>Unloaded)
• SV (BSL>Injury>Unloaded)
• EDV (Injury>Unloaded>BSL)
• SW (BSL>Injury>Unloaded) LV Volume (ml)
LV p
ress
ure
(m
mH
g)
Post ACUTE injury
BASELINE
UNLOADED LV with LVAD
Not unloaded FAILING
*sum of native cardiac and LVAD, based on position of suction (unloading) cannula
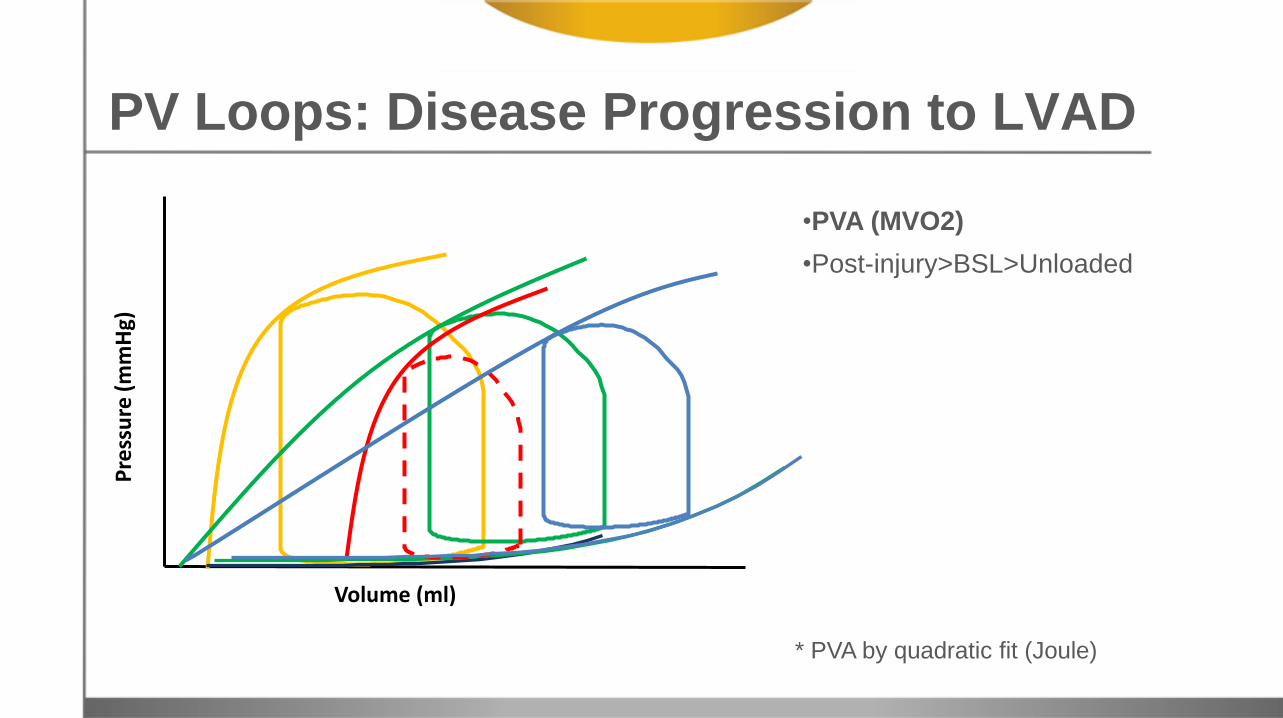
* PVA by quadratic fit (Joule)
Volume (ml)
Pre
ssu
re (
mm
Hg)
PV Loops: Disease Progression to LVAD
•PVA (MVO2)
•Post-injury>BSL>Unloaded
Seminar Summary
For the HFpEF, PV loops are essential for interrogating both systolic and diastolic function
PV loops allow us to elucidate complex drug interactions through load independent measurements
For the right heart, PV loops provide insight into functional compensation through various stages of pulmonary distress
Through transient load restriction and cycle to cycle assessment, LVAD testing can be improved

Seminar Resources
Slide-Deck and Recording for Review
Question & Answer Report
Five Part Pressure-Volume eBook Series Technology and Theory
Equipment Needs & Protocol Considerations
Application Overviews
Detailed Surgical Guides
Data Analysis Review
*over 100 pages of PV Loop application and technology information

Thank you for taking part in this event. We encourage all attendees to
register at www.insidescientific.com for notifications about future webinars.
Improve PV Loop Results by Heating & Monitoring During Surgery by Indus Instruments
Wednesday, May 14th @ 11AM EST
REGISTER FOR FREE