Height as a Proxy for Cognitive and Non-Cognitive … as a Proxy for Cognitive and Non-Cognitive...
35
NBER WORKING PAPER SERIES HEIGHT AS A PROXY FOR COGNITIVE AND NON-COGNITIVE ABILITY Andreas Schick Richard H. Steckel Working Paper 16570 http://www.nber.org/papers/w16570 NATIONAL BUREAU OF ECONOMIC RESEARCH 1050 Massachusetts Avenue Cambridge, MA 02138 December 2010 The views expressed herein are those of the authors and do not necessarily reflect the views of the National Bureau of Economic Research. NBER working papers are circulated for discussion and comment purposes. They have not been peer- reviewed or been subject to the review by the NBER Board of Directors that accompanies official NBER publications. © 2010 by Andreas Schick and Richard H. Steckel. All rights reserved. Short sections of text, not to exceed two paragraphs, may be quoted without explicit permission provided that full credit, including © notice, is given to the source.
Transcript of Height as a Proxy for Cognitive and Non-Cognitive … as a Proxy for Cognitive and Non-Cognitive...
NBER WORKING PAPER SERIES
HEIGHT AS A PROXY FOR COGNITIVE AND NON-COGNITIVE ABILITY
Andreas SchickRichard H. Steckel
Working Paper 16570http://www.nber.org/papers/w16570
NATIONAL BUREAU OF ECONOMIC RESEARCH1050 Massachusetts Avenue
Cambridge, MA 02138December 2010
The views expressed herein are those of the authors and do not necessarily reflect the views of theNational Bureau of Economic Research.
NBER working papers are circulated for discussion and comment purposes. They have not been peer-reviewed or been subject to the review by the NBER Board of Directors that accompanies officialNBER publications.
© 2010 by Andreas Schick and Richard H. Steckel. All rights reserved. Short sections of text, notto exceed two paragraphs, may be quoted without explicit permission provided that full credit, including© notice, is given to the source.
Height as a Proxy for Cognitive and Non-Cognitive AbilityAndreas Schick and Richard H. SteckelNBER Working Paper No. 16570December 2010JEL No. N3,J24
ABSTRACT
Taller workers receive a substantial wage premium. Studies extending back to the middle of the lastcentury attribute the premium to non-cognitive abilities, which are associated with stature and rewardedin the labor market. More recent research argues that cognitive abilities explain the stature-wage relationship.This paper reconciles the competing views by recognizing that net nutrition, a major determinant ofadult height, is integral to our cognitive and non-cognitive development. Using data from Britain’sNational Childhood Development Study (NCDS), we show that taller children have higher averagecognitive and non-cognitive test scores, and that each aptitude accounts for a substantial and roughlyequal portion of the stature premium. Together these abilities explain why taller people have higherwages.
Andreas SchickDepartment of EconomicsOhio State UniversityColumbus, OH [email protected]
Richard H. SteckelDepartment of EconomicsOhio State University410 Arps Hall, 1945 North High StreetColumbus, OH 43210-1172and [email protected]
3
I. Introduction
Why do taller workers earn notably more than their shorter counterparts, even in
industrialized countries? Height may increase individual productivity via its positive
association with strength and endurance; however, most non-agricultural jobs are
sedentary, and thus place relatively little value on these characteristics. Alternatively,
stature may reflect other characteristics that are rewarded in the labor market. The most
popular view in this vein attributes the premium to non-cognitive abilities (Stogdill,
1948; Baker and Redding, 1962; Adams, 1980; Judge and Cable, 2004; Persico,
Postlewaite, and Silverman, 2004). On the other hand, more recent research argues that
cognitive abilities explain the stature-wage relationship (Case and Paxson, 2008;
Heineck, 2009).
This paper tests the competing hypotheses. Using data from the British National
Childhood Development Study (NCDS), we examine the extent to which cognitive and
non-cognitive abilities separately contribute to the stature-wage relationship. We find that
taller children score higher on cognitive and non-cognitive assessments, and that each
aptitude separately explains a substantial and roughly equal portion of the relationship.
We also show that controlling for cognitive and non-cognitive abilities causes the stature
premium to vanish.
It is well documented that stature is associated with personal and economic
success. As early as 98 A.D., Roman historian Tacitus argued that stature represented
achievement. Later scholars echoed this view, such as prominent 19th century physician,
Julien-Joseph Virey, who added that taller populations were also more motivated and
industrious (Hall, 2006). Recent empirical evidence corroborates these claims. In western
countries, an increase in a man’s stature from the 25th to the 75th percentile of the height
distribution—an increase of approximately 4 to 5 inches—is associated with a 9 to 15
percent increase in earnings (Judge and Cable, 2004; Persico, Postlwaite, and Silverman;
2004; Heineck, 2005; Case and Paxson, 2008; Hubler, 2009). This return is roughly as
large as completing an additional 1 to 2 years of schooling.
4
The more popular (or traditional) view attributes the stature premium to a positive
correlation between height and non-cognitive ability. This correlation is thought to work
through various environmental pathways. For example, Persico, Postlewaite and
Silverman (2004) argue that some individuals associate stature with physical ability.
Taller workers, they reason, are stronger and quicker, and thus should excel in sports.
This rational encourages these individuals to pressure taller classmates to participate in
athletic activities. As a result, taller individuals are more inclined to engage in sports, and
accumulate the productive non-cognitive abilities (social skills) attributed with
participating in athletics, such as team work, discipline, confidence, and leadership.
Including social participation controls in the earnings equation modestly reduces the
estimated stature coefficient, from 0.023 to 0.0181. The height premium remains
substantial and statistically significant at the 5 percent level. However, these results may
understate the extent to which non-cognitive ability contributes to the height-wage
relationship because the traditional view associates at least ten non-cognitive abilities
with stature2.
Case and Paxson (2008) recently challenged this view, suggesting that cognitive,
rather than non-cognitive abilities, explain the stature premium. They attribute the height-
cognition relationship to a biological pathway: insulin-like growth factors. These
channels, they argue, stimulate simultaneous neural and physical growth, and also
develop neurological regions that manage cognitive capacity. Their empirical evidence
indicates that the height premium is largely, but not entirely, due to cognitive ability.
Including cognitive test scores in the earnings equation reduces the estimated stature
coefficient approximately 45 percent, from 0.023 to 0.013 for men and 0.019 to 0.011 for
women. However, the stature-wage relationship for men remains economically and
statistically significant at the 5 percent level, suggesting that other characteristics, such as
non-cognitive abilities, may play an important, independent role in the relationship.
1 The standard earnings equation is wages regressed on stature. 2 These characteristics are authority, communication, confidence, courtesy, discipline, ethical conduct, motivation, optimism persuasion, sociability. Persico, Postlwaite and Silverman (2004) did not include these measures in their analysis due to data limitations.
5
This paper makes two contributions to the literature. First, we show that taller
children are more cognitively able and socially adept. Using data from the NCDS, we
find that a one standard deviation increase in stature at age 7 (approximately 2 inches) is
associated with a 10 percent of a standard deviation increase in math and reading test
scores reported at age 11. Similarly, a one standard deviation increase in height at age 11
(approximately 2.5 inches) is associated with a 2 percent average increase in non-
cognitive ability. These effects are as large as growing up in middle class family versus a
lower class family.
Second, we show that social skills play as important a role as cognition in
explaining the stature-wage relationship. Using data from the NCDS, we find that
separately including either cognitive or non-cognitive controls in the earnings equation
reduces the stature estimates by roughly the same amount, from 0.015 to 0.009 for men
and 0.010 to 0.003 for women3. We include social skill measures, in addition to cognitive
test scores, to show that non-cognitive ability explains a substantial, independent portion
of the height premium. Including both measures reduces the stature estimates to
approximately zero, from 0.009 to 0.005 for men and 0.003 to 0.000 for women. These
results indicate that neither aptitude separately explains the entire stature premium; rather
both abilities are necessary to account for the entire relationship.
The paper proceeds as follows. Section II discusses the more popular view. It
covers the pathways associated with taller individuals accumulating more social skills,
and distinguishes which productive personality traits are particularly attributable to
stature. Section III provides intuitive and empirical evidence that these social skills
enhance productivity, and thus should provide a substantial contribution to the height
premium. Section IV presents the empirical strategy. Section V describes the data, and
section VI presents and discusses the results. Finally, section VII concludes.
3 These estimates represent the return to stature net of parental investment.
6
II. Height and Non-Cognitive Ability
The traditional view suggests that stature is correlated with several personality
traits conducive to worker productivity, such as emotional stability and extraversion4.
This correlation is thought to work through various environmental pathways. For
instance, numerous studies indicate that taller men are more attractive, and that
attractiveness is associated with competence. These perceptions encourage individuals to
provide taller individuals with more attention, praise and investment in their social
development. As a result, these workers accumulate more extroversive characteristics,
such as optimism and clear, persuasive communication skills. (Ross and Ferris 1981;
Harper, 2000; Judge and Cable 2004; Mobius and Rosenblat, 2005).
Another popular argument is that taller individuals grow up in more nurturing
environments. For example, more educated parents earn more, and thus can spend more
income on their child’s nutrition, medical care and opportunities to engage in social
activities. Cogent parents are also more adept at creating emotionally healthy
environments, which are pivotal to developing emotionally stable personalities
(Patterson, 1989; Brooks-Gunn and Duncan, 1997; Bradley, 2002).
Recent neurobiological research supports the traditional view. These studies
attribute stature’s positive relationship with emotional stability and extraversion to a
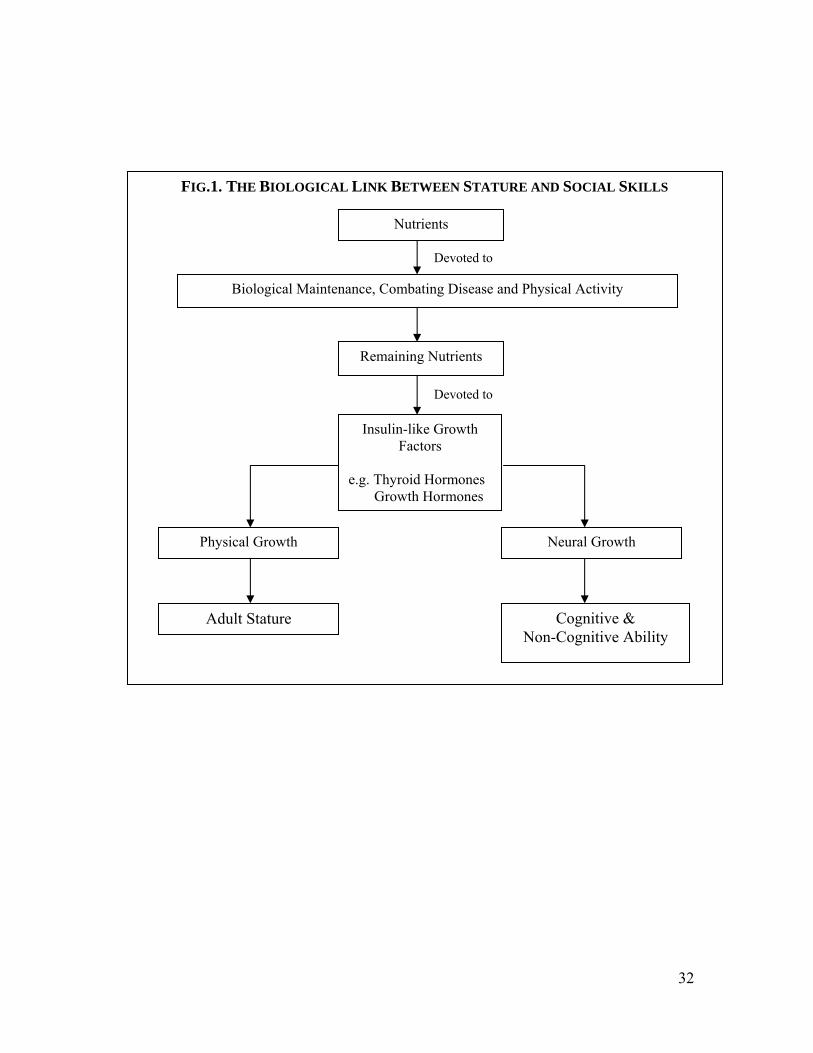
nature-nurture interaction5. Figure 1 illustrates the mechanism. Formally, adult stature
represents an individual’s net nutrition history. Growing bodies primarily use nutritional
resources to carry out maintenance, physical activities and combating diseases.
Remaining nutrients (surplus nutrition) are then converted to growth materials and
growth stimulating components: e.g., shared insulin-like growth factors, such as thyroid
and growth hormones (Tanner, 1978). The components are thought to stimulate
simultaneous physical and neural growth, and to develop neurological regions managing
4 These characteristics are sometimes referred to as social skills. 5 This channel is sometimes referred to as the biological pathway due to its associated with the biological literatures.
7
our cognitive and non-cognitive processes6. Hence, this pathway suggests that taller
adults are both more cognitively and non-cognitively able (Oppenheimer and Schwartz,
1997; Thompson and Potter, 2000; Fuster, 2001; Blair, 2004; Bechara, 2005).
[Insert Figure 1 here]
The psychological literature provides an in depth discussion as to why neural
growth plays an important role in determining emotional stability. The social brain
hypothesis suggests that our behavior is influenced by our instincts, what we innately
want to do, and our experience, what common knowledge tells us is appropriate. When
individuals choose between competing behaviors their instincts and experience assign
weights to each alternative. Given this feedback, the mind chooses the action with the
highest positive weight. The experience regions promote socially appropriate behavior
because our instincts occasionally encourage improper actions. For example, our instincts
may encourage us to sleep in, rather than work, when we wake up exhausted. In this case,
our experience can overrule our instincts, and encourage us to work.
Healthy neural development increases the experience regions’ authority in the
decision making process. Initially, the instinctual regions are more developed7. This
advantage allows our instincts to send stronger signals, and thus command more control
over our actions. As the brain develops, the experience regions receive relatively more
growth, which increases their relative authority over our behavior.
Empirical research supports the neurobiological theory. Liu et al. (2003) examines
the extent to which neural growth contributes to social development. They measure a
child’s neural growth using a standard proxy: the child’s nutritional status. Using data
from the Mauritius Longitudinal Study, they show that malnourishment increases the
frequency with which a child engages in an aggressive, antisocial, dishonest, and socially
6 These regions are the insular, anterior cingulated, medial prefrontal and frontal cortices. On average, the extent to which these biological channels operate on physical and neural growth is substantial. However, these studies also indicate that responses vary at the individual level. 7 These synapses are also denser, and thus can transmit more signals.
8
inappropriate action from occasionally to constantly. Other studies report similar results
using similar methods8 (Stoch and Smythe 1963; Chase and Martin 1970; Grantham-
McGreggor et al., 1982; Galler et al., 1983; Klein 1987).
III. Non-Cognitive Ability and Productivity
Most social scientists recognize that emotional stability and extraversion play an
important role in worker productivity (Judge et al., 1999). Emotionally stable individuals
are more adept at controlling their emotions and cultivating positive, rational personality
traits, such as composure and optimism. These traits are thought to promote more
amiable, ambitious and courteous dispositions, and are conducive to coping with stress
and managing individuals. As a result, psychologists commonly link emotional stability
to the following productive personality traits (social skills): authority, courtesy,
discipline, ethical conduct, optimism and motivation9 (Goldberg, 1990).
Most emotionally stable characteristics intuitively increase worker productivity.
Authoritative workers are more attentive, reliable, and talented at managing resources
and stress, which promotes their ability to recognize, analyze, and solve problems.
Motivated and disciplined employees work harder and longer, and engage in more
activities that enhance and broaden their skills (Goleman, 1998). Similarly, ethical
employees oppose shirking, and thus work more. They are also more apt to follow rules,
which are conducive to carrying out instructions and engaging in teamwork (Minkler,
2008).
How courtesy and optimism promote production is obscure. Courteous
individuals are amiable and polite, and thus are more inclined to avoid engaging in
counterproductive activities, such as antagonizing, intimidating, and threatening co-
workers (Noland and Bakke, 1977). These unproductive actions can present substantial
8 We would provide more precise empirical results. However, the estimates in these papers are not easy to interpret 9 Discipline, ethics and motivation are also associated with conscientiousness. For this paper’s purpose, this distinction is not very important as conscientiousness is non-cognitive characteristics.
9
costs to an employer. For example, Leymann (1990) estimated that antagonizing an
additional employee is associated with a $30,000 to $100,000 increase in operating costs.
Optimism enhances our capacity to cope with anxiety and negative emotions, and thus
reduces our chances of contracting depression: a disease that substantially promotes
apathy and shirking (DuPont et al., 2006).
Extroverts are assertive, optimistic, persuasive, and gregarious. As a result, they
are more adept at clear communication and engaging individuals in social situations.
These social skills intuitively play an important role in production. Clear communication
reduces the time required to tell individuals what to do and how to do it (Goleman, 1998;
Betz, 2008). These traits are fundamental for white collar workers. For example, most
patients prefer physicians that are empathetic, can communicate clearly, and most
importantly, have good bedside manners (Blue, 2007). These traits are also important for
most non-professional workers. For instance, carpenters must clearly convey instructions
and progress to their peers in order to expedite construction and reduce work related
accidents.
Recent empirical evidence supports the intuition. In western countries, a one
standard deviation increase in emotional stability is associated with a 7 to 11 percent
increase in earnings. Extraversion’s contribution to earnings is unclear. Most studies
indicate that extraversion increases productivity. However, its contribution reduces to
approximately zero once other personality traits are included in the earnings equation,
such as conscientiousness and emotional stability (Gelissen and de Graaf, 2006; Mueller
and Plug, 2006; Heineck, 2007).
IV. Empirical Framework
Our empirical task is to examine the extent to which cognitive and non-cognitive
abilities contribute to the stature-wage relationship. The standard way to measure the
height premium is to apply ordinary least squares (OLS) to:
10
= β + ρX + ς , (1)
where is the natural logarithm of individual i’s hourly wages, is adult height, X is a
vector of exogenous covariates determined before labor market entry (e.g., race,
residence, and parental investments) and ς is an error term (Case and Paxson, 2008). X
excludes measures capturing worker productivity, such as occupational status and
schooling. The rationale is that smarter, more socially adept workers commonly choose to
complete more schooling and pursue more lucrative careers. Therefore, these
characteristics are intuitively correlated with cognition and social skills, and thus their
inclusion in equation one could understate these abilities contribution to the height
premium.
The two views suggest that the estimated stature coefficient, OLS, represents the
extent to which stature is correlated with either cognition or social skills. We measure
each aptitude’s respective contribution to the stature premium by separately including
cognitive and non-cognitive controls in equation one. A substantial reduction in the
resulting stature estimate suggests that height is strongly correlated with the respective
ability. This approach provides a way to test the competing views. Assuming the more
popular view is correct, including non-cognitive controls should reduce the stature
estimate the most, and vice versa.
Social skill is strongly correlated with cognition (Heckman, 2006). As a result,
including non-cognitive controls in equation one may reduce the estimated stature
coefficient due to non-cognition’s correlation with cognitive ability, rather than due to its
independent association with stature10. We estimate non-cognition’s separate contribution
to the stature premium by including non-cognitive, in addition to cognitive, controls in
equation one. A substantial reduction in the resulting stature estimate, as compared to the
10 The average cross-correlation coefficient between the cognitive and non-cognitive measures is 0.10. Hence, the correlation is not large enough that multicollinearity is an issue.
11
estimate obtained using only cognitive ability controls, would suggest that social skills
provide a substantial, separate contribution to the premium.
V. Data
The analysis requires panel data containing measures of height, cognitive ability,
non-cognitive ability, and adult labor market outcomes. A suitable data source is the 1958
National Childhood Development Study11 (NCDS). The NCDS is a longitudinal survey
which began as a perinatal mortality study in 1958. The initial sample included all
children born in Britain during the week of March 3, 195812. Several follow up surveys
(sweeps) were conducted at ages 7, 11, 16, 23, 33 and 42. These sweeps collected a broad
range of health, socioeconomic, cognitive, and non-cognitive measures.
The NCDS provides several measures of emotional stability and extraversion.
Individuals evaluated their motivation, optimism and authority at ages 16, 23 and 33,
respectively. The optimism assessment contains 24 questions, each asking whether the
individual experiences various pessimistic temperaments, such as inadequacy, cynicism,
anxiety, and sorrow. A higher score suggests that the individual is more pessimistic. The
motivation assessment has 8 questions, each asking the individual their opinion regarding
activities associated with ambition; e.g., it is important to work hard and complete more
education. The answers are scaled using a 5 point system ranging from 1 – not true to 5 –
very true. A higher score suggests that the individual is more motivated. Authority is
attributed to management skills, such as leadership and the ability to give instructions.
11 The NLSY 79 Child and Young Adult surveys also contain these measures. We do not use these data because the samples are relatively small. Also, many of the children are still not adults, and thus the survey lacks information on their wages at age 30. 12 Environmental factors explain most average stature differences across populations (Malcolm, 1974; Martorelli and Habicht, 1986). Assuming environmental circumstances are significantly different between spring and the other seasons and these differences significantly affect individual characteristics, spring-born individuals may not adequately represent individuals born in other seasons. These conditions may hold because the spring disease environment is relatively gentle, especially compared to autumn and winter— the so-called cold and flu seasons. Also, spring-borns are exposed to more sunlight during infancy because the length of day increases during spring. Sunlight is required to produce vitamin D, which is required to use calcium. Another issue is individuals with significantly different characteristics may conceive children during different seasons; however, Card (2001) indicates these differences modestly affect child characteristics and outcomes.
12
Individuals rate themselves on these characteristics using a 2 point scale ranging from 0 –
not competent to 2 – very competent.
Ethical conduct represents the capacity to comply to authority. Teachers and
parents evaluated the individual’s integrity at ages 11 and 16. At age 16, teachers and
parents evaluated the adolescent’s honesty, truancy, vandalism record, minor crimes
record, compliance to rules, and aggression towards peers. The questions are measured
using a 2 point system ranging from 0 – the individual never expresses the characteristic
to 2 – the individual constantly displays the temperament. At age 11, teachers assessed
the student’s hostility and arrogance towards peers and authorities. These questions are
measured using a 10 point scale ranging from 1 – they are not hostile / arrogant to 10 –
they are very hostile / arrogant.
Courtesy is associated with manners and an amiable, easy going attitude.
Teachers evaluated their student’s courtesy at age 16. The questions asked the teacher to
rate the student’s irritability, moodiness, social flexibility and restlessness. Each question
was measured using the same 2 point scale employed to assess ethical conduct.
Extroverts are persuasive, gregarious and adept at clear communication. At age
33, individuals rated their ability to communicate and persuade individuals. Each
question was measured using the same scale employed to assess individual authority. At
age 16, teachers assessed their student’s inclination to engage in social and solitary
activities. Sociability was measured using a 5 point scale ranging from 1 – very social
and amiable to 5 – very withdrawn, and introversion was assessed using the same 2 point
scale employed to measure courtesy13.
13 We separately include the above personality assessments in the analysis to estimate the extent to which emotional stability and extraversion contribute to the stature premium. This approach restricts our capability to report each social skill’s individual return to earnings. First, the method requires me to include over a dozen personality assessments, and thus there is not enough room to accommodate these variables in a single-page table. Second, these variables are relatively collinear, which reduces their respective precision. We try to resolve this problem using a principle components analysis. However, it is unclear which temperaments the resulting components represent. Also, the analysis is unable to reduce the available measures into a smaller number of orthogonal components. For these reasons, we do not report each social skill’s individual contribution to earnings in the main analysis. The appendix reports several
13
We measure cognition using the variables employed in Case and Paxson (2008):
the individual’s math and reading test scores reported at age 11. We also include the
individual’s problem solving assessment reported at age 33. This assessment asks
individuals to evaluate their capacity to solve problems using computers with a 2 point
scale ranging from 0 – not competent to 2 – very competent.
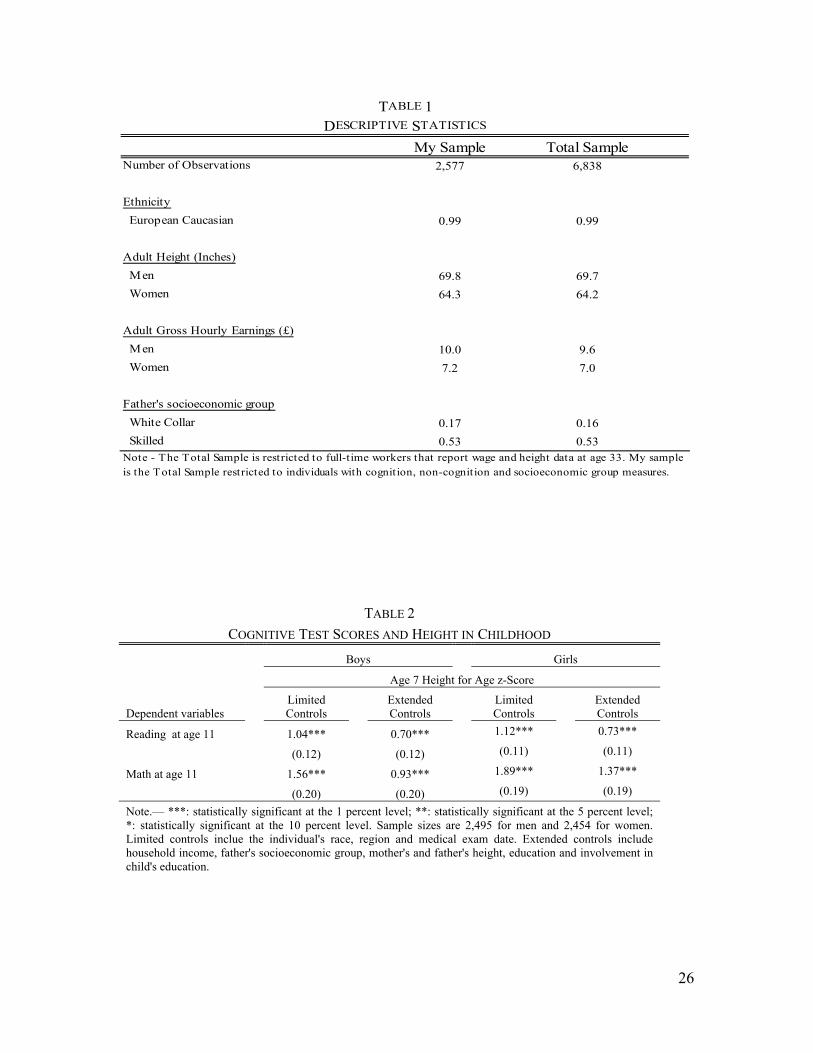
Table 1 presents summary statistics for two samples: the total sample, full-time
workers14 with height and wage measures; and the main sample, the previous sample
restricted to workers with measures of cognition and social skill. The main sample
consists almost entirely of individuals of European Caucasian descent. On average, men
stand at 5 feet 10 inches tall in adulthood and women 5 feet 4 inches. The average
logarithm of gross hourly earnings for men and women—in terms of the value of the
pound between 1999-2000—is £10.0 ($16.17) and £7.2 ($11.64), respectively.
Approximately 53 percent of the main sample was born to middle socioeconomic status
(skilled labor) fathers; 16 percent to high socioeconomic (managers and professionals)
fathers; and lastly, 31 percent to low socioeconomic (low skilled or semi-skilled labor)
fathers.
[Insert Table 1 here]
Restricting the sample to workers with cognitive and non-cognitive measures may
introduce selection bias if the availability of these measures is correlated with unobserved
determinants of wage. The results in table 1 indicate that the two samples have
approximately similar observable characteristic values, which suggests that the bias
introduced by the restriction is potentially small.
social skills return to earnings, and provides evidence that non-cognitive abilities play an important role in productivity. 14 Full-time workers are individuals who work 1000 or more hours a year.
14
VI. Results
The Association between Height, Cognition and Social Skills
We present evidence that stature is strongly correlated with cognitive and non-
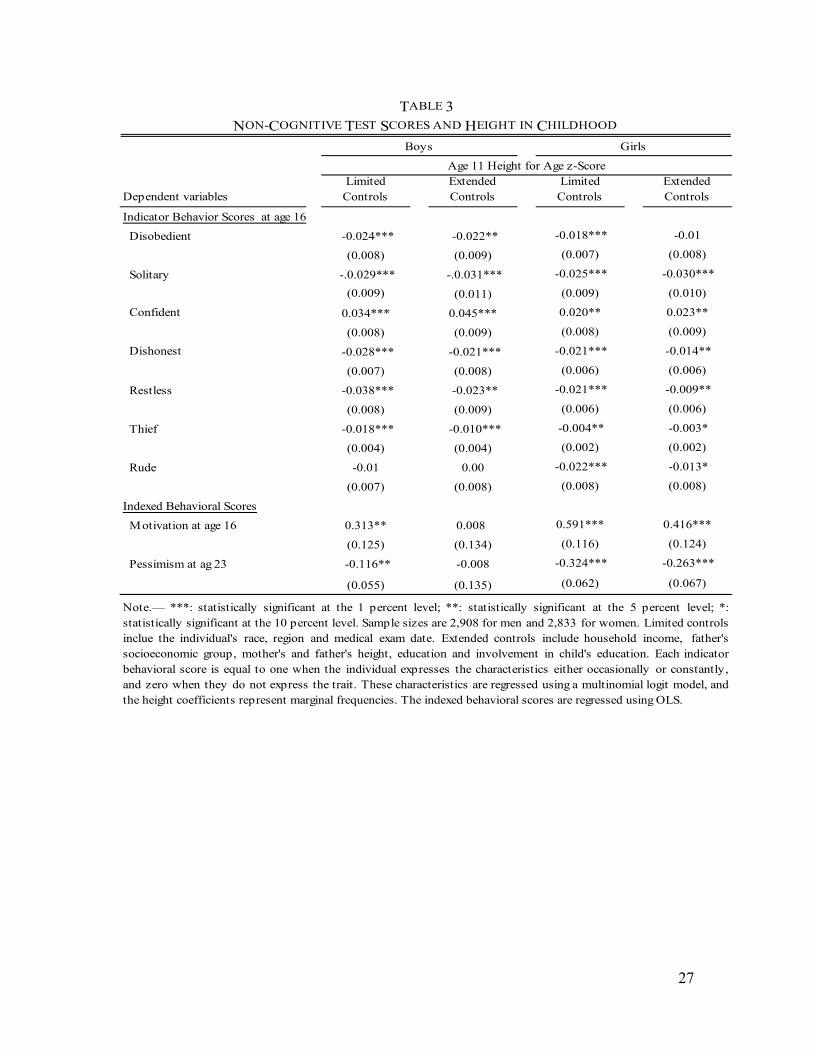
cognitive abilities. Table 2 reports OLS estimates of cognition at age 11 on stature at age
7 z-scores, and table 3 presents logistic results of social skill indicators at age 16 on
height at age 11 z-scores15. We convert the stature measures to z-scores using the 2000
growth charts from the Centers for Disease Control (2002). This standardization makes it
easier to compare estimates across ages and assessments. Column I controls for the
individual’s race, region of residence, and medical examination date. Column II includes
an extensive range of parental investment variables, such as the father’s socioeconomic
group at age 7, household income, parents’ academic achievement, parents’ stature, and
parents’ involvement in their child’s education. These extended controls are associated
with the environmental investments contributing to taller individuals achieving more
social development. If the traditional view is correct, then including these characteristics
should substantially reduce the resulting stature estimates.
The results indicate that taller children are more cognitively and non-cognitively
able than their shorter peers. Using extended controls, a one point increase in a boy’s
stature at age 7 z-score—approximately 2 inches—is associated with a 10 percent of a
standard deviation increase in math and reading test scores. Similarly, a one point
increase in a boy’s stature at age 11 z-score—roughly 2.5 inches—is associated with a 2
percent average increase in non-cognitive ability. These effects are roughly as large as a
two standard deviation increase in family income16. Similar results are reported for girls.
[Insert Tables 2 and 3 here]
15 The non-cognitive measures generally report whether an individual rarely, occasionally, or constantly displays a behavior. We transform these measures into dummy variables to simplify their interpretation (i.e., 0, the individual does not display the behavior and 1, the individual displays the behavior). This transformation does not significantly change the results. 16 For girls, a one standard deviation increase in family income is associated with a 7 percent of a standard deviation increase in reading score at age 11 and a 1 percent increase in average cognitive ability.
15
The environmental controls explain a substantial portion of the relationship
between stature and both cognitive and non-cognitive ability. Including these measures
reduces the stature estimates approximately 30 percent, on average, and in some cases—
such as motivation and optimism—explains the entire association. However, in most
cases, roughly two-thirds of the correlation between stature and ability remains
unexplained, which suggests that another pathway, such as the neurobiological channel,
may play an important role in determining this relationship17.
Height and Earnings
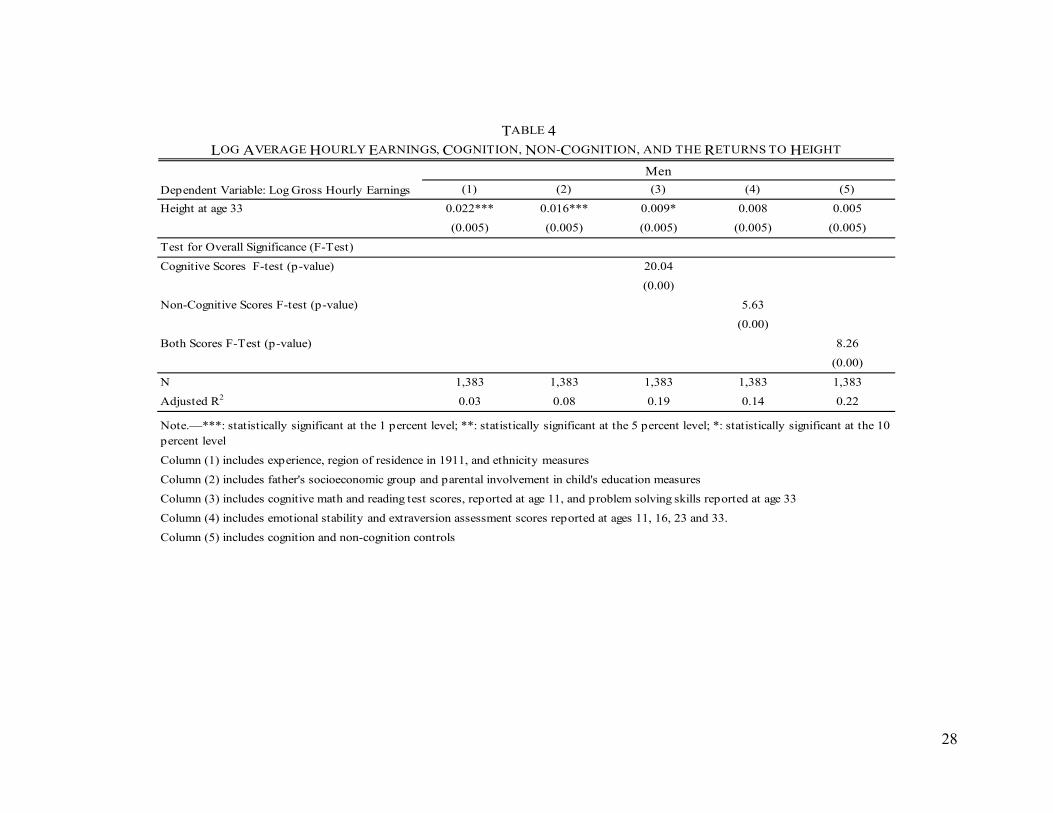
We examine the extent to which cognitive and non-cognitive ability separately
contribute to the height premium. Tables 4 and 5 present regression results of the natural
logarithm of gross hourly earnings on adult stature for men and women, respectively.
Column I includes experience, ethnicity and region of residency controls. Column II
controls for the father’s socioeconomic status, household income, parents’ education
levels and the parents involvement in their child’s education. Columns III-V include
cognitive controls, non-cognitive controls and both ability controls, respectively.
[Insert Tables 4 and 5 here]
The results indicate that taller men and women earn substantially more than their
shorter cohorts. A one inch increase in adult stature is associated with a 2.2 percent
average increase in earnings for men and a 1.9 percent increase for women. These
estimates are approximately equal in value to the estimates reported in Case and Paxson
(2008) and Persico et al. (2004)18.
The results in column III, tables 4 and 5, indicate that cognition does not explain
the entire stature-wage relationship. Including cognitive controls substantially reduces the
17 We would examine this topic further, but it is well beyond this paper’s scope. 18 As an interesting note, the disparity in stature between men and women does not explain the gender gap in earnings. We combine the men and women samples and estimate a regression of earnings on a male indicator. The estimate male wage premium is approximately 40 percent, which is approximately equal in value to the gender gap reported in Case and Paxson (2008). Controlling for cognition, social skills, stature and parental investment did not change the results.
16
height estimates, from 0.015 to 0.009 for men and 0.010 to 0.003 for women. The female
premium is approximately equal to zero; however, the male premium remains substantial
and statistically significant at the 10 percent level. This result suggests that another
pathway, such as non-cognitive ability, continues to play an important role in determining
the male stature premium.
The results in column IV indicate that social skills contribute as much to the
stature-wage relationship as cognition. Including non-cognitive controls reduces the
relationship approximately the same amount as cognitive ability: from 0.015 to 0.008 for
men and 0.010 to 0.003 for women. The results in column V suggest that non-cognitive
ability accounts for a substantial, independent portion of the height premium. Including
non-cognitive controls, in addition to cognitive controls, reduces the stature estimates an
additional standard deviation—from 0.009 to 0.005 for men and 0.003 to 0.000 for
women—and renders them statistically insignificant and approximately equal to zero.
Comparing the estimates in columns I and V, social skills individually reduce the height
estimates roughly 20–35 percent. These results support the traditional view.
The evidence indicates that neither view is entirely correct. Cognition and social
skills play an equally important role in determining the stature-wage relationship.
However, neither aptitude individually explains the entire relationship. More importantly,
the results imply that the stature premium is entirely associated to both cognitive and
non-cognitive ability. Controlling for both abilities reduces the male and female stature
premium approximately 75 and 100 percent, respectively.
Discrimination or Stature
Some social scientists suggest that the male stature premium represents
discrimination. Taller men, they argue, are not smarter or more socially adept; rather,
some societies associate stature with superiority, and thus are more inclined to employ
and promote taller men into more prestigious positions (Saul, 1971). This argument
implies that the male stature premium is associated with occupational sorting. Societies
17
sort taller men into relatively well-paying professions, and thus these men earn more on
average.
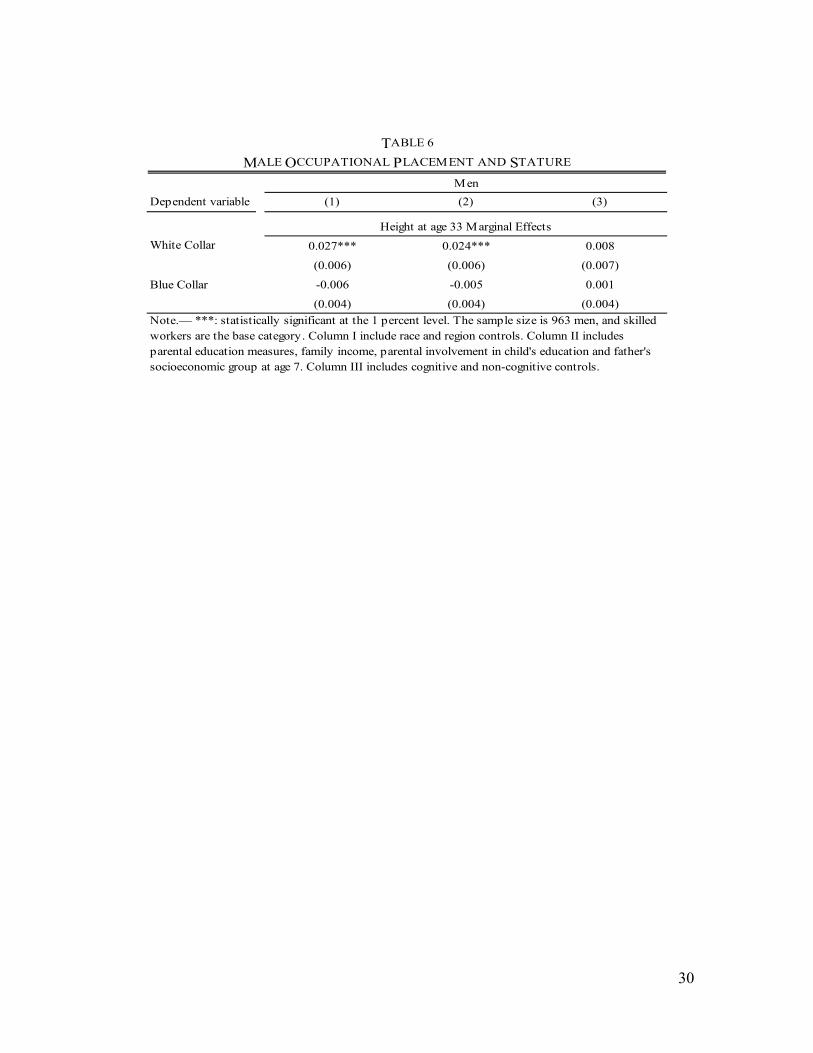
We test this hypothesis by regressing occupational status on stature. The NCDS
reports three occupational groups: white collar workers, managers and professionals;
skilled workers, manual and non-manual; and blue collar workers, semi-skilled and
unskilled workers. The NCDS assigns workers into a group, in part, using the
occupation’s average wage rate. In general, white (blue) collar workers receive the
highest (lowest) earnings.
Table 6 presents multinomial logistic regression results of occupational status on
stature (the base category is skilled workers). Column I includes race and region controls.
Column II controls for the father’s socioeconomic status at age 7, parents’ education
levels, household income, and the parents involvement in their child’s education. Column
III includes cognitive and non-cognitive controls.
The evidence indicates that taller men are substantially more likely to select into
white collar occupations as opposed to skilled vocations. However, the result is due to
stature’s association with cognition and social skills, rather than to discrimination. A one
inch increase in adult stature is associated with a 2.7 percent increase in acquiring a white
collar occupation over a skilled vocation. The effect is as large as a one standard
deviation increase in household income. Including parental measures marginally reduces
the stature estimates, while incorporating cognitive and non-cognitive controls reduces
the stature estimates to approximately zero and renders them statistically insignificant. A
one inch increase in stature is now associated with a .8 percent increase in acquiring a
white collar occupation over a skilled job19.
[Insert table 6 here]
19 We conduct the same analysis using the female sample. The results indicate that stature is uncorrelated with occupational status among women. This result is consistent with the discrimination argument, which attributes the pathway solely to men.
18
The discrimination view also suggests that taller men are more physically
attractive, and that some societies associate attractiveness with superiority. This
hypothesis is related to the traditional view argument mentioned earlier. However, the
two views have an important distinction. The tradition view suggests that attractive men
accumulate more social skills, and thus it is non-cognitive ability that ultimately causes
these men to earn more. In contrast, the discrimination view argues that attractiveness is
uncorrelated with non-cognitive ability. Rather, employers tend to overestimate an
attractive worker’s productivity, which causes them to pay taller workers more than they
are worth (Mobius and Rosenblat, 2005).
We examine the extent to which attractiveness contributes to the stature premium
by including beauty controls in the main analysis. A substantial reduction in the resulting
stature estimate suggests that attractiveness plays an important role in determining the
premium. Beauty is measured at ages 11 and 33. At age 33, individuals report whether
they are overweight or not. At age 11, teachers rate their student’s physical attractiveness
as attractive or unattractive20.
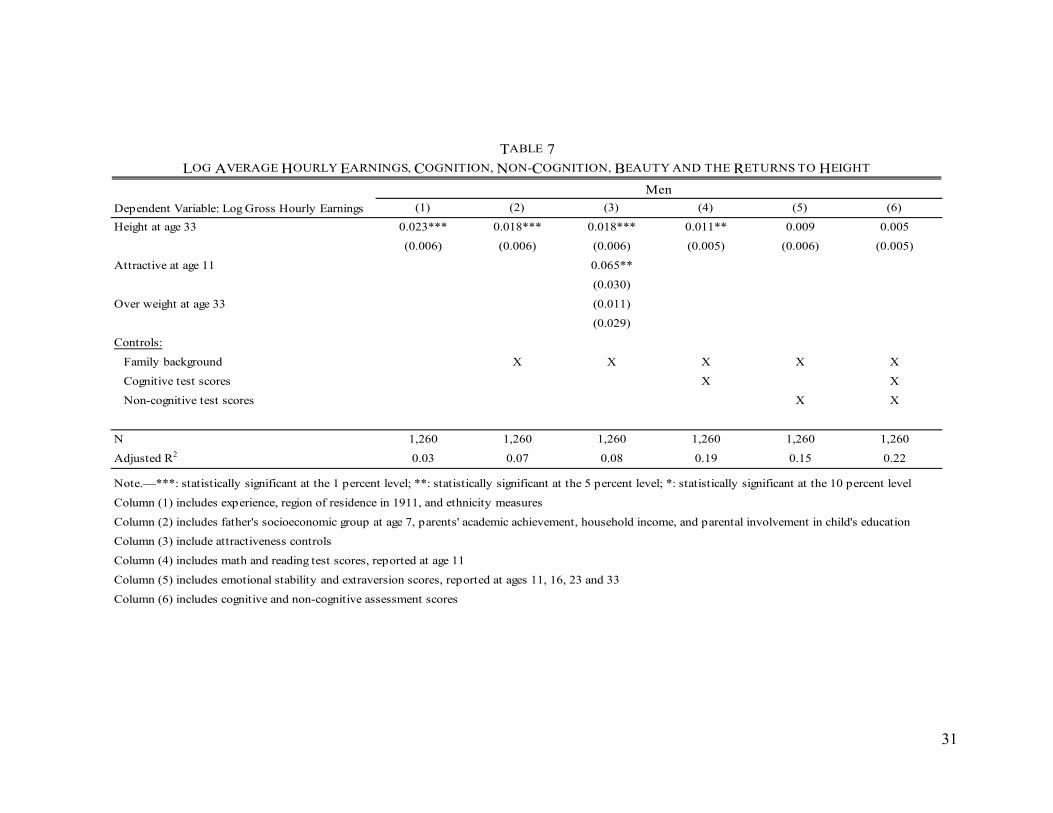
Table 7 presents evidence that more attractive men receive a substantial wage
premium. The results in column III indicate that attractive 11 year olds earn
approximately 6.5 percent more as adults than their unattractive peers. However,
including attractiveness controls does not change the stature estimate, which suggests that
beauty’s true return to the height premium is modest.
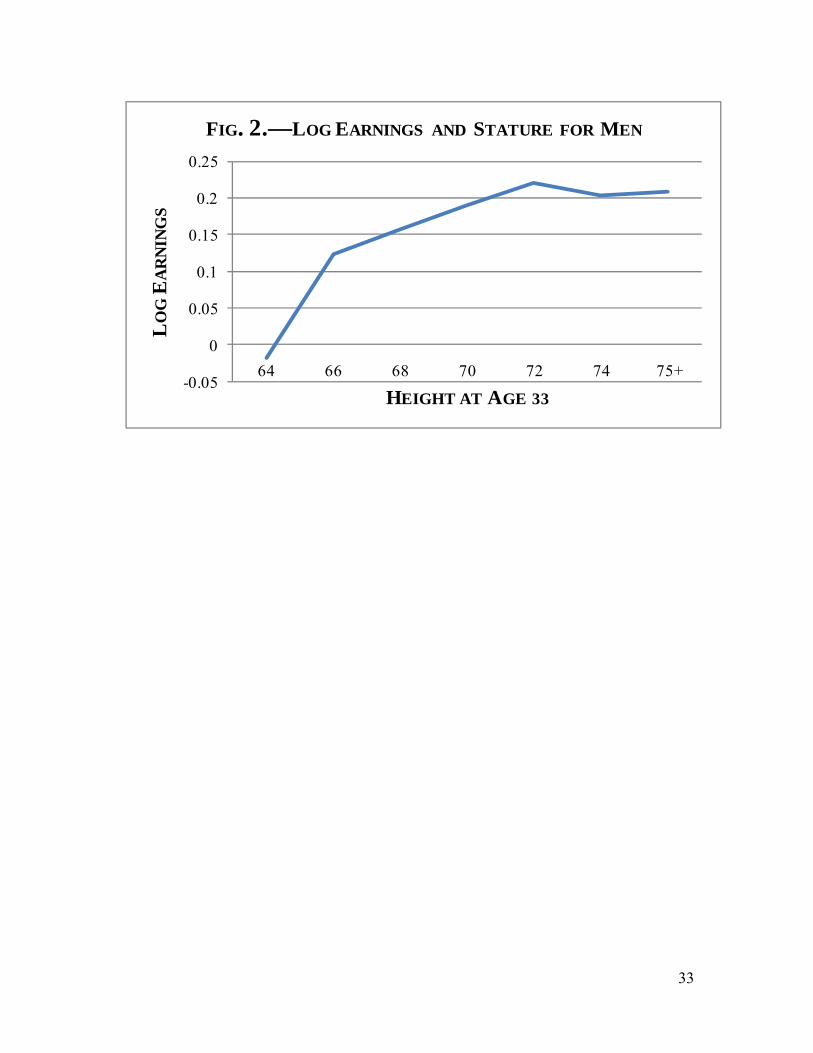
The discrimination views argue that only distinctively taller men receive a
superiority premium, and that this premium causes these men to earn a substantial,
discontinuous increase in earnings21. Figure 2 reports regression results of earnings on
several stature dummies, controlling for experience, ethnicity and region. The results
indicate that taller individuals do not receive a sizable, discontinuous increase in
earnings; rather, the returns to stature increase at a decreasing rate, and approach
20 We acknowledge that these measures are not ideal. However, they are the best measures given the available data. 21 Distinctively taller men are one to two standard deviations taller than average.
19
approximately zero at 72 inches22 (approximately one standard deviation above average
stature). Shorter men receive significantly higher average returns accompanying gains in
stature. This result supports the neurobiological pathway, which claims that the
correlation between physical and neural development decreases as individuals undergo
more physical growth. As a result, a gain in stature should provide shorter individuals, or
those experiencing less physical development, with relatively more neurological growth,
and thus a higher average increase in earnings.
[Insert Figure 2 here]
VII. Conclusion
Researchers have put forward two explanations for the height premium. The more
established view claims that stature is positively correlated with non-cognitive abilities
that are rewarded in the labor market (Stogdill, 1948; Baker and Redding, 1962; Adams,
1980; Judge and Cable, 2004; Persico, Postlewaite, and Silverman, 2004). Another view
recently challenged this mechanism, arguing that cognitive development accompanying
vigorous physical growth accounts for the relationship (Case and Paxson, 2008; Heineck,
2009).
This paper tests the competing hypotheses. Using data from the National
Childhood Development Study (NCDS), we show that taller children are more
cognitively able and socially adept than their shorter cohorts. A one standard deviation
increase in stature at age 7 (approximately 2 inches) is associated with a 10 percent of a
standard deviation increase in math and reading test scores reported at age 11. Similarly,
a one standard deviation increase in height at age 11 (approximately 2.5 inches) is
associated with a 2 percent average increase in non-cognitive ability. These effects are as
large as growing up in middle class family versus a lower class family.
22 Hubler (2009) and Case and Paxson (2008) report relatively similar results using the German Socio-Economic Panel and NCDS data, respectively.
20
We also show that each aptitude accounts for a substantial and approximately
equal portion of the stature premium. Separately including either cognitive or non-
cognitive controls in the standard earnings equation reduces the estimated stature
coefficient roughly the same amount, from 0.015 to 0.009 for men and 0.010 to 0.003 for
women. The non-cognitive controls explain a substantial, independent portion of the
stature-wage relationship. Including non-cognitive, in addition to cognitive controls,
reduces the stature estimates to approximately zero, from 0.009 to 0.005 for men and
0.003 to 0.000 for women. These results indicate that neither pathway individually
explains the entire relationship; rather, both abilities are necessary to capture the whole
relationship.
An implication of this paper’s findings is that researchers should include stature
variables in the standard Mincerian earnings equation when cognitive or non-cognitive
measures are unavailable. Researchers use the Mincerian approach to estimate the true
returns to schooling. However, schooling is positively associated with cognitive and non-
cognitive ability, and thus analyses that omit ability measures will produce estimated
schooling coefficients that are biased upward. The results show that adult height is
strongly correlated with cognitive and non-cognitive ability. Hence, researchers can use
stature measures to mediate this bias when ability scores are unavailable.
The empirical evidence suggests several areas for further research. A natural
extension would examine the stature premium in poorer settings, such as developing
nations. Poorer populations undergo substantially less physical growth, which, according
to the neurobiological pathway, implies that a gain in stature should provide these
populations with more neural growth, and thus a larger height premium. This mechanism
suggests that the returns to productivity operating through gains in stature are relatively
greater in developing countries. Hence, it would be interesting to test this implication,
and measure the degree to which ability contributes to the stature-wage relationship in
impoverished populations.
21
For policy makers, the next step is to examine the extent to which the
environmental and nature-nurture interaction pathways separately contribute to the
stature premium. One direction would test whether exogenous nutritional shocks
contribute to the physical-neural growth relationship, and thus the link between stature
and both cognitive and non-cognitive ability. Pediatric research indicates that consuming
a nutritionally diverse diet—especially during pivotal growth stages, such as in utero and
childhood—is conducive to producing more growth stimulating components, and thus to
becoming taller and achieving more cognitive and non-cognitive development (Williams
et al. 1978; Richards et al., 2002; Scheepens et al., 2005; Liu and Raine, 2006; Kiddie et
al., 2010). Hence, it would be interesting to test this implication, and study which
nutrients and growth stages play the most important role in determining the stature-ability
relationship.
22
References
Adams, R. 1980. Social Psychology and Beauty: Effects of Age, Height,and Weight on Self-Reported Personality Traits and Social Behavior. Journal of Social Psychology 112: 287–293. Baker, Eldon, and Charles Redding. 1962. The Effects of Perceived Tallness in Persuasive Speaking: An Experiment. Journal of Communication 12:51–53. Bechara, Antoine. 2005. Decision Making, Impulse Control and Loss of Willpower to
Resist Drugs: A Neurocognitive Perspective. Nature Neuroscience 8 (11):1458-1463.
Betz, Frank. 2008. Returns to Sociability. Unpublished Manuscript. Blair, R. 2004. The Roles of Orbital Frontal Cortex in the Modulation of Antisocial
Behavior. Brain and Cognition. 55:198-208. Blue, Laura. 2007. Better Bedside Manners. Time. Bradley, Robert and Robert Corwyn. 2002. Socioeconomic Status and Child
Development. Annual Review of Psychology 53: 371-399. Brooks-Gunn, Jeanne, and Greg Duncan. 1997. The Effects of Poverty on Children.
Children and Poverty 7 (2): 55-71. Card, David. 2001. Estimating the Return to Schooling: Progress on Some Persistent
Econometric Problems. Econometrica 69 (5):1127-1160. Case, Anne, and Christina Paxson. 2008. Stature and Status: Height, Ability, and Labor
Market Outcomes. Journal of Political Economy 116 (3):499-532. Centers for Disease Control. 2002. 2000 CDC Growth Charts for the United States:
Methods and Development. Vital and Health Statistics 11 (246). Chase, H.P., and H.P. Martin. 1970. Undernutrition and Child Development. New
England Journal of Medicine 282:933-939. DuPont, Robert, Dorothy P. Rice, Leonard S. Miller, Sarah S. Shiraki, Clayton R.
Rowland, and Henrick J. Harwood. 1996. Economics Costs of Anxiety Disorders. Anxiety 2:167-172.
Fuster, Joaquin. 2001. The Prefrontal Cortex – An Update: Time Is of the Essence.
Neuron 30:319-333. Galler, J.R., F. Ramsey, G. Solimano, and W.E. Lowell. 1983. The Influence of Early

23
Malnutrition and Subsequent Behavioral Development. Journal of the American Academy of Child Psychiatry 22:16-22.
Gelissen, John and Paul M. de Graaf. 2006. Personality, Social Background, and
Occupational Career Ruccess. Social Science Research 35:702-726. Goldberg, Lewis. 1990. An Alternative “Description of Personality”: The Big-Five
Factor Structure” Journal of Personality and Social Psychology 59 (6): 1216-1229.
Goleman, Daniel. 1998. Working with Emotional Cognition. New York: Bantam. Grantham-McGregor, Sally, C. Powell, M. Stewart, and W.N. Schofield. 1982.
Longitudinal Study of Growth and Development of Young Jamaican Children Recovering from Severe Protein-Energy Malnutrition. Development Medicine and Child Neurology 24:321-331.
Hall, Stephen. 2006. Size Matters: How Height Affects the Health, Happiness, and
Success of Boys—And the Men they Become. New York: Houghton Mifflin Company.
Harper, Barry. 2000. Beauty, Stature and the Labour Market: A British Cohort Study.
Oxford Bulletin of Economics and Statistics 62 (s1):771-800. Heckman, James, Jora Stixrud, and Sergio Urzua. 2006. The Effects of Cognitive and
Non-Cognitive Abilities on Labor Market Outcomes and Social Behavior. NBER working paper no. 12006.
Heineck, Guido. 2005. Up in the Skies? The Relationship between Body Height and
Earnings in Germany. Labour 19 (3): 469-489. Heineck, Guido. 2007. Does it Pay to be Nice? Personality and Earnings in the UK. LASER Discussion Paper 06. Hübler, Olaf. 2009. The Nonlinear Link Between Height and Wages in Germany, 1985–
2004. Economics and Human Biology 7 (2):191-199. Judge, Timothy A., Chad A. Higgins, Carl J. Thoresen, and Murray R. Barrick. 1999.
The Big Five Personality Traits, General Mental Ability, and Career Success Across the Life Span. Personnel Psychology 52 (3):621-652.
Judge, Timothy A., and Daniel M Cable. 2004. The Effect of Physical Height on
Workplace Success and Income: Preliminary Test of a Theoretical Model. Journal of Applied Psychology 89 (3):428-441.
Kiddie, Joy, Margaret D. Weiss, David D. Kitts, Ryna Levy-Milne, and Michael B.
24
Wasdell. 2010. Nutritional Status of Children with Attention Deficit Hyperactivity Disorder: A Pilot Study. International Journal of Pediatrics.
Klein, R.G. 1987. Prognosis of Attention Deficit Disorder and its Management of
Adolescence. Pediatrics Review 8:216-222. Leymann, Heinz. 1990. Mobbing and Psychological Terror at Workplaces. Violence and
Victims 5 (2):119-126. Liu, Jianghong, Adrian Raine, Peter Venables, and Sarnoff Mednick. 2003. Malnutrition
at Age 3 Years and Lower Cognitive Ability at Age 11 Years. Archives of Pediatrics & Adolescent Medicine 157:593-600.
Liu, Jianghong and Adrian Raine. 2006. The Effect of Childhood Malnutrition on
Externalizing Behavior. Current Opinion in Pediatrics 18 (5): 565-570. Malcolm, L.A. 1974. Ecological Factors Relating to Child Growth and Nutritional Status.
In Nutrition and Malnutrition: Identification and measurement, edited by A. F. Roche and F. Falkner. New York: Plenum Press.
Martorell, Reynaldo, and Jean-Pierre Habicht. 1986. Growth in Early Childhood in
Developing Countries. In Human Growth: A Comprehensive Treatise, edited by F. Falkner and J. M. Tanner. New York: Plenum Press.
Minkler, Lanse. 2008. Integrity and Agreement. Michigan: University of Michigan Press. Mobius, Markus M., and Tanya S. Rosenblat. 2006. Why Beauty Matters. The American
Economic Review 96 (1):222-235. Mueller, Gerrit and Erik Plug. 2006. Estimating the Effect of Personality on Male and
Female Earnings. Industrial & Labor Relations Review 60 (1):1-22. Noland, Edward and Edward Bakke. 1977. Workers Wanted. New York: Harper. Oppenheimer, Jack and Harold L. Schwartz. 1997. Molecular Basis of Thyroid Hormone-
Dependent Brain Development. Endocrine Reviews 18:462-475. Patterson, Gerald, Barbara Debaryshe, and Elizabeth Ramsey. 1990. A Developmental Perspective on Antisocial Behavior. American Psychologist 44: 329-335. Persico, Nicola, Andrew Postlewaite, and Dan Silverman. 2004. The Effect of Adolescent
Experience on Labor Market Outcomes: The Case of Height. Journal of Political Economy 112:1019-1053.
Richards, Marcus, Rebecca Hardy, Diana Kuh, and Michael E. J. Wadsworth. 2002.
Birthweight, Postnatal Growth and Cognitive Function in a National U.K. Birth
25
Cohort. International Journal of. Epidemiology 31:342-348. Ross, Jerry, and Kenneth Ferris. 1981. Interpersonal Attraction and Organizational
Outcomes: A Field Examination. Administrative Science Quarterly 26:617-632. Saul, Feldman. 1971. The Presentation of Shortness in Everyday Life—Height and
Heightism in American Society: Toward a Sociology of Stature Paper. Presented at the meeting of the American Sociological Association. Chicago: Illinois.
Scheepens, Arjan, Tanja A.E. Möderscheim, and Peter D. Gluckman. 2005. The Role of
Growth Hormone in Neural Development. Hormone Research 64(suppl 3):66–72. Stoch, M.B., and P.M. Smythe. 1963. Does Undernutrition During Infancy Inhibit Brain
Growth and Subsequent Intellectual Development. New England Journal of Medicine 282:933-939.
Stogdill, R. M. 1948. Personal Factors Associated with Leadership: A Survey of the Literature. Journal of Psychology 25: 35–71. Tanner, James. 1978. Foetus into Man: Physical Growth from Conception to Maturity.
Cambridge: Harvard U. Press. Thompson, Catherine, and Gregory B. Potter. 2000. Thyroid Hormone Action in Neural
Development. Cerebral Cortex 10 (10):939-945. Williams, Ivan, Douglas M. Cram, Frances T. Tausig, and Evelyn Webster. 1978. Relative Effects of Drugs and Diet on Hyperactive Behaviors: An Experimental Study. Pediatrics 61 (6):811-817.
26
My Sample Total SampleNumber of Observations 2,577 6,838
Ethnicity
European Caucasian 0.99 0.99
Adult Height (Inches)
Men 69.8 69.7
Women 64.3 64.2
Adult Gross Hourly Earnings (£)
Men 10.0 9.6
Women 7.2 7.0
Father's socioeconomic group
White Collar 0.17 0.16
Skilled 0.53 0.53
TABLE 1DESCRIPTIVE STATISTICS
Note - The Total Sample is restricted to full-time workers that report wage and height data at age 33. My sample is the Total Sample restricted to individuals with cognition, non-cognition and socioeconomic group measures.
TABLE 2
COGNITIVE TEST SCORES AND HEIGHT IN CHILDHOOD
Boys Girls
Age 7 Height for Age z-Score
Dependent variables Limited Controls
Extended Controls
Limited Controls
Extended Controls
Reading at age 11 1.04*** 0.70*** 1.12*** 0.73***
(0.12) (0.12) (0.11) (0.11)
Math at age 11 1.56*** 0.93*** 1.89*** 1.37***
(0.20) (0.20) (0.19) (0.19)
Note.— ***: statistically significant at the 1 percent level; **: statistically significant at the 5 percent level; *: statistically significant at the 10 percent level. Sample sizes are 2,495 for men and 2,454 for women. Limited controls inclue the individual's race, region and medical exam date. Extended controls include household income, father's socioeconomic group, mother's and father's height, education and involvement in child's education.
27
Dependent variables Limited
ControlsExtended Controls
Limited Controls
Extended Controls
Indicator Behavior Scores at age 16
Disobedient -0.024*** -0.022** -0.018*** -0.01
(0.008) (0.009) (0.007) (0.008)
Solitary -.0.029*** -.0.031*** -0.025*** -0.030***
(0.009) (0.011) (0.009) (0.010)
Confident 0.034*** 0.045*** 0.020** 0.023**
(0.008) (0.009) (0.008) (0.009)
Dishonest -0.028*** -0.021*** -0.021*** -0.014**
(0.007) (0.008) (0.006) (0.006)
Restless -0.038*** -0.023** -0.021*** -0.009**
(0.008) (0.009) (0.006) (0.006)
Thief -0.018*** -0.010*** -0.004** -0.003*
(0.004) (0.004) (0.002) (0.002)
Rude -0.01 0.00 -0.022*** -0.013*
(0.007) (0.008) (0.008) (0.008)
Indexed Behavioral Scores
Motivation at age 16 0.313** 0.008 0.591*** 0.416***
(0.125) (0.134) (0.116) (0.124)
Pessimism at ag 23 -0.116** -0.008 -0.324*** -0.263***
(0.055) (0.135) (0.062) (0.067)
Age 11 Height for Age z-Score
Note.— ***: statistically significant at the 1 percent level; **: statistically significant at the 5 percent level; *:statistically significant at the 10 percent level. Sample sizes are 2,908 for men and 2,833 for women. Limited controlsinclue the individual's race, region and medical exam date. Extended controls include household income, father'ssocioeconomic group, mother's and father's height, education and involvement in child's education. Each indicatorbehavioral score is equal to one when the individual expresses the characteristics either occasionally or constantly,and zero when they do not express the trait. These characteristics are regressed using a multinomial logit model, andthe height coefficients represent marginal frequencies. The indexed behavioral scores are regressed using OLS.
TABLE 3NON-COGNITIVE TEST SCORES AND HEIGHT IN CHILDHOOD
Boys Girls
28
Dependent Variable: Log Gross Hourly Earnings (1) (2) (3) (4) (5)
Height at age 33 0.022*** 0.016*** 0.009* 0.008 0.005
(0.005) (0.005) (0.005) (0.005) (0.005)
Test for Overall Significance (F-Test)
Cognitive Scores F-test (p-value) 20.04
(0.00)
Non-Cognitive Scores F-test (p-value) 5.63
(0.00)
Both Scores F-Test (p-value) 8.26
(0.00)
N 1,383 1,383 1,383 1,383 1,383
Adjusted R2 0.03 0.08 0.19 0.14 0.22
Column (1) includes experience, region of residence in 1911, and ethnicity measures
Column (2) includes father's socioeconomic group and parental involvement in child's education measures
Column (3) includes cognitive math and reading test scores, reported at age 11, and problem solving skills reported at age 33
Column (5) includes cognition and non-cognition controls
Column (4) includes emotional stability and extraversion assessment scores reported at ages 11, 16, 23 and 33.
TABLE 4LOG AVERAGE HOURLY EARNINGS, COGNITION, NON-COGNITION, AND THE RETURNS TO HEIGHT
Men
Note.—***: statistically significant at the 1 percent level; **: statistically significant at the 5 percent level; *: statistically significant at the 10 percent level

29
Dependent Variable: Log Gross Hourly Earnings (1) (2) (3) (4) (5)
Height at age 33 0.019*** 0.010* 0.003 0.003 0.000
(0.006) (0.006) (0.006) (0.006) (0.006)
Test for Overall Significance (F-Test)
Cognitive Scores F-test (p-value) 16.12
(0.00)
Non-Cognitive Scores F-test (p-value) 5.33
(0.00)
Both Scores F-Test (p-value) 6.9
(0.00)
N 1,167 1,167 1,167 1,167 1,167
Adjusted R2 0.01 0.09 0.18 0.16 0.21
Column (1) includes experience, region of residence in 1911, and ethnicity measures
Column (2) includes father's socioeconomic group and parental involvement in child's education measures
Column (3) includes cognitive math and reading test scores, reported at age 11, and problem solving skills reported at age 33
Column (5) includes cognition and non-cognition controls
Women
LOG AVERAGE HOURLY EARNINGS, COGNITION, NON-COGNITION, AND THE RETURNS TO HEIGHT
TABLE 5
Column (4) includes emotional stability and extraversion assessment scores reported at ages 11, 16, 23 and 33.
Note.—***: statistically significant at the 1 percent level; **: statistically significant at the 5 percent level; *: statistically significant at the 10 percent level
30
Men
Dependent variable (1) (2) (3)
White Collar 0.027*** 0.024*** 0.008
(0.006) (0.006) (0.007)
Blue Collar -0.006 -0.005 0.001
(0.004) (0.004) (0.004)
Note.— ***: statistically significant at the 1 percent level. The sample size is 963 men, and skilled workers are the base category. Column I include race and region controls. Column II includes parental education measures, family income, parental involvement in child's education and father's socioeconomic group at age 7. Column III includes cognitive and non-cognitive controls.
Height at age 33 Marginal Effects
TABLE 6
MALE OCCUPATIONAL PLACEMENT AND STATURE
31
Dependent Variable: Log Gross Hourly Earnings (1) (2) (3) (4) (5) (6)
Height at age 33 0.023*** 0.018*** 0.018*** 0.011** 0.009 0.005
(0.006) (0.006) (0.006) (0.005) (0.006) (0.005)
Attractive at age 11 0.065**
(0.030)
Over weight at age 33 (0.011)
(0.029)
Controls:
Family background X X X X X
Cognitive test scores X X
Non-cognitive test scores X X
N 1,260 1,260 1,260 1,260 1,260 1,260
Adjusted R2 0.03 0.07 0.08 0.19 0.15 0.22
Column (1) includes experience, region of residence in 1911, and ethnicity measures
Column (2) includes father's socioeconomic group at age 7, parents' academic achievement, household income, and parental involvement in child's education
Column (3) include attractiveness controls
Column (4) includes math and reading test scores, reported at age 11
Column (6) includes cognitive and non-cognitive assessment scores
TABLE 7LOG AVERAGE HOURLY EARNINGS, COGNITION, NON-COGNITION, BEAUTY AND THE RETURNS TO HEIGHT
Men
Note.—***: statistically significant at the 1 percent level; **: statistically significant at the 5 percent level; *: statistically significant at the 10 percent level
Column (5) includes emotional stability and extraversion scores, reported at ages 11, 16, 23 and 33
32
FIG.1. THE BIOLOGICAL LINK BETWEEN STATURE AND SOCIAL SKILLS
Insulin-like Growth Factors
e.g. Thyroid Hormones Growth Hormones
Physical Growth
Adult Stature
Neural Growth
Cognitive & Non-Cognitive Ability
Nutrients
Biological Maintenance, Combating Disease and Physical Activity
Devoted to
Remaining Nutrients
Devoted to
33
-0.05
0
0.05
0.1
0.15
0.2
0.25
64 66 68 70 72 74 75+
LO
GE
AR
NIN
GS
HEIGHT AT AGE 33
FIG. 2.—LOG EARNINGS AND STATURE FOR MEN
34
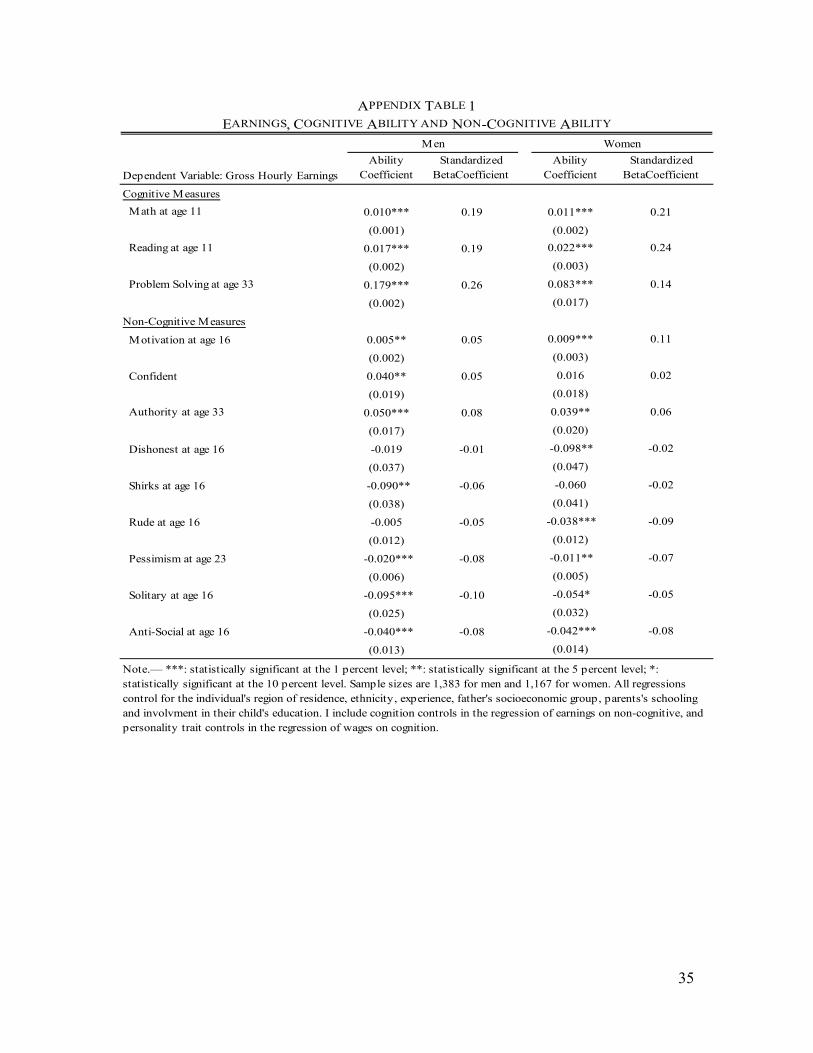
Appendix Wages and Ability
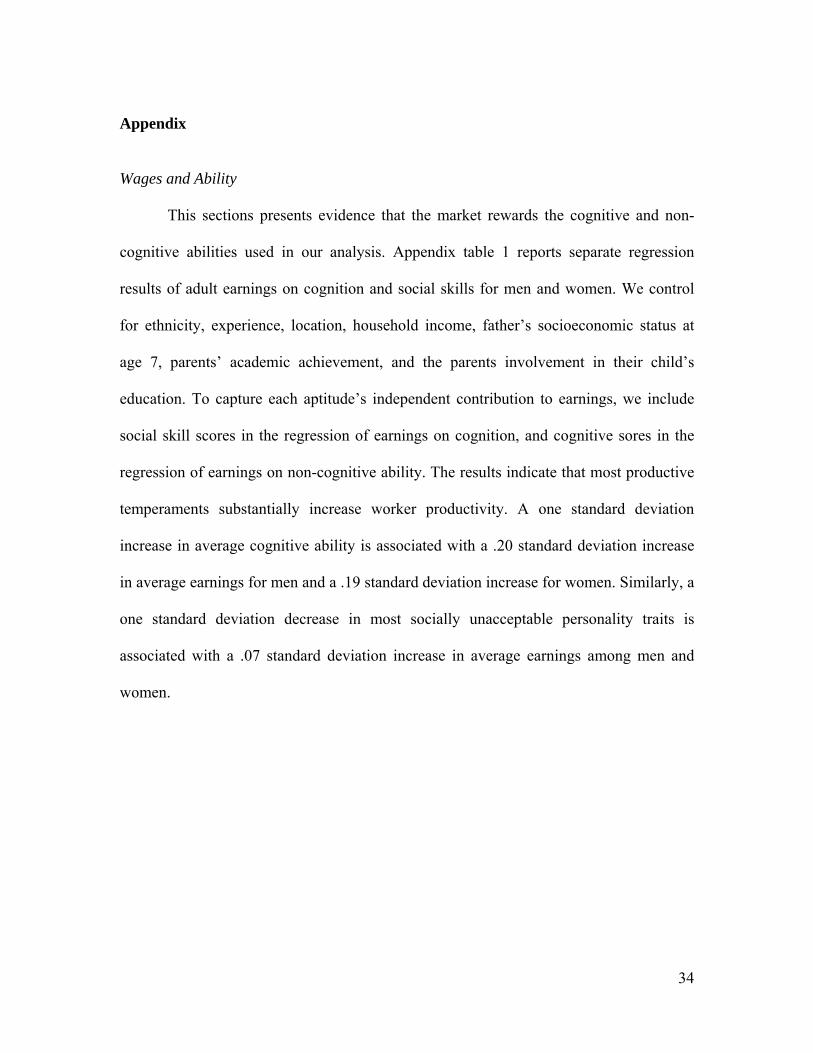
This sections presents evidence that the market rewards the cognitive and non-
cognitive abilities used in our analysis. Appendix table 1 reports separate regression
results of adult earnings on cognition and social skills for men and women. We control
for ethnicity, experience, location, household income, father’s socioeconomic status at
age 7, parents’ academic achievement, and the parents involvement in their child’s
education. To capture each aptitude’s independent contribution to earnings, we include
social skill scores in the regression of earnings on cognition, and cognitive sores in the
regression of earnings on non-cognitive ability. The results indicate that most productive
temperaments substantially increase worker productivity. A one standard deviation
increase in average cognitive ability is associated with a .20 standard deviation increase
in average earnings for men and a .19 standard deviation increase for women. Similarly, a
one standard deviation decrease in most socially unacceptable personality traits is
associated with a .07 standard deviation increase in average earnings among men and
women.
35
Dependent Variable: Gross Hourly Earnings
Ability Coefficient
Standardized BetaCoefficient
Ability Coefficient
Standardized BetaCoefficient
Cognitive Measures
Math at age 11 0.010*** 0.19 0.011*** 0.21
(0.001) (0.002)
Reading at age 11 0.017*** 0.19 0.022*** 0.24
(0.002) (0.003)
Problem Solving at age 33 0.179*** 0.26 0.083*** 0.14
(0.002) (0.017)
Non-Cognitive Measures
Motivation at age 16 0.005** 0.05 0.009*** 0.11
(0.002) (0.003)
Confident 0.040** 0.05 0.016 0.02
(0.019) (0.018)
Authority at age 33 0.050*** 0.08 0.039** 0.06
(0.017) (0.020)
Dishonest at age 16 -0.019 -0.01 -0.098** -0.02
(0.037) (0.047)
Shirks at age 16 -0.090** -0.06 -0.060 -0.02
(0.038) (0.041)
Rude at age 16 -0.005 -0.05 -0.038*** -0.09
(0.012) (0.012)
Pessimism at age 23 -0.020*** -0.08 -0.011** -0.07
(0.006) (0.005)
Solitary at age 16 -0.095*** -0.10 -0.054* -0.05
(0.025) (0.032)
Anti-Social at age 16 -0.040*** -0.08 -0.042*** -0.08
(0.013) (0.014)
APPENDIX TABLE 1EARNINGS, COGNITIVE ABILITY AND NON-COGNITIVE ABILITY
Note.— ***: statistically significant at the 1 percent level; **: statistically significant at the 5 percent level; *: statistically significant at the 10 percent level. Sample sizes are 1,383 for men and 1,167 for women. All regressions control for the individual's region of residence, ethnicity, experience, father's socioeconomic group, parents's schooling and involvment in their child's education. I include cognition controls in the regression of earnings on non-cognitive, and personality trait controls in the regression of wages on cognition.
Men Women