HEIDI DRYGAS - Alaska
18
Transcript of HEIDI DRYGAS - Alaska
HEIDI DRYGASCommissioner
Follow the Alaska Department of Labor and Workforce Developmenton Twi er (twi er.com/alaskalabor) and Facebook (facebook.com/alaskalabor).
Contact the offi ce of Commissioner Heidi Drygas at (907) 465-2700or [email protected].
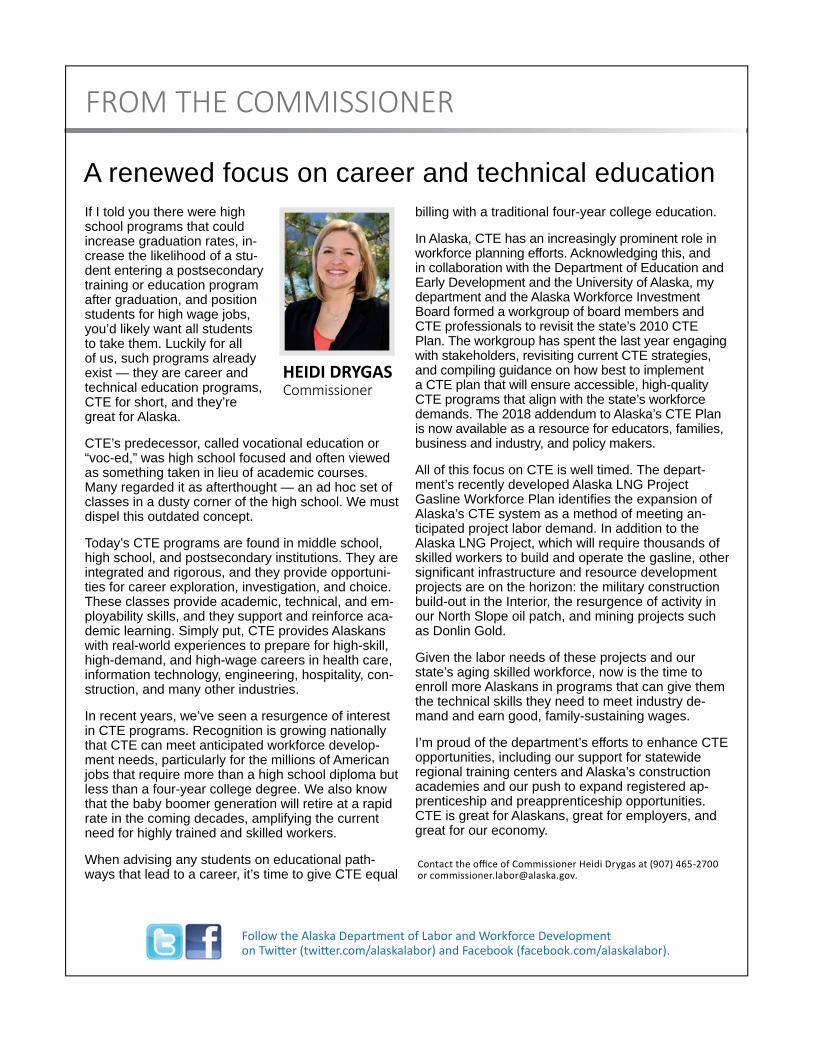
If I told you there were high school programs that could increase graduation rates, in-crease the likelihood of a stu-dent entering a postsecondary training or education program after graduation, and position students for high wage jobs, you’d likely want all students to take them. Luckily for all of us, such programs already exist — they are career and technical education programs, CTE for short, and they’re great for Alaska.
CTE’s predecessor, called vocational education or “voc-ed,” was high school focused and often viewed as something taken in lieu of academic courses. Many regarded it as afterthought — an ad hoc set of classes in a dusty corner of the high school. We must dispel this outdated concept.
Today’s CTE programs are found in middle school, high school, and postsecondary institutions. They are integrated and rigorous, and they provide opportuni-ties for career exploration, investigation, and choice. These classes provide academic, technical, and em-ployability skills, and they support and reinforce aca-demic learning. Simply put, CTE provides Alaskans with real-world experiences to prepare for high-skill, high-demand, and high-wage careers in health care, information technology, engineering, hospitality, con-struction, and many other industries.
In recent years, we’ve seen a resurgence of interest in CTE programs. Recognition is growing nationally that CTE can meet anticipated workforce develop-ment needs, particularly for the millions of American jobs that require more than a high school diploma but less than a four-year college degree. We also know that the baby boomer generation will retire at a rapid rate in the coming decades, amplifying the current need for highly trained and skilled workers.
When advising any students on educational path-ways that lead to a career, it’s time to give CTE equal
billing with a traditional four-year college education.
In Alaska, CTE has an increasingly prominent role in workforce planning efforts. Acknowledging this, and in collaboration with the Department of Education and Early Development and the University of Alaska, my department and the Alaska Workforce Investment Board formed a workgroup of board members and CTE professionals to revisit the state’s 2010 CTE Plan. The workgroup has spent the last year engaging with stakeholders, revisiting current CTE strategies, and compiling guidance on how best to implement a CTE plan that will ensure accessible, high-quality CTE programs that align with the state’s workforce demands. The 2018 addendum to Alaska’s CTE Plan is now available as a resource for educators, families, business and industry, and policy makers.
All of this focus on CTE is well timed. The depart-ment’s recently developed Alaska LNG Project Gasline Workforce Plan identifi es the expansion of Alaska’s CTE system as a method of meeting an-ticipated project labor demand. In addition to the Alaska LNG Project, which will require thousands of skilled workers to build and operate the gasline, other signifi cant infrastructure and resource development projects are on the horizon: the military construction build-out in the Interior, the resurgence of activity in our North Slope oil patch, and mining projects such as Donlin Gold.
Given the labor needs of these projects and our state’s aging skilled workforce, now is the time to enroll more Alaskans in programs that can give them the technical skills they need to meet industry de-mand and earn good, family-sustaining wages.
I’m proud of the department’s efforts to enhance CTE opportunities, including our support for statewide regional training centers and Alaska’s construction academies and our push to expand registered ap-prenticeship and preapprenticeship opportunities. CTE is great for Alaskans, great for employers, and great for our economy.
FROM THE COMMISSIONER
A renewed focus on career and technical education
NOVEMBER2018
Volume 38 Number 11ISSN 0160-3345
SAM DAPCEVICHCover Ar st
SARA WHITNEYEditor
Trends is a nonpar san, data-driven monthly magazine that covers a range of economic topics in Alaska.
This material is public informa on, and with appropriate credit it may be reproduced without permission. To sign up for a free electronic subscrip on, read past issues online, or purchase a print subscrip on, visit labor.alaska.gov/trends.
Chief, Researchand Analysis
onthly magazine that covers a range of economic topics in Alaska
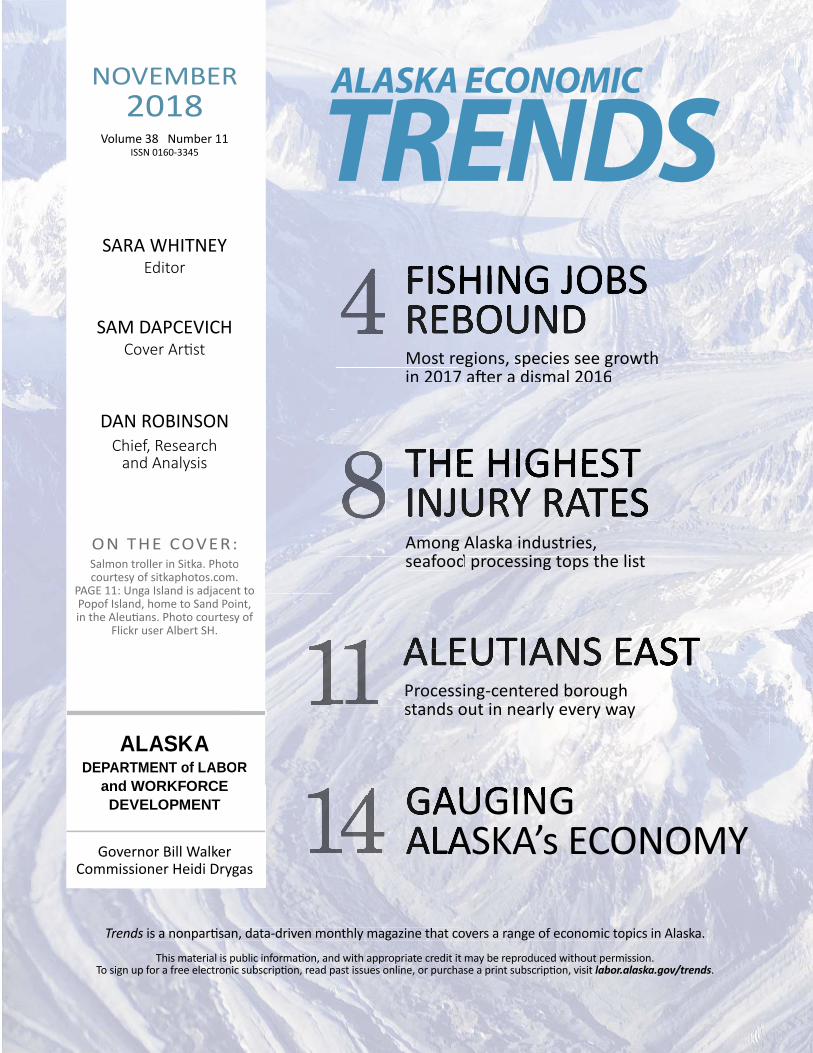
GAUGINGALASKA’s ECONOMYGovernor Bill Walker
Commissioner Heidi Drygas
DEPARTMENT of LABORand WORKFORCEDEVELOPMENT
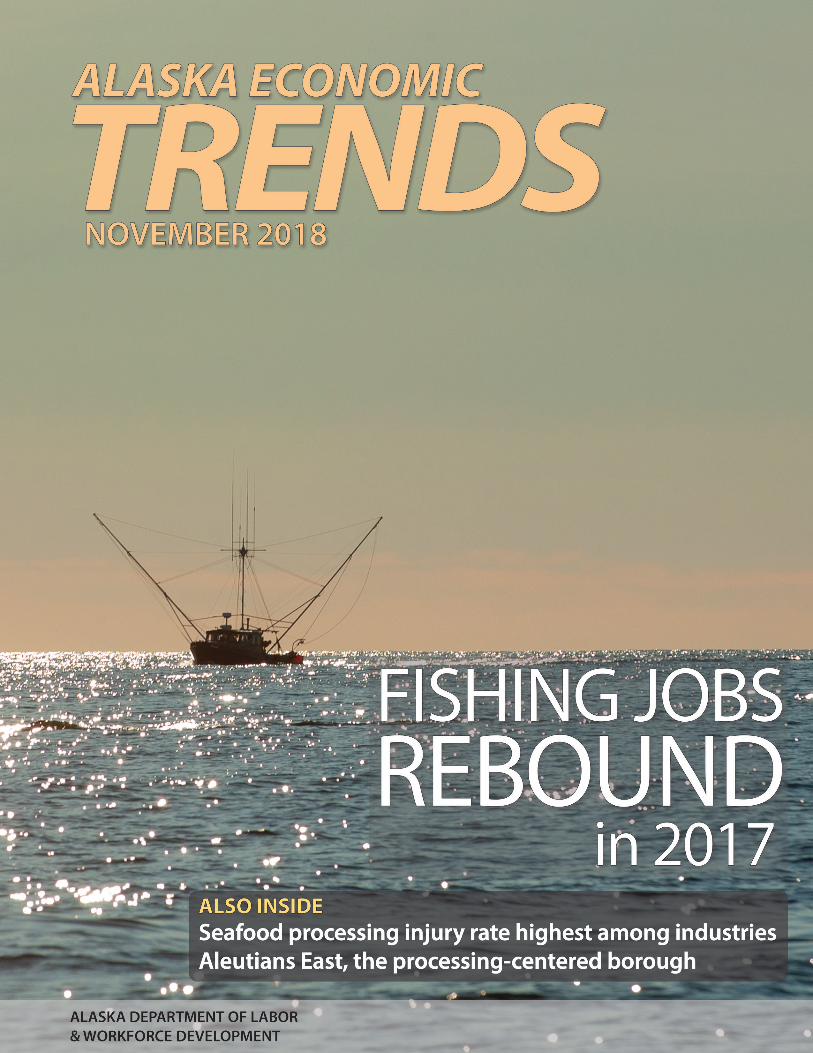
FISHING JOBSREBOUNDMost regions, species see growthin 2017 a er a dismal 2016
Salmon troller in Sitka. Photocourtesy of sitkaphotos.com.
PAGE 11: Unga Island is adjacent to Popof Island, home to Sand Point, in the Aleu ans. Photo courtesy of
Flickr user Albert SH.
ALASKA
Most re
n data driven moonthly magazine that c
gas
R
ON THE COVER:
DAN ROBINSON
7 a er a dismal 2016in 2017
THE HIGHESTINJURY RATESAmong Alaska industries,seafood processing tops the list
7 in 2017
AAmong f dd processing tops the listseafood
ALEUTIANS EASTProcessing-centered boroughstands out in nearly every way
o
t to nt,
y of
R
seafoo
PPPProcessssstandsssssttandsssstands
4 ALASKA ECONOMIC TRENDSNOVEMBER 2018
Most regions, species see growth in 2017 a er a dismal 2016
Fishing Jobs Rebound
By JOSH WARREN A Big Jump in 2017 1 A , 2001 2017
6,000
6,500
7,000
7,500
8,000
8,500
9,000
20012002
20032004
20052006
20072008
20092010
20112012
20132014
20152016
2017
Sources: Commercial Fisheries Entry Commission; Na onal Marine Fisheries Service; and Alaska Department of Labor and Workforce Development, Research and Analysis Sec on
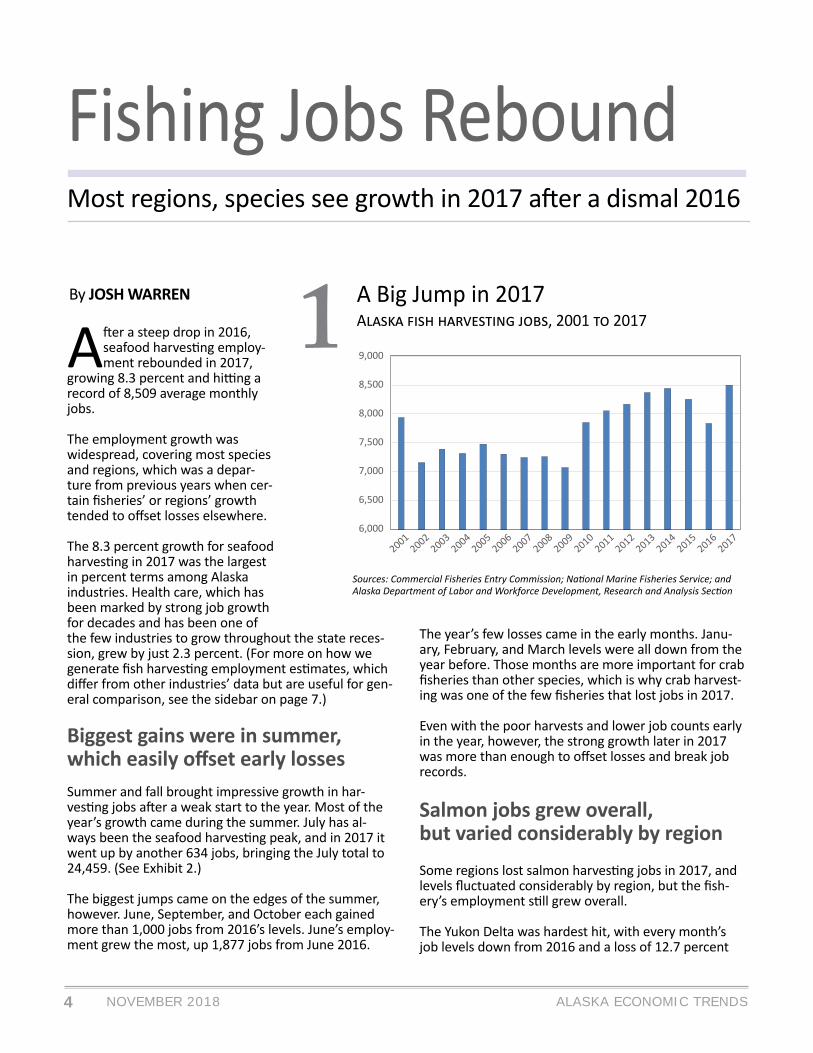
A er a steep drop in 2016, seafood harves ng employ-ment rebounded in 2017,
growing 8.3 percent and hi ng a record of 8,509 average monthly jobs.
The employment growth was widespread, covering most species and regions, which was a depar-ture from previous years when cer-tain fi sheries’ or regions’ growth tended to off set losses elsewhere.
The 8.3 percent growth for seafood harves ng in 2017 was the largest in percent terms among Alaska industries. Health care, which has been marked by strong job growth for decades and has been one of the few industries to grow throughout the state reces-sion, grew by just 2.3 percent. (For more on how we generate fi sh harves ng employment es mates, which diff er from other industries’ data but are useful for gen-eral comparison, see the sidebar on page 7.)
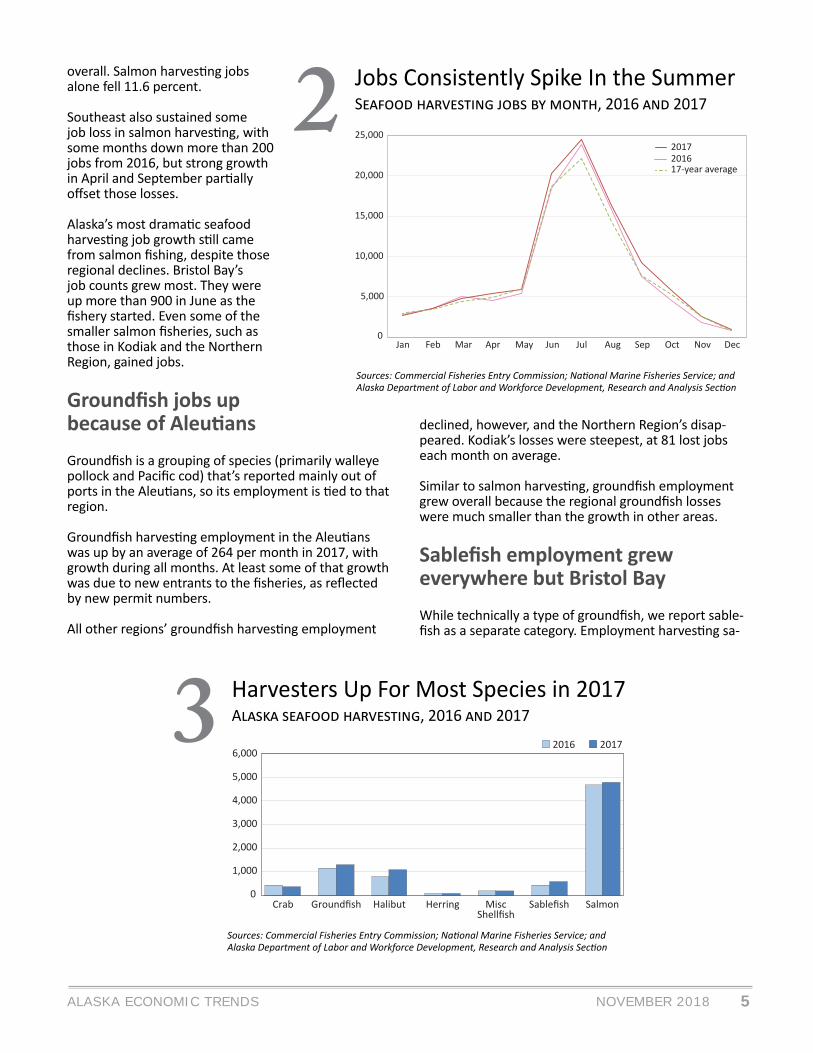
Biggest gains were in summer,which easily off set early lossesSummer and fall brought impressive growth in har-ves ng jobs a er a weak start to the year. Most of the year’s growth came during the summer. July has al-ways been the seafood harves ng peak, and in 2017 it went up by another 634 jobs, bringing the July total to 24,459. (See Exhibit 2.)
The biggest jumps came on the edges of the summer, however. June, September, and October each gained more than 1,000 jobs from 2016’s levels. June’s employ-ment grew the most, up 1,877 jobs from June 2016.
The year’s few losses came in the early months. Janu-ary, February, and March levels were all down from the year before. Those months are more important for crab fi sheries than other species, which is why crab harvest-ing was one of the few fi sheries that lost jobs in 2017.
Even with the poor harvests and lower job counts early in the year, however, the strong growth later in 2017 was more than enough to off set losses and break job records.
Salmon jobs grew overall,but varied considerably by regionSome regions lost salmon harves ng jobs in 2017, and levels fl uctuated considerably by region, but the fi sh-ery’s employment s ll grew overall.
The Yukon Delta was hardest hit, with every month’s job levels down from 2016 and a loss of 12.7 percent
5ALASKA ECONOMIC TRENDS NOVEMBER 2018
Jobs Consistently Spike In the Summer2 S , 2016 2017
Sources: Commercial Fisheries Entry Commission; Na onal Marine Fisheries Service; and Alaska Department of Labor and Workforce Development, Research and Analysis Sec on
0
5,000
10,000
15,000
20,000
25,000
Jan Feb Mar Apr May Jun Jul Aug Sep Oct Nov Dec
20162017
17-year average
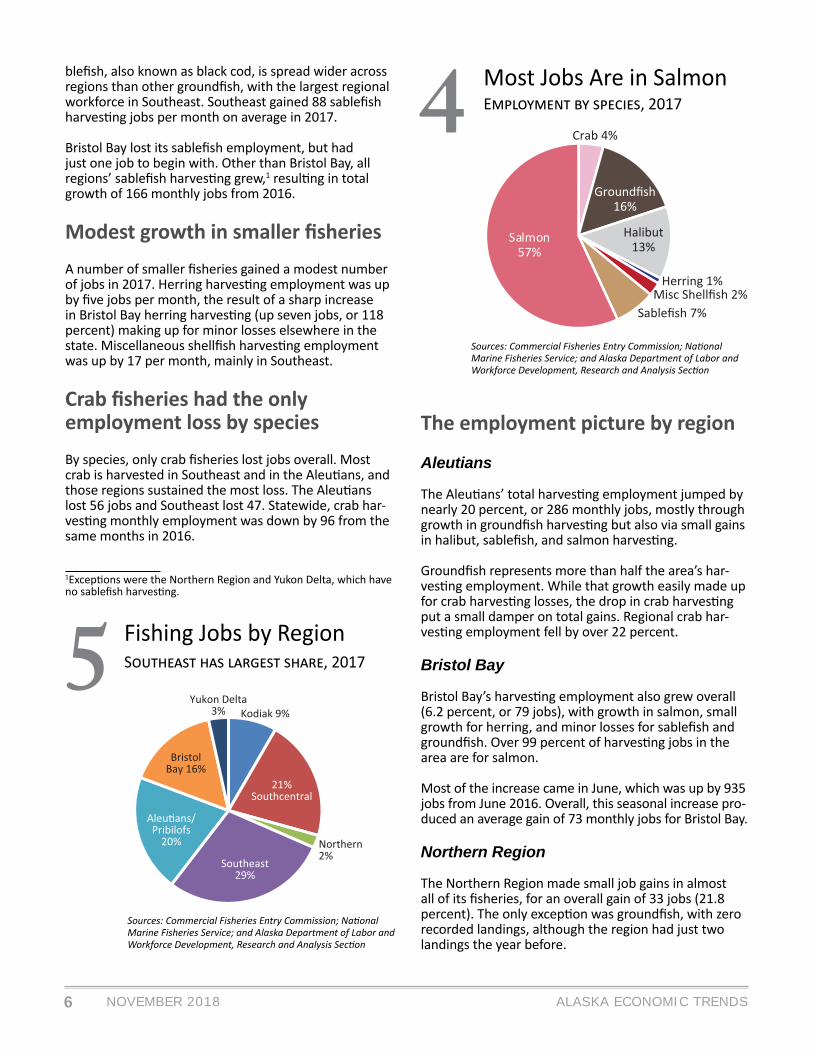
Harvesters Up For Most Species in 20173 A , 2016 2017
Sources: Commercial Fisheries Entry Commission; Na onal Marine Fisheries Service; and Alaska Department of Labor and Workforce Development, Research and Analysis Sec on
0
1,000
2,000
3,000
4,000
5,000
6,000
Crab Halibut Herring Salmon
2016 2017
overall. Salmon harves ng jobs alone fell 11.6 percent.
Southeast also sustained some job loss in salmon harves ng, with some months down more than 200 jobs from 2016, but strong growth in April and September par ally off set those losses.
Alaska’s most drama c seafood harves ng job growth s ll came from salmon fi shing, despite those regional declines. Bristol Bay’s job counts grew most. They were up more than 900 in June as the fi shery started. Even some of the smaller salmon fi sheries, such as those in Kodiak and the Northern Region, gained jobs.
Groundfi sh jobs upbecause of Aleu ansGroundfi sh is a grouping of species (primarily walleye pollock and Pacifi c cod) that’s reported mainly out of ports in the Aleu ans, so its employment is ed to that region.
Groundfi sh harves ng employment in the Aleu ans was up by an average of 264 per month in 2017, with growth during all months. At least some of that growth was due to new entrants to the fi sheries, as refl ected by new permit numbers.
All other regions’ groundfi sh harves ng employment
declined, however, and the Northern Region’s disap-peared. Kodiak’s losses were steepest, at 81 lost jobs each month on average.
Similar to salmon harves ng, groundfi sh employment grew overall because the regional groundfi sh losses were much smaller than the growth in other areas.
Sablefi sh employment greweverywhere but Bristol BayWhile technically a type of groundfi sh, we report sable-fi sh as a separate category. Employment harves ng sa-
6 ALASKA ECONOMIC TRENDSNOVEMBER 2018
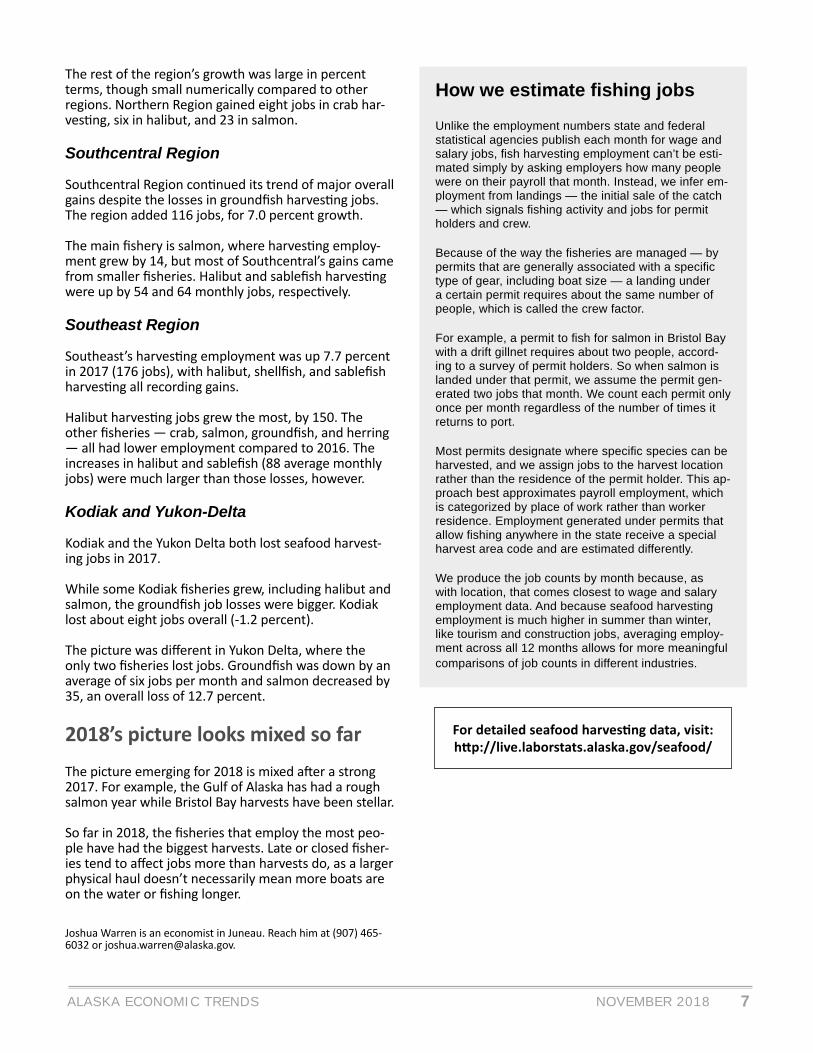
Most Jobs Are in Salmon4 E , 2017
Sources: Commercial Fisheries Entry Commission; Na onal Marine Fisheries Service; and Alaska Department of Labor and Workforce Development, Research and Analysis Sec on
Salmon57%
16%
Halibut13%
Herring 1%
Crab 4%
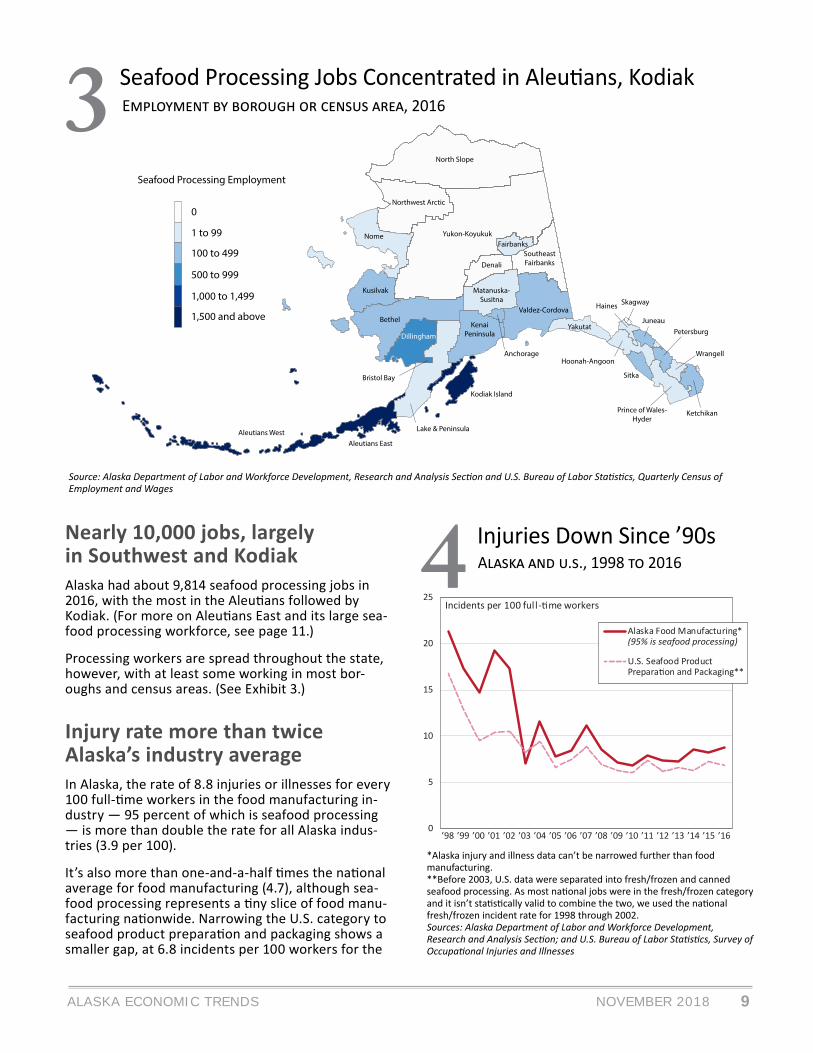
Fishing Jobs by Region5 S , 2017
Sources: Commercial Fisheries Entry Commission; Na onal Marine Fisheries Service; and Alaska Department of Labor and Workforce Development, Research and Analysis Sec on
20%
Bay 16%
3% Kodiak 9%
21%
2%
29%
blefi sh, also known as black cod, is spread wider across regions than other groundfi sh, with the largest regional workforce in Southeast. Southeast gained 88 sablefi sh harves ng jobs per month on average in 2017.
Bristol Bay lost its sablefi sh employment, but had just one job to begin with. Other than Bristol Bay, all regions’ sablefi sh harves ng grew,1 resul ng in total growth of 166 monthly jobs from 2016.
Modest growth in smaller fi sheriesA number of smaller fi sheries gained a modest number of jobs in 2017. Herring harves ng employment was up by fi ve jobs per month, the result of a sharp increase in Bristol Bay herring harves ng (up seven jobs, or 118 percent) making up for minor losses elsewhere in the state. Miscellaneous shellfi sh harves ng employment was up by 17 per month, mainly in Southeast.
Crab fi sheries had the onlyemployment loss by speciesBy species, only crab fi sheries lost jobs overall. Most crab is harvested in Southeast and in the Aleu ans, and those regions sustained the most loss. The Aleu ans lost 56 jobs and Southeast lost 47. Statewide, crab har-ves ng monthly employment was down by 96 from the same months in 2016.
1Excep ons were the Northern Region and Yukon Delta, which have no sablefi sh harves ng.
The employment picture by region
Aleutians
The Aleu ans’ total harves ng employment jumped by nearly 20 percent, or 286 monthly jobs, mostly through growth in groundfi sh harves ng but also via small gains in halibut, sablefi sh, and salmon harves ng.
Groundfi sh represents more than half the area’s har-ves ng employment. While that growth easily made up for crab harves ng losses, the drop in crab harves ng put a small damper on total gains. Regional crab har-ves ng employment fell by over 22 percent.
Bristol Bay
Bristol Bay’s harves ng employment also grew overall (6.2 percent, or 79 jobs), with growth in salmon, small growth for herring, and minor losses for sablefi sh and groundfi sh. Over 99 percent of harves ng jobs in the area are for salmon.
Most of the increase came in June, which was up by 935 jobs from June 2016. Overall, this seasonal increase pro-duced an average gain of 73 monthly jobs for Bristol Bay.
Northern Region
The Northern Region made small job gains in almost all of its fi sheries, for an overall gain of 33 jobs (21.8 percent). The only excep on was groundfi sh, with zero recorded landings, although the region had just two landings the year before.
7ALASKA ECONOMIC TRENDS NOVEMBER 2018
How we estimate fi shing jobs
Unlike the employment numbers state and federal statistical agencies publish each month for wage and salary jobs, fi sh harvesting employment can’t be esti-mated simply by asking employers how many people were on their payroll that month. Instead, we infer em-ployment from landings — the initial sale of the catch — which signals fi shing activity and jobs for permit holders and crew.
Because of the way the fi sheries are managed — by permits that are generally associated with a specifi c type of gear, including boat size — a landing under a certain permit requires about the same number of people, which is called the crew factor.
For example, a permit to fi sh for salmon in Bristol Bay with a drift gillnet requires about two people, accord-ing to a survey of permit holders. So when salmon is landed under that permit, we assume the permit gen-erated two jobs that month. We count each permit only once per month regardless of the number of times it returns to port.
Most permits designate where specifi c species can be harvested, and we assign jobs to the harvest location rather than the residence of the permit holder. This ap-proach best approximates payroll employment, which is categorized by place of work rather than worker residence. Employment generated under permits that allow fi shing anywhere in the state receive a special harvest area code and are estimated differently.
We produce the job counts by month because, as with location, that comes closest to wage and salary employment data. And because seafood harvesting employment is much higher in summer than winter, like tourism and construction jobs, averaging employ-ment across all 12 months allows for more meaningful comparisons of job counts in different industries.
The rest of the region’s growth was large in percent terms, though small numerically compared to other regions. Northern Region gained eight jobs in crab har-ves ng, six in halibut, and 23 in salmon.
Southcentral Region
Southcentral Region con nued its trend of major overall gains despite the losses in groundfi sh harves ng jobs. The region added 116 jobs, for 7.0 percent growth.
The main fi shery is salmon, where harves ng employ-ment grew by 14, but most of Southcentral’s gains came from smaller fi sheries. Halibut and sablefi sh harves ng were up by 54 and 64 monthly jobs, respec vely.
Southeast Region
Southeast’s harves ng employment was up 7.7 percent in 2017 (176 jobs), with halibut, shellfi sh, and sablefi sh harves ng all recording gains.
Halibut harves ng jobs grew the most, by 150. The other fi sheries — crab, salmon, groundfi sh, and herring — all had lower employment compared to 2016. The increases in halibut and sablefi sh (88 average monthly jobs) were much larger than those losses, however.
Kodiak and Yukon-Delta
Kodiak and the Yukon Delta both lost seafood harvest-ing jobs in 2017.
While some Kodiak fi sheries grew, including halibut and salmon, the groundfi sh job losses were bigger. Kodiak lost about eight jobs overall (-1.2 percent).
The picture was diff erent in Yukon Delta, where the only two fi sheries lost jobs. Groundfi sh was down by an average of six jobs per month and salmon decreased by 35, an overall loss of 12.7 percent.
2018’s picture looks mixed so farThe picture emerging for 2018 is mixed a er a strong 2017. For example, the Gulf of Alaska has had a rough salmon year while Bristol Bay harvests have been stellar.
So far in 2018, the fi sheries that employ the most peo-ple have had the biggest harvests. Late or closed fi sher-ies tend to aff ect jobs more than harvests do, as a larger physical haul doesn’t necessarily mean more boats are on the water or fi shing longer.
Joshua Warren is an economist in Juneau. Reach him at (907) 465-6032 or [email protected].
For detailed seafood harves ng data, visit: h p://live.laborstats.alaska.gov/seafood/

8 ALASKA ECONOMIC TRENDSNOVEMBER 2018
Among Alaska industries, seafood processing tops the list
The Highest Injury Rates
By KOLE KOSKI
Commercial fi shing in Alaska has long been known as dangerous work, thanks in
part to popular reality TV shows such as The Deadliest Catch. The hazards of processing the catch are less well known, but seafood processing has the highest injury and illness rate of any Alaska industry, among those the U.S. Bureau of Labor Sta s cs tracks.1 (See Exhibit 1.)
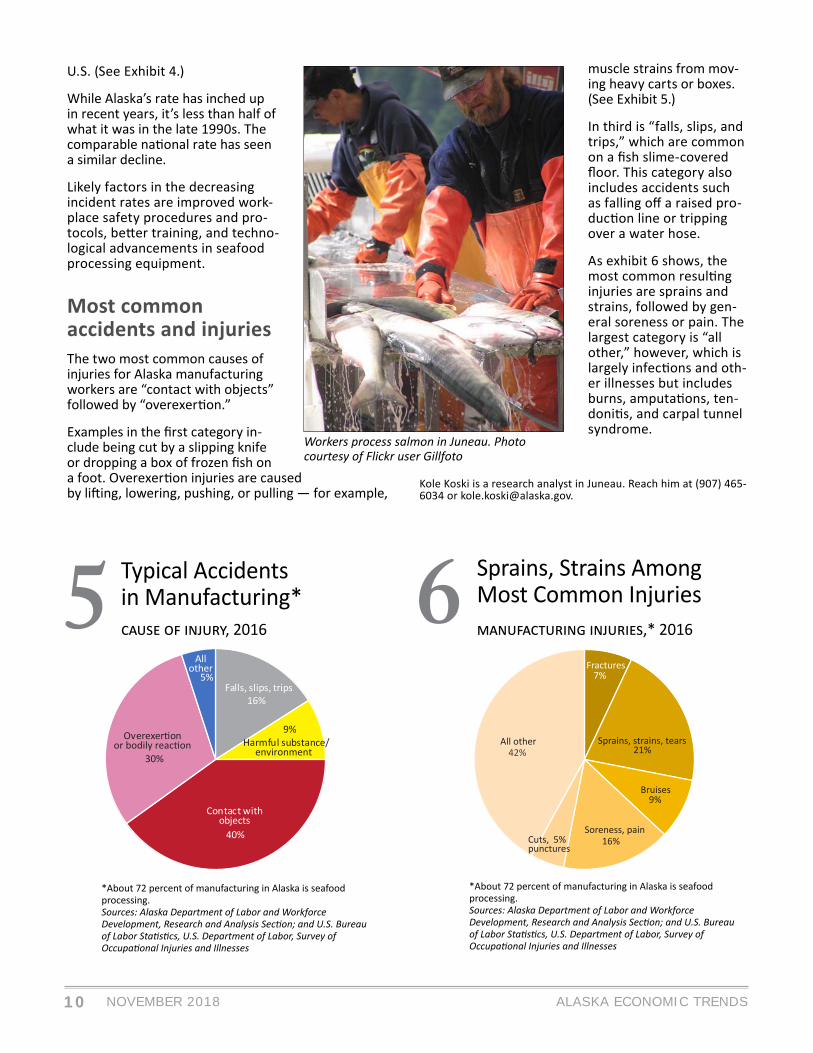
Processing workers are o en on the “slime line,” where they cut or fi let fi sh as it moves down an assembly line. Other common tasks include loading and unload-ing seafood into totes, stack-ing and moving the products in freezers, and packing and loading seafood into boxes and preparing them for shipment.
Like their harves ng counter-parts, seafood processors face some of the harshest working condi ons in the state: a con-stantly wet and slick work area, cold temperatures, knives and other sharp objects, forkli s and freight hauling equipment, and processing machinery with sharp blades and pinching gear mecha-nisms — all opera ng quickly and in a busy environment. They also work long hours during fi shing season — some mes 14 to 16 hours a day, seven days a week. 1BLS doesn’t track illness and injury rates for commercial fi shing.
Injury Rate Highest in Seafood Processing1 I 100 , 2016
*Alaska injury and illness data can’t be narrowed further than food manufacturing. See Exhibit 2 below.Sources: Alaska Department of Labor and Workforce Development, Research and Analysis Sec on; and U.S. Bureau of Labor Sta s cs, Survey of Occupa onal Injuries and Illnesses
3.91.2
3.98.8
4.01.91.9
2.24.8
3.02.9
5.3
All industries
Natural resources and mining
Food manufacturing*(95% is seafood processing)
Finance, insurance, and real estateProfessional and business services
State and local government
Alaska Food Manufacturing Mostly Seafood Processing2 E , 2016
Seafood product
95%Bakeries 3%Other food 1%
Source: Alaska Department of Labor and Workforce Development, Research and Analysis Sec on and U.S. Bureau of Labor Sta s cs, Quarterly Census of Employment and Wages
9ALASKA ECONOMIC TRENDS NOVEMBER 2018
Nearly 10,000 jobs, largelyin Southwest and KodiakAlaska had about 9,814 seafood processing jobs in 2016, with the most in the Aleu ans followed by Kodiak. (For more on Aleu ans East and its large sea-food processing workforce, see page 11.)
Processing workers are spread throughout the state, however, with at least some working in most bor-oughs and census areas. (See Exhibit 3.)
Injury rate more than twiceAlaska’s industry averageIn Alaska, the rate of 8.8 injuries or illnesses for every 100 full- me workers in the food manufacturing in-dustry — 95 percent of which is seafood processing — is more than double the rate for all Alaska indus-tries (3.9 per 100).
It’s also more than one-and-a-half mes the na onal average for food manufacturing (4.7), although sea-food processing represents a ny slice of food manu-facturing na onwide. Narrowing the U.S. category to seafood product prepara on and packaging shows a smaller gap, at 6.8 incidents per 100 workers for the
Injuries Down Since ’90s4 A . ., 1998 2016
*Alaska injury and illness data can’t be narrowed further than food manufacturing. **Before 2003, U.S. data were separated into fresh/frozen and canned seafood processing. As most na onal jobs were in the fresh/frozen category and it isn’t sta s cally valid to combine the two, we used the na onal fresh/frozen incident rate for 1998 through 2002.Sources: Alaska Department of Labor and Workforce Development, Research and Analysis Sec on; and U.S. Bureau of Labor Sta s cs, Survey of Occupa onal Injuries and Illnesses
0
5
10
15
20
25
’98 ’99 ’00 ’01 ’02 ’03 ’04 ’05 ’06 ’07 ’08 ’09 ’10 ’11 ’12 ’13 ’14 ’15 ’16
Incidents per 100 full- me workers
Alaska Food Manufacturing*(95% is seafood processing)
U.S. Seafood ProductPrepara on and Packaging**
Seafood Processing Jobs Concentrated in Aleu ans, Kodiak3 E , 2016
Seafood Processing Employment
1 to 99
0
100 to 499
500 to 999
1,000 to 1,499
1,500 and above
KetchikanPrince of Wales-Hyder
Sitka
Wrangell
Petersburg
SkagwayHaines
Juneau
Hoonah-Angoon
Yakutat
Anchorage
KenaiPeninsula
Matanuska-Susitna
Denali
FairbanksSoutheastFairbanks
Valdez-Cordova
Kodiak Island
Lake & Peninsula
Aleutians EastAleutians West
Dillingham
Bristol Bay
Bethel
Kusilvak
Nome
Northwest Arctic
North Slope
Yukon-Koyukuk
Source: Alaska Department of Labor and Workforce Development, Research and Analysis Sec on and U.S. Bureau of Labor Sta s cs, Quarterly Census of Employment and Wages
10 ALASKA ECONOMIC TRENDSNOVEMBER 2018
U.S. (See Exhibit 4.)
While Alaska’s rate has inched up in recent years, it’s less than half of what it was in the late 1990s. The comparable na onal rate has seen a similar decline.
Likely factors in the decreasing incident rates are improved work-place safety procedures and pro-tocols, be er training, and techno-logical advancements in seafood processing equipment.
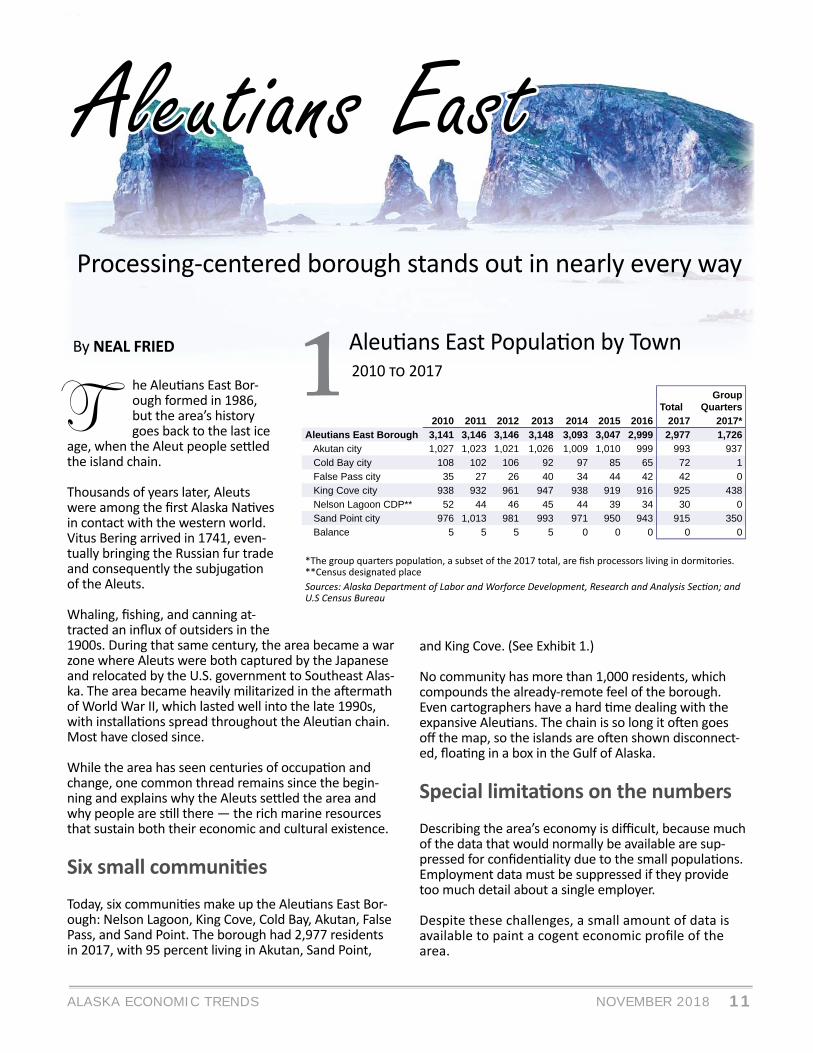
Most commonaccidents and injuriesThe two most common causes of injuries for Alaska manufacturing workers are “contact with objects” followed by “overexer on.”
Examples in the fi rst category in-clude being cut by a slipping knife or dropping a box of frozen fi sh on a foot. Overexer on injuries are caused by li ing, lowering, pushing, or pulling — for example,
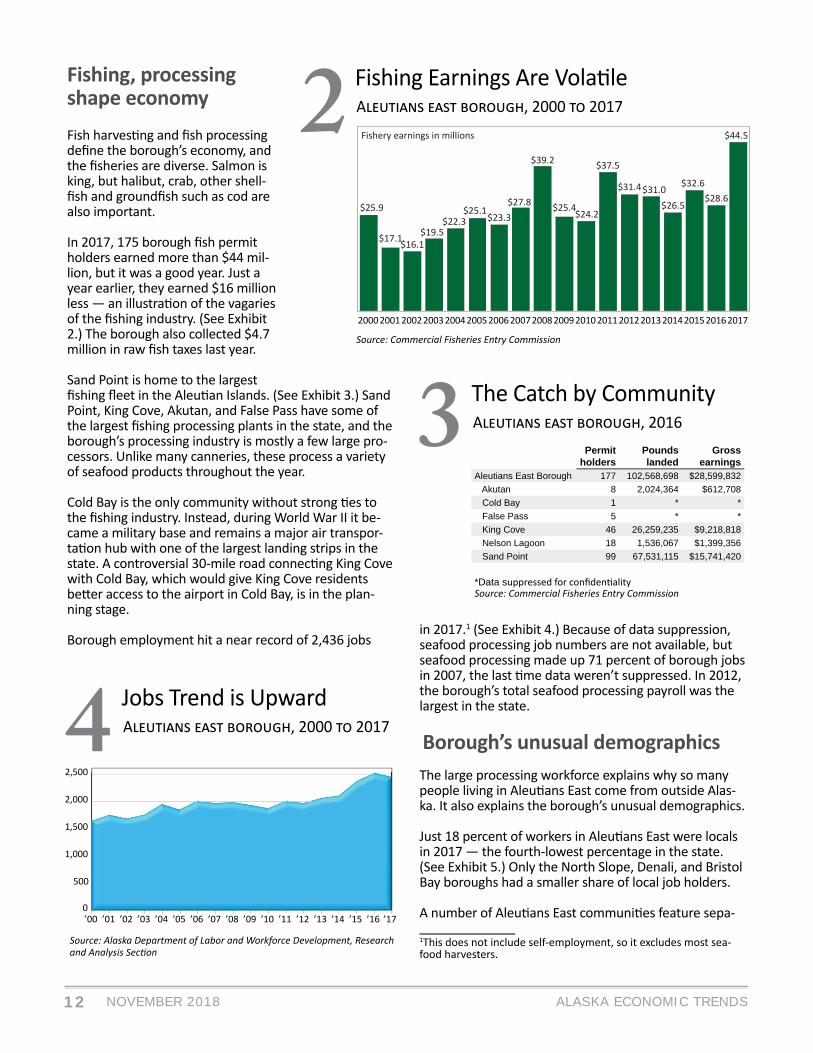
Sprains, Strains AmongMost Common Injuries6
,* 2016
Typical Accidentsin Manufacturing*5 , 2016
*About 72 percent of manufacturing in Alaska is seafood processing. Sources: Alaska Department of Labor and Workforce Development, Research and Analysis Sec on; and U.S. Bureau of Labor Sta s cs, U.S. Department of Labor, Survey of Occupa onal Injuries and Illnesses
5%
Contact withobjects
40%
9%Harmful substance/ environment30%
Overexer on
16%Falls, slips, trips
Allother
*About 72 percent of manufacturing in Alaska is seafood processing.Sources: Alaska Department of Labor and Workforce Development, Research and Analysis Sec on; and U.S. Bureau of Labor Sta s cs, U.S. Department of Labor, Survey of Occupa onal Injuries and Illnesses
Workers process salmon in Juneau. Photo courtesy of Flickr user Gillfoto
muscle strains from mov-ing heavy carts or boxes. (See Exhibit 5.)
In third is “falls, slips, and trips,” which are common on a fi sh slime-covered fl oor. This category also includes accidents such as falling off a raised pro-duc on line or tripping over a water hose.
As exhibit 6 shows, the most common resul ng injuries are sprains and strains, followed by gen-eral soreness or pain. The largest category is “all other,” however, which is largely infec ons and oth-er illnesses but includes burns, amputa ons, ten-doni s, and carpal tunnel syndrome.
Kole Koski is a research analyst in Juneau. Reach him at (907) 465-6034 or [email protected].
Sprains, Strains, Tears
7%
21%
9%
16%5%
42%Sprains, strains, tearsAll other
Cuts,punctures
Fractures
Soreness, pain
Bruises
11ALASKA ECONOMIC TRENDS NOVEMBER 2018
Processing-centered borough stands out in nearly every way
By NEAL FRIED Aleu ans East Popula on by Town1 2010 2017
TotalGroup
Quarters2010 2011 2012 2013 2014 2015 2016 2017 2017*
Aleutians East Borough 3,141 3,146 3,146 3,148 3,093 3,047 2,999 2,977 1,726 Akutan city 1,027 1,023 1,021 1,026 1,009 1,010 999 993 937 Cold Bay city 108 102 106 92 97 85 65 72 1 False Pass city 35 27 26 40 34 44 42 42 0 King Cove city 938 932 961 947 938 919 916 925 438 Nelson Lagoon CDP** 52 44 46 45 44 39 34 30 0 Sand Point city 976 1,013 981 993 971 950 943 915 350 Balance 5 5 5 5 0 0 0 0 0
*The group quarters popula on, a subset of the 2017 total, are fi sh processors living in dormitories. **Census designated placeSources: Alaska Department of Labor and Worforce Development, Research and Analysis Sec on; and U.S Census Bureau
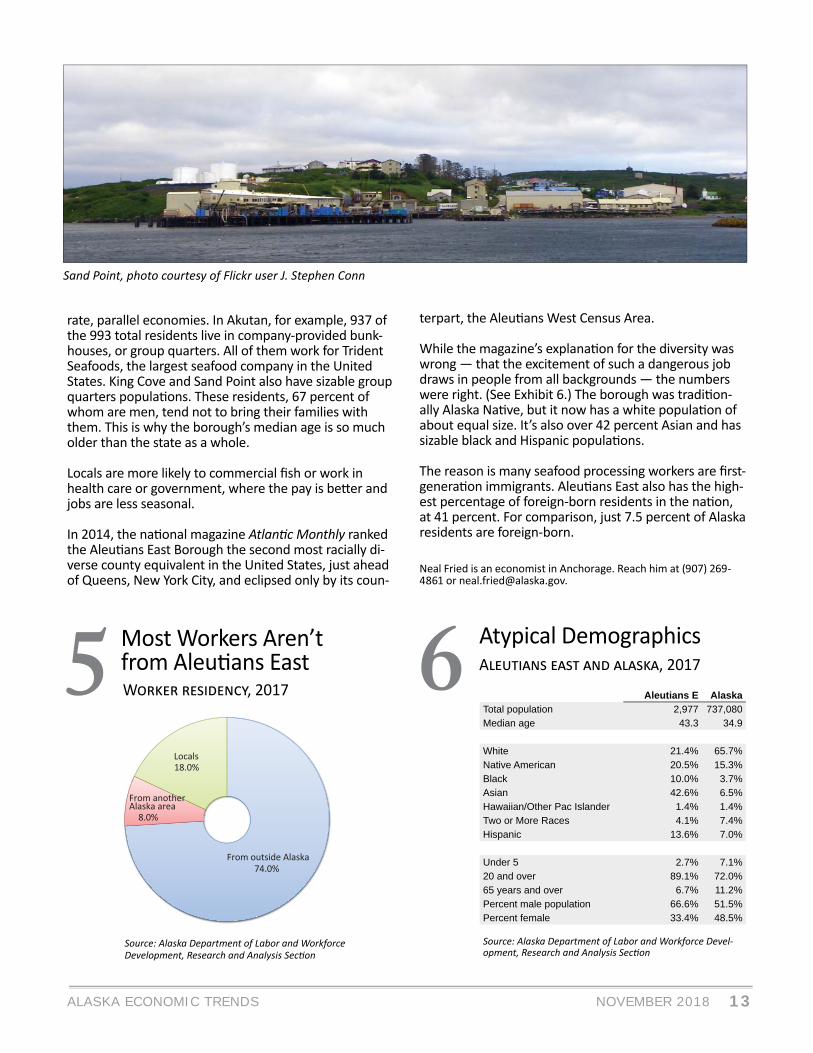
he Aleu ans East Bor-ough formed in 1986, but the area’s history goes back to the last ice
age, when the Aleut people se led the island chain.
Thousands of years later, Aleuts were among the fi rst Alaska Na ves in contact with the western world. Vitus Bering arrived in 1741, even-tually bringing the Russian fur trade and consequently the subjuga on of the Aleuts.
Whaling, fi shing, and canning at-tracted an infl ux of outsiders in the 1900s. During that same century, the area became a war zone where Aleuts were both captured by the Japanese and relocated by the U.S. government to Southeast Alas-ka. The area became heavily militarized in the a ermath of World War II, which lasted well into the late 1990s, with installa ons spread throughout the Aleu an chain. Most have closed since.
While the area has seen centuries of occupa on and change, one common thread remains since the begin-ning and explains why the Aleuts se led the area and why people are s ll there — the rich marine resources that sustain both their economic and cultural existence.
Six small communi esToday, six communi es make up the Aleu ans East Bor-ough: Nelson Lagoon, King Cove, Cold Bay, Akutan, False Pass, and Sand Point. The borough had 2,977 residents in 2017, with 95 percent living in Akutan, Sand Point,
and King Cove. (See Exhibit 1.)
No community has more than 1,000 residents, which compounds the already-remote feel of the borough. Even cartographers have a hard me dealing with the expansive Aleu ans. The chain is so long it o en goes off the map, so the islands are o en shown disconnect-ed, fl oa ng in a box in the Gulf of Alaska.
Special limita ons on the numbersDescribing the area’s economy is diffi cult, because much of the data that would normally be available are sup-pressed for confi den ality due to the small popula ons. Employment data must be suppressed if they provide too much detail about a single employer.
Despite these challenges, a small amount of data is available to paint a cogent economic profi le of the area.
Aleutians EastAleutians East
T
12 ALASKA ECONOMIC TRENDSNOVEMBER 2018
The Catch by Community3 A , 2016Permit
holdersPounds landed
Gross earnings
Aleutians East Borough 177 102,568,698 $28,599,832 Akutan 8 2,024,364 $612,708 Cold Bay 1 * * False Pass 5 * * King Cove 46 26,259,235 $9,218,818 Nelson Lagoon 18 1,536,067 $1,399,356 Sand Point 99 67,531,115 $15,741,420
*Data suppressed for confi den ality Source: Commercial Fisheries Entry Commission
Jobs Trend is Upward4 A , 2000 2017
Source: Alaska Department of Labor and Workforce Development, Research and Analysis Sec on
0
500
1,000
1,500
2,000
2,500
’00 ’01 ’02 ’03 ’04 ’05 ’06 ’07 ’08 ’09 ’10 ’11 ’12 ’13 ’14 ’15 ’16 ’17
Fishing Earnings Are Vola le2 A , 2000 2017Fishery earnings in millions
$17.1$16.1$19.5
$22.3$25.1
$23.3$27.8
$39.2
$25.4$24.2
$37.5
$31.4$31.0$26.5
$32.6$28.6
$44.5
200020012002200320042005200620072008200920102011201220132014201520162017
$25.9
Source: Commercial Fisheries Entry Commission
Fishing, processing shape economyFish harves ng and fi sh processing defi ne the borough’s economy, and the fi sheries are diverse. Salmon is king, but halibut, crab, other shell-fi sh and groundfi sh such as cod are also important.
In 2017, 175 borough fi sh permit holders earned more than $44 mil-lion, but it was a good year. Just a year earlier, they earned $16 million less — an illustra on of the vagaries of the fi shing industry. (See Exhibit 2.) The borough also collected $4.7 million in raw fi sh taxes last year.
Sand Point is home to the largest fi shing fl eet in the Aleu an Islands. (See Exhibit 3.) Sand Point, King Cove, Akutan, and False Pass have some of the largest fi shing processing plants in the state, and the borough’s processing industry is mostly a few large pro-cessors. Unlike many canneries, these process a variety of seafood products throughout the year.
Cold Bay is the only community without strong es to the fi shing industry. Instead, during World War II it be-came a military base and remains a major air transpor-ta on hub with one of the largest landing strips in the state. A controversial 30-mile road connec ng King Cove with Cold Bay, which would give King Cove residents be er access to the airport in Cold Bay, is in the plan-ning stage.
Borough employment hit a near record of 2,436 jobs in 2017.1 (See Exhibit 4.) Because of data suppression, seafood processing job numbers are not available, but seafood processing made up 71 percent of borough jobs in 2007, the last me data weren’t suppressed. In 2012, the borough’s total seafood processing payroll was the largest in the state.
Borough’s unusual demographicsThe large processing workforce explains why so many people living in Aleu ans East come from outside Alas-ka. It also explains the borough’s unusual demographics.
Just 18 percent of workers in Aleu ans East were locals in 2017 — the fourth-lowest percentage in the state. (See Exhibit 5.) Only the North Slope, Denali, and Bristol Bay boroughs had a smaller share of local job holders.
A number of Aleu ans East communi es feature sepa-
1This does not include self-employment, so it excludes most sea-food harvesters.
13ALASKA ECONOMIC TRENDS NOVEMBER 2018
Most Workers Aren’tfrom Aleu ans East5 W , 2017
Source: Alaska Department of Labor and Workforce Development, Research and Analysis Sec on
18.0%
From anotherAlaska area
8.0%
From outside Alaska74.0%
Locals
Atypical Demographics6 A , 2017
Aleutians E AlaskaTotal population 2,977 737,080Median age 43.3 34.9
White 21.4% 65.7%Native American 20.5% 15.3%Black 10.0% 3.7%Asian 42.6% 6.5%Hawaiian/Other Pac Islander 1.4% 1.4%Two or More Races 4.1% 7.4%Hispanic 13.6% 7.0% Under 5 2.7% 7.1%20 and over 89.1% 72.0%65 years and over 6.7% 11.2%Percent male population 66.6% 51.5%Percent female 33.4% 48.5%
Source: Alaska Department of Labor and Workforce Devel-opment, Research and Analysis Sec on
rate, parallel economies. In Akutan, for example, 937 of the 993 total residents live in company-provided bunk-houses, or group quarters. All of them work for Trident Seafoods, the largest seafood company in the United States. King Cove and Sand Point also have sizable group quarters popula ons. These residents, 67 percent of whom are men, tend not to bring their families with them. This is why the borough’s median age is so much older than the state as a whole.
Locals are more likely to commercial fi sh or work in health care or government, where the pay is be er and jobs are less seasonal.
In 2014, the na onal magazine Atlan c Monthly ranked the Aleu ans East Borough the second most racially di-verse county equivalent in the United States, just ahead of Queens, New York City, and eclipsed only by its coun-
Sand Point, photo courtesy of Flickr user J. Stephen Conn
terpart, the Aleu ans West Census Area.
While the magazine’s explana on for the diversity was wrong — that the excitement of such a dangerous job draws in people from all backgrounds — the numbers were right. (See Exhibit 6.) The borough was tradi on-ally Alaska Na ve, but it now has a white popula on of about equal size. It’s also over 42 percent Asian and has sizable black and Hispanic popula ons.
The reason is many seafood processing workers are fi rst-genera on immigrants. Aleu ans East also has the high-est percentage of foreign-born residents in the na on, at 41 percent. For comparison, just 7.5 percent of Alaska residents are foreign-born.
Neal Fried is an economist in Anchorage. Reach him at (907) 269-4861 or [email protected].
14 ALASKA ECONOMIC TRENDSNOVEMBER 2018
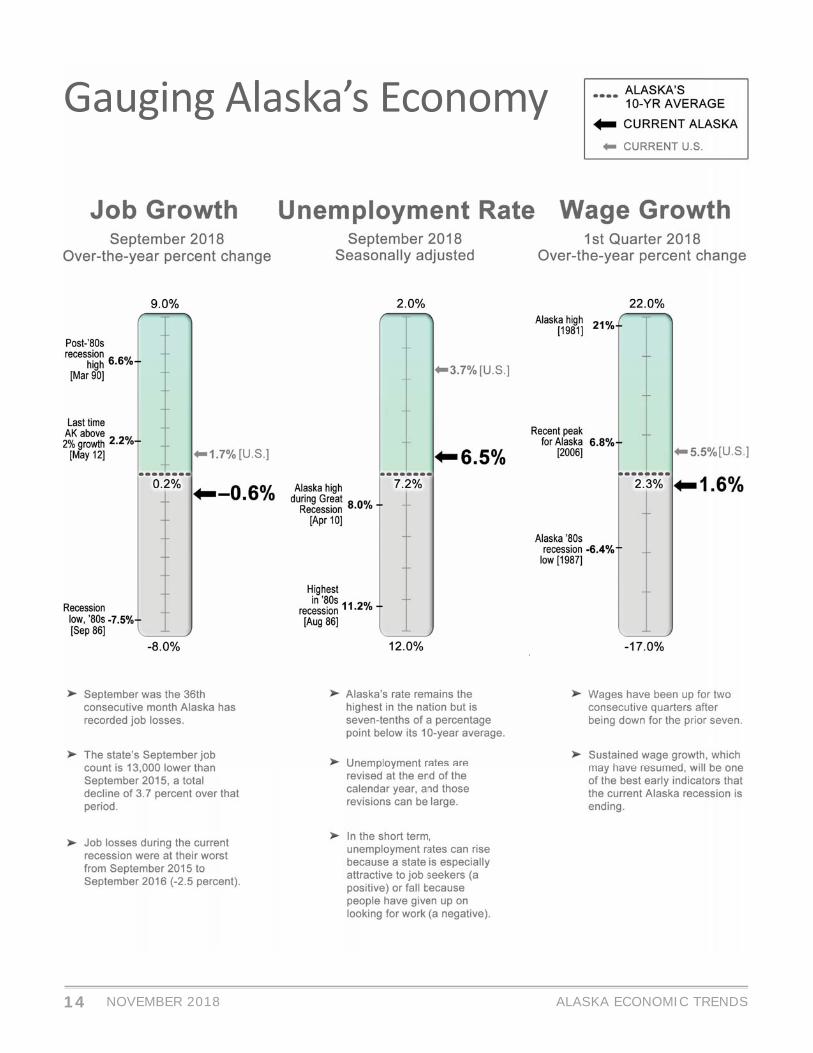
Gauging Alaska’s Economy
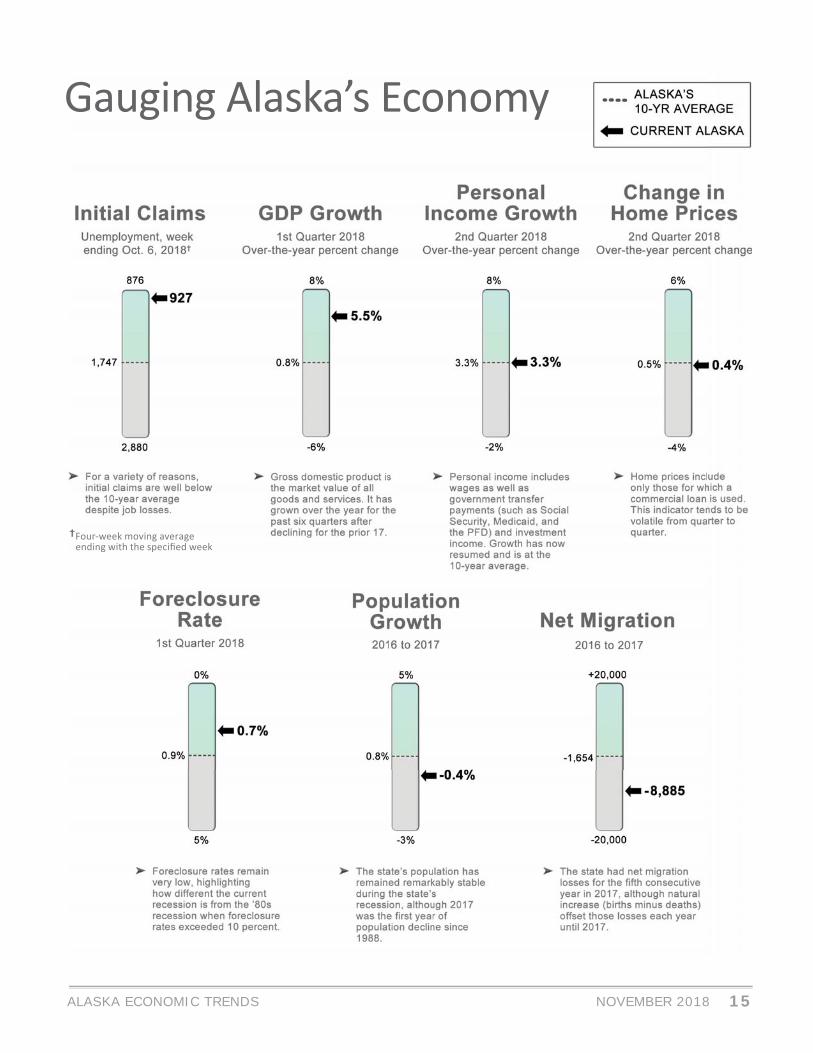
15ALASKA ECONOMIC TRENDS NOVEMBER 2018
Four-week moving average ending with the specifi ed week
Gauging Alaska’s Economy
16 ALASKA ECONOMIC TRENDSNOVEMBER 2018
Seasonally adjusted
Prelim. Revised9/18 8/18 9/17
Interior Region 5.3 4.9 6.4 Denali Borough 3.1 2.6 4.0 Fairbanks N Star Borough 4.9 4.4 5.9 Southeast Fairbanks Census Area
7.6 7.5 8.5
Yukon-Koyukuk Census Area
12.3 13.0 15.4
Northern Region 9.7 10.6 11.3 Nome Census Area 9.8 11.8 11.1 North Slope Borough 7.0 6.6 8.0 Northwest Arc c Borough 12.7 14.0 15.2
Anchorage/Mat-Su Region 5.3 5.1 6.4 Anchorage, Municipality 4.9 4.7 5.9 Mat-Su Borough 6.4 6.4 7.9
Prelim. Revised9/18 8/18 9/17
Southeast Region 4.6 4.2 5.3 Haines Borough 5.8 5.2 6.1 Hoonah-Angoon Census Area
6.6 6.7 7.5
Juneau, City and Borough 3.9 3.5 4.5 Ketchikan Gateway Borough
4.7 4.1 5.1
Petersburg Borough 6.4 5.9 7.8 Prince of Wales-Hyder Census Area
8.6 8.4 9.5
Sitka, City and Borough 3.6 3.0 4.3 Skagway, Municipality 3.1 2.6 3.7 Wrangell, City and Borough 5.2 4.7 6.7 Yakutat, City and Borough 6.4 7.3 8.0
Prelim. Revised9/18 8/18 9/17
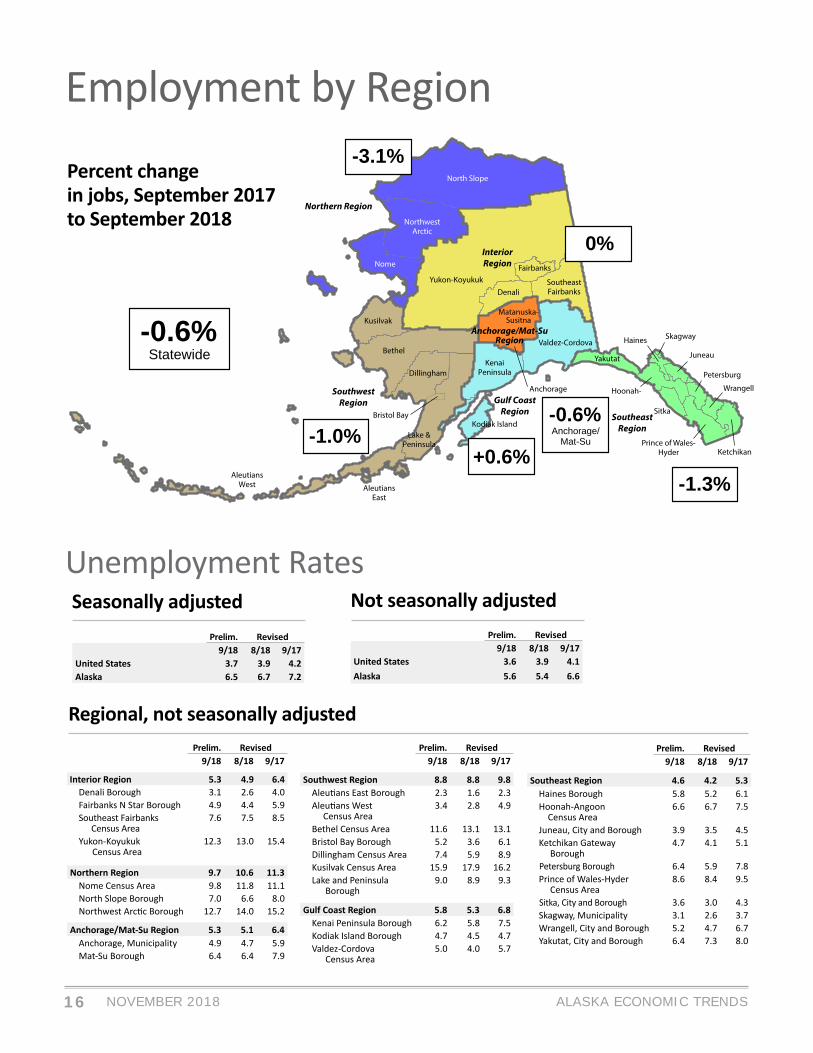
United States 3.7 3.9 4.2Alaska 6.5 6.7 7.2
Prelim. Revised9/18 8/18 9/17
Southwest Region 8.8 8.8 9.8 Aleu ans East Borough 2.3 1.6 2.3 Aleu ans West Census Area
3.4 2.8 4.9
Bethel Census Area 11.6 13.1 13.1 Bristol Bay Borough 5.2 3.6 6.1 Dillingham Census Area 7.4 5.9 8.9 Kusilvak Census Area 15.9 17.9 16.2 Lake and Peninsula Borough
9.0 8.9 9.3
Gulf Coast Region 5.8 5.3 6.8 Kenai Peninsula Borough 6.2 5.8 7.5 Kodiak Island Borough 4.7 4.5 4.7 Valdez-Cordova Census Area
5.0 4.0 5.7
Prelim. Revised9/18 8/18 9/17
United States 3.6 3.9 4.1Alaska 5.6 5.4 6.6
Regional, not seasonally adjusted
Not seasonally adjustedUnemployment Rates
Northern Region
Anchorage/Mat-SuRegion
Bristol Bay
InteriorRegion
Kodiak Island
KenaiPeninsula
Matanuska-Susitna
Anchorage
Valdez-Cordova
SoutheastFairbanksDenali
FairbanksYukon-Koyukuk
North Slope
NorthwestArctic
Nome
Kusilvak
Bethel
Dillingham
AleutiansEast
AleutiansWest
Lake &Peninsula
SouthwestRegion Gulf Coast
Region
Yakutat
Sitka
Hoonah-
Prince of Wales-Hyder
Haines Skagway
Juneau
Ketchikan
Petersburg
Wrangell
SoutheastRegion
-3.1%
-1.3%+0.6%
-1.0%
0%
-0.6%Anchorage/
Mat-Su
-0.6%Statewide
Percent changein jobs, September 2017 to September 2018
Employment by Region
17ALASKA ECONOMIC TRENDS NOVEMBER 2018
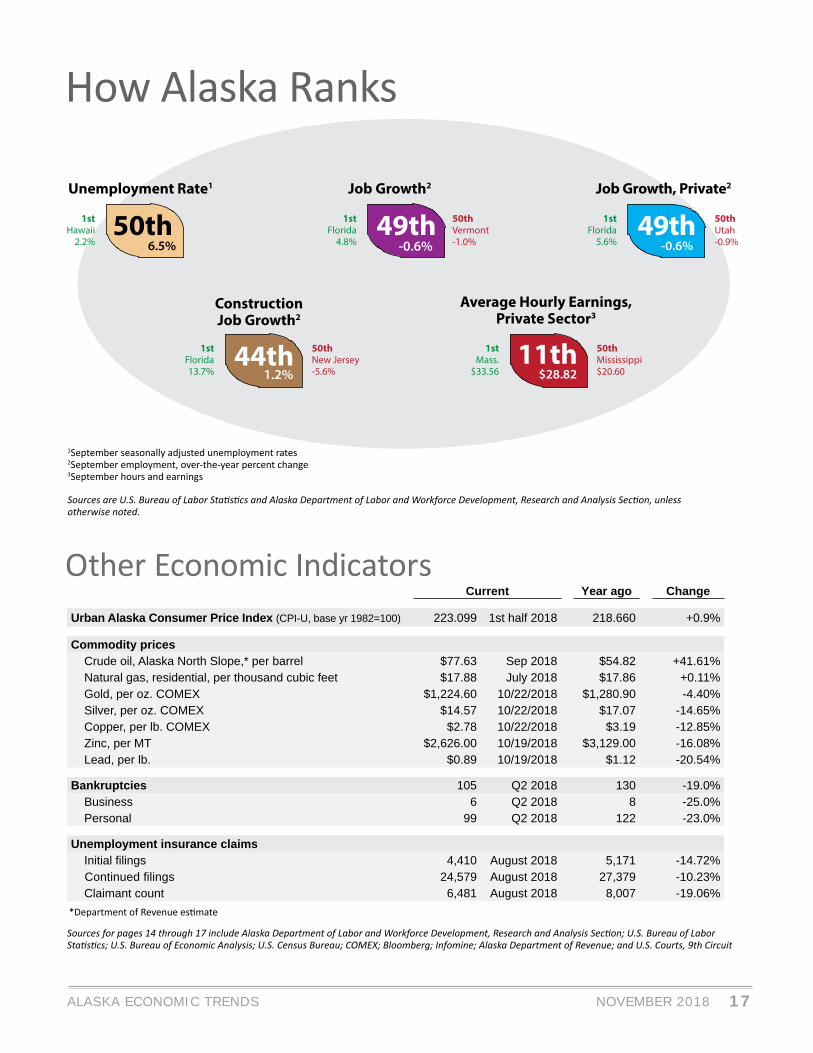
1September seasonally adjusted unemployment rates2September employment, over-the-year percent change3September hours and earnings
Sources are U.S. Bureau of Labor Sta s cs and Alaska Department of Labor and Workforce Development, Research and Analysis Sec on, unlessotherwise noted.
Current Year ago Change
Urban Alaska Consumer Price Index (CPI-U, base yr 1982=100) 223.099 1st half 2018 218.660 +0.9%
Commodity prices Crude oil, Alaska North Slope,* per barrel $77.63 Sep 2018 $54.82 +41.61% Natural gas, residential, per thousand cubic feet $17.88 July 2018 $17.86 +0.11% Gold, per oz. COMEX $1,224.60 10/22/2018 $1,280.90 -4.40% Silver, per oz. COMEX $14.57 10/22/2018 $17.07 -14.65% Copper, per lb. COMEX $2.78 10/22/2018 $3.19 -12.85% Zinc, per MT $2,626.00 10/19/2018 $3,129.00 -16.08% Lead, per lb. $0.89 10/19/2018 $1.12 -20.54%
Bankruptcies 105 Q2 2018 130 -19.0% Business 6 Q2 2018 8 -25.0% Personal 99 Q2 2018 122 -23.0%
Unemployment insurance claims Initial fi lings 4,410 August 2018 5,171 -14.72% Continued fi lings 24,579 August 2018 27,379 -10.23% Claimant count 6,481 August 2018 8,007 -19.06%
Other Economic Indicators
*Department of Revenue es mate
Sources for pages 14 through 17 include Alaska Department of Labor and Workforce Development, Research and Analysis Sec on; U.S. Bureau of Labor Sta s cs; U.S. Bureau of Economic Analysis; U.S. Census Bureau; COMEX; Bloomberg; Infomine; Alaska Department of Revenue; and U.S. Courts, 9th Circuit
How Alaska Ranks
50th1stHawaii
2.2%
Unemployment Rate1
6.5%
1.2%
49thJob Growth2
-0.6%
1stFlorida
4.8%
ConstructionJob Growth2
49th1stFlorida
5.6%
Job Growth, Private2
-0.6%
1stFlorida13.7%
11th1stMass.
$33.56
Average Hourly Earnings, Private Sector3
$28.82
50thMississippi$20.60
50thNew Jersey-5.6%
44th
50thVermont-1.0%
50thUtah-0.9%
19ALASKA ECONOMIC TRENDS NOVEMBER 2018
EMPLOYER RESOURCES
The seafood processing industry in Alaska has a long his-tory of hiring nonresidents to work the “slime lines.” In an industry with over 75 percent nonresident hire, it’s easy to forget that a signifi cant number of experienced Alaskans depend on seafood processing jobs for their livelihood.
Alaskans are a great choice for this well-established indus-try. They understand the local culture, know what to expect from the job, often have prior experience, are accustomed to Alaska’s climate, are willing to travel, and are less expen-sive to recruit than nonresidents. Hiring locals also helps sustain a healthy economy by keeping these wages in Alaska and in their communities.
Staff at the Alaska Job Center Network pride themselves on quality referrals of Alaskans to seafood processing employers. The Anchorage Seafood Employment Offi ce at the Midtown Job Center manages Alaska’s seafood workforce and assists those who want to work continu-ously from one fi shing season to the next. Many seafood employers recruit directly from the Anchorage Seafood Offi ce or through other job centers around the state. They can also post online job announcements in Alaska’s Labor Exchange System, or ALEXsys. Job center staff can assist employers during recruitment, referral, and retention by providing orientation into the seafood industry, organizing job fairs and recruitment events, and providing one-on-one application assistance.
Another hiring trend is emerging in Alaska. Alaska Depart-ment of Corrections’ Transitional Work Opportunities has quickly become a successful work release program. TWO, which began in Kenai in 2013, gives selected inmates the opportunity to work in seafood processing after their release. Many skills learned in prison are valuable in this industry, such as carpentry, welding, refrigeration, heat-ing, and air conditioning. DOC’s TWO staff, employers, and community members create an employment plan for inmates who qualify through a vetting system.
Because the Kenai project has been so successful, a simi-lar pilot program for remote seafood processing plants will begin in late December 2018 for pollock “A” season with UniSea, Inc., in Dutch Harbor and Trident Seafoods Cor-poration in Akutan.
For more information about TWO, contact Megan Edge, project manager, at (907) 269-5037. For information about customized strategies for recruiting seafood processing workers in Alaska, contact Nelson San Juan at the An-chorage Seafood Employment Offi ce, Midtown Job Center, 3301 Eagle Street, Anchorage, AK 99503, by phone at (907) 269-4708, or by email at [email protected].
Employer Resources is wri en by the Employment and Training Services Division of the Alaska Department of Labor and Workforce Development.
Strategies for recruiting more Alaskans for seafood processing jobs
SAFETY MINUTE
The seafood processing industry, a vital part of Alaska’s economy, includes shore-based processors as well as fl oating or at-sea plants. Shore-based plants are located throughout Southeast, while fl oating processors are barg-es or ships anchored just off shore. Ships typically operate in the Bering Sea and Bristol Bay.
Workers must be willing to perform a variety of tasks, including off-loading, cleaning, freezing, packaging, warehousing, and shipping. All of these require physical stamina. Working conditions can also be challenging, as they can be noisy where machines are operating, wet where fi sh are cleaned, and cold where fi sh are frozen and packaged.
The Occupational Safety and Health Administration regu-lations minimize these dangers and create a safe working environment in the industry.
The Department of Labor and Workforce Development’s Labor Standards and Safety Division, Occupational Safety and Health Section has a local emphasis program that focuses on reducing or eliminating safety and health haz-ards in the seafood processing industry. The latest direc-tive, on enforcement procedures, was issued Oct. 10. All directives are available here: http://labor.alaska.gov/lss/program_directives.htm.
For more information on AKOSH’s services for seafood processing employers, see:http://www.labor.state.ak.us/lss/oshhome.html.
For more fi sheries-related publications, see:http://jobs.alaska.gov/seafood/publications.html.
Safety Minute is wri en by the Labor Standards and Safety Division of the Alaska Department of Labor and Workforce Development.
Local emphasis programs for minimizing seafood processing hazards