Hedge funds and liquidity PRINCETON/nus JUNE 2008markus/teaching/Eco467/07Lecture/07b...
57
1 INSTITUTIONAL FINANCE Lecture 06: Portfolio Evaluation and Hedge Funds
Transcript of Hedge funds and liquidity PRINCETON/nus JUNE 2008markus/teaching/Eco467/07Lecture/07b...
1
INSTITUTIONAL FINANCELecture 06: Portfolio Evaluation and Hedge Funds
OVERVIEW
1. A Primer on Hedge Funds History, Compensation
Hedge Fung and Hsieh, 1999, A Primer on Hedge Funds, Journal of Empirical Finance.
Hedge Fund Strategies CSFB-Tremont http://www.hedgeindex.com;
Fung and Hsieh, 2004, Extracting Portable Alphas from Equity Long-Short Hedge Funds, Journal of Investment Management
Malkiel and Saha, 2005, Hedge Funds: Risk and Return, Financial Analysts Journal
2. Performance alpha versus beta
stale prices
non-linear payoffs
Focus I: Merger Arbitrage Mitchell and Pulvino, 2001, Characteristics of Risk and Return in Risk Arbitrage, J of Finance
3. Liquidity Risk and Risk Management Fund flows
Liquidity Spirals and Leverage
Correlation across Hedge Funds
Focus II: 2007 Quant crisis
2

TOTAL FINANCIAL ASSETS AS % OF GDP
0%
10%
20%
30%
40%
50%
60%
70%
80%
90%
100%
1980 1982 1984 1986 1988 1990 1992 1994 1996 1998 2000 2002 2004 2006
To
tal F
ina
ncia
l A
sse
ts (
% o
f G
DP
)
0%
20%
40%
60%
80%
100%
To
tal F
ina
ncia
l A
sse
ts (
as %
of
GD
P)
Security Brokers and Dealers
Commercial Banks
Hedge Funds
Mutual Funds + Hedge
Funds + Broker/Dealers
Mutual Funds
3
WHAT ARE HEDGE FUNDS?
private investment vehicles for individuals or institutional investors.
Typically organized as limited partnerships, in which the investors are limited partners and the managers are general partners.
As general partners, the fund managers usually invest in a significant portion of their personal wealth into the partnership to ensure the alignment of economic interests among the partners.
Investors to the partnership are charged a performance-based fee where the potential payout to successful managers can be significantly higher than the fixed management fee.
A major difference in return characteristics between hedge funds and mutual funds is due to differences in their trading strategies.
Hedge funds deploy dynamic trading strategies whereas most mutual funds employ a static buy-and-hold strategy.
Hedge funds typically leverage their bets by margining their positions and through the use of short sales. ∙ In contrast, the use of leverage is often limited if not restricted for mutual funds.
4
HISTORY OF HEDGE FUNDS
First hedge fund by Albert Wislow Jones in 1949. primary strategy used long-short equity positions and leverage.
incentive fee based on performance.
Until 1966 hedge funds remained relatively obscure
In 1966 article in Fortune described Jones' funds to have returns (net of fee) substantially higher than the best performing mutual funds.
Rapid expansion in 1967-68
Setback during the bear markets of 1969-70 and 1973-74, when many funds suffered losses and capital withdrawals.
Hedge funds faded back into obscurity until 1986, when an article in Institutional Investor reported that Julian Robertson's Tiger Fund had compounded annual returns of 43% during its first six years of existence, after expenses and incentive fee. This reignited interests in hedge funds, with the formation of many new hedge funds.
5

HEDGE FUND COMPENSATION
Managers can receive certain types of performance-based fees that are prohibited to mutual funds.
The typical compensation for hedge fund managers is a 2% management fee and
20% performance fee with high water mark.
substantially higher compared to mutual funds. Mutual fund performance-based fee must satisfy the "fulcrum" rule:
gains and losses must have a symmetric effect (over- and underperformance relative to a benchmark must result in the same amount of positive and negative incentive fees for a mutual fund manager
HF are not subject to “fulcrum” rule and managers typically receive asymmetric fees
Embedded “put option” is highly debated On the one hand, the significant amount of personal wealth that hedge
fund managers place at risk alongside investors inhibits excessive risk taking.
On the other hand, there are extreme circumstances where the disproportional payout from the incentive fee may outweigh the risk of losing personal wealth even if reputational risks are taken into account. 6

ORGANIZATION OF HEDGE FUNDS
Problem confronting a money manager who
believes that he has superior investment skills
limited own capital
Financing options
Equity
Debt – putting up personal assets as collateral - in most cases insufficient
Disclosure
Fund managers adverse to fully disclose his "winning strategy"
Excludes organizational forms that must meet a high level of "transparency" and "disclosure”
Favors "private vehicles" – explains the lack of "publicly offered" hedge fund products
Investors demand limited liability and protection
disclosure documents are at best cursory and complex
“recommendations from a reliable source”, managers “reputation” plus performance statistics and
computer simulations.
Commitment of manager’s personal capital and the incentive fee structure are often critical
elements.
7
REGULATION OF HEDGE FUNDS
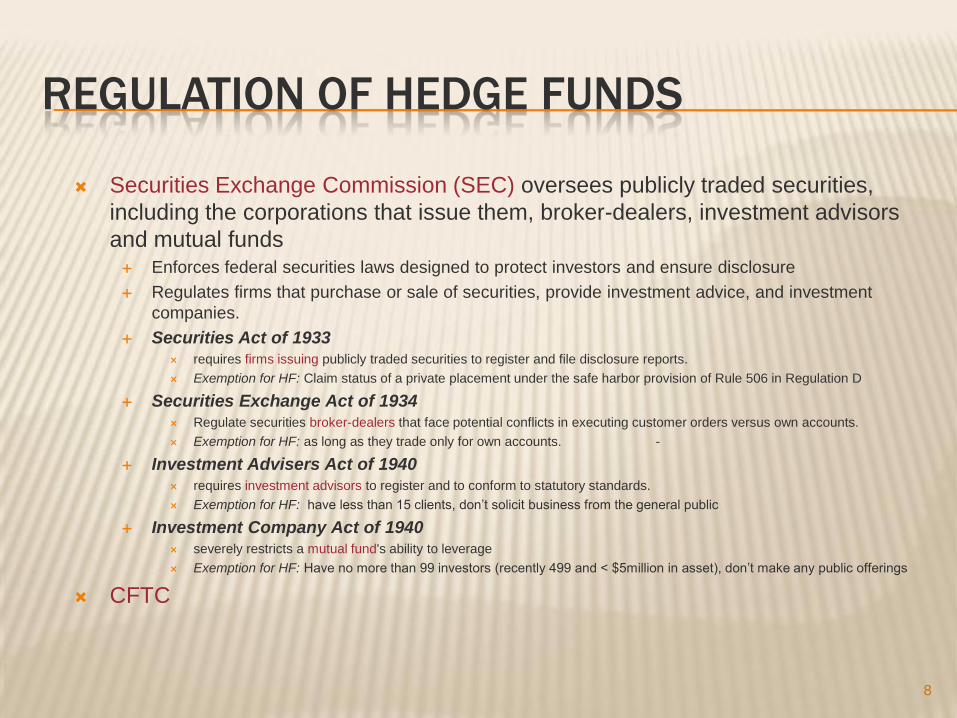
Securities Exchange Commission (SEC) oversees publicly traded securities,
including the corporations that issue them, broker-dealers, investment advisors
and mutual funds Enforces federal securities laws designed to protect investors and ensure disclosure
Regulates firms that purchase or sale of securities, provide investment advice, and investment
companies.
Securities Act of 1933 requires firms issuing publicly traded securities to register and file disclosure reports.
Exemption for HF: Claim status of a private placement under the safe harbor provision of Rule 506 in Regulation D
Securities Exchange Act of 1934 Regulate securities broker-dealers that face potential conflicts in executing customer orders versus own accounts.
Exemption for HF: as long as they trade only for own accounts. -
Investment Advisers Act of 1940 requires investment advisors to register and to conform to statutory standards.
Exemption for HF: have less than 15 clients, don’t solicit business from the general public
Investment Company Act of 1940 severely restricts a mutual fund's ability to leverage
Exemption for HF: Have no more than 99 investors (recently 499 and < $5million in asset), don’t make any public offerings
CFTC
8

REGULATION OF HEDGE FUNDS
The Commodity Futures Trading Commission (CFTC) oversees futures industry Commodity Exchange Act of 1974 to regulate the
futures markets in the US, the CFTC is mandated to protect market participants against manipulation, abusive trade practices and fraud in the futures markets. Entities that handle customer funds or provide trading advice in
futures contracts must register with the National Futures Association (NFA), a futures industry self-regulatory body approved by the CFTC. In addition, these registrants must disclose market risks and past performance information to prospective customers.
If a hedge fund trades futures and options on futures on behalf of its investors, it is generally required to file as a commodity pool operator with the Commodity Futures Trading Commission.
9

REGULATION OF HEDGE FUNDS
Hedge funds are not exempted from general regulations designed to monitor and safeguard the integrity of markets.
The U.S. Treasury requires traders to report large positions in selected foreign currencies and treasury securities.
The SEC requires traders to report positions that exceed 5% of the shares of a publicly traded firm
Quarterly position for “large” HFs (13F filing)
The Federal Reserve has margin requirements for stock purchases (RegT)
The CFTC requires traders with large futures positions to file daily reports.
The CFTC and the futures exchanges set futures margins and position limits on futures contracts.
These regulations apply to all market participants, including hedge funds.
10

HEDGE FUND STRATEGIES
Credit Suisse Tremont asset-weighted hedge fund
index calculated and rebalanced
monthly
Net of fee and expenses
includes only funds, as opposed to separate accounts
4500 funds minimum of US$50 million
under management
12-month track record
audited financial statements
11

THE 10 STRATEGIES - OVERVIEW
12

CONVERTIBLE ARBITRAGE
convertible securities
hedge the equity component by shorting the underlying stock or options
Also, interest rate, volatility and credit hedges
Hedge ratios adjusted as markets move
typically designed to create profit irrespective of market moves.
13
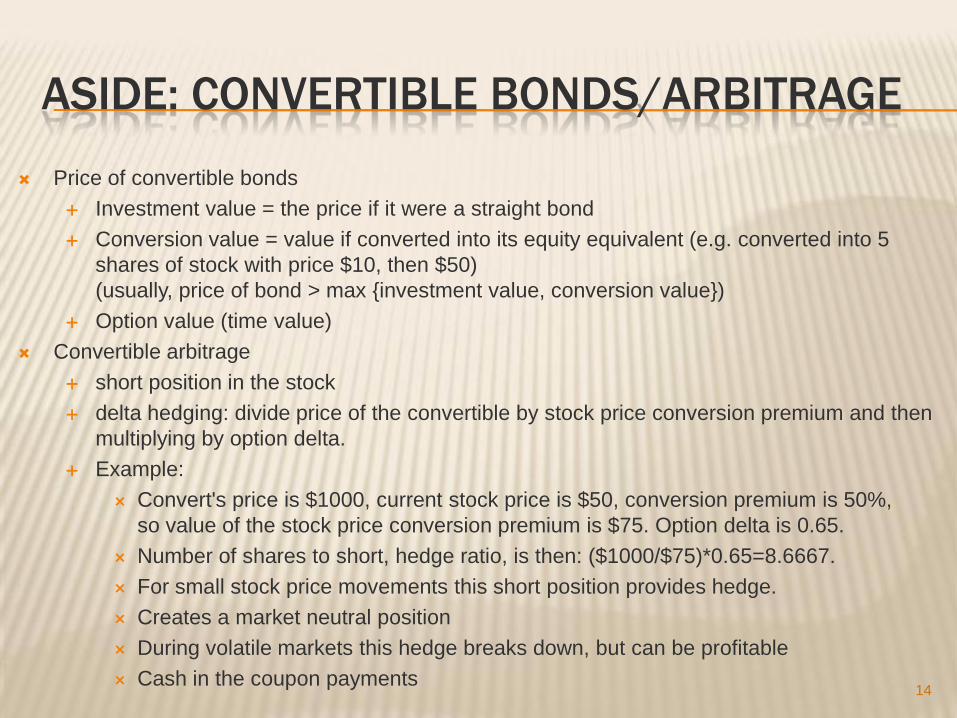
ASIDE: CONVERTIBLE BONDS/ARBITRAGE
Price of convertible bonds
Investment value = the price if it were a straight bond
Conversion value = value if converted into its equity equivalent (e.g. converted into 5
shares of stock with price $10, then $50)
(usually, price of bond > max {investment value, conversion value})
Option value (time value)
Convertible arbitrage
short position in the stock
delta hedging: divide price of the convertible by stock price conversion premium and then
multiplying by option delta.
Example:
Convert's price is $1000, current stock price is $50, conversion premium is 50%,
so value of the stock price conversion premium is $75. Option delta is 0.65.
Number of shares to short, hedge ratio, is then: ($1000/$75)*0.65=8.6667.
For small stock price movements this short position provides hedge.
Creates a market neutral position
During volatile markets this hedge breaks down, but can be profitable
Cash in the coupon payments14

DEDICATED SHORT BIAS
Overall net short
portfolios of long and
short equities
focus on companies
with weak cash flow
generation is common.
Risk management
consists of offsetting
long positions and
stop-loss strategies.
15

EMERGING MARKETS
investments in currencies, debt instruments, equities and other instruments of "emerging" markets countries (typically measured by GDP per capita).
Latin America, Eastern Europe, Africa, and Asia BRIC
Next-11
sub-sectors, including arbitrage, credit and event driven, fixed income bias, and equity bias.
16
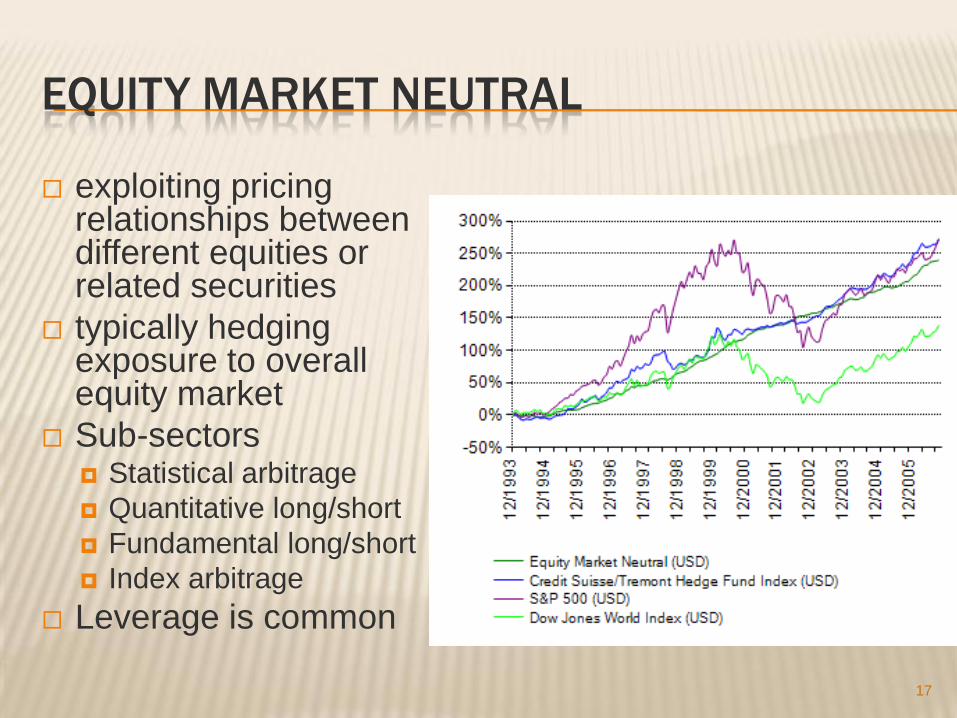
EQUITY MARKET NEUTRAL
exploiting pricing relationships between different equities or related securities
typically hedging exposure to overall equity market
Sub-sectors Statistical arbitrage
Quantitative long/short
Fundamental long/short
Index arbitrage
Leverage is common
17

EVENT DRIVEN
Subsectors
Risk (Merger) Arbitrage Specialists
are typically long the stock of the
company being acquired and short
the stock of the acquirer.
Distressed/High Yield Securities
Fund managers invest in claims of
companies in financial distress or
already in default. They trade at
substantial discounts, since they are
difficult to evaluate and have a lack
of street coverage.
Reg. D - investments in micro
capitalization public companies that
are raising money in private capital
markets.
18

FIXED INCOME
Different fixed income securities
Yield curve carry trade
Instruments interest rate swaps
T-Bonds
futures
vol-trading involving options
mortgage backed securities
19
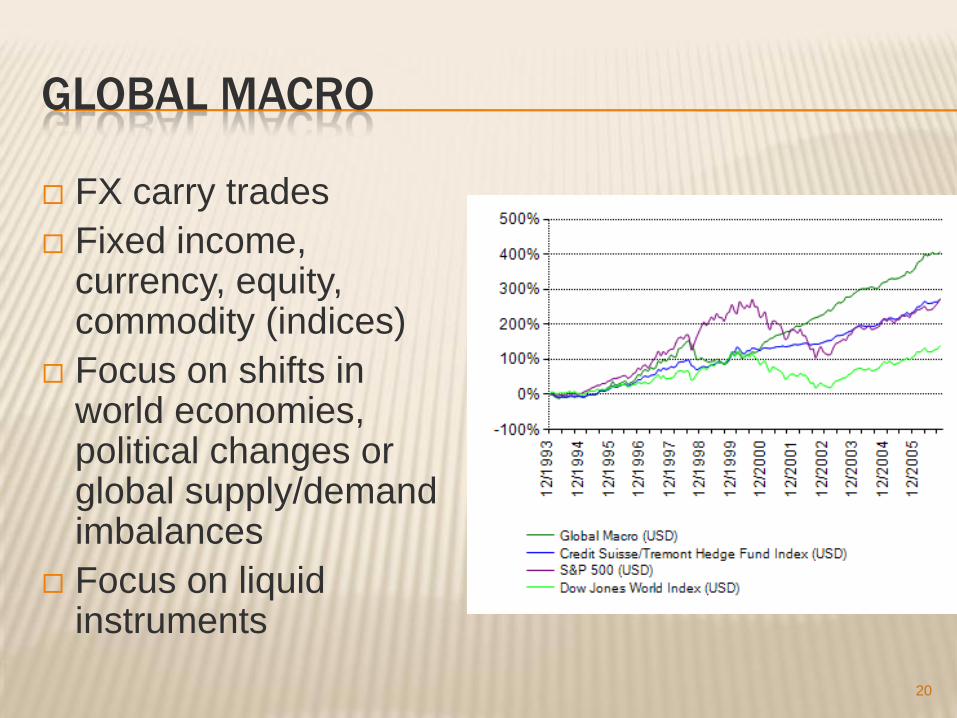
GLOBAL MACRO
FX carry trades
Fixed income, currency, equity, commodity (indices)
Focus on shifts in world economies, political changes or global supply/demand imbalances
Focus on liquid instruments
20

LONG/SHORT EQUITY
Long and short
Stocks
Futures/options
Shift from
value to growth,
small to large
net long to net short
Focus
Global, regional, or
sectorial
21

MANAGED FUTURES
Investment in listed bonds, currency, equity and commodity futures markets globally
Referred to as Commodity Trading Advisors (CTA)
Rely on trading programs base on past price data Long-term trend following
Short-term counter trend
Hybrid systematic/discretionary programs
Use stop-loss points to control risk
22

MULTI-STRATEGY
Number of different
strategies
(started as convertible
arbs and diversified in
other strategies)
Often highly leveraged
23
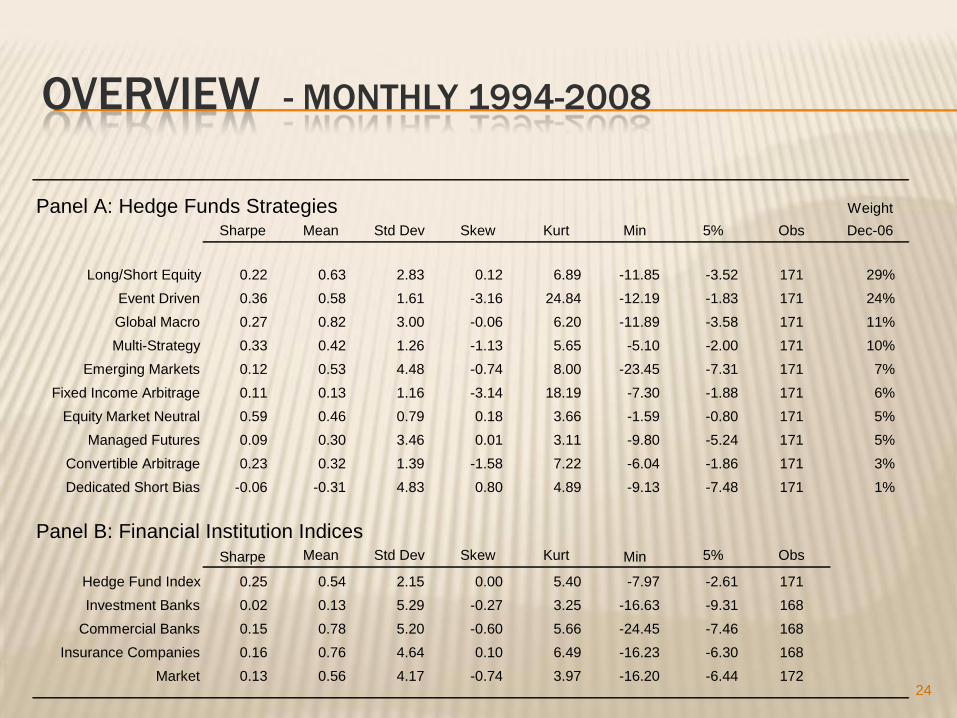
OVERVIEW - MONTHLY 1994-2008
Weight
Sharpe Mean Std Dev Skew Kurt Min 5% Obs Dec-06
Long/Short Equity 0.22 0.63 2.83 0.12 6.89 -11.85 -3.52 171 29%
Event Driven 0.36 0.58 1.61 -3.16 24.84 -12.19 -1.83 171 24%
Global Macro 0.27 0.82 3.00 -0.06 6.20 -11.89 -3.58 171 11%
Multi-Strategy 0.33 0.42 1.26 -1.13 5.65 -5.10 -2.00 171 10%
Emerging Markets 0.12 0.53 4.48 -0.74 8.00 -23.45 -7.31 171 7%
Fixed Income Arbitrage 0.11 0.13 1.16 -3.14 18.19 -7.30 -1.88 171 6%
Equity Market Neutral 0.59 0.46 0.79 0.18 3.66 -1.59 -0.80 171 5%
Managed Futures 0.09 0.30 3.46 0.01 3.11 -9.80 -5.24 171 5%
Convertible Arbitrage 0.23 0.32 1.39 -1.58 7.22 -6.04 -1.86 171 3%
Dedicated Short Bias -0.06 -0.31 4.83 0.80 4.89 -9.13 -7.48 171 1%
Sharpe Mean Std Dev Skew Kurt Min 5% Obs
Hedge Fund Index 0.25 0.54 2.15 0.00 5.40 -7.97 -2.61 171
Investment Banks 0.02 0.13 5.29 -0.27 3.25 -16.63 -9.31 168
Commercial Banks 0.15 0.78 5.20 -0.60 5.66 -24.45 -7.46 168
Insurance Companies 0.16 0.76 4.64 0.10 6.49 -16.23 -6.30 168
Market 0.13 0.56 4.17 -0.74 3.97 -16.20 -6.44 172
Panel A: Hedge Funds Strategies
Panel B: Financial Institution Indices
24
TAKEAWAY FROM HF RETURNS
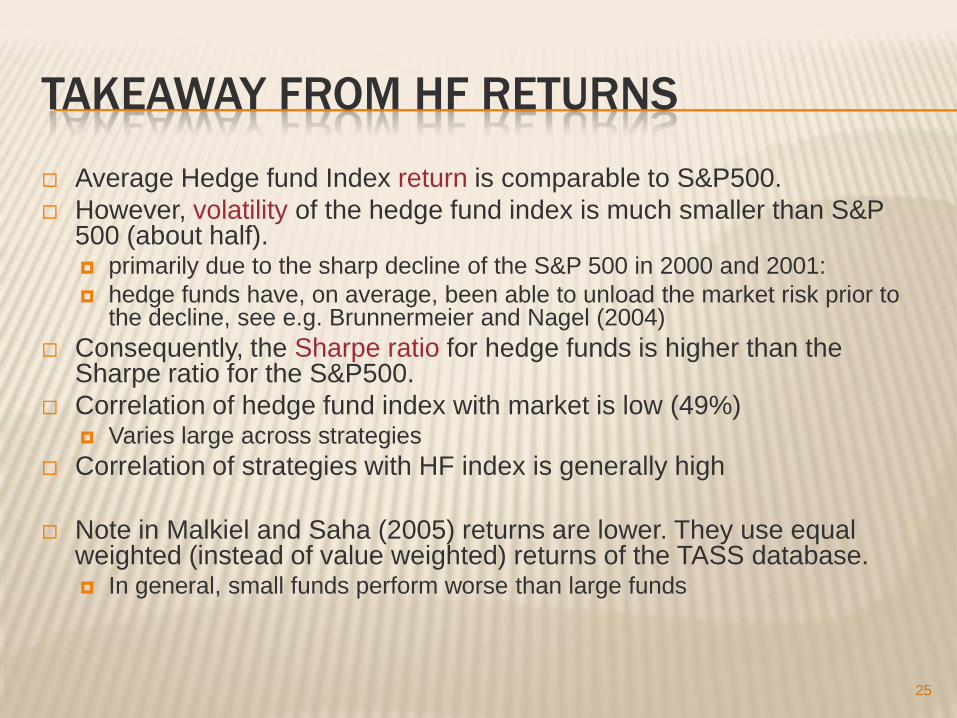
Average Hedge fund Index return is comparable to S&P500.
However, volatility of the hedge fund index is much smaller than S&P 500 (about half). primarily due to the sharp decline of the S&P 500 in 2000 and 2001:
hedge funds have, on average, been able to unload the market risk prior to the decline, see e.g. Brunnermeier and Nagel (2004)
Consequently, the Sharpe ratio for hedge funds is higher than the Sharpe ratio for the S&P500.
Correlation of hedge fund index with market is low (49%) Varies large across strategies
Correlation of strategies with HF index is generally high
Note in Malkiel and Saha (2005) returns are lower. They use equal weighted (instead of value weighted) returns of the TASS database. In general, small funds perform worse than large funds
25
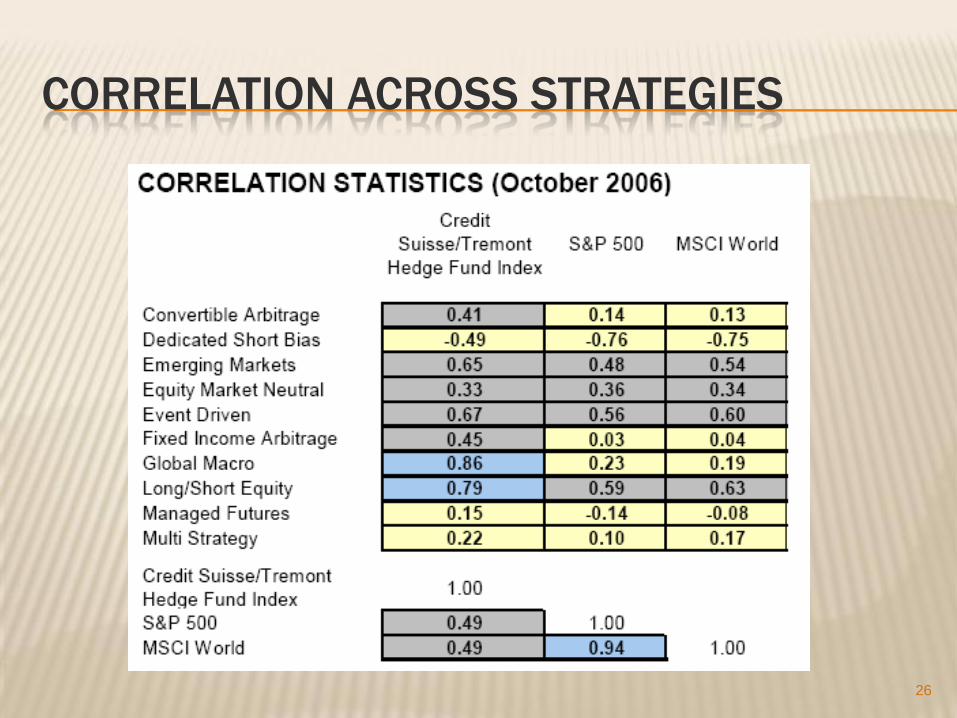
CORRELATION ACROSS STRATEGIES
26

OVERVIEW
1. A Primer on Hedge Funds History, Compensation,
Hedge Fund Strategies
2. Performance alpha versus beta stale prices
non-linear payoffs
Focus I: Merger Arbitrage Mitchell and Pulvino, 2001, Characteristics of Risk and Return
in Risk Arbitrage, J of Finance
3. Liquidity Risk and Risk Management Fund Flows
Liquidity Spirals and Leverage
Correlation across Hedge Funds
Focus II: 2007 Quant crisis27

PERFORMANCE – RETURN ISSUES
1. Biases Survivor – all alive funds have a 20% death rate
Backfill – smooth out returns
Self-reported
2. Estimation impression of mean returns , if σ=15%, then uncertainty about 5 year mean return is
1.96*15/5.5=+/-13%
3. Stale prices – return smoothing
4. Non-linear strategies Small prob. Disaster – historical averages are a poor measure
5. little persistence in outperformance
Conclusion
Evaluation of average returns or alphas is very noisy
Evaluation of risk measure or betas is useful
28
T/
PERFORMANCE MEASURES
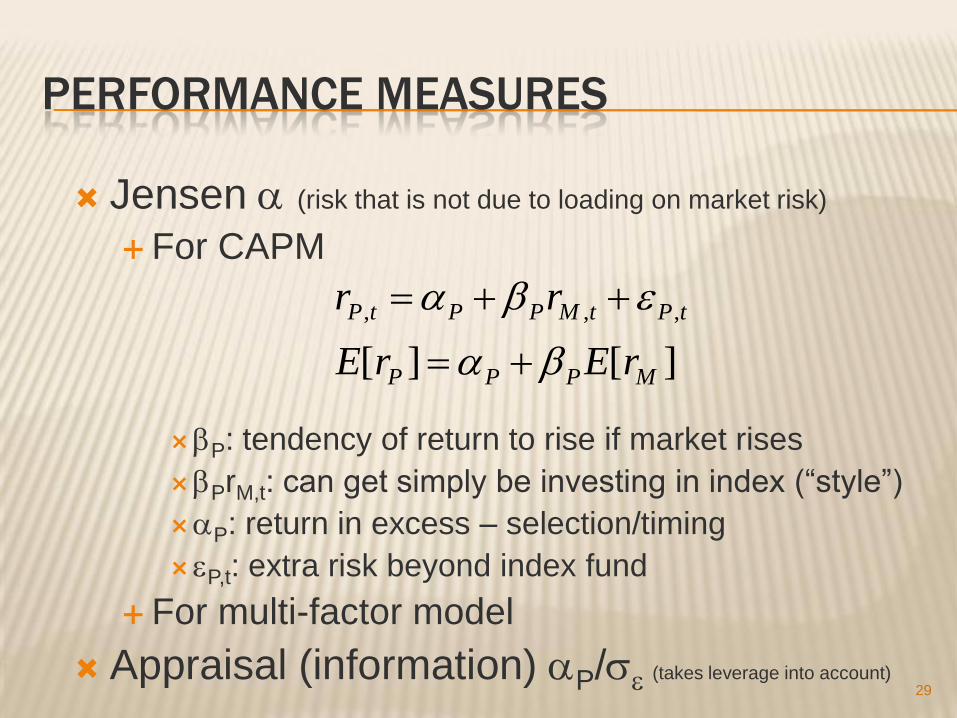
Jensen (risk that is not due to loading on market risk)
For CAPM
P: tendency of return to rise if market rises
PrM,t: can get simply be investing in index (“style”)
P: return in excess – selection/timing
P,t: extra risk beyond index fund
For multi-factor model
Appraisal (information) P/ (takes leverage into account)29
][][
,,,
MPPP
tPtMPPtP
rErE
rr

PERFORMANCE MEASURES
Jensen’s
Appraisal Ratio
Sharpe Ratio earned average risk premium of portfolio/fund P per unit of total
risk
Treynor Index earned average risk premium of portfolio/fund P per unit of
systematic risk (measured by beta)
30
P
fP rErE
][][
P
fP rErE
][][
ALPHAS OVER TIME
Hedge Fund Performance
Controlling for the S&P 500 Return and the VIX Return
-80
-60
-40
-20
0
20
40
60
80
1994 1995 1996 1997 1998 1999 2000 2001 2002 2003 2004 2005 2006
An
nu
al a
lph
a (
pe
rce
nt)
95th Percentile Alpha Average Alpha 5th Percentile Alpha Source: FRBNY calculations from TASS
31
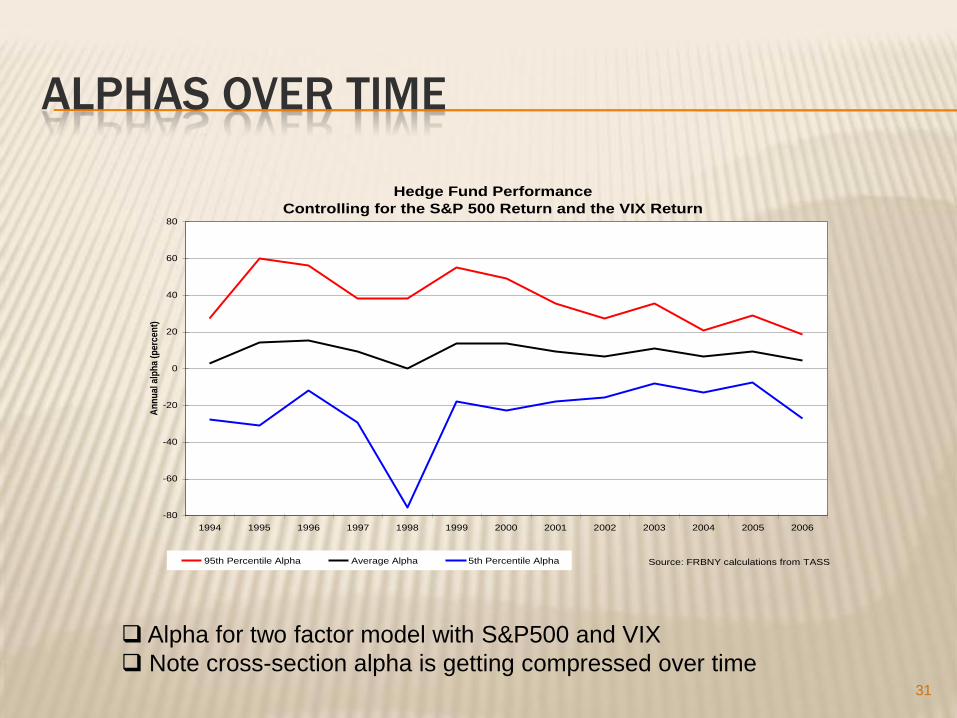
Alpha for two factor model with S&P500 and VIX
Note cross-section alpha is getting compressed over time
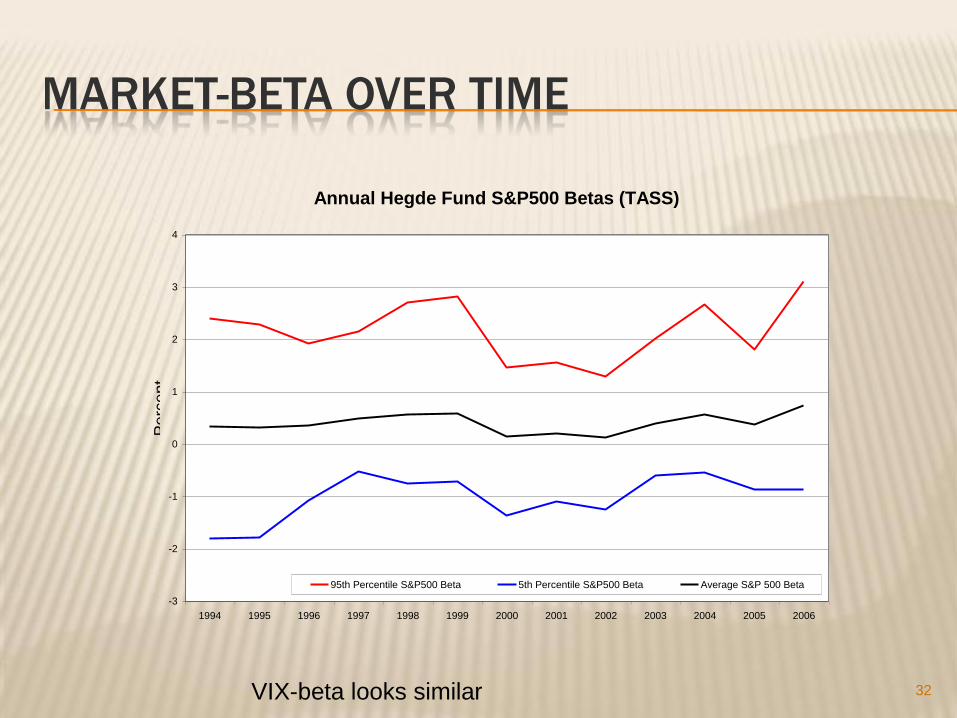
MARKET-BETA OVER TIME
Annual Hegde Fund S&P500 Betas (TASS)
-3
-2
-1
0
1
2
3
4
1994 1995 1996 1997 1998 1999 2000 2001 2002 2003 2004 2005 2006
95th Percentile S&P500 Beta 5th Percentile S&P500 Beta Average S&P 500 Beta
Pe
rce
nt
32VIX-beta looks similar

PORTABLE ALPHA – FROM FUNG-HSIEH 2004
33
More than 80% is explained by FF-factors
-Intercept is still significant
But volatility is much lower

STALE PRICES – RETURN SMOOTHING
Investing in illiquid assets with stale prices
makes
Correlation with factor (e.g. market) appear to be
low
Wrongly lowers -estimate, increase -estimate
Returns appear less volatile
Information ratio increases
34

USING LAGS TO IDENTIFY STALE PRICES
Style ER (%/mo) a b a3 b3
Index 0.64 0.46 0.28 0.36 0.44
Std. errors 0.20 0.17 0.04
Short -0.53 0.10 -0.94 0.13 -0.99
Emerg mkts 0.39 0.00 0.58 -0.07 0.69
Event 0.61 0.46 0.22 0.38 0.37
Global Macro 0.93 0.82 0.17 0.74 0.31
Long/Short Equity 0.73 0.42 0.47 0.32 0.65
35
& 500i s p i
t t tr a br 1 2 1 3 2 4 3
1 2 3 4
3
3
i sp sp sp sp i
t t t t t tr a b r b r b r b r
b b b b b
Source for following slides: John Cochrane’s website, idea from Asness et al JPM
Not zero!
Bigger with lags
Smaller with lags
Really not zero.
“Alternative asset?”
Long-short doesn’t
mean zero beta!
Lags are important – stale prices or lookback option
Betas are big!

Correlation with the market is obvious.
Getting out in 2000-2003 was smart! (Mostly due to Global/Macro group)36
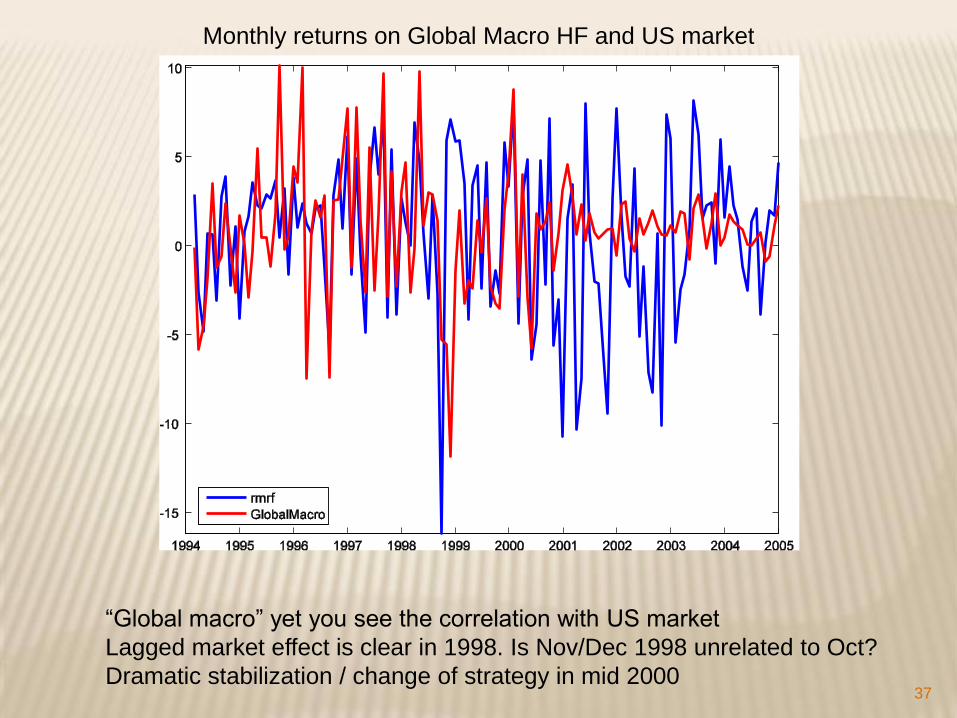
“Global macro” yet you see the correlation with US market
Lagged market effect is clear in 1998. Is Nov/Dec 1998 unrelated to Oct?
Dramatic stabilization / change of strategy in mid 2000
Monthly returns on Global Macro HF and US market
37

NON-LINEAR PAYOFFS
Linear CAPM regression cannot capture non-linear
payoff structures that arise
From trading options
Replicating options with dynamic trading strategies
Popular HF-strategy – writing put options
38
Stock price
You collect a fee, only pay off if the market goes down a lot.
Providing “disaster insurance”
Writing put profit
Fee (put price)
Most of the time, stock ends up here. You make a small profit
independent of stock price. Looks like “alpha”, “arbitrage”.
Rarely, the stock ends up here. You lose a huge amount
Today’s price

MERGER ARBITRAGE – OPTION LIKE RETURN
Cash offer. Borrow, buy target – short acquirer. Large chance of a small return if successful. (Leverage up) Small chance of a large loss if unsuccessful. But…offer is more likely to fail if the market falls! Payoff is like an index put!
39
Merger announced
Offer price
Buy
Merger completed
Merger fails
Time
Price

ARBITRAGE SPREAD
40

MERGER ARBITRAGE – OPTION LIKE RETURN
Line indicates similarity to writing index puts 41
Mitchell and Pulvino, JF

MERGER ARBITRAGE – OPTION LIKE RETURN
Occasional catastrophes
Catastrophes are more likely when market declines 42
Mitchell and Pulvino, JF
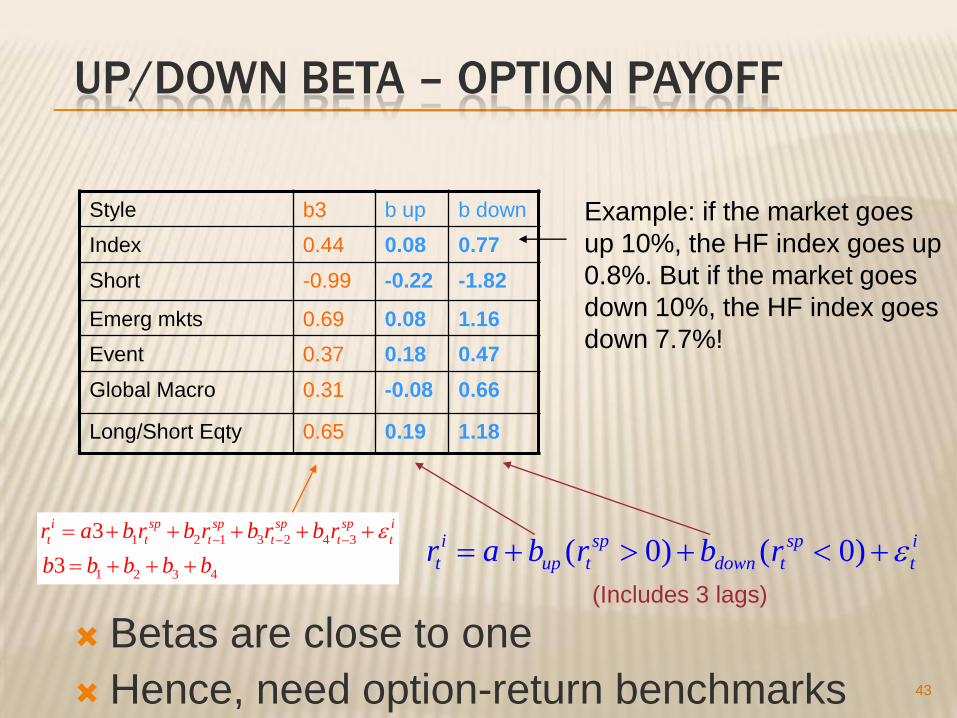
UP/DOWN BETA – OPTION PAYOFF
Betas are close to one
Hence, need option-return benchmarks 43
Style b3 b up b down
Index 0.44 0.08 0.77
Short -0.99 -0.22 -1.82
Emerg mkts 0.69 0.08 1.16
Event 0.37 0.18 0.47
Global Macro 0.31 -0.08 0.66
Long/Short Eqty 0.65 0.19 1.18
( 0) ( 0)i sp sp i
t up t down t tr a b r b r 1 2 1 3 2 4 3
1 2 3 4
3
3
i sp sp sp sp i
t t t t t tr a b r b r b r b r
b b b b b
(Includes 3 lags)
Example: if the market goes
up 10%, the HF index goes up
0.8%. But if the market goes
down 10%, the HF index goes
down 7.7%!

INCLUDE OPTION FACTORS
Large market betas emerge
Alphas are smaller 44
ER
(%/mo)
alpha SPPo
(puts)
SMB
(size)
HML
(value)
Event Arb 1.03 0.04 -0.92 0.15 0.08
Restructure 1.29 0.43 -0.63 0.24 0.12
Event driven 1.33 0.20 -0.94 0.31 0.12
Rel. value arb 1.15 0.38 -0.64 0.17 0.08
SPPo = return from rolling over out-of-the-money puts
Source: Agarwal and Naik RFS, using HFR data
i sp sp SPPo i
t i i t i t i t i t tr r SPPo s SMB h HML
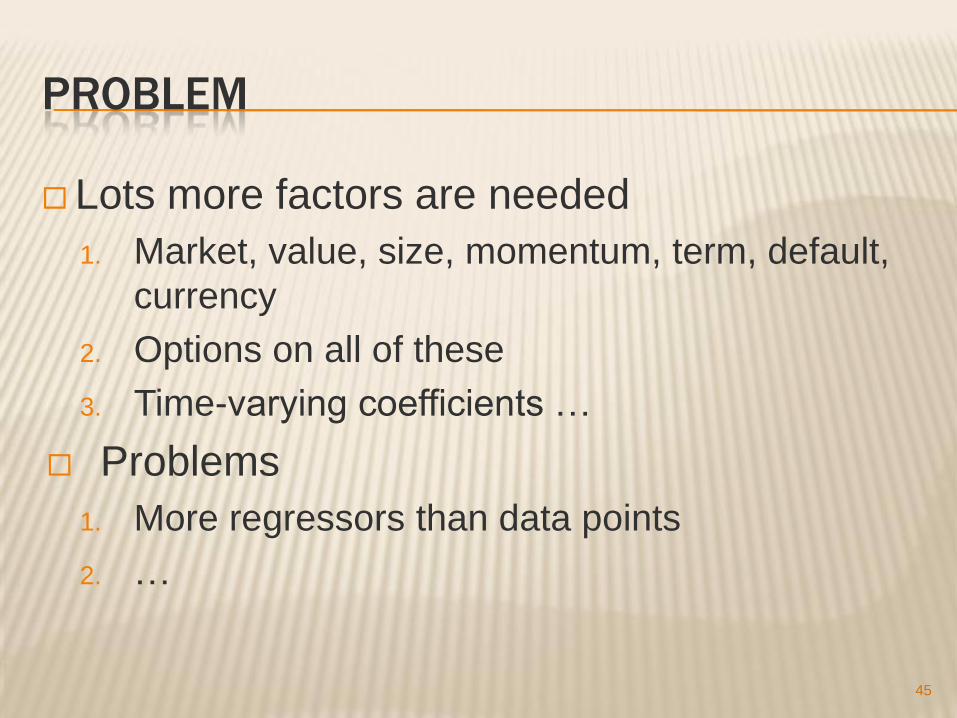
PROBLEM
Lots more factors are needed
1. Market, value, size, momentum, term, default,
currency
2. Options on all of these
3. Time-varying coefficients …
Problems
1. More regressors than data points
2. …
45

OVERVIEW
1. A Primer on Hedge Funds History, Compensation,
Hedge Fund Strategies
2. Performance alpha versus beta stale prices
non-linear payoffs
Focus I: Merger Arbitrage Mitchell and Pulvino, 2001, Characteristics of Risk and Return in
Risk Arbitrage, J of Finance
3. Liquidity Risk and Risk Management Risk spillovers
Focus II: 2007 Quant crisis
46
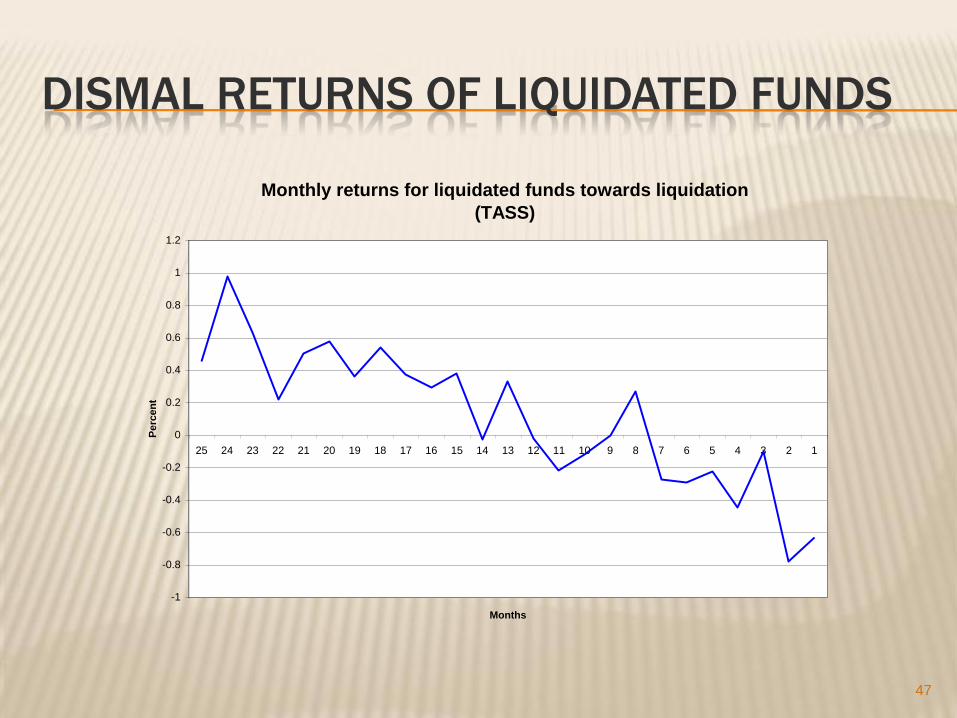
DISMAL RETURNS OF LIQUIDATED FUNDS
Monthly returns for liquidated funds towards liquidation
(TASS)
-1
-0.8
-0.6
-0.4
-0.2
0
0.2
0.4
0.6
0.8
1
1.2
25 24 23 22 21 20 19 18 17 16 15 14 13 12 11 10 9 8 7 6 5 4 3 2 1
Months
Perc
en
t
47
FLAVORS OF FUNDING LIQUIDITY
Margin funding risk Prime broker
Margin has to be covered by HF’s own capital Margins increase at times of crisis
Rollover risk CP
Inability to roll over short-term commercial paper
Redemption risk Depositors, HF-investors
Outflow of funds for HFs and banks
Essentially the same!Maturity mismatch:
Long-term assets (with low market liquidity) Short-term borrowing
48
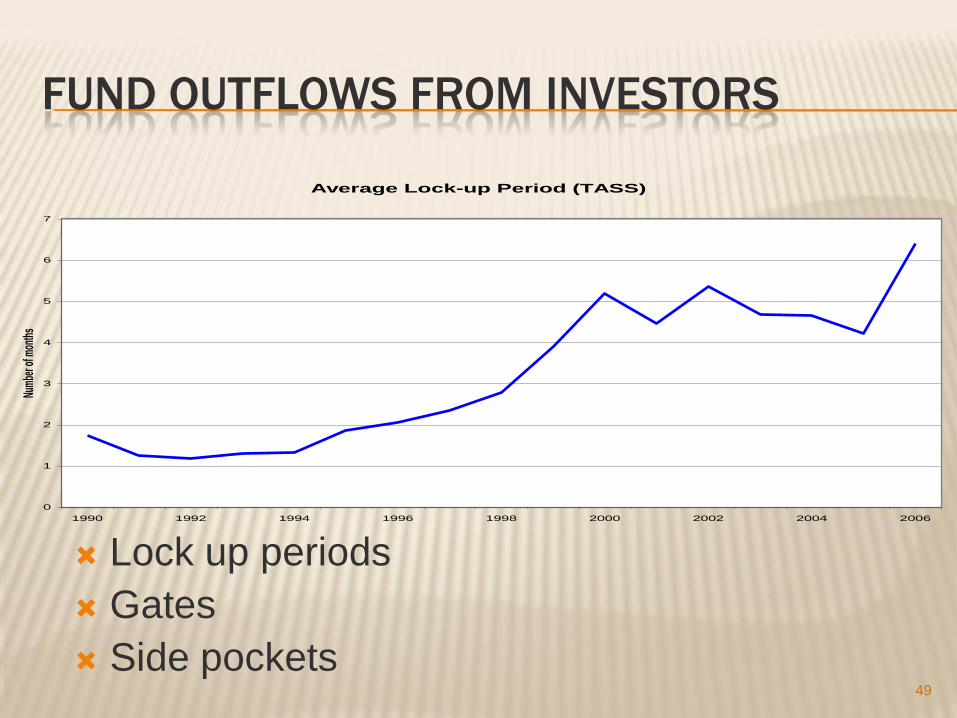
FUND OUTFLOWS FROM INVESTORS
Lock up periods
Gates
Side pockets49
Average Lock-up Period (TASS)
0
1
2
3
4
5
6
7
1990 1992 1994 1996 1998 2000 2002 2004 2006
Num
ber o
f mon
ths

FUND OUTFLOWS – MARGIN SPIRAL
Loss spiral
Net wealth > x
for asym. info reasons (constant or increasing leverage ratio)
Bernanke-Gertler, …
Margin spiral (forces to delever)
50• Both spirals reinforce each otherSource: Brunnermeier & Pedersen (2007)
Reduced Positions
Higher Margins
Prices Move Away
from FundamentalsFunding Problems
Losses on
Existing Positions
Initial Losses
e.g. credit

FUND OUTFLOWS – MARGIN SPIRAL
Percentage of Hedge Funds using Leverage
50%
52%
54%
56%
58%
60%
62%
64%
66%
68%
1990 1991 1992 1993 1994 1995 1996 1997 1998 1999 2000 2001 2002 2003 2004 2005 2006
Source: TASS
51Somewhat surprising, fraction of funds using leverage is declining

MARGIN SPIRAL – SUMMER 2007
52
Rating Jan-May 2007 July-Aug 2007
Bond
Investment grade 0-3 3-7
High yield 0-5 10+
Leveraged Loan
Senior 10-12 15-20
2nd lien 15-20 20-30
Mezzanine 18-25 30+
ABS and CDO
AAA 2-4 8-10
AA 4-7 20
A 8-15 30
BBB 10-20 50
Equity 50 100
Source: Citigroup, IMF Stability report 2007
Margins/Haircuts:

LEVERAGE AND ALPHAS
Top and bottom performers have higher leverage
In 2005/06 leverage is high
In 1998 leverage is low53
Hedge Fund Performance and Leverage
-80
-60
-40
-20
0
20
40
60
80
1994 1995 1996 1997 1998 1999 2000 2001 2002 2003 2004 2005 2006
An
nu
al alp
ha (
perc
en
t)
95th Percentile Alpha Average Alpha 5th Percentile Alpha
73%
72%
53%66%
70%
68% 74%
66%
65%
67%
77%
69%
80%
77%
67%
69%
68%
71%
73%
64%
58%
65%
63%59%72%
70%
Source: FRBNY calculations from TASS
The red boxes indicate the percentage of funds in the top 5 percentile that use leverage.
The blue boxes indicate the percentage of funds in the bottom 5 percentile that use leverage.
The black boxes indicate the percentage of funds that use average leverage.
66%
66%
66%64%
62%
60%
62%63%
64%65%
57%57%
58%

MARGIN SPIRAL AND FAT TAILS
54Source: Jorion (2000)

CORRELATION ACROSS HEDGE FUNDS
Crowded trades?
Correlation can be misleading
Vol declined – great moderation55
1998-08
-.2
0.2
.4.6
.8
Corr
ela
tion
1994-01 1996-01 1998-01 2000-01 2002-01 2004-01 2006-01
Cross-Sectional Correlation Cross-Sectional Correlation MA(12)
Figure 4: Cross-sectional Correlation of Hedge Fund Returns
1998-08
-10
-50
510
15
Covari
ance
1994-01 1996-01 1998-01 2000-01 2002-01 2004-01 2006-01
Cross-Sectional Covariance Cross-Sectional Covariance MA(12)
Figure 3: Cross-sectional Covariance of Hedge Fund Returns

2007 HEDGE FUND QUANT CRISIS
Why? Many (not only quant) funds liquidate “relatively” liquid positions first – “liquid HML” suffered even more
Quant funds focus on same few “quant strategies”
Almost all quant strategies comoved – “crowded trades” US from 08/05/07 + sharp (correlated) rebound on 08/10/07
Europe/Japan from 08/08/07 onwards57
FUTURE TRENDS
Diversify across Assets
sovereign bonds, agencies, corporate, equity, private equity, real estate
Countries Large impact on US Treasuries
Financial Protection – Next Risk Economic or strategic investments
Geopolitical dimension
Transparency Objectives, activities, performance
62