HEAVILY INDEBTED POOR COUNTRIES (HIPC) INITIATIVE...
47
INTERNATIONAL DEVELOPMENT ASSOCIATION INTERNATIONAL MONETARY FUND HEAVILY INDEBTED POOR COUNTRIES (HIPC) INITIATIVE AND MULTILATERAL DEBT RELIEF INITIATIVE (MDRI) - STATISTICAL UPDATE Prepared by Staffs of the International Development Association and the International Monetary Fund Approved By Jeffery Lewis and Siddarth Tiwari March 25, 2013
Transcript of HEAVILY INDEBTED POOR COUNTRIES (HIPC) INITIATIVE...
INTERNATIONAL DEVELOPMENT ASSOCIATION
INTERNATIONAL MONETARY FUND
HEAVILY INDEBTED POOR COUNTRIES (HIPC) INITIATIVE AND
MULTILATERAL DEBT RELIEF INITIATIVE (MDRI) - STATISTICAL
UPDATE
Prepared by Staffs of the International Development Association and the International Monetary Fund
Approved By Jeffery Lewis and Siddarth Tiwari
March 25, 2013

Contents
I. Introduction ............................................................................................................................... 1 II. Progress in the implementation of the Initiative ....................................................................... 1 III. Debt Service Relief and Poverty Reducing Expenditure ......................................................... 3 IV. An Update of the Costs of the Initiatives ................................................................................. 4 V. Creditor Participation: Multilateral Creditors .......................................................................... 6 VI. Creditor Participation: Official Bilateral and Commercial Creditors ...................................... 6 Figures Figure 1. Average Poverty Reducing Expenditure and Debt Service in HIPCs ............................ 4 Tables Table 1. List of Heavily Indebted Poor Countries (As of end-December 2012) ............................ 2 Table 2. HIPC Initiative: Costs by Main Creditor and Country Group ........................................ 5 Table 3. MDRI: Nominal Costs by Main Creditor and Country Group ........................................ 5 Annexes Annex I Country Status under the Enhanced HIPC Initiative ........................................................ 7 Table 1: HIPC Pre-Decision Point Countries ................................................................................. 7 Table 2A: HIPC Decision-Point Countries: Status of Completion Point Triggers ....................... 8 Table 2B: HIPC Decision-Point Countries: Summary by Country ............................................... 8 Table 3: HIPC Completion-Point Countries: Progress towards Achieving the MDGs ................ 9 Annex II Country Coverage, Data Sources, and Assumptions for the HIPC Initiative and MDRI Costing Exercise ........................................................................................................ 11
A. Country Coverage ............................................................................................................ 11 B. Data Sources .................................................................................................................... 11 C. Assumptions for the HIPC Initiative and MDRI Costing Exercise ................................. 11 D. Update of Cost Estimates in Present Value Terms .......................................................... 12
Annex III Tables Table 1: Summary of Debt Service and Poverty Reducing Expenditures 2001-17 .................... 13 Table 2: Debt Service of 36 Post Decision Point HIPCs 2001-17 .............................................. 14 Table 3: Poverty-Reducing Expenditure of 36 Post Decision Point HIPCs 2001-17 ................. 17 Table 4: HIPC Initiative and MDRI: Committed Debt Relief and Outlook................................ 20 Table 5: Cost Estimates, Multilateral Creditors & Status of Commitments to Post-Completion-Point HIPCs .................................................................................................... 21 Table 6A: Status of Delivery of HIPC Initiative and MDRI Assistance - World Bank .............. 22 Table 6B: World Bank Group Debt Service after HIPC and MDRI, 2000-17 ........................... 23 Table 7A: Implementation of the HIPC Initiative and MDRI by the IMF .................................. 25
Table 7B: IMF HIPC Initiative and MDRI Debt Relief, 1998-12 .............................................. 26 Table 8A: Status of Delivery of HIPC Initiative and MDRI Assistance by AfDB ..................... 28 Table 8B: AfDB Group Debt Service after HIPC and MDRI Debt Relief, 2000-15 .................. 29 Table 9: Status of Delivery of HIPC and MDRI Assistance by the IaDB .................................. 31 Table 10: Status of Bilateral Donor Contributions to the Debt Relief Trust Fund ..................... 32 Table 11: Cost Estimates to Paris Club Official Bilateral Creditors by Creditor Country ......... 33 Table 12: Debt Relief Committed and Delivered by the Paris Club Creditors ........................... 34 Table 13: Paris Club’s Delivery of Debt Relief - Bilateral Initiatives beyond the HIPC ........... 35 Table 14: Cost Estimates to Non-Paris Club Official Bilateral Creditors ................................... 36 Table 15: Delivery of HIPC Debt Relief by Non-Paris Club Official Bilateral Creditors ......... 38 Table 16. Commercial Creditor Lawsuits against HIPCs ........................................................... 40

ABBREVIATIONS AND ACRONYMS
AfDB African Development Bank AfDF African Development Fund AFRITAC Africa Regional Technical Assistance Centers AMF Arab Monetary Fund AsDB Asian Development Bank BADEA Arab Bank for Economic Development in Africa BCEAO Central Bank of West African States BDEAC Banque de Développement des États de l’Afrique Centrale
(Central African States Development Bank) BDEGL Banque de Développement des Etats des Grand Lacs
(Development Bank of Great Lake States) BEAC Banque des Etats de l’Afrique Centrale (Bank of Central African States) BOAD Banque Ouest Africaine de Developpement (West African Development Bank) CABEI Central American Bank for Economic Integration CAF Corporación Andina de Fomento CDB Caribbean Development Bank CEMLA Centro de Estudios Monetarios Latinoamericanos CIRR Commercial Interest Reference Rate CP Completion-Point DP Decision-Point DRC Democratic Republic of the Congo EADB East African Development Bank EBID ECOWAS Bank for Investment and Development ECF Extended Credit Facility EFF Extended Fund Facility EIB European Investment Bank EPCA Emergency Post-Conflict Assistance ESF Exogenous Shocks Facility EU European Union FEGECE Fonds d’Entraide et de Garantie des Emprunts du Conseil de l’Entente
(Fund of Aid and of Loans Guarantee of the Agreement Council) FOCEM Fondo Centroamericano de Estabilización Monetaria FONPLATA Fund for the Financial Development of the River Plate Basin FSID Fonds de solidarité islamique pour le développement
(Islamic Fund for Solidarity and Economic Development) GDP Gross Domestic Product HIPC Heavily Indebted Poor Countries IaDB Inter-American Development Bank IBRD International Bank for Reconstruction and Development

IDA International Development Association IFAD International Fund for Agricultural Development IMF International Monetary Fund I-PRSP Interim Poverty Reduction Strategy Paper IsDB Islamic Development Bank JSAN Joint Staff Advisory Note LICs Low Income Countries MDB Multilateral Development Bank MDGs Millennium Development Goals MDRI Multilateral Debt Relief Initiative NDF Nordic Development Fund OPEC Organization of Petroleum Exporting Countries OFID OPEC Fund for International Development PRGF Poverty Reduction and Growth Facility PRSP Poverty Reduction Strategy Paper PTA Eastern and Southern African Trade and Development Bank PV Present Value SDR Special Drawing Rights SMP Staff Monitored Program WAEMU West African Economic and Monetary Union WAIFEM West African Institute for Financial and Economic Management


I. Introduction1
• This report provides an update on the status of implementation of the HIPC Initiative and the MDRI over the past year. Given that most HIPCs have reached the completion point, in November 2011, the IMF and IDA Boards2 endorsed staff’s proposal to further streamline reporting of progress under the HIPC Initiative and MDRI. It was agreed that the annual HIPC Initiative/MDRI status of implementation report will be discontinued, while the core information—on debt service and poverty reducing expenditure, the cost of debt relief, creditor participation rates, and litigation against HIPCs—should continue to be made available and updated regularly on the IMF and World Bank websites.
• Against this background, this report provides an update to the progress made in the last year and the overall progress under the Initiative to date. In particular, the following figures and tables are updated:
⋅ Trends in poverty reducing spending and debt service in HIPCs (Annex III Tables 1-3) ⋅ Costs of the initiatives by creditor and country (Tables 2 and 3 and Annex III Tables 4 -
14) ⋅ Non-Paris Club bilateral creditor participation (Annex III Table 15) ⋅ Commercial creditor litigation against HIPCs (Annex III Table 16)
II. Progress in the implementation of the Initiative
(Table 1)
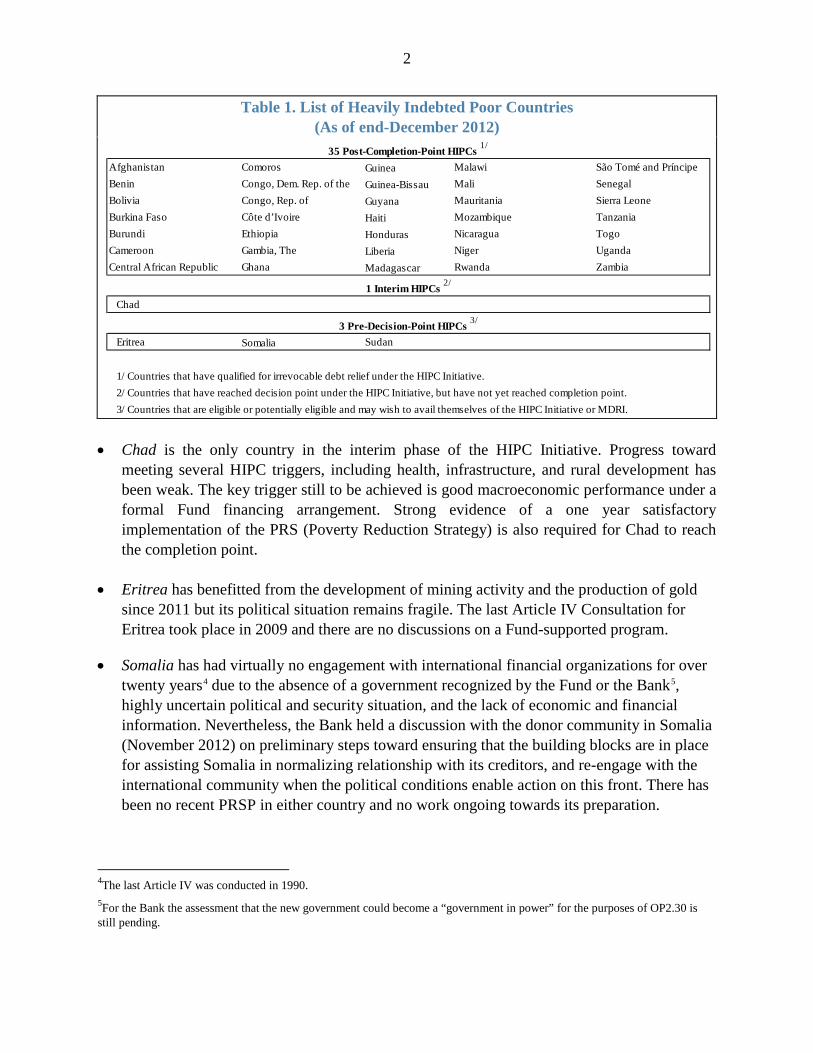
• Three countries – Comoros, Cote d’Ivoire and Guinea – reached HIPC Initiative’s completion point in 2012. Chad is the only country in the interim phase between the decision and completion points. (Table 1)
• The HIPC Initiative is nearly completed. Out of the 39 countries that have been assessed eligible or potentially eligible under the Initiative, 35 have already reached the completion point. Three pre-decision point countries - Eritrea, Somalia, and Sudan - are yet to start the process of qualifying for debt relief under the Initiative.3
1Statistical update was prepared by Jayendu De and Yan Sun-Wang under the supervision of Laurence Allain and Said Bakhache (IMF), Signe Zeikate under the supervision of Sudarshan Gooptu (WB). 2http://siteresources.worldbank.org/INTDEBTDEPT/ProgressReports/23063134/HIPC_MDRI_StatusOfImplementation2011.pdf. 3Kyrgyz Republic, Bhutan, and Lao P.D.R did not meet the indebtedness criterion at end-2010 and were excluded from the list of HIPC eligible countries in 2011, while Nepal still remains potentially eligible. Nepal later indicated that it did not wish to avail itself of assistance under the Initiative.
2
Table 1. List of Heavily Indebted Poor Countries (As of end-December 2012)
• Chad is the only country in the interim phase of the HIPC Initiative. Progress toward
meeting several HIPC triggers, including health, infrastructure, and rural development has been weak. The key trigger still to be achieved is good macroeconomic performance under a formal Fund financing arrangement. Strong evidence of a one year satisfactory implementation of the PRS (Poverty Reduction Strategy) is also required for Chad to reach the completion point.
• Eritrea has benefitted from the development of mining activity and the production of gold since 2011 but its political situation remains fragile. The last Article IV Consultation for Eritrea took place in 2009 and there are no discussions on a Fund-supported program.
• Somalia has had virtually no engagement with international financial organizations for over twenty years4 due to the absence of a government recognized by the Fund or the Bank5, highly uncertain political and security situation, and the lack of economic and financial information. Nevertheless, the Bank held a discussion with the donor community in Somalia (November 2012) on preliminary steps toward ensuring that the building blocks are in place for assisting Somalia in normalizing relationship with its creditors, and re-engage with the international community when the political conditions enable action on this front. There has been no recent PRSP in either country and no work ongoing towards its preparation.
4The last Article IV was conducted in 1990. 5For the Bank the assessment that the new government could become a “government in power” for the purposes of OP2.30 is still pending.
Afghanistan Comoros Guinea Malawi São Tomé and PríncipeBenin Congo, Dem. Rep. of the Guinea-Bissau Mali SenegalBolivia Congo, Rep. of Guyana Mauritania Sierra LeoneBurkina Faso Côte d’Ivoire Haiti Mozambique TanzaniaBurundi Ethiopia Honduras Nicaragua TogoCameroon Gambia, The Liberia Niger UgandaCentral African Republic Ghana Madagascar Rwanda Zambia
Chad
Eritrea Somalia Sudan
1/ Countries that have qualified for irrevocable debt relief under the HIPC Initiative. 2/ Countries that have reached decision point under the HIPC Initiative, but have not yet reached completion point. 3/ Countries that are eligible or potentially eligible and may wish to avail themselves of the HIPC Initiative or MDRI.
35 Post-Completion-Point HIPCs 1/
1 Interim HIPCs 2/
3 Pre-Decision-Point HIPCs 3/
3
• Sudan has made good progress towards the technical work required to advance towards the decision point of the HIPC Initiative and has reconciled over 90 percent of the end-2010 external debt stock in collaboration with creditors. The Sudanese parliament has also approved an ambitious interim-PRSP in June 2012.6 As of end-2012 Sudan still remains in arrears to the Fund and the World Bank.7
• Myanmar’s potential eligibility under the HIPC could not be assessed in 2006 and 2011 because of lack of data. Recently, Myanmar has reached an agreement with Fund staff on a 12-month Staff Monitored Program (SMP) for 2013 to support its reform effort. This agreement paved the way for Myanmar to clear its external arrears vis-à-vis its Paris Club creditors, as well as the World Bank8 and the Asian Development Bank.
• Zimbabwe remains in debt distress and will need a comprehensive arrears clearance framework with the international community.9 In 2001, Zimbabwe was removed from the IMF’s list of PRGT (Poverty Reduction and Growth Trust) eligible countries due to the arrears to the PRGT. Zimbabwe has made three payments to the PRGT in 2012, totaling US$ 7.5 million; as of end-December 2012, its arrears to the Fund amounted to US$ 127 million and to the Bank US$ 986 million. For the Fund, should Zimbabwe’s PRGT-eligibility be re-instated, it could be added to the list of countries potentially eligible for HIPC Initiative assistance (if the assessment against the indebtedness criterion were to be confirmed). On the Bank side, a modification of, or exception to, IDA's HIPC Initiative potential eligibility criteria would be required.10
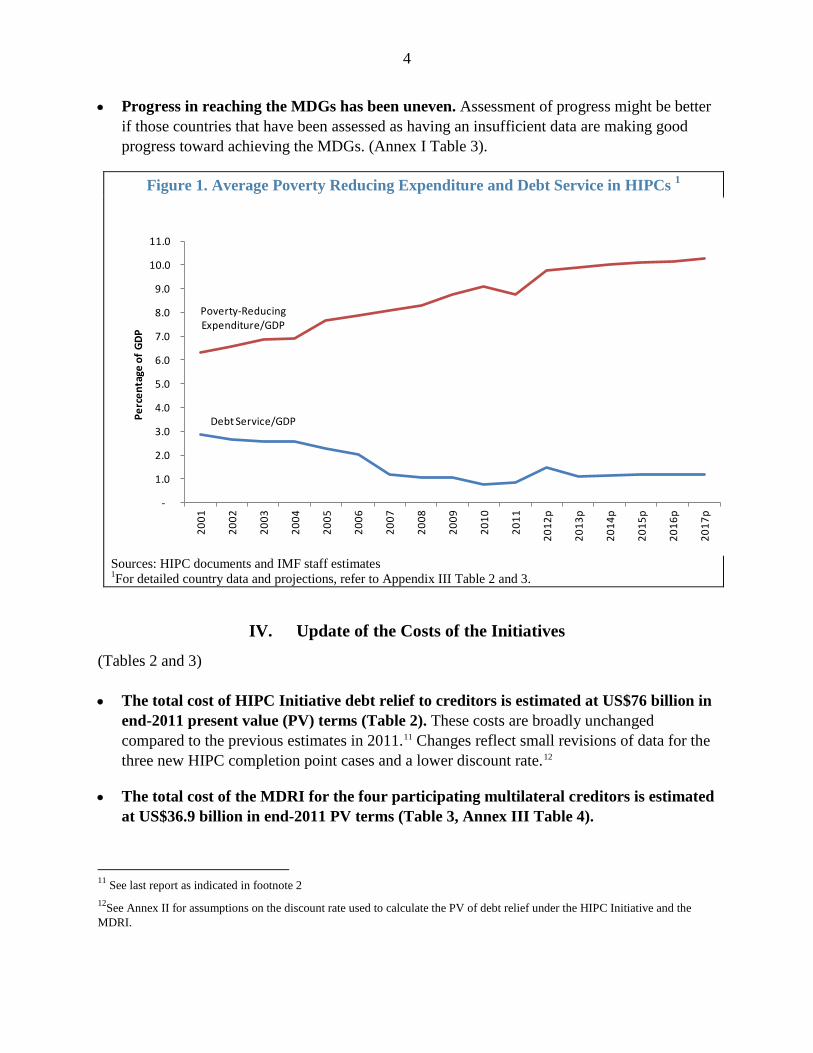
III. Debt Service Relief and Poverty Reducing Expenditure
(Figure 1, Annex I Table 3 and Annex III Tables 1, 2 and 3) • Debt relief under the initiatives has substantially alleviated debt burdens in recipient
countries and enabled them to increase their poverty reducing expenditure (Figure 1 and Annex III Table 1).
6Sudan Staff Report for the 2012 Article IV Consultation available at: http://www.imf.org/external/pubs/cat/longres.aspx?sk=40081.0 7 As of end-2012 arrears to the Fund and World Bank are US$1515.9 million and US$710 million respectively. 8 On January 22, 2013, the World Bank Board of Directors approved a US$440 million Reengagement and Reform Support Credit to Myanmar. The Credit supports critical reforms being implemented by the Government to strengthen macroeconomic stability, improve public financial management and improve the investment climate. Its proceeds will also help the Government meet its foreign exchange needs, including repaying a bridge loan provided to it by the Japan Bank for International Cooperation (JBIC) to clear arrears. 9Zimbabwe Staff Report for the 2012 Article IV Consultation available at: http://www.imf.org/external/pubs/cat/longres.aspx?sk=40026.0 10For the World Bank, the HIPC Initiative income criterion is bound by the end-2004 cutoff, i.e., any change in a country’s IDA status post-2004 is not a relevant consideration.
4
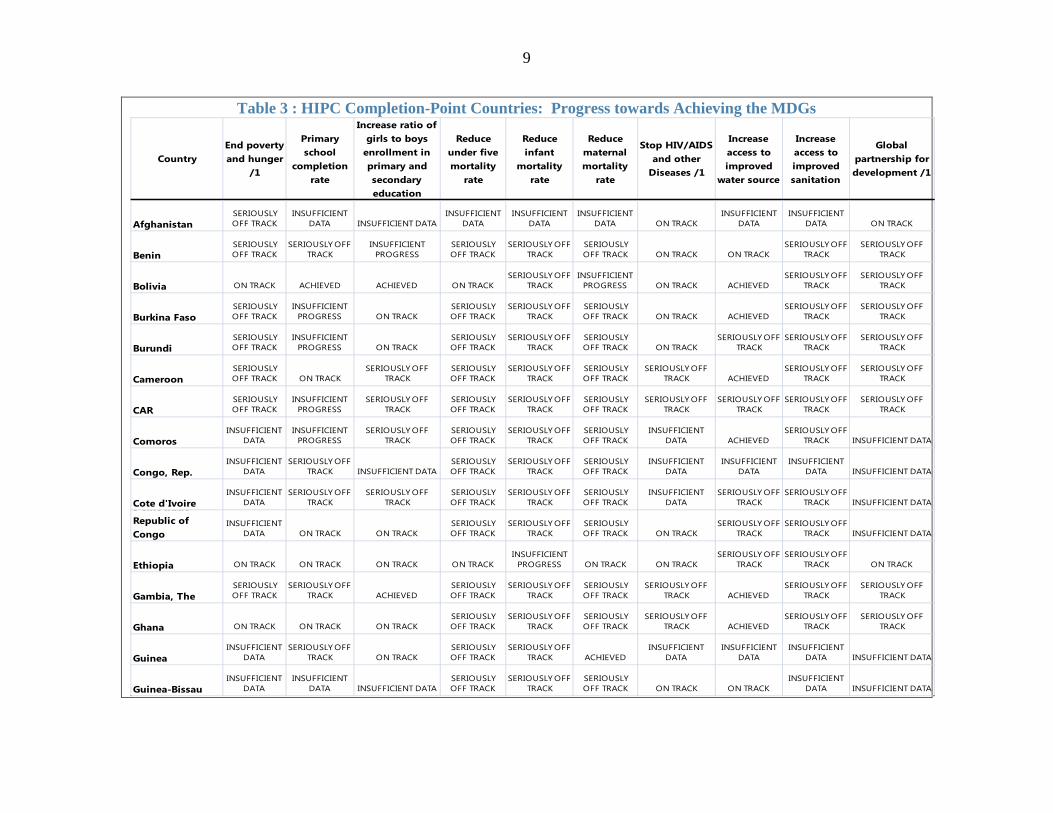
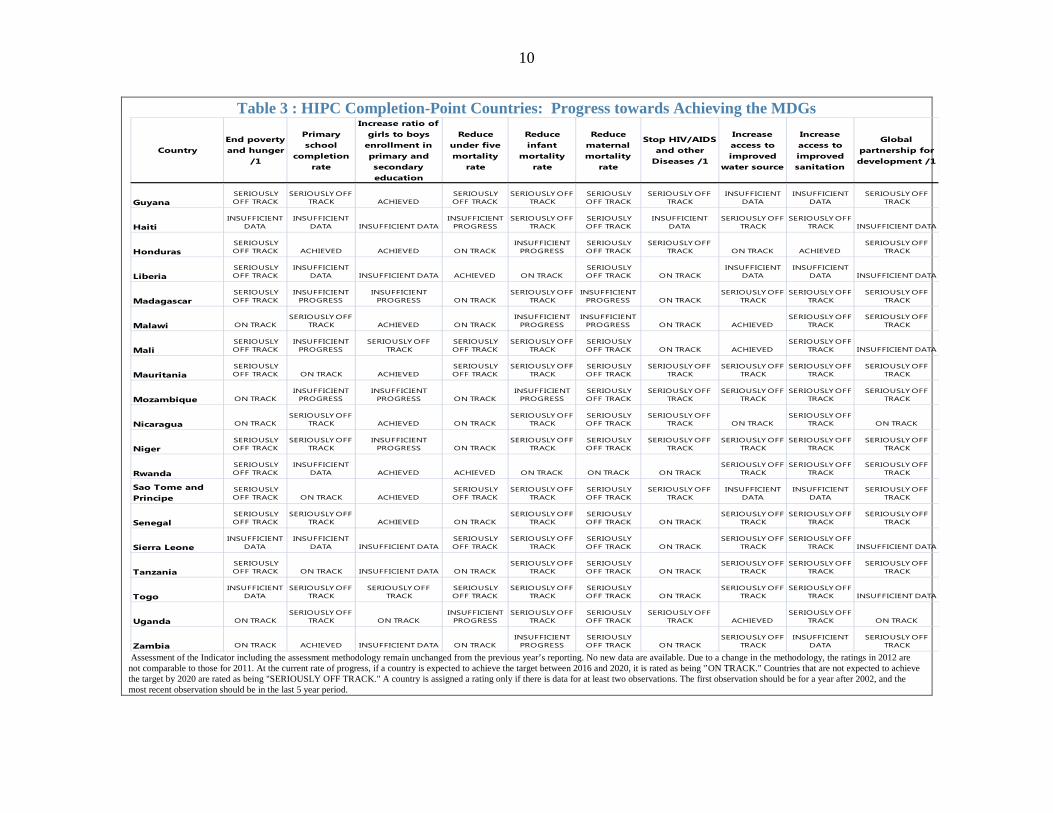
• Progress in reaching the MDGs has been uneven. Assessment of progress might be better if those countries that have been assessed as having an insufficient data are making good progress toward achieving the MDGs. (Annex I Table 3).
Figure 1. Average Poverty Reducing Expenditure and Debt Service in HIPCs 1
Sources: HIPC documents and IMF staff estimates 1For detailed country data and projections, refer to Appendix III Table 2 and 3.
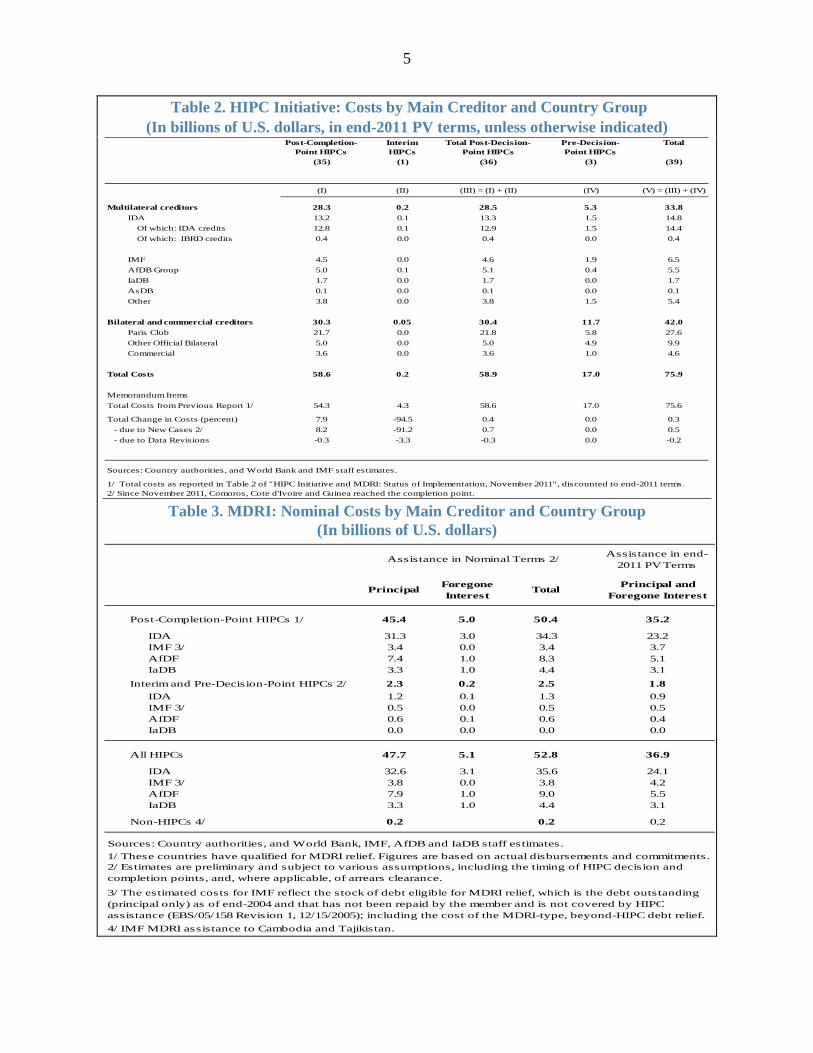
IV. Update of the Costs of the Initiatives
(Tables 2 and 3) • The total cost of HIPC Initiative debt relief to creditors is estimated at US$76 billion in
end-2011 present value (PV) terms (Table 2). These costs are broadly unchanged compared to the previous estimates in 2011.11 Changes reflect small revisions of data for the three new HIPC completion point cases and a lower discount rate.12
• The total cost of the MDRI for the four participating multilateral creditors is estimated at US$36.9 billion in end-2011 PV terms (Table 3, Annex III Table 4).
11 See last report as indicated in footnote 2 12See Annex II for assumptions on the discount rate used to calculate the PV of debt relief under the HIPC Initiative and the MDRI.
Debt Service/GDP
Poverty-Reducing Expenditure/GDP
-
1.0
2.0
3.0
4.0
5.0
6.0
7.0
8.0
9.0
10.0
11.0
2001
2002
2003
2004
2005
2006
2007
2008
2009
2010
2011
2012
p
2013
p
2014
p
2015
p
2016
p
2017
p
Perc
enta
ge o
f GDP
5
Table 2. HIPC Initiative: Costs by Main Creditor and Country Group (In billions of U.S. dollars, in end-2011 PV terms, unless otherwise indicated)
Table 3. MDRI: Nominal Costs by Main Creditor and Country Group
(In billions of U.S. dollars)
Post-Completion-Point HIPCs
Interim HIPCs
Total Post-Decision-Point HIPCs
Pre-Decision-Point HIPCs
Total
(35) (1) (36) (3) (39)
(I) (II) (III) = (I) + (II) (IV) (V) = (III) + (IV)
Multilateral creditors 28.3 0.2 28.5 5.3 33.8IDA 13.2 0.1 13.3 1.5 14.8 Of which: IDA credits 12.8 0.1 12.9 1.5 14.4 Of which: IBRD credits 0.4 0.0 0.4 0.0 0.4
IMF 4.5 0.0 4.6 1.9 6.5AfDB Group 5.0 0.1 5.1 0.4 5.5IaDB 1.7 0.0 1.7 0.0 1.7AsDB 0.1 0.0 0.1 0.0 0.1Other 3.8 0.0 3.8 1.5 5.4
Bilateral and commercial creditors 30.3 0.05 30.4 11.7 42.0Paris Club 21.7 0.0 21.8 5.8 27.6Other Official Bilateral 5.0 0.0 5.0 4.9 9.9Commercial 3.6 0.0 3.6 1.0 4.6
Total Costs 58.6 0.2 58.9 17.0 75.9
Memorandum ItemsTotal Costs from Previous Report 1/ 54.3 4.3 58.6 17.0 75.6
Total Change in Costs (percent) 7.9 -94.5 0.4 0.0 0.3- due to New Cases 2/ 8.2 -91.2 0.7 0.0 0.5- due to Data Revisions -0.3 -3.3 -0.3 0.0 -0.2
Sources: Country authorities, and World Bank and IMF staff estimates.
2/ Since November 2011, Comoros, Cote d'Ivoire and Guinea reached the completion point. 1/ Total costs as reported in Table 2 of "HIPC Initiative and MDRI: Status of Implementation, November 2011", discounted to end-2011 terms.
Assistance in end-2011 PV Terms
Principal Foregone Interest
Total Principal and Foregone Interest
Post-Completion-Point HIPCs 1/ 45.4 5.0 50.4 35.2
3 IDA 31.3 3.0 34.3 23.23 IMF 3/ 3.4 0.0 3.4 3.73 AfDF 7.4 1.0 8.3 5.13 IaDB 3.3 1.0 4.4 3.1
Interim and Pre-Decision-Point HIPCs 2/ 2.3 0.2 2.5 1.82 IDA 1.2 0.1 1.3 0.92 IMF 3/ 0.5 0.0 0.5 0.52 AfDF 0.6 0.1 0.6 0.42 IaDB 0.0 0.0 0.0 0.0
All HIPCs 47.7 5.1 52.8 36.9
IDA 32.6 3.1 35.6 24.1IMF 3/ 3.8 0.0 3.8 4.2AfDF 7.9 1.0 9.0 5.5IaDB 3.3 1.0 4.4 3.1
Non-HIPCs 4/ 0.2 0.2 0.2
Sources: Country authorities, and World Bank, IMF, AfDB and IaDB staff estimates.
4/ IMF MDRI assistance to Cambodia and Tajikistan.
Assistance in Nominal Terms 2/
1/ These countries have qualified for MDRI relief. Figures are based on actual disbursements and commitments. 2/ Estimates are preliminary and subject to various assumptions, including the timing of HIPC decision and completion points, and, where applicable, of arrears clearance.
3/ The estimated costs for IMF reflect the stock of debt eligible for MDRI relief, which is the debt outstanding (principal only) as of end-2004 and that has not been repaid by the member and is not covered by HIPC assistance (EBS/05/158 Revision 1, 12/15/2005); including the cost of the MDRI-type, beyond-HIPC debt relief.

6
V. Creditor Participation: Multilateral Creditors
(Annex III Tables 5, 6A, 6B, 7A, 7B, 8A, 8B, 9 and 10) • Over ninety-nine percent of multilateral creditors, estimated by their share in the total
cost of HIPC debt relief among multilateral creditors, have committed to participate in the HIPC Initiative (Table 5). A number of multilateral creditors receive support from the Debt Relief Trust Fund (DRTF), administered by IDA, to fulfill the provision of committed debt relief.13 As of end-December 2012, donors have contributed a total of US$6.6 billion to the DRTF. (Annex III Table 10). 14 The DRTF has accumulated investment income amounting to US$599 million and has disbursed about US$6.7 billion. The remaining amount of resources available in the DRTF (US$0.5 billion) including the amount of unpaid pledges15 is estimated to be sufficient to help finance the expected completion point debt relief costs to eligible creditors in respect to the Democratic Republic of Congo16 and the pre-completion point HIPCs.17
VI. Creditor Participation: Official Bilateral and Commercial Creditors
(Annex III Tables 11, 12, 13, 14, 15 and 16) • Paris Club creditors have committed to provide debt relief estimated at US$21.8 billion
in 2011 PV terms to the 36 countries that have reached their decision points (Tables 11 and 12). Most members of the Paris Club have also voluntarily committed to provide additional debt relief beyond that required under the HIPC Initiative (Tables 12 and 13).
• The share of debt relief attributable to the non-Paris Club official bilateral creditors is estimated at US$5.0 billion (2011 PV terms – Tables 14 and 15). So far, close to 50 percent of the debt relief has been delivered. Securing the participation of non-Paris Club official bilateral and private commercial creditors has been a challenge since the inception of the HIPC Initiative. Close to one third of the 55 non-Paris Club creditors reportedly have not participated in the HIPC initiative. Staffs of the World Bank and the IMF have continued to rely on the use of moral suasion and on the efforts by the HIPCs themselves to increase the participation of these creditors. (Table 15).
13 Eligible creditors include: AfDB, BOAD, CABEI, CDB, CMCF, EADB, FONPLATA, IaDB, IBRD, IFAD, IDA and NDF. 14 Annex Table 10 excludes contributions from AfDB, which are non-cash transactions. 15 This amount excludes US$98 million requested by the AfDB for post completion point debt relief to the Republic of Guinea. An amount of unpaid pledges totals US$98 million and includes US$23 million from Germany and US$75 million from the United States. 16 The Democratic Republic of Congo (DRC) reached the completion point in June 2010. DRTF provided AfDB a debt relief grant of US$425 million to support AfDB's provision of debt relief to DRC at completion point. However, the current low interest rate environment and AfDB’s subsequent lower than estimated income from the investment of the completion point grant proceeds are expected to lead to a financing gap of US$114 million that would not allow AfDB to reach its full share of the debt relief to DRC. 17 Future debt relief costs are based on current estimates of completion point dates, debt outstanding, as well as assumptions regarding the applicable discount rates. These estimates do not take into consideration possible additional debt relief costs to currently eligible HIPCs due to potential slippages in completion point dates or other factors, as well as granting of debt relief to countries such as Myanmar, the potential eligibility of which could not be assessed because of lack of data, or Zimbabwe, which currently does not meet the HIPC Initiative eligibility criteria.

7
ANNEX I. COUNTRY STATUS UNDER THE ENHANCED HIPC INITIATIVE
Table 1: HIPC Pre-Decision Point Countries
Country Recent Political DevelopmentRisk of Debt
DistressPRSP Status IMF Program and Macroeconomic Status
Decision Point Date
Eritrea Eritrea became independent in 1991 following a long conflict and remains afragile state. President Isaias Afewerki has been in power since independence;and his party, the Eritrean People’s Liberation Front, is the single political party..An unresolved border dispute with Ethiopia has dominated Eritrea’s relationswith its neighbors. The United Nations imposed sanctions against Eritrea in2009 for supporting the Somali al Shabab militias. In 2011 another UNresolution required strict scrutiny of the government’s use of resources fromthe exploitation of minerals.
In debt distress
12/1/2009
There is norecent PRSPand noongoing worktowards itspreparation.
There are no ongoing discussions on a Fund-supported program. The 2009 Article IV Consultation wasconcluded in December 2009.
Uncertain
Somalia The Federal Government of Somalia (FGS) was established on August 20th 2012, following the end of the Transitional Federal Government. The FGS has set outthree priority areas: judiciary, public financial management, and service delivery,and is interested in a Somali-led development agenda with collaboration frominternational partners. The economic, political, and security situation remainsfragile but with a renewed, albeit very cautious, sense of optimism.
N/A There is no PRSP and it is not expected to be prepared in the near term.
Somalia has not had a Fund-supported program since1987. Lack of economic data precludes an assessmentof the macroeconomic situation at present. Initialdiscussions are underway to inform and engageinternational partners on the steps that would berequired for re-engagement and arrears clearance,though no steps have been taken at present.
Uncertain
Sudan On July 9, 2011 South Sudan became independent following the results of areferendum in January 2011. Pending completion of the overall negotiations,the two parties agreed that the North (Sudan) would take on all debt as thecontinuing state, under two conditions: 1) the parties will undertake a jointoutreach to the creditors; 2) the international community will give a “firmcommitment” to debt relief. Negotiations have been on hold over much of thepast year, but the parties resumed negotiations in Addis Ababa on September03, 2012. A presidential Summit between Presidents Al-Bashir and Silva Kir(September 2012) was successful in brokering an economic cooperation. Therecent signature of the Implementation Modalities for Security Arrangementspaves the way for implementation of the oil agreement and the resolution ofthe Abyei and border issues for which a collaboration agreement has beensigned. At this stage, there is no significant progress for the HIPC process toofficially start.
In debt distress
9/1/2012
The Interim-PRSP was officially shared with the World Bank on November 22, 2012.
The 2012 Article IV consultation was concluded inSeptember 2012. Discussions on a successor Fund StaffMonitored Program (SMP) to support the government’s reform efforts have yet to start.
Within two years, but the starting date is unclear.

8
Table 2A: HIPC Decision-Point Countries: Status of Completion Point Triggers
Table 2B: HIPC Decision-Point Countries: Summary by Country
Country PRSP Macroeconomic Stability
Public Financial Management (PFM) Social Sector Debt
Management
Governance / Transparency / Anticorruption
Structural Reforms
Chad Partially completed
Weak progress Slow progress. Some progress in budget preparation, but execution continues to be slow in priority sectors. The public expenditure tracking survey for primary education is being undertaken.
Good progress on the education trigger but earlier made progress has been reversed on the health trigger. The quality of spending in health and education sectors remains a problem.
N/A Earlier made progress has deteriorated. The implementation of the governance strategy and action plan needs to be accelerated. Chad was accepted in April 2010 as an EITI candidate. However, progress is slow.
N/A
Country PRSP StatusRisk of Debt
DistressIMF Program
Completion Point Date (Planned)
Chad A PRSP covering the period from 2008 to 2011 was approved in April 2008. The PRSP and related Bank-Fund JSAN were discussed by the Bank and the IMF boards in May and June 2010, respectively. A new PRSP (National Development Plan) covering a period from 2013 to 2015 was approved by the Government in February 2013.
High 12/1/2012
The last PRGF-supported program, approved in February 2005 and later extended through May 2008, expired without completion of a review. A Staff-Monitored Program (SMP) for April-October 2009 also expired without completion of a review. Discussions on a new SMP in April 2012 were inconclusivebecause of the debt sustainability implications of the authorities’ decision to press ahead with the implementation of the non-concessional $2 billion Master Facility Agreement signed with the Eximbank of China in August 2011.
Uncertain
9
Table 3 : HIPC Completion-Point Countries: Progress towards Achieving the MDGs
CountryEnd poverty and hunger
/1
Primary school
completion rate
Increase ratio of girls to boys
enrollment in primary and secondary education
Reduce under five mortality
rate
Reduce infant
mortality rate
Reduce maternal mortality
rate
Stop HIV/AIDS and other
Diseases /1
Increase access to improved
water source
Increase access to improved sanitation
Global partnership for development /1
Afghanistan SERIOUSLY OFF TRACK
INSUFFICIENT DATA INSUFFICIENT DATA
INSUFFICIENT DATA
INSUFFICIENT DATA
INSUFFICIENT DATA ON TRACK
INSUFFICIENT DATA
INSUFFICIENT DATA ON TRACK
BeninSERIOUSLY OFF TRACK
SERIOUSLY OFF TRACK
INSUFFICIENT PROGRESS
SERIOUSLY OFF TRACK
SERIOUSLY OFF TRACK
SERIOUSLY OFF TRACK ON TRACK ON TRACK
SERIOUSLY OFF TRACK
SERIOUSLY OFF TRACK
Bolivia ON TRACK ACHIEVED ACHIEVED ON TRACKSERIOUSLY OFF
TRACKINSUFFICIENT
PROGRESS ON TRACK ACHIEVEDSERIOUSLY OFF
TRACKSERIOUSLY OFF
TRACK
Burkina FasoSERIOUSLY OFF TRACK
INSUFFICIENT PROGRESS ON TRACK
SERIOUSLY OFF TRACK
SERIOUSLY OFF TRACK
SERIOUSLY OFF TRACK ON TRACK ACHIEVED
SERIOUSLY OFF TRACK
SERIOUSLY OFF TRACK
BurundiSERIOUSLY OFF TRACK
INSUFFICIENT PROGRESS ON TRACK
SERIOUSLY OFF TRACK
SERIOUSLY OFF TRACK
SERIOUSLY OFF TRACK ON TRACK
SERIOUSLY OFF TRACK
SERIOUSLY OFF TRACK
SERIOUSLY OFF TRACK
CameroonSERIOUSLY OFF TRACK ON TRACK
SERIOUSLY OFF TRACK
SERIOUSLY OFF TRACK
SERIOUSLY OFF TRACK
SERIOUSLY OFF TRACK
SERIOUSLY OFF TRACK ACHIEVED
SERIOUSLY OFF TRACK
SERIOUSLY OFF TRACK
CARSERIOUSLY OFF TRACK
INSUFFICIENT PROGRESS
SERIOUSLY OFF TRACK
SERIOUSLY OFF TRACK
SERIOUSLY OFF TRACK
SERIOUSLY OFF TRACK
SERIOUSLY OFF TRACK
SERIOUSLY OFF TRACK
SERIOUSLY OFF TRACK
SERIOUSLY OFF TRACK
ComorosINSUFFICIENT
DATAINSUFFICIENT
PROGRESSSERIOUSLY OFF
TRACKSERIOUSLY OFF TRACK
SERIOUSLY OFF TRACK
SERIOUSLY OFF TRACK
INSUFFICIENT DATA ACHIEVED
SERIOUSLY OFF TRACK INSUFFICIENT DATA
Congo, Rep.INSUFFICIENT
DATASERIOUSLY OFF
TRACK INSUFFICIENT DATASERIOUSLY OFF TRACK
SERIOUSLY OFF TRACK
SERIOUSLY OFF TRACK
INSUFFICIENT DATA
INSUFFICIENT DATA
INSUFFICIENT DATA INSUFFICIENT DATA
Cote d'IvoireINSUFFICIENT
DATASERIOUSLY OFF
TRACKSERIOUSLY OFF
TRACKSERIOUSLY OFF TRACK
SERIOUSLY OFF TRACK
SERIOUSLY OFF TRACK
INSUFFICIENT DATA
SERIOUSLY OFF TRACK
SERIOUSLY OFF TRACK INSUFFICIENT DATADemocratic
Republic of Congo
INSUFFICIENT DATA ON TRACK ON TRACK
SERIOUSLY OFF TRACK
SERIOUSLY OFF TRACK
SERIOUSLY OFF TRACK ON TRACK
SERIOUSLY OFF TRACK
SERIOUSLY OFF TRACK INSUFFICIENT DATA
Ethiopia ON TRACK ON TRACK ON TRACK ON TRACKINSUFFICIENT
PROGRESS ON TRACK ON TRACKSERIOUSLY OFF
TRACKSERIOUSLY OFF
TRACK ON TRACK
Gambia, TheSERIOUSLY OFF TRACK
SERIOUSLY OFF TRACK ACHIEVED
SERIOUSLY OFF TRACK
SERIOUSLY OFF TRACK
SERIOUSLY OFF TRACK
SERIOUSLY OFF TRACK ACHIEVED
SERIOUSLY OFF TRACK
SERIOUSLY OFF TRACK
Ghana ON TRACK ON TRACK ON TRACKSERIOUSLY OFF TRACK
SERIOUSLY OFF TRACK
SERIOUSLY OFF TRACK
SERIOUSLY OFF TRACK ACHIEVED
SERIOUSLY OFF TRACK
SERIOUSLY OFF TRACK
GuineaINSUFFICIENT
DATASERIOUSLY OFF
TRACK ON TRACKSERIOUSLY OFF TRACK
SERIOUSLY OFF TRACK ACHIEVED
INSUFFICIENT DATA
INSUFFICIENT DATA
INSUFFICIENT DATA INSUFFICIENT DATA
Guinea-BissauINSUFFICIENT
DATAINSUFFICIENT
DATA INSUFFICIENT DATASERIOUSLY OFF TRACK
SERIOUSLY OFF TRACK
SERIOUSLY OFF TRACK ON TRACK ON TRACK
INSUFFICIENT DATA INSUFFICIENT DATA
10
Table 3 : HIPC Completion-Point Countries: Progress towards Achieving the MDGs
Assessment of the Indicator including the assessment methodology remain unchanged from the previous year’s reporting. No new data are available. Due to a change in the methodology, the ratings in 2012 are not comparable to those for 2011. At the current rate of progress, if a country is expected to achieve the target between 2016 and 2020, it is rated as being '’ON TRACK." Countries that are not expected to achieve the target by 2020 are rated as being "SERIOUSLY OFF TRACK." A country is assigned a rating only if there is data for at least two observations. The first observation should be for a year after 2002, and the most recent observation should be in the last 5 year period.
CountryEnd poverty and hunger
/1
Primary school
completion rate
Increase ratio of girls to boys
enrollment in primary and secondary education
Reduce under five mortality
rate
Reduce infant
mortality rate
Reduce maternal mortality
rate
Stop HIV/AIDS and other
Diseases /1
Increase access to improved
water source
Increase access to improved sanitation
Global partnership for development /1
GuyanaSERIOUSLY OFF TRACK
SERIOUSLY OFF TRACK ACHIEVED
SERIOUSLY OFF TRACK
SERIOUSLY OFF TRACK
SERIOUSLY OFF TRACK
SERIOUSLY OFF TRACK
INSUFFICIENT DATA
INSUFFICIENT DATA
SERIOUSLY OFF TRACK
HaitiINSUFFICIENT
DATAINSUFFICIENT
DATA INSUFFICIENT DATAINSUFFICIENT
PROGRESSSERIOUSLY OFF
TRACKSERIOUSLY OFF TRACK
INSUFFICIENT DATA
SERIOUSLY OFF TRACK
SERIOUSLY OFF TRACK INSUFFICIENT DATA
HondurasSERIOUSLY OFF TRACK ACHIEVED ACHIEVED ON TRACK
INSUFFICIENT PROGRESS
SERIOUSLY OFF TRACK
SERIOUSLY OFF TRACK ON TRACK ACHIEVED
SERIOUSLY OFF TRACK
LiberiaSERIOUSLY OFF TRACK
INSUFFICIENT DATA INSUFFICIENT DATA ACHIEVED ON TRACK
SERIOUSLY OFF TRACK ON TRACK
INSUFFICIENT DATA
INSUFFICIENT DATA INSUFFICIENT DATA
MadagascarSERIOUSLY OFF TRACK
INSUFFICIENT PROGRESS
INSUFFICIENT PROGRESS ON TRACK
SERIOUSLY OFF TRACK
INSUFFICIENT PROGRESS ON TRACK
SERIOUSLY OFF TRACK
SERIOUSLY OFF TRACK
SERIOUSLY OFF TRACK
Malawi ON TRACKSERIOUSLY OFF
TRACK ACHIEVED ON TRACKINSUFFICIENT
PROGRESSINSUFFICIENT
PROGRESS ON TRACK ACHIEVEDSERIOUSLY OFF
TRACKSERIOUSLY OFF
TRACK
MaliSERIOUSLY OFF TRACK
INSUFFICIENT PROGRESS
SERIOUSLY OFF TRACK
SERIOUSLY OFF TRACK
SERIOUSLY OFF TRACK
SERIOUSLY OFF TRACK ON TRACK ACHIEVED
SERIOUSLY OFF TRACK INSUFFICIENT DATA
MauritaniaSERIOUSLY OFF TRACK ON TRACK ACHIEVED
SERIOUSLY OFF TRACK
SERIOUSLY OFF TRACK
SERIOUSLY OFF TRACK
SERIOUSLY OFF TRACK
SERIOUSLY OFF TRACK
SERIOUSLY OFF TRACK
SERIOUSLY OFF TRACK
Mozambique ON TRACKINSUFFICIENT
PROGRESSINSUFFICIENT
PROGRESS ON TRACKINSUFFICIENT
PROGRESSSERIOUSLY OFF TRACK
SERIOUSLY OFF TRACK
SERIOUSLY OFF TRACK
SERIOUSLY OFF TRACK
SERIOUSLY OFF TRACK
Nicaragua ON TRACKSERIOUSLY OFF
TRACK ACHIEVED ON TRACKSERIOUSLY OFF
TRACKSERIOUSLY OFF TRACK
SERIOUSLY OFF TRACK ON TRACK
SERIOUSLY OFF TRACK ON TRACK
NigerSERIOUSLY OFF TRACK
SERIOUSLY OFF TRACK
INSUFFICIENT PROGRESS ON TRACK
SERIOUSLY OFF TRACK
SERIOUSLY OFF TRACK
SERIOUSLY OFF TRACK
SERIOUSLY OFF TRACK
SERIOUSLY OFF TRACK
SERIOUSLY OFF TRACK
RwandaSERIOUSLY OFF TRACK
INSUFFICIENT DATA ACHIEVED ACHIEVED ON TRACK ON TRACK ON TRACK
SERIOUSLY OFF TRACK
SERIOUSLY OFF TRACK
SERIOUSLY OFF TRACK
Sao Tome and Principe
SERIOUSLY OFF TRACK ON TRACK ACHIEVED
SERIOUSLY OFF TRACK
SERIOUSLY OFF TRACK
SERIOUSLY OFF TRACK
SERIOUSLY OFF TRACK
INSUFFICIENT DATA
INSUFFICIENT DATA
SERIOUSLY OFF TRACK
SenegalSERIOUSLY OFF TRACK
SERIOUSLY OFF TRACK ACHIEVED ON TRACK
SERIOUSLY OFF TRACK
SERIOUSLY OFF TRACK ON TRACK
SERIOUSLY OFF TRACK
SERIOUSLY OFF TRACK
SERIOUSLY OFF TRACK
Sierra LeoneINSUFFICIENT
DATAINSUFFICIENT
DATA INSUFFICIENT DATASERIOUSLY OFF TRACK
SERIOUSLY OFF TRACK
SERIOUSLY OFF TRACK ON TRACK
SERIOUSLY OFF TRACK
SERIOUSLY OFF TRACK INSUFFICIENT DATA
TanzaniaSERIOUSLY OFF TRACK ON TRACK INSUFFICIENT DATA ON TRACK
SERIOUSLY OFF TRACK
SERIOUSLY OFF TRACK ON TRACK
SERIOUSLY OFF TRACK
SERIOUSLY OFF TRACK
SERIOUSLY OFF TRACK
TogoINSUFFICIENT
DATASERIOUSLY OFF
TRACKSERIOUSLY OFF
TRACKSERIOUSLY OFF TRACK
SERIOUSLY OFF TRACK
SERIOUSLY OFF TRACK ON TRACK
SERIOUSLY OFF TRACK
SERIOUSLY OFF TRACK INSUFFICIENT DATA
Uganda ON TRACKSERIOUSLY OFF
TRACK ON TRACKINSUFFICIENT
PROGRESSSERIOUSLY OFF
TRACKSERIOUSLY OFF TRACK
SERIOUSLY OFF TRACK ACHIEVED
SERIOUSLY OFF TRACK ON TRACK
Zambia ON TRACK ACHIEVED INSUFFICIENT DATA ON TRACKINSUFFICIENT
PROGRESSSERIOUSLY OFF TRACK ON TRACK
SERIOUSLY OFF TRACK
INSUFFICIENT DATA
SERIOUSLY OFF TRACK

11
ANNEX II. COUNTRY COVERAGE, DATA SOURCES, AND ASSUMPTIONS FOR
THE HIPC INITIATIVE AND MDRI COSTING EXERCISE
A. Country Coverage
• The costing analysis for the 36 post-decision-point countries includes: Afghanistan, Benin, Bolivia, Burkina Faso, Burundi, Cameroon, Central African Republic, Chad, Côte d’Ivoire, Comoros, Democratic Republic of the Congo, Republic of Congo, Ethiopia, The Gambia, Ghana, Guinea, Guinea-Bissau, Guyana, Haiti, Honduras, Liberia, Madagascar, Malawi, Mali, Mauritania, Mozambique, Nicaragua, Niger, Rwanda, São Tomé and Príncipe, Senegal, Sierra Leone, Tanzania, Togo, Uganda, and Zambia.
• The costing analysis for the pre-decision-point countries is based on 3 HIPCs: Eritrea, Somalia, and Sudan
B. Data Sources
• Staff estimates are based on HIPC Initiative decision and completion-point documents for all 36 post-decision-point countries or estimates presented in Heavily Indebted Poor Countries (HIPC Initiative) – List of Ring-Fenced Countries that Meet the Income and Indebtedness Criteria at end-2004 for the 3 pre-decision-point HIPCs.
• Data was updated through end-December 2012.
C. Assumptions for the HIPC Initiative and MDRI Costing Exercise
• Calculations of total costs include costs under the original and enhanced HIPC Initiative frameworks and the MDRI.
• Cost estimates for the HIPC Initiative are based on debt data after full use of traditional debt-relief mechanisms.
• The following exchange rates have been used for the MDRI calculations:
⋅ IDA and AfDF. The initial MDRI Trust Fund replenishment rate of 1.477380 US dollars per SDR was applied for the period FY07- FY08. Cost estimates for FY09-FY11 (corresponding to the period covered by the IDA 15 replenishment round) are based on the IDA15 foreign exchange reference rate of 1.524480 US dollars per SDR. Cost estimates for FY11 onward are based on the IDA16 foreign exchange reference rate of 1.50233 U.S. dollars per SDR.

12
⋅ IMF. The exchange rate of the date that debt relief was delivered, and, in cases where debt was not yet delivered, the rate as of end-December 2011 was used.
⋅ IaDB. Currency units in US dollars at end-2006.
D. Update of Cost Estimates in Present Value Terms
• The cost of HIPC Initiative assistance calculated in PV terms at the time of the decision-point is discounted to end-2011 using the average interest rate applicable to the debt relief. This rate was estimated at 3.37 percent and corresponds to the implicit long-term interest rate of currencies that comprise the SDR basket over the period 2009–2011, calculated as a 6-month average of the Commercial Interest Reference Rate (CIRR) over this period, weighted by the participation of the currencies in the SDR basket. The same rate was used to calculate MDRI debt relief in end-2011 PV terms.

13
ANNEX III. TABLES
Table 1. Summary of Debt Service and Poverty Reducing Expenditures 2001-2017 1
(In millions of U.S. dollars, unless otherwise indicated)
2001 2002 2003 2004 2005 2006 2007 2008 2009 2010 2011 2012 2013 2014 2015 2016 2017Prel. Projections
Debt Service Paid 2/ 3,390 4,001 4,506 5,081 4,896 3,586 3,005 3,233 3,222 2,747 3,490 5,258 5,121 5,619 6,524 7,247 8,611
Poverty Reducing Expenditures 3/ 6,591 7,492 8,700 10,805 14,944 18,475 22,645 27,620 30,000 32,562 33,310 35,822 37,474 37,500 40,039 43,257 43,803
Average Ratios (in percent)
Debt Service/Exports 14.5 13.8 12.5 12.7 9.8 9.9 5.0 4.5 4.5 2.9 3.1 5.4 4.5 4.7 4.6 4.7 4.6 Debt Service/GDP 2.9 2.7 2.6 2.6 2.3 2.0 1.2 1.1 1.1 0.8 0.9 1.5 1.1 1.2 1.2 1.2 1.2 Poverty-Reducing Expenditure/Government Revenue 3/ 46.4 47.5 46.3 43.7 47.9 48.4 46.3 50.0 53.1 50.7 48.7 50.2 51.0 52.9 53.3 53.5 51.2 Poverty-Reducing Expenditure/GDP 3/ 6.3 6.6 6.9 6.9 7.6 7.9 8.1 8.3 8.8 9.1 8.8 9.8 9.9 10.0 10.1 10.2 10.3
Sources: HIPC country documents, and World Bank and IMF staff estimates.1/ Data refer to 36 post-decision-point HIPCs, unless specified otherwise.
3/ As defined in PRSPs; excludes data for years in countries for which data is not available. See Appendix Table 3 for a country breakdown.
2/ Debt service paid covers 2001-2011, and debt service due covers 2012-2017. For post-completion point HIPCs, debt service due reflects the negotiated relief by the debtor countries , additional debt relief, provided by some Paris Club Creditors on a voluntary basis, and MDRI (countries that have reached the completition point in the more recent years, debt service projections assume full HIPC Initiative debt relief along with additional debt relief by the Paris Club and MDRI). For pre-completion-point countries, debt service due includes interim debt relief and full HIPC Initiative and MDRI assistance expected at the projected completion point. See Appendix Table 2 for a detailed breakdown.

14
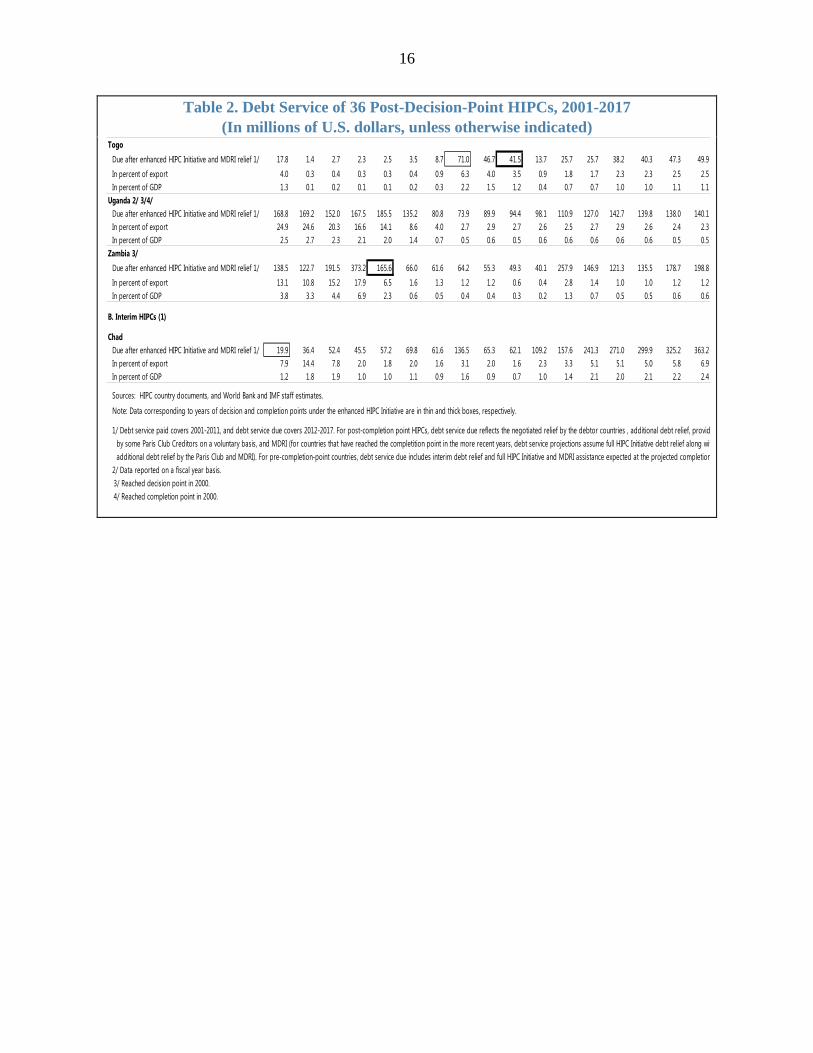
Table 2. Debt Service of 36 Post-Decision-Point HIPCs, 2001-2017 (In millions of U.S. dollars, unless otherwise indicated)
2001 2002 2003 2004 2005 2006 2007 2008 2009 2010 2011 2012 2013 2014 2015 2016 2017Prel.
A. Post-Completion-Point HIPCs (35)
AfghanistanDue after enhanced HIPC Initiative and MDRI relief 1/ ... 1.1 7.5 7.7 9.2 11.0 12.3 12.8 18.6 12.4 13.3 22.4 36.2 57.9 46.4 50.4 50.8 In percent of export ... 0.1 0.4 0.4 0.5 0.6 0.6 0.5 0.7 0.4 0.4 0.7 1.2 1.9 1.4 1.3 1.1 In percent of GDP ... 0.0 0.2 0.1 0.1 0.2 0.1 0.1 0.1 0.1 0.1 0.1 0.2 0.3 0.2 0.2 0.2
Benin 3/Due after enhanced HIPC Initiative and MDRI relief 1/ 56.7 62.3 66.3 58.1 38.0 63.0 88.1 29.4 37.4 48.3 54.8 62.2 68.6 79.9 87.8 90.2 91.8In percent of export 15.2 16.1 13.6 10.1 7.0 10.1 9.4 2.5 3.5 3.6 5.0 5.5 5.5 5.9 6.0 5.8 5.2In percent of GDP 2.3 2.2 1.9 1.4 0.9 1.3 1.6 0.4 0.6 0.7 0.8 0.8 0.8 0.9 1.0 0.9 0.8
Bolivia 3/Due after enhanced HIPC Initiative and MDRI relief 1/ 259.8 340.4 383.2 392.4 407.0 355.2 341.7 270.1 278.6 273.8 313.1 334.7 361.8 357.6 391.9 433.2 437.3In percent of export 17.1 21.9 19.5 15.2 12.3 8.0 6.8 3.8 5.1 3.8 3.4 3.3 3.3 3.1 3.3 3.6 3.5In percent of GDP 3.2 4.3 4.7 4.5 4.3 3.1 2.6 1.6 1.6 1.4 1.3 1.3 1.3 1.2 1.2 1.3 1.2
Burkina Faso 3/Due after enhanced HIPC Initiative and MDRI relief 1/ 35.1 33.5 48.9 45.7 44.5 41.3 45.7 47.3 49.0 51.2 71.2 74.3 91.9 106.4 156.0 162.8 164.6In percent of export 14.8 12.4 14.5 8.3 8.3 6.2 6.4 5.7 4.6 2.7 2.7 2.6 3.1 3.2 4.2 3.8 3.5In percent of GDP 1.2 1.0 1.2 0.9 0.8 0.7 0.7 0.6 0.6 0.6 0.7 0.7 0.8 0.9 1.2 1.1 1.1
Burundi Due after enhanced HIPC Initiative and MDRI relief 1/ 14.2 28.5 23.6 64.8 31.7 10.7 5.6 3.3 1.7 1.5 4.6 14.0 23.4 28.6 32.9 34.2 32.2In percent of export 31.4 73.6 47.2 101.9 34.3 11.5 6.1 3.2 1.7 1.2 3.5 10.9 21.4 24.0 25.4 27.0 23.7In percent of GDP 1.7 4.0 3.0 7.1 2.6 0.8 0.4 0.2 0.1 0.1 0.2 0.6 0.8 0.9 1.0 0.9 0.8
Cameroon 3/Due after enhanced HIPC Initiative and MDRI relief 1/ 260.9 240.4 284.8 259.1 406.2 260.1 101.6 102.1 79.9 54.4 69.2 71.1 85.9 98.8 135.6 131.4 ...In percent of export 9.6 8.8 8.7 7.2 10.0 5.1 1.6 1.4 1.5 0.9 1.0 1.0 1.1 1.1 1.4 1.2 ...In percent of GDP 2.8 2.2 2.1 1.6 2.4 1.4 0.5 0.4 0.4 0.2 0.3 0.3 0.3 0.3 0.4 0.4 ...
Central African RepublicDue after enhanced HIPC Initiative and MDRI relief 1/ 32.3 43.3 45.9 46.6 27.9 41.0 36.0 42.9 48.3 10.7 11.0 24.8 22.8 25.6 34.9 40.6 28.8In percent of export 20.2 26.8 29.8 26.7 16.2 19.6 15.0 19.6 25.6 5.1 4.1 9.9 8.6 9.2 11.2 12.0 7.9In percent of GDP 3.6 4.5 4.1 3.7 2.1 2.8 2.1 2.2 2.4 0.5 0.5 1.2 1.0 1.1 1.3 1.5 1.0
ComorosDue after enhanced HIPC Initiative and MDRI relief 1/ 2.5 2.4 2.6 4.4 4.1 3.5 6.0 9.1 8.4 5.9 1.6 2.4 2.2 2.2 2.3 2.4 ...In percent of export 7.3 6.0 4.9 8.3 7.9 6.5 9.2 12.8 11.0 7.2 1.9 2.5 2.1 2.0 1.9 1.8 ...In percent of GDP 1.1 0.9 0.8 1.2 1.1 0.9 1.3 1.7 1.6 1.0 0.3 0.4 0.3 0.3 0.3 0.3 ...
Congo, Democratic Republic of Due after enhanced HIPC Initiative and MDRI relief 1/ ... 34.2 363.79 175.4 373.0 213.1 170.7 254.4 187.9 177.0 160.0 159.6 216.2 190.6 233.5 266.7 282.3In percent of export ... 2.9 24.0 8.7 15.4 7.1 2.6 3.6 3.7 2.0 1.5 1.6 1.9 1.5 1.7 1.8 1.6In percent of GDP ... 0.6 6.4 2.7 5.2 2.4 1.7 2.2 1.7 1.3 1.0 0.9 1.1 0.9 1.0 1.1 1.1
Congo, Republic ofDue after enhanced HIPC Initiative and MDRI relief 1/ 183.6 230.6 158.4 222.7 607.8 563.5 389.2 217.7 539.1 145.3 139.3 179.3 166.5 172.2 139.7 142.1 142.7In percent of export 8.3 9.3 5.2 6.5 11.8 8.3 5.9 2.4 8.0 1.4 1.1 1.5 1.4 1.5 1.2 1.2 1.1In percent of GDP 6.6 7.6 4.5 4.8 10.0 7.3 4.6 1.8 5.6 1.2 1.0 1.3 1.2 1.2 0.8 0.8 0.7
Cote d'IvoireDue after enhanced HIPC Initiative and MDRI relief 1/ ... 1.9 274.5 189.5 118.0 72.0 240.8 318.6 243.9 313.5 167.6 256.0 489.9 664.4 768.5 811.0 892.0In percent of export ... 0.03 4.4 2.5 1.4 0.8 2.5 2.8 2.1 2.5 1.3 2.1 3.6 4.5 4.8 4.7 4.7In percent of GDP ... 0.02 2.0 1.2 0.7 0.4 1.2 1.4 1.1 1.4 0.7 1.0 1.8 2.3 2.4 2.3 2.4
Ethiopia 2/Due after enhanced HIPC Initiative and MDRI relief 1/ 195.7 101.3 86.5 80.4 39.8 41.5 86.0 89.2 77.2 111.3 241.9 460.2 518.7 704.1 914.0 1,058.3 1,232.9In percent of export 20.0 10.3 7.6 5.4 2.1 2.0 3.5 2.9 2.3 2.8 4.5 7.7 7.5 9.2 10.6 10.8 11.4In percent of GDP 2.4 1.3 1.0 0.8 0.3 0.3 0.5 0.3 0.3 0.4 0.8 1.1 1.1 1.4 1.7 1.8 1.9
The Gambia 3/Due after enhanced HIPC Initiative and MDRI relief 1/ 20.8 34.3 16.8 23.8 24.4 25.3 26.5 20.9 19.3 19.9 19.2 21.1 24.7 25.6 26.5 27.6 28.8In percent of export 12.8 20.1 10.1 12.0 11.9 11.4 11.5 9.2 8.4 8.8 7.4 8.1 8.8 8.5 8.1 7.8 7.5In percent of GDP 3.4 6.4 3.2 4.1 3.9 3.9 3.3 2.2 2.1 2.1 2.1 2.3 2.4 2.4 2.3 2.2 2.2
GhanaDue after enhanced HIPC Initiative and MDRI relief 1/ 463.9 446.1 442.0 532.4 573.6 601.6 225.9 358.5 349.1 369.5 462.7 785.2 642.4 518.9 597.3 649.0 1,537.3In percent of export 19.3 17.1 13.8 15.6 14.7 12.2 3.8 5.1 4.6 3.9 3.2 4.7 3.6 2.8 3.1 3.1 6.9In percent of GDP 6.2 4.7 4.0 3.7 3.3 2.9 0.9 1.3 1.4 1.1 1.2 2.0 1.5 1.0 1.1 1.1 2.3
Guinea 3/Due after enhanced HIPC Initiative and MDRI relief 1/ 103.7 108.6 102.5 98.2 143.5 149.1 145.0 138.9 80.2 57.6 138.8 127.6 55.5 53.4 62.5 74.0 75.5In percent of export 12.8 13.9 11.5 10.9 14.0 12.7 12.1 8.8 6.5 4.1 8.9 7.9 3.4 3.1 2.0 1.6 1.2In percent of GDP 3.7 3.7 3.0 2.7 4.9 5.1 3.5 3.1 1.7 1.2 2.7 2.2 0.9 0.9 0.8 0.8 0.7
Projections
15
Table 2. Debt Service of 36 Post-Decision-Point HIPCs, 2001-2017 (In millions of U.S. dollars, unless otherwise indicated)
2001 2002 2003 2004 2005 2006 2007 2008 2009 2010 2011 2012 2013 2014 2015 2016Prel. Projections
Guinea-Bissau 3/Due after enhanced HIPC Initiative and MDRI relief 1/ 1.4 2.6 5.7 6.2 4.2 5.1 5.6 4.1 11.3 2.6 0.9 1.5 6.0 13.5 13.7 13.8 9.3In percent of export 2.0 4.1 7.6 7.5 4.2 6.0 4.7 3.0 8.7 1.9 0.4 1.1 3.3 6.2 6.1 5.9 3.7In percent of GDP 0.4 0.6 1.2 1.2 0.7 0.9 0.8 0.5 1.4 0.3 0.1 0.2 0.6 1.3 1.2 1.1 0.7
Guyana 3/Due after enhanced HIPC Initiative and MDRI relief 1/ 57.1 45.2 51.2 45.3 35.3 27.6 19.0 20.5 17.5 28.7 40.0 287.7 37.5 42.8 57.5 79.8 88.4In percent of export 8.6 6.8 7.6 6.2 5.1 3.8 2.3 2.1 1.8 2.6 2.8 18.5 2.3 2.4 3.0 4.0 4.1In percent of GDP 5.1 3.8 4.3 3.6 2.7 1.9 1.1 1.1 0.9 1.3 1.6 10.3 1.2 1.3 1.6 2.1 2.2
Haiti 2/Due after enhanced HIPC Initiative and MDRI relief 1/ 36.6 40.7 67.0 48.4 104.2 52.1 65.2 68.5 36.1 18.8 9.0 19.1 37.4 62.1 88.2 119.9 ...In percent of export 8.3 9.3 14.3 9.5 17.3 7.5 8.3 8.2 3.9 2.3 0.9 1.8 3.2 4.8 6.2 7.8 ...In percent of GDP 1.0 1.2 2.3 1.4 2.4 1.1 1.1 1.0 0.5 0.3 0.1 0.2 0.4 0.5 0.7 0.9 ...
Honduras 3/Due after enhanced HIPC Initiative and MDRI relief 1/ 189.6 224.6 232.6 329.7 365.0 134.4 201.1 131.0 219.8 104.5 173.3 148.9 147.1 186.3 251.8 283.4 326.3In percent of export 4.8 5.2 5.4 6.4 6.4 2.2 3.1 1.8 3.8 1.5 2.0 1.6 1.6 1.9 2.5 2.8 3.1In percent of GDP 2.5 2.9 2.8 3.7 3.8 1.2 1.6 0.9 1.5 0.7 1.0 0.8 0.8 0.9 1.2 1.3 1.5
Liberia 2/Due after enhanced HIPC Initiative and MDRI relief 1/ 0.6 ... ... 0.6 0.6 1.2 0.2 0.7 0.5 4.2 6.2 7.4 8.6 12.9 16.3 20.1 22.4In percent of export 0.3 ... ... 0.2 0.2 0.2 0.0 0.1 0.1 0.8 0.9 0.9 1.0 1.5 1.3 1.6 1.8In percent of GDP 0.1 ... ... 0.1 0.1 0.2 0.0 0.1 0.0 0.3 0.4 0.4 0.5 0.6 0.7 0.8 0.9
Madagascar 3/Due after enhanced HIPC Initiative and MDRI relief 1/ 46.7 54.6 69.0 71.2 68.9 81.8 22.3 63.2 47.7 64.3 81.2 84.3 84.9 90.3 91.5 93.8 96.3In percent of export 3.5 7.7 5.6 5.0 5.1 5.0 1.0 2.5 2.5 3.1 3.1 3.1 2.6 2.5 2.3 2.1 1.9In percent of GDP 1.0 1.2 1.3 1.6 1.4 1.5 0.3 0.7 0.6 0.7 0.8 0.8 0.8 0.8 0.8 0.7 0.7
Malawi 3/Due after enhanced HIPC Initiative and MDRI relief 1/ 93.7 78.7 94.8 102.7 103.1 86.3 16.1 12.8 13.3 17.5 26.7 33.0 38.3 59.0 62.4 66.5 61.5In percent of export 19.5 17.0 20.0 19.0 18.5 14.3 1.8 1.2 1.3 1.3 2.1 2.6 2.6 3.7 3.6 3.6 3.1In percent of GDP 5.5 3.0 3.9 3.9 3.7 2.8 0.4 0.3 0.3 0.3 0.4 0.8 1.0 1.4 1.4 1.4 1.2
Mali 3/Due after enhanced HIPC Initiative and MDRI relief 1/ 79.0 67.3 67.2 78.2 57.5 46.9 109.0 108.7 76.0 90.3 71.7 57.4 118.7 137.3 153.8 162.8 174.6In percent of export 9.0 6.3 5.8 6.5 4.3 2.6 5.6 4.2 3.6 3.7 2.6 1.8 3.6 4.0 4.4 4.6 4.9In percent of GDP 2.6 2.1 1.6 1.6 1.0 0.8 1.5 1.2 0.8 1.0 0.7 0.6 1.1 1.2 1.3 1.2 1.2
Mauritania 3/Due after enhanced HIPC Initiative and MDRI relief 1/ 33.8 28.9 28.9 22.0 30.4 26.4 57.9 85.9 112.4 66.7 103.3 117.6 151.8 160.9 165.6 183.3 193.7In percent of export 9.5 8.7 9.1 5.0 4.9 1.8 3.9 4.5 7.4 3.0 3.4 4.4 5.5 6.2 4.8 5.0 5.0In percent of GDP 3.0 2.5 2.2 1.5 1.6 0.9 2.1 2.4 3.7 1.8 2.4 2.8 3.4 3.5 2.8 2.9 2.8
Mozambique 3/Due after enhanced HIPC Initiative and MDRI relief 1/ 27.1 62.0 71.8 58.1 66.6 23.3 35.1 81.1 49.5 58.9 75.0 139.7 149.7 198.8 224.0 280.8 382.3In percent of export 2.8 5.4 5.3 3.3 3.2 0.8 1.2 2.5 1.8 2.0 2.0 3.2 2.9 3.6 3.8 3.9 4.4In percent of GDP 0.7 1.5 1.5 1.0 1.0 0.3 0.4 0.8 0.5 0.6 0.6 1.0 0.9 1.2 1.2 1.3 1.6
Nicaragua 3/Due after enhanced HIPC Initiative and MDRI relief 1/ 153.3 158.0 98.3 76.3 87.2 98.3 90.5 100.0 114.0 102.7 103.0 132.3 150.6 170.4 194.2 222.3 199.3In percent of export 13.7 13.9 7.5 4.6 4.4 4.1 3.3 3.3 4.0 2.8 2.2 2.5 2.7 2.9 3.0 3.3 2.6In percent of GDP 2.9 3.0 1.8 1.3 1.4 1.4 1.2 1.2 1.4 1.2 1.1 1.3 1.4 1.5 1.6 1.8 1.5
Niger 3/Due after enhanced HIPC Initiative and MDRI relief 1/ 32.6 48.8 45.3 43.1 31.6 13.8 14.5 19.1 18.7 15.4 28.7 414.5 85.3 67.6 67.4 72.7 75.8In percent of export 9.9 14.1 10.9 8.1 5.6 2.3 1.9 1.8 1.7 1.2 2.0 25.8 4.9 3.2 3.1 3.1 2.8In percent of GDP 1.8 2.4 1.7 1.5 0.9 0.4 0.3 0.4 0.4 0.3 0.5 6.4 1.3 0.9 0.8 0.8 0.8
Rwanda 3/Due after enhanced HIPC Initiative and MDRI relief 1/ 22.2 15.9 15.5 19.9 14.5 10.2 10.1 8.8 9.5 16.2 43.5 215.2 130.1 71.9 79.9 77.1 185.4In percent of export 11.2 8.6 8.2 7.2 4.4 2.9 2.4 1.3 1.7 2.7 4.9 24.1 14.5 8.0 8.9 8.6 20.7In percent of GDP 1.3 1.0 0.8 0.9 0.6 0.3 0.3 0.2 0.2 0.3 0.7 3.1 1.7 0.8 0.9 0.8 1.7
São Tome and Principe 3/Due after enhanced HIPC Initiative and MDRI relief 1/ 2.7 2.2 2.8 3.3 7.0 25.1 3.3 1.9 1.6 1.6 2.4 3.5 4.1 4.7 5.4 4.3 5.7In percent of export 24.1 14.8 17.5 21.6 44.0 155.7 24.7 10.9 8.3 6.4 8.0 10.3 11.1 10.8 2.9 1.0 1.1In percent of GDP 3.5 2.6 2.7 2.9 5.7 18.6 2.3 1.0 0.8 0.8 0.9 1.3 1.4 1.4 1.2 0.6 0.7
Senegal 3/Due after enhanced HIPC Initiative and MDRI relief 1/ 168.6 213.1 264.1 799.7 299.3 178.2 163.6 151.7 155.3 185.1 501.4 280.0 292.0 261.1 262.4 292.1 307.3In percent of export 12.0 13.9 14.4 36.6 12.7 7.4 5.7 4.3 5.0 5.7 14.0 8.3 8.4 7.3 6.9 7.1 7.0In percent of GDP 3.5 4.0 3.8 9.9 3.4 1.9 1.4 1.1 1.2 1.4 3.5 2.0 2.0 1.7 1.6 1.6 1.6
Sierra Leone 3/Due after enhanced HIPC Initiative and MDRI relief 1/ 94.2 14.3 14.3 24.5 25.9 18.6 15.0 41.1 15.1 16.0 19.9 24.0 35.8 48.2 55.3 61.2 65.0In percent of export 73.0 8.7 6.2 9.9 8.9 5.2 4.3 11.0 4.5 3.8 4.3 2.5 2.3 2.4 2.4 2.6 2.7In percent of GDP 8.8 1.2 1.0 1.7 1.6 1.0 0.7 1.7 0.6 0.6 0.7 0.6 0.9 1.0 1.1 1.1 1.1
Tanzania 2/ 3/Due after enhanced HIPC Initiative and MDRI relief 1/ 376.6 905.8 671.7 562.0 334.8 30.2 42.5 73.5 48.3 53.3 74.4 144.6 295.9 372.4 489.0 549.9 668.6In percent of export 26.3 50.3 33.0 24.3 11.8 0.9 1.1 1.5 0.9 0.9 1.1 1.8 3.3 3.7 4.3 4.4 4.8In percent of GDP 3.8 8.6 6.0 4.6 2.4 0.2 0.3 0.4 0.2 0.2 0.3 0.6 1.0 1.1 1.4 1.5 1.7
16
Table 2. Debt Service of 36 Post-Decision-Point HIPCs, 2001-2017 (In millions of U.S. dollars, unless otherwise indicated)
TogoDue after enhanced HIPC Initiative and MDRI relief 1/ 17.8 1.4 2.7 2.3 2.5 3.5 8.7 71.0 46.7 41.5 13.7 25.7 25.7 38.2 40.3 47.3 49.9In percent of export 4.0 0.3 0.4 0.3 0.3 0.4 0.9 6.3 4.0 3.5 0.9 1.8 1.7 2.3 2.3 2.5 2.5In percent of GDP 1.3 0.1 0.2 0.1 0.1 0.2 0.3 2.2 1.5 1.2 0.4 0.7 0.7 1.0 1.0 1.1 1.1
Uganda 2/ 3/4/Due after enhanced HIPC Initiative and MDRI relief 1/ 168.8 169.2 152.0 167.5 185.5 135.2 80.8 73.9 89.9 94.4 98.1 110.9 127.0 142.7 139.8 138.0 140.1In percent of export 24.9 24.6 20.3 16.6 14.1 8.6 4.0 2.7 2.9 2.7 2.6 2.5 2.7 2.9 2.6 2.4 2.3In percent of GDP 2.5 2.7 2.3 2.1 2.0 1.4 0.7 0.5 0.6 0.5 0.6 0.6 0.6 0.6 0.6 0.5 0.5
Zambia 3/Due after enhanced HIPC Initiative and MDRI relief 1/ 138.5 122.7 191.5 373.2 165.6 66.0 61.6 64.2 55.3 49.3 40.1 257.9 146.9 121.3 135.5 178.7 198.8In percent of export 13.1 10.8 15.2 17.9 6.5 1.6 1.3 1.2 1.2 0.6 0.4 2.8 1.4 1.0 1.0 1.2 1.2In percent of GDP 3.8 3.3 4.4 6.9 2.3 0.6 0.5 0.4 0.4 0.3 0.2 1.3 0.7 0.5 0.5 0.6 0.6
B. Interim HIPCs (1)
Chad Due after enhanced HIPC Initiative and MDRI relief 1/ 19.9 36.4 52.4 45.5 57.2 69.8 61.6 136.5 65.3 62.1 109.2 157.6 241.3 271.0 299.9 325.2 363.2In percent of export 7.9 14.4 7.8 2.0 1.8 2.0 1.6 3.1 2.0 1.6 2.3 3.3 5.1 5.1 5.0 5.8 6.9In percent of GDP 1.2 1.8 1.9 1.0 1.0 1.1 0.9 1.6 0.9 0.7 1.0 1.4 2.1 2.0 2.1 2.2 2.4
Sources: HIPC country documents, and World Bank and IMF staff estimates.
Note: Data corresponding to years of decision and completion points under the enhanced HIPC Initiative are in thin and thick boxes, respectively.
1/ Debt service paid covers 2001-2011, and debt service due covers 2012-2017. For post-completion point HIPCs, debt service due reflects the negotiated relief by the debtor countries , additional debt relief, provide by some Paris Club Creditors on a voluntary basis, and MDRI (for countries that have reached the completition point in the more recent years, debt service projections assume full HIPC Initiative debt relief along wit additional debt relief by the Paris Club and MDRI). For pre-completion-point countries, debt service due includes interim debt relief and full HIPC Initiative and MDRI assistance expected at the projected completion
2/ Data reported on a fiscal year basis. 3/ Reached decision point in 2000. 4/ Reached completion point in 2000.
17
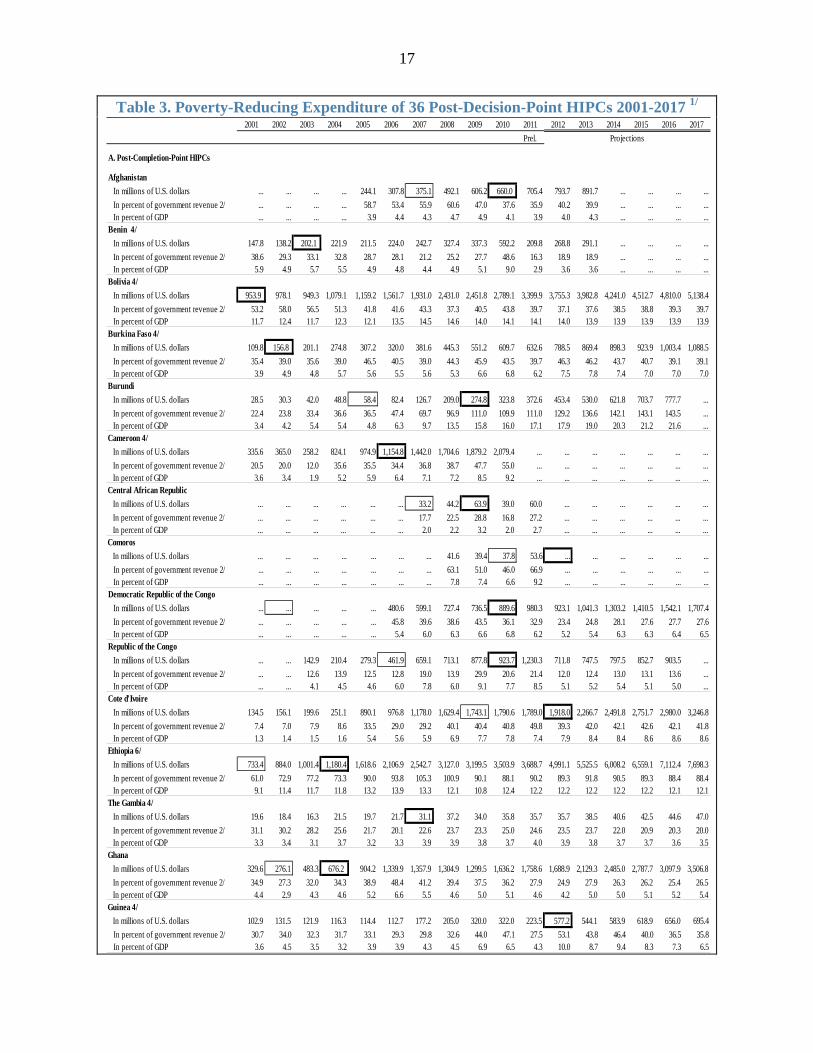
Table 3. Poverty-Reducing Expenditure of 36 Post-Decision-Point HIPCs 2001-2017 1/
2001 2002 2003 2004 2005 2006 2007 2008 2009 2010 2011 2012 2013 2014 2015 2016 2017Prel.
A. Post-Completion-Point HIPCs
AfghanistanIn millions of U.S. dollars ... ... ... ... 244.1 307.8 375.1 492.1 606.2 660.0 705.4 793.7 891.7 ... ... ... ...In percent of government revenue 2/ ... ... ... ... 58.7 53.4 55.9 60.6 47.0 37.6 35.9 40.2 39.9 ... ... ... ...In percent of GDP ... ... ... ... 3.9 4.4 4.3 4.7 4.9 4.1 3.9 4.0 4.3 ... ... ... ...
Benin 4/In millions of U.S. dollars 147.8 138.2 202.1 221.9 211.5 224.0 242.7 327.4 337.3 592.2 209.8 268.8 291.1 ... ... ... ...In percent of government revenue 2/ 38.6 29.3 33.1 32.8 28.7 28.1 21.2 25.2 27.7 48.6 16.3 18.9 18.9 ... ... ... ...In percent of GDP 5.9 4.9 5.7 5.5 4.9 4.8 4.4 4.9 5.1 9.0 2.9 3.6 3.6 ... ... ... ...
Bolivia 4/In millions of U.S. dollars 953.9 978.1 949.3 1,079.1 1,159.2 1,561.7 1,931.0 2,431.0 2,451.8 2,789.1 3,399.9 3,755.3 3,982.8 4,241.0 4,512.7 4,810.0 5,138.4In percent of government revenue 2/ 53.2 58.0 56.5 51.3 41.8 41.6 43.3 37.3 40.5 43.8 39.7 37.1 37.6 38.5 38.8 39.3 39.7In percent of GDP 11.7 12.4 11.7 12.3 12.1 13.5 14.5 14.6 14.0 14.1 14.1 14.0 13.9 13.9 13.9 13.9 13.9
Burkina Faso 4/In millions of U.S. dollars 109.8 156.8 201.1 274.8 307.2 320.0 381.6 445.3 551.2 609.7 632.6 788.5 869.4 898.3 923.9 1,003.4 1,088.5In percent of government revenue 2/ 35.4 39.0 35.6 39.0 46.5 40.5 39.0 44.3 45.9 43.5 39.7 46.3 46.2 43.7 40.7 39.1 39.1In percent of GDP 3.9 4.9 4.8 5.7 5.6 5.5 5.6 5.3 6.6 6.8 6.2 7.5 7.8 7.4 7.0 7.0 7.0
Burundi In millions of U.S. dollars 28.5 30.3 42.0 48.8 58.4 82.4 126.7 209.0 274.8 323.8 372.6 453.4 530.0 621.8 703.7 777.7 ...In percent of government revenue 2/ 22.4 23.8 33.4 36.6 36.5 47.4 69.7 96.9 111.0 109.9 111.0 129.2 136.6 142.1 143.1 143.5 ...In percent of GDP 3.4 4.2 5.4 5.4 4.8 6.3 9.7 13.5 15.8 16.0 17.1 17.9 19.0 20.3 21.2 21.6 ...
Cameroon 4/In millions of U.S. dollars 335.6 365.0 258.2 824.1 974.9 1,154.8 1,442.0 1,704.6 1,879.2 2,079.4 ... ... ... ... ... ... ...In percent of government revenue 2/ 20.5 20.0 12.0 35.6 35.5 34.4 36.8 38.7 47.7 55.0 ... ... ... ... ... ... ...In percent of GDP 3.6 3.4 1.9 5.2 5.9 6.4 7.1 7.2 8.5 9.2 ... ... ... ... ... ... ...
Central African Republic In millions of U.S. dollars ... ... ... ... ... ... 33.2 44.2 63.9 39.0 60.0 ... ... ... ... ... ...In percent of government revenue 2/ ... ... ... ... ... ... 17.7 22.5 28.8 16.8 27.2 ... ... ... ... ... ...In percent of GDP ... ... ... ... ... ... 2.0 2.2 3.2 2.0 2.7 ... ... ... ... ... ...
ComorosIn millions of U.S. dollars ... ... ... ... ... ... ... 41.6 39.4 37.8 53.6 ... ... ... ... ... ...In percent of government revenue 2/ ... ... ... ... ... ... ... 63.1 51.0 46.0 66.9 ... ... ... ... ... ...In percent of GDP ... ... ... ... ... ... ... 7.8 7.4 6.6 9.2 ... ... ... ... ... ...
Democratic Republic of the CongoIn millions of U.S. dollars ... ... ... ... ... 480.6 599.1 727.4 736.5 889.6 980.3 923.1 1,041.3 1,303.2 1,410.5 1,542.1 1,707.4In percent of government revenue 2/ ... ... ... ... ... 45.8 39.6 38.6 43.5 36.1 32.9 23.4 24.8 28.1 27.6 27.7 27.6In percent of GDP ... ... ... ... ... 5.4 6.0 6.3 6.6 6.8 6.2 5.2 5.4 6.3 6.3 6.4 6.5
Republic of the Congo In millions of U.S. dollars ... ... 142.9 210.4 279.3 461.9 659.1 713.1 877.8 923.7 1,230.3 711.8 747.5 797.5 852.7 903.5 ...In percent of government revenue 2/ ... ... 12.6 13.9 12.5 12.8 19.0 13.9 29.9 20.6 21.4 12.0 12.4 13.0 13.1 13.6 ...In percent of GDP ... ... 4.1 4.5 4.6 6.0 7.8 6.0 9.1 7.7 8.5 5.1 5.2 5.4 5.1 5.0 ...
Cote d'IvoireIn millions of U.S. dollars 134.5 156.1 199.6 251.1 890.1 976.8 1,178.0 1,629.4 1,743.1 1,790.6 1,789.0 1,918.0 2,266.7 2,491.8 2,751.7 2,980.0 3,246.8In percent of government revenue 2/ 7.4 7.0 7.9 8.6 33.5 29.0 29.2 40.1 40.4 40.8 49.8 39.3 42.0 42.1 42.6 42.1 41.8In percent of GDP 1.3 1.4 1.5 1.6 5.4 5.6 5.9 6.9 7.7 7.8 7.4 7.9 8.4 8.4 8.6 8.6 8.6
Ethiopia 6/In millions of U.S. dollars 733.4 884.0 1,001.4 1,180.4 1,618.6 2,106.9 2,542.7 3,127.0 3,199.5 3,503.9 3,688.7 4,991.1 5,525.5 6,008.2 6,559.1 7,112.4 7,698.3In percent of government revenue 2/ 61.0 72.9 77.2 73.3 90.0 93.8 105.3 100.9 90.1 88.1 90.2 89.3 91.8 90.5 89.3 88.4 88.4In percent of GDP 9.1 11.4 11.7 11.8 13.2 13.9 13.3 12.1 10.8 12.4 12.2 12.2 12.2 12.2 12.2 12.1 12.1
The Gambia 4/In millions of U.S. dollars 19.6 18.4 16.3 21.5 19.7 21.7 31.1 37.2 34.0 35.8 35.7 35.7 38.5 40.6 42.5 44.6 47.0In percent of government revenue 2/ 31.1 30.2 28.2 25.6 21.7 20.1 22.6 23.7 23.3 25.0 24.6 23.5 23.7 22.0 20.9 20.3 20.0In percent of GDP 3.3 3.4 3.1 3.7 3.2 3.3 3.9 3.9 3.8 3.7 4.0 3.9 3.8 3.7 3.7 3.6 3.5
Ghana In millions of U.S. dollars 329.6 276.1 483.3 676.2 904.2 1,339.9 1,357.9 1,304.9 1,299.5 1,636.2 1,758.6 1,688.9 2,129.3 2,485.0 2,787.7 3,097.9 3,506.8In percent of government revenue 2/ 34.9 27.3 32.0 34.3 38.9 48.4 41.2 39.4 37.5 36.2 27.9 24.9 27.9 26.3 26.2 25.4 26.5In percent of GDP 4.4 2.9 4.3 4.6 5.2 6.6 5.5 4.6 5.0 5.1 4.6 4.2 5.0 5.0 5.1 5.2 5.4
Guinea 4/In millions of U.S. dollars 102.9 131.5 121.9 116.3 114.4 112.7 177.2 205.0 320.0 322.0 223.5 577.2 544.1 583.9 618.9 656.0 695.4In percent of government revenue 2/ 30.7 34.0 32.3 31.7 33.1 29.3 29.8 32.6 44.0 47.1 27.5 53.1 43.8 46.4 40.0 36.5 35.8In percent of GDP 3.6 4.5 3.5 3.2 3.9 3.9 4.3 4.5 6.9 6.5 4.3 10.0 8.7 9.4 8.3 7.3 6.5
Projections

18
Table 3. Poverty-Reducing Expenditure of 36 Post-Decision-Point HIPCs 2001-2017
2001 2002 2003 2004 2005 2006 2007 2008 2009 2010 2011 2012 2013 2014 2015 2016 2017Prel. Projections
Guinea-Bissau 4/In millions of U.S. dollars ... ... ... ... ... ... ... ... 27.5 18.5 25.5 45.8 49.5 52.9 56.8 60.9 ...In percent of government revenue 2/ ... ... ... ... ... ... ... ... 34.7 19.6 25.3 38.7 38.4 38.5 38.9 39.0 ...In percent of GDP ... ... ... ... ... ... ... ... 3.3 2.2 2.6 5.2 5.3 5.0 5.0 5.1 ...
Guyana 3/ 4/In millions of U.S. dollars 144.3 151.0 159.5 157.2 173.8 192.3 ... ... ... ... ... ... ... ... ... ... ...In percent of government revenue 2/ 62.4 65.0 61.6 53.7 57.2 56.8 ... ... ... ... ... ... ... ... ... ... ...In percent of GDP 12.8 12.8 13.3 12.6 13.2 13.2 ... ... ... ... ... ... ... ... ... ... ...
Haiti 6/In millions of U.S. dollars ... ... ... ... ... ... ... ... 166.6 240.3 306.0 ... ... ... ... ... ...In percent of government revenue 2/ ... ... ... ... ... ... ... ... 23.3 30.5 32.6 ... ... ... ... ... ...In percent of GDP ... ... ... ... ... ... ... ... 2.5 3.6 3.9 ... ... ... ... ... ...
Honduras 4/In millions of U.S. dollars 557.2 493.7 526.5 615.9 737.9 737.2 954.0 1,089.7 1,107.8 1,158.1 1,222.2 1,281.6 1,322.8 1,382.0 1,450.9 1,523.4 1,599.5In percent of government revenue 2/ 47.7 40.9 40.9 30.2 33.3 30.9 35.7 32.6 34.1 32.5 31.8 31.5 29.9 31.5 33.0 33.2 33.9In percent of GDP 7.3 6.3 6.4 7.0 7.6 6.8 7.7 7.9 7.6 7.3 6.9 7.0 7.0 7.0 7.1 7.2 7.4
Liberia 3/ 6/In millions of U.S. dollars ... ... ... ... ... ... ... ... ... 224.9 223.3 253.6 301.1 328.9 348.8 390.1 407.0In percent of government revenue 2/ ... ... ... ... ... ... ... ... ... 65.0 66.7 58.6 65.4 62.2 61.0 65.9 64.8In percent of GDP ... ... ... ... ... ... ... ... ... 18.4 15.7 15.3 16.3 16.5 15.7 16.0 15.8
Madagascar 4/In millions of U.S. dollars 190.9 190.9 202.9 134.5 528.8 604.1 764.3 933.9 907.2 916.3 925.5 953.2 981.8 1,011.3 1,041.6 1,072.9 ...In percent of government revenue 2/ 41.8 51.1 35.4 25.6 103.6 92.0 84.9 81.3 95.3 87.4 88.0 91.0 80.8 82.7 75.6 73.1 ...In percent of GDP 4.2 4.3 3.7 3.1 10.5 11.0 10.4 9.9 10.6 10.5 9.3 9.5 9.3 9.1 8.8 8.2 ...
Malawi 4/In millions of U.S. dollars 161.9 189.7 182.5 164.9 218.6 269.0 388.7 551.2 626.9 710.1 613.2 846.3 685.6 704.0 739.2 796.9 845.4In percent of government revenue 2/ 56.0 63.0 52.3 37.3 43.2 49.9 58.0 64.8 60.7 53.0 43.2 61.5 68.5 72.7 69.4 67.9 65.7In percent of GDP 9.4 7.1 7.5 6.3 7.9 8.6 10.7 12.9 12.5 13.2 10.1 20.0 18.3 17.2 16.6 16.5 16.2
Mali 4/In millions of U.S. dollars 155.4 190.0 322.5 367.4 325.7 411.1 487.2 541.2 629.3 706.3 695.4 475.8 462.6 498.8 534.7 571.5 614.2In percent of government revenue 2/ 36.7 33.0 40.8 39.5 35.6 36.8 38.5 42.9 39.0 43.5 41.3 27.5 24.1 24.4 24.2 24.1 24.0In percent of GDP 5.1 5.9 7.6 7.4 5.9 6.7 6.8 6.2 7.0 7.5 6.5 4.7 4.3 4.3 4.3 4.3 4.3
Mauritania 4/In millions of U.S. dollars 79.1 105.0 214.0 179.5 129.1 185.7 264.5 400.4 333.2 327.2 385.0 456.5 488.4 522.6 ... ... ...In percent of government revenue 2/ 35.2 29.7 54.7 39.0 28.7 23.4 35.8 51.5 43.8 36.7 34.1 39.2 38.9 41.8 ... ... ...In percent of GDP 7.0 9.1 16.6 12.0 7.0 6.6 9.4 11.3 11.0 8.9 9.0 10.9 11.0 11.4 ... ... ...
Mozambique 4/In millions of U.S. dollars 590.6 647.5 699.3 875.8 943.4 1,183.8 1,331.7 1,958.8 2,097.6 2,119.5 2,146.0 2,459.8 2,850.0 ... ... ... ...In percent of government revenue 2/ 145.5 128.1 113.7 98.3 106.5 113.9 96.0 128.4 123.5 107.9 71.8 73.3 80.5 ... ... ... ...In percent of GDP 14.5 15.4 15.0 15.4 14.3 16.4 16.4 19.7 21.0 22.2 17.1 16.8 18.1 ... ... ... ...
Nicaragua 4/In millions of U.S. dollars 361.5 410.7 467.5 536.0 620.7 632.3 771.1 850.1 837.0 847.9 922.5 1,084.3 1,203.6 1,341.7 1,489.9 1,642.7 1,825.3In percent of government revenue 2/ ... 70.1 71.6 71.5 72.4 65.0 70.8 52.3 53.3 47.5 42.4 43.5 45.3 46.7 48.2 49.6 51.3In percent of GDP 6.8 7.9 8.8 9.3 9.8 9.3 10.4 10.3 10.4 10.1 9.9 11.0 11.5 12.0 12.5 13.0 13.5
Niger 4/In millions of U.S. dollars ... 169.8 221.5 280.6 291.5 339.0 376.0 430.1 401.5 353.4 626.2 633.2 691.6 729.3 772.9 855.0 923.1In percent of government revenue 2/ ... 67.9 75.4 79.0 85.3 68.1 54.7 46.9 49.6 45.5 72.7 61.0 59.3 56.1 53.7 53.6 52.5In percent of GDP ... 8.2 8.4 9.7 8.6 9.3 8.8 8.0 7.5 6.2 9.9 9.8 10.1 9.8 9.7 9.9 9.9
Rwanda 4/In millions of U.S. dollars 90.6 107.8 115.4 137.0 216.4 274.5 391.5 572.8 707.8 689.8 932.1 907.4 1,116.8 1,348.3 1,638.1 1,984.9 2,405.9In percent of government revenue 2/ 47.9 54.8 53.9 52.8 66.5 72.3 84.2 84.0 106.3 95.1 103.3 94.3 101.7 110.2 121.2 132.1 143.4In percent of GDP 5.4 6.4 6.3 6.5 8.4 8.8 10.5 12.2 13.6 12.4 14.6 13.1 14.4 15.9 17.7 19.7 21.8
São Tome and Principe 4/In millions of U.S. dollars 13.7 12.1 15.2 14.7 14.4 15.8 12.4 11.2 23.9 37.1 38.2 50.2 32.3 22.3 ... ... ...In percent of government revenue 2/ 138.2 98.1 101.6 90.3 23.9 67.6 23.7 38.5 76.0 102.2 88.3 93.1 60.2 36.0 ... ... ...In percent of GDP 17.9 14.3 15.0 13.3 11.7 11.7 8.6 6.1 12.2 18.5 15.4 19.0 11.0 6.8 ... ... ...
Senegal 4/In millions of U.S. dollars 303.6 313.2 456.3 648.9 732.6 795.7 1,010.6 1,180.4 1,215.6 1,289.7 1,349.6 1,356.2 ... ... ... ... ...In percent of government revenue 2/ 37.0 30.4 33.8 40.9 46.0 41.0 39.9 49.3 48.6 51.8 48.8 47.6 ... ... ... ... ...In percent of GDP 6.2 5.9 6.6 8.1 8.4 8.5 8.9 8.8 9.5 10.0 9.3 9.7 ... ... ... ... ...
Sierra LeoneIn millions of U.S. dollars 36.7 57.4 59.7 49.9 53.5 61.6 53.4 108.6 93.8 99.3 122.8 125.7 138.9 157.5 169.0 181.8 195.7In percent of government revenue 2/ 37.3 51.9 52.4 39.1 35.5 35.5 28.3 49.4 48.3 41.4 24.8 22.5 26.5 26.2 26.1 25.8 25.3In percent of GDP 3.4 4.7 4.4 3.5 3.3 3.3 2.5 4.4 3.9 3.9 4.2 3.3 3.4 3.3 3.4 3.4 3.4
Tanzania 4/ 6/In millions of U.S. dollars 595.1 799.3 860.7 1,023.6 1,095.4 1,544.1 2,071.3 2,876.9 3,685.7 4,026.3 4,366.3 5,070.9 5,777.1 6,159.2 6,494.4 6,838.3 7,117.9In percent of government revenue 2/ 56.8 72.6 74.0 77.7 69.6 91.1 95.8 93.5 112.8 115.7 119.6 110.2 103.1 102.0 101.1 99.6 97.2In percent of GDP 6.0 7.6 7.6 8.5 8.0 10.8 13.6 15.1 17.6 17.6 18.4 19.7 19.1 18.7 18.7 18.6 18.3

19
Table 3. Poverty-Reducing Expenditure of 36 Post-Decision-Point HIPCs 2001-2017
2001 2002 2003 2004 2005 2006 2007 2008 2009 2010 2011 2012 2013 2014 2015 2016 2017Prel. Projections
TogoIn millions of U.S. dollars 69.2 64.0 75.4 93.5 106.7 137.6 161.4 201.2 254.9 291.6 373.6 435.8 452.4 483.3 511.0 519.8 538.9In percent of government revenue 2/ 35.4 32.5 24.3 26.6 33.8 34.9 35.8 44.3 45.4 48.7 58.8 63.9 59.9 61.7 61.1 59.1 57.6In percent of GDP 5.2 4.3 4.5 4.8 5.0 6.2 6.4 6.3 8.1 8.8 11.8 12.4 12.8 12.9 13.0 12.5 12.4
Uganda 4/ 5/ 6/In millions of U.S. dollars 235.3 335.7 343.1 377.7 448.5 475.4 614.4 559.9 676.8 348.4 515.0 478.7 ... ... ... ... ...In percent of government revenue 2/ 36.0 46.3 41.3 39.1 39.8 36.2 39.8 30.8 31.1 14.1 14.1 12.5 ... ... ... ... ...In percent of GDP 3.5 5.4 5.2 4.8 4.9 4.8 5.2 3.9 4.3 2.0 3.1 2.5 ... ... ... ... ...
Zambia 4/In millions of U.S. dollars 45.7 35.3 46.8 111.1 1,198.9 906.4 1,109.0 1,021.6 850.3 1,037.4 1,295.9 1,628.0 1,664.0 1,794.1 1,959.9 2,182.0 2,414.2In percent of government revenue 2/ 7.0 5.3 5.9 11.2 74.6 60.4 50.0 48.3 38.3 36.0 34.0 42.0 37.7 34.3 32.4 31.4 31.0In percent of GDP 1.3 1.0 1.1 2.0 16.7 8.5 9.6 7.0 6.6 6.4 6.7 8.0 7.4 7.2 7.1 7.2 7.2
B. Interim HIPCs
Chad In millions of U.S. dollars 64.3 84.8 113.0 132.4 326.0 558.0 806.4 892.8 942.7 887.4 1,086.0 1,167.4 1,289.4 1,492.7 1,668.1 1,709.6 1,788.1In percent of government revenue 2/ 51.6 48.6 48.4 32.7 62.3 52.2 50.5 43.6 78.5 44.0 40.6 47.6 53.4 54.7 50.9 54.3 58.0In percent of GDP 3.8 4.3 4.1 3.0 5.5 8.8 11.5 10.6 13.3 10.4 10.3 10.7 11.0 11.3 11.5 11.7 12.0
Sources: HIPC country documents, and World Bank and IMF staff estimates.
Note: Data corresponding to years of decision and completion points under the enhanced HIPC Initiative are in thin and thick boxes, respectively.
1/ The coverage of poverty-reducing expenditures varies across countries, but is generally consistent with the definition in the PRSP and the budget of each HIPC. In some countries, the definition of poverty-reducing expenditures has evolved over time to include more sectors; therefore, some of the increase in such spending over the 2001-2003 period may reflect changes in the definition. In the majority of countries expenditures on health and education are included but beyond that there are wide variations in the sectoral spending included.
2/ Central government revenue excluding grants.3/ Currently fiscal data reported by authorities does not allow monitoring of poverty reduction expenditures.
4/ Reached decision point in 2000. 5/ Reached completion point in 2000.
6/ Data reported on a fiscal year basis.
20
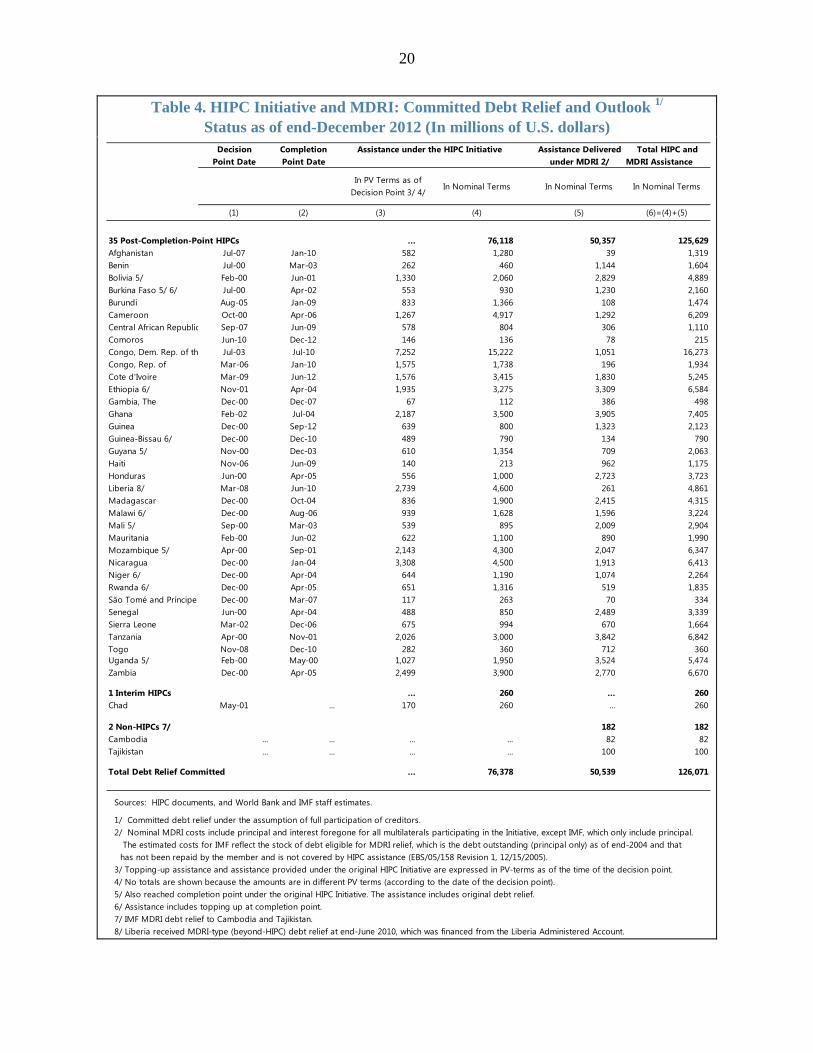
Table 4. HIPC Initiative and MDRI: Committed Debt Relief and Outlook 1/ Status as of end-December 2012 (In millions of U.S. dollars)
Decision Completion Assistance under the HIPC Initiative Assistance Delivered Total HIPC andPoint Date Point Date under MDRI 2/ MDRI Assistance
In PV Terms as of Decision Point 3/ 4/
In Nominal Terms In Nominal Terms In Nominal Terms
(1) (2) (3) (4) (5) (6)=(4)+(5)
35 Post-Completion-Point HIPCs … 76,118 50,357 125,629Afghanistan Jul-07 Jan-10 582 1,280 39 1,319Benin Jul-00 Mar-03 262 460 1,144 1,604Bolivia 5/ Feb-00 Jun-01 1,330 2,060 2,829 4,889Burkina Faso 5/ 6/ Jul-00 Apr-02 553 930 1,230 2,160Burundi Aug-05 Jan-09 833 1,366 108 1,474Cameroon Oct-00 Apr-06 1,267 4,917 1,292 6,209Central African Republic Sep-07 Jun-09 578 804 306 1,110Comoros Jun-10 Dec-12 146 136 78 215Congo, Dem. Rep. of the Jul-03 Jul-10 7,252 15,222 1,051 16,273Congo, Rep. of Mar-06 Jan-10 1,575 1,738 196 1,934Cote d'Ivoire Mar-09 Jun-12 1,576 3,415 1,830 5,245Ethiopia 6/ Nov-01 Apr-04 1,935 3,275 3,309 6,584Gambia, The Dec-00 Dec-07 67 112 386 498Ghana Feb-02 Jul-04 2,187 3,500 3,905 7,405Guinea Dec-00 Sep-12 639 800 1,323 2,123Guinea-Bissau 6/ Dec-00 Dec-10 489 790 134 790Guyana 5/ Nov-00 Dec-03 610 1,354 709 2,063Haiti Nov-06 Jun-09 140 213 962 1,175Honduras Jun-00 Apr-05 556 1,000 2,723 3,723Liberia 8/ Mar-08 Jun-10 2,739 4,600 261 4,861Madagascar Dec-00 Oct-04 836 1,900 2,415 4,315Malawi 6/ Dec-00 Aug-06 939 1,628 1,596 3,224Mali 5/ Sep-00 Mar-03 539 895 2,009 2,904Mauritania Feb-00 Jun-02 622 1,100 890 1,990Mozambique 5/ Apr-00 Sep-01 2,143 4,300 2,047 6,347Nicaragua Dec-00 Jan-04 3,308 4,500 1,913 6,413Niger 6/ Dec-00 Apr-04 644 1,190 1,074 2,264Rwanda 6/ Dec-00 Apr-05 651 1,316 519 1,835São Tomé and Príncipe Dec-00 Mar-07 117 263 70 334Senegal Jun-00 Apr-04 488 850 2,489 3,339Sierra Leone Mar-02 Dec-06 675 994 670 1,664Tanzania Apr-00 Nov-01 2,026 3,000 3,842 6,842Togo Nov-08 Dec-10 282 360 712 360Uganda 5/ Feb-00 May-00 1,027 1,950 3,524 5,474Zambia Dec-00 Apr-05 2,499 3,900 2,770 6,670
1 Interim HIPCs … 260 … 260Chad May-01 ... 170 260 … 260
2 Non-HIPCs 7/ 182 182Cambodia ... ... ... ... 82 82Tajikistan ... ... ... ... 100 100
Total Debt Relief Committed … 76,378 50,539 126,071
Sources: HIPC documents, and World Bank and IMF staff estimates.
1/ Committed debt relief under the assumption of full participation of creditors.2/ Nominal MDRI costs include principal and interest foregone for all multilaterals participating in the Initiative, except IMF, which only include principal.
The estimated costs for IMF reflect the stock of debt eligible for MDRI relief, which is the debt outstanding (principal only) as of end-2004 and that has not been repaid by the member and is not covered by HIPC assistance (EBS/05/158 Revision 1, 12/15/2005).
3/ Topping-up assistance and assistance provided under the original HIPC Initiative are expressed in PV-terms as of the time of the decision point.4/ No totals are shown because the amounts are in different PV terms (according to the date of the decision point).5/ Also reached completion point under the original HIPC Initiative. The assistance includes original debt relief. 6/ Assistance includes topping up at completion point.7/ IMF MDRI debt relief to Cambodia and Tajikistan.8/ Liberia received MDRI-type (beyond-HIPC) debt relief at end-June 2010, which was financed from the Liberia Administered Account.

21
Table 5. HIPC Initiative: Cost Estimates to Multilateral Creditors and Status of their Commitments to Post-Completion-Point HIPCs
Status as of end December 2012 (In millions of U.S. dollars, in end-2011 PV terms)
Creditors
Total Relief Commited
In millions of U.S. dollars, in end-2011
PV Terms
Percent of Total
Cost
Delivering or Committed to Deliver Debt Relief 28,121 99.4World Bank Group 35 35 13,208 46.7African Development Bank (AfDB) Group 29 29 5,001 17.7International Monetary Fund (IMF) 35 35 4,527 16.0Inter-American Development Bank (IaDB) 5 5 1,688 6.0European Union/European Investment Bank (EU/EIB) 30 30 1,073 3.8Central American Bank for Economic Integration (CABEI) 2 2 737 2.6International Fund for Agricultural Development (IFAD) 34 34 463 1.6Arab Bank for Economic Development in Africa (BADEA) 27 27 346 1.2OPEC Fund for International Development (OFID) 35 35 275 1.0Islamic Development Bank (IsDB) 15 14 192 0.7Arab Fund for Economic and Social Development (AFESD) 1 1 92 0.3Corporación Andina de Fomento (CAF) 1 1 134 0.5West African Development Bank (BOAD) 4 4 89 0.3Caricom Multilateral Clearing Facility (CMCF) 5 5 87 0.3Asian Development Bank (AsDB) 1 1 68 0.2Nordic Development Fund (NDF) 9 9 40 0.1Fund for the Financial Development of the River Plate Basin (FONPLAT 1 1 36 0.1Caribbean Development Bank (CDB) 1 1 26 0.1Arab Monetary Fund (AMF) 1 1 18 0.1Central Bank of West African States (BCEAO) 3 1 8 0.0Nordic Investment Bank (NIB) 1 1 5 0.0East African Development Bank (EADB) 2 2 5 0.0Shelter Afrique 2 1 1 0.0Banco Interamericano de Ahorro y Préstamo (BIAPE) 1 1 0 0.0
Have not Indicated Intention to Provide Relief under the HIPC Initiative 165.8 0.6Banque des Etats de l'Afrique Centrale (BEAC) 1 0 45.0 0.2Economic Community of West African States (ECOWAS) 10 0 29.9 0.1Eastern and Southern African Trade and Development Bank (PTA Ban 2 0 12.7 0.0Banque de Développement des Etats de l'Afrique Centrale (BDEAC) 2 0 12.8 0.0Banque de Dévelopment des Etats des Grands Lacs (BDEGL) 2 0 57.7 0.2Conseil de L'Entente (FEGECE) 3 0 4.1 0.0Fondo Centroamericano de Estabilización Monetaria (FOCEM) 1 0 2.5 0.0Islamic Solidarity Fund for Development (ISFD) 1 0 1.0 0.0
Total 28,287 100.0
Sources: HIPC documents, country authorities, and World Bank and IMF staff estimates.
HIPC Assistance CostsNumber of
Completion Point

22
Table 6A. Status of Delivery of HIPC Initiative and MDRI Assistance by the World Bank Status as of end-December 2012 (In millions of U.S. dollars)
World Bank Assistance under the HIPC Initiative Assistance under the MDRI
(IDA only) Total Committed Assistance
Total Delivered Assistance
Committed Assistance in
Nominal Terms
Committed Assistance in
PV Terms as of Decision Point
Committed Assistance in end-2011 PV
Terms
Delivered Assistance in end-2011 PV Terms 1/
Delivered Assistance in
Nominal Terms 2/
Delivered Assistance in end-2011 PV
Terms
under the HIPC Initiative and MDRI in end-
2011 PV Terms
under the HIPC Initiative and MDRI in end-
2011 PV Terms
(I) (II) (III) (IV) (V) (VI) (III) + (VI) (IV) + (VI)
35 Post-Completion-Point HIPCs TOTAL 3/ 16,476.8 … 13,208.4 8,122.8 34,297.6 23,235.4 36,443.8 31,358.2
Afghanistan 125.8 76.0 86.8 16.4 38.6 22.5 109.2 38.9Benin 124.3 84.4 121.6 101.0 703.4 513.7 635.3 614.7Bolivia 4/ 287.2 197.4 284.2 243.5 1,554.7 1,118.2 1,402.4 1,361.7Burkina Faso 4/ 5/ 419.5 231.7 333.8 245.3 755.8 516.6 850.3 761.9Burundi 774.8 425.2 518.8 156.7 64.7 43.5 562.3 200.3Cameroon 297.0 176.1 253.7 160.2 838.5 575.9 829.5 736.1Central African Republic 291.8 206.9 244.2 119.8 187.4 133.5 377.7 253.3Comoros 65.8 44.9 48.0 3.9 45.9 28.0 76.0 32.0Congo, Dem. Rep. of 1,435.4 878.7 1,145.7 638.9 895.1 506.4 1,652.1 1,145.3Congo, Republic of 67.4 47.0 57.4 21.4 179.1 117.6 175.0 139.0
Côte d’Ivoire 430.6 412.6 455.7 296.4 1,556.3 1,025.7 1,481.4 1,322.1Ethiopia 5/ 1,288.4 807.2 1,124.6 571.6 2,398.3 1,486.8 2,611.4 2,058.4Gambia, The 35.9 22.3 32.1 21.9 201.8 142.5 174.6 164.4Ghana 1,445.7 781.6 1,088.9 569.2 3,065.8 2,103.4 3,192.3 2,672.6Guinea 327.3 173.6 250.0 105.2 1,027.5 606.0 856.0 711.3Guinea-Bissau 5/ 263.7 116.7 173.8 74.2 73.4 40.9 214.8 115.2Guyana 4/ 132.8 70.2 101.1 71.1 193.7 136.3 237.4 207.4Haiti 54.5 52.8 62.3 62.6 470.2 346.5 408.8 409.1Honduras 171.6 97.8 140.8 160.4 1,214.2 851.2 992.0 1,011.6Liberia 394.1 373.6 412.6 425.1 70.6 53.4 466.0 478.4Madagascar 444.4 256.2 369.0 231.0 1,814.5 1,264.8 1,633.8 1,495.8Malawi 5/ 993.5 538.7 775.9 383.1 1,260.6 810.2 1,586.1 1,193.2Mali 4/ 291.8 184.1 265.2 227.1 1,293.7 924.5 1,189.7 1,151.6Mauritania 172.8 99.9 143.8 92.5 563.2 387.7 531.6 480.2Mozambique 4/ 1,055.1 438.6 631.7 644.1 1,342.3 950.2 1,581.9 1,594.3Nicaragua 382.6 190.9 274.9 129.4 791.1 499.4 774.3 628.8Niger 5/ 410.1 231.0 332.7 180.9 765.1 489.7 822.4 670.6Rwanda 5/ 709.4 353.2 508.7 221.1 366.9 211.2 719.9 432.2São Tomé and Príncipe 5/ 61.1 29.8 42.9 18.7 26.5 16.7 59.6 35.4Senegal 163.9 123.6 178.1 178.2 1,897.8 1,390.1 1,568.1 1,568.3Sierra Leone 234.5 123.4 166.3 88.6 395.1 248.5 414.8 337.1Tanzania 1,157.1 694.5 1,000.3 618.5 2,882.7 1,995.7 2,996.0 2,614.2Togo 98.0 101.5 112.2 108.6 588.2 426.8 539.0 535.4Uganda 4/ 983.6 527.8 760.2 557.7 2,847.8 1,991.2 2,751.3 2,548.8Zambia 885.2 493.2 710.3 378.6 1,927.2 1,260.2 1,970.6 1,638.8
1 Interim HIPCs TOTAL 1/ 106.7 … 94.9 40.6 ... ... 94.9 40.6
Chad 106.7 68.1 94.9 40.6 ... ... 94.9 40.6
Total Debt Relief Committed 1/ 16,583.5 … 13,303.3 8,163.4 34,297.6 23,235.4 36,538.7 31,398.8
Sources: HIPC documents, and World Bank staff estimates.
1/ Total delivered HIPC assistance to end-2011.2/ Nominal MDRI costs include principal and interest foregone.3/ The total amounts shown are only indicative, as they represent the sum of individual commitments expressed in different PV terms,
corresponding to the time of the decision point of each HIPC.4/ Also reached completion point under the original HIPC Initiative. The assistance includes original debt relief.5/ The assistance includes topping-up at completion point.
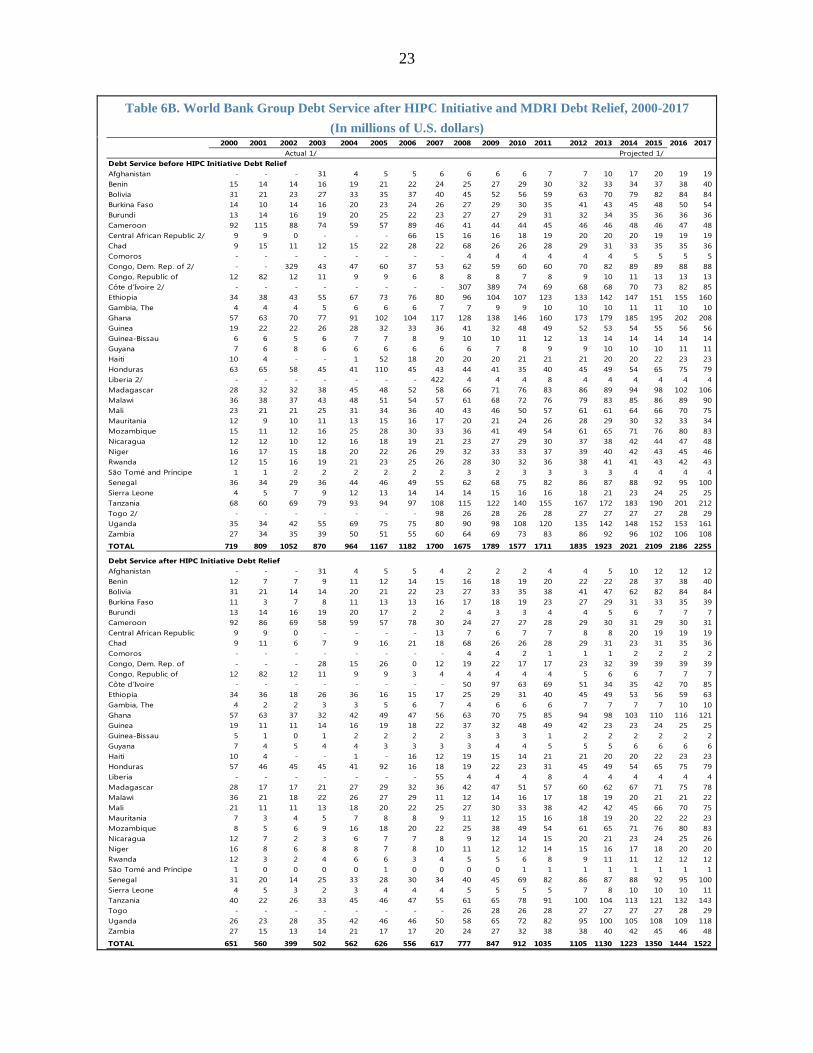
23
Table 6B. World Bank Group Debt Service after HIPC Initiative and MDRI Debt Relief, 2000-2017 (In millions of U.S. dollars)
2000 2001 2002 2003 2004 2005 2006 2007 2008 2009 2010 2011 2012 2013 2014 2015 2016 2017Actual 1/
Debt Service before HIPC Initiative Debt ReliefAfghanistan - - - 31 4 5 5 6 6 6 6 7 7 10 17 20 19 19 Benin 15 14 14 16 19 21 22 24 25 27 29 30 32 33 34 37 38 40 Bolivia 31 21 23 27 33 35 37 40 45 52 56 59 63 70 79 82 84 84 Burkina Faso 14 10 14 16 20 23 24 26 27 29 30 35 41 43 45 48 50 54 Burundi 13 14 16 19 20 25 22 23 27 27 29 31 32 34 35 36 36 36 Cameroon 92 115 88 74 59 57 89 46 41 44 44 45 46 46 48 46 47 48 Central African Republic 2/ 9 9 0 - - - 66 15 16 16 18 19 20 20 20 19 19 19 Chad 9 15 11 12 15 22 28 22 68 26 26 28 29 31 33 35 35 36 Comoros - - - - - - - - 4 4 4 4 4 4 5 5 5 5 Congo, Dem. Rep. of 2/ - - 329 43 47 60 37 53 62 59 60 60 70 82 89 89 88 88 Congo, Republic of 12 82 12 11 9 9 6 8 8 8 7 8 9 10 11 13 13 13 Côte d’Ivoire 2/ - - - - - - - - 307 389 74 69 68 68 70 73 82 85 Ethiopia 34 38 43 55 67 73 76 80 96 104 107 123 133 142 147 151 155 160 Gambia, The 4 4 4 5 6 6 6 7 7 9 9 10 10 10 11 11 10 10 Ghana 57 63 70 77 91 102 104 117 128 138 146 160 173 179 185 195 202 208 Guinea 19 22 22 26 28 32 33 36 41 32 48 49 52 53 54 55 56 56 Guinea-Bissau 6 6 5 6 7 7 8 9 10 10 11 12 13 14 14 14 14 14 Guyana 7 6 8 6 6 6 6 6 6 7 8 9 9 10 10 10 11 11 Haiti 10 4 - - 1 52 18 20 20 20 21 21 21 20 20 22 23 23 Honduras 63 65 58 45 41 110 45 43 44 41 35 40 45 49 54 65 75 79 Liberia 2/ - - - - - - - 422 4 4 4 8 4 4 4 4 4 4 Madagascar 28 32 32 38 45 48 52 58 66 71 76 83 86 89 94 98 102 106 Malawi 36 38 37 43 48 51 54 57 61 68 72 76 79 83 85 86 89 90 Mali 23 21 21 25 31 34 36 40 43 46 50 57 61 61 64 66 70 75 Mauritania 12 9 10 11 13 15 16 17 20 21 24 26 28 29 30 32 33 34 Mozambique 15 11 12 16 25 28 30 33 36 41 49 54 61 65 71 76 80 83 Nicaragua 12 12 10 12 16 18 19 21 23 27 29 30 37 38 42 44 47 48 Niger 16 17 15 18 20 22 26 29 32 33 33 37 39 40 42 43 45 46 Rwanda 12 15 16 19 21 23 25 26 28 30 32 36 38 41 41 43 42 43 São Tomé and Príncipe 1 1 2 2 2 2 2 2 3 2 3 3 3 3 4 4 4 4 Senegal 36 34 29 36 44 46 49 55 62 68 75 82 86 87 88 92 95 100 Sierra Leone 4 5 7 9 12 13 14 14 14 15 16 16 18 21 23 24 25 25 Tanzania 68 60 69 79 93 94 97 108 115 122 140 155 167 172 183 190 201 212 Togo 2/ - - - - - - - 98 26 28 26 28 27 27 27 27 28 29 Uganda 35 34 42 55 69 75 75 80 90 98 108 120 135 142 148 152 153 161 Zambia 27 34 35 39 50 51 55 60 64 69 73 83 86 92 96 102 106 108 /TOTAL 719 809 1052 870 964 1167 1182 1700 1675 1789 1577 1711 1835 1923 2021 2109 2186 2255
Debt Service after HIPC Initiative Debt ReliefAfghanistan - - - 31 4 5 5 4 2 2 2 4 4 5 10 12 12 12 Benin 12 7 7 9 11 12 14 15 16 18 19 20 22 22 28 37 38 40 Bolivia 31 21 14 14 20 21 22 23 27 33 35 38 41 47 62 82 84 84 Burkina Faso 11 3 7 8 11 13 13 16 17 18 19 23 27 29 31 33 35 39 Burundi 13 14 16 19 20 17 2 2 4 3 3 4 4 5 6 7 7 7 Cameroon 92 86 69 58 59 57 78 30 24 27 27 28 29 30 31 29 30 31 Central African Republic 9 9 0 - - - - 13 7 6 7 7 8 8 20 19 19 19 Chad 9 11 6 7 9 16 21 18 68 26 26 28 29 31 23 31 35 36 Comoros - - - - - - - - 4 4 2 1 1 1 2 2 2 2 Congo, Dem. Rep. of - - - 28 15 26 0 12 19 22 17 17 23 32 39 39 39 39 Congo, Republic of 12 82 12 11 9 9 3 4 4 4 4 4 5 6 6 7 7 7 Côte d’Ivoire - - - - - - - - 50 97 63 69 51 34 35 42 70 85 Ethiopia 34 36 18 26 36 16 15 17 25 29 31 40 45 49 53 56 59 63 Gambia, The 4 2 2 3 3 5 6 7 4 6 6 6 7 7 7 7 10 10 Ghana 57 63 37 32 42 49 47 56 63 70 75 85 94 98 103 110 116 121 Guinea 19 11 11 14 16 19 18 22 37 32 48 49 42 23 23 24 25 25 Guinea-Bissau 5 1 0 1 2 2 2 2 3 3 3 1 2 2 2 2 2 2 Guyana 7 4 5 4 4 3 3 3 3 4 4 5 5 5 6 6 6 6 Haiti 10 4 - - 1 - 16 12 19 15 14 21 21 20 20 22 23 23 Honduras 57 46 45 45 41 92 16 18 19 22 23 31 45 49 54 65 75 79 Liberia - - - - - - - 55 4 4 4 8 4 4 4 4 4 4 Madagascar 28 17 17 21 27 29 32 36 42 47 51 57 60 62 67 71 75 78 Malawi 36 21 18 22 26 27 29 11 12 14 16 17 18 19 20 21 21 22 Mali 21 11 11 13 18 20 22 25 27 30 33 38 42 42 45 66 70 75 Mauritania 7 3 4 5 7 8 8 9 11 12 15 16 18 19 20 22 22 23 Mozambique 8 5 6 9 16 18 20 22 25 38 49 54 61 65 71 76 80 83 Nicaragua 12 7 2 3 6 7 7 8 9 12 14 15 20 21 23 24 25 26 Niger 16 8 6 8 8 7 8 10 11 12 12 14 15 16 17 18 20 20 Rwanda 12 3 2 4 6 6 3 4 5 5 6 8 9 11 11 12 12 12 São Tomé and Príncipe 1 0 0 0 0 1 0 0 0 0 1 1 1 1 1 1 1 1 Senegal 31 20 14 25 33 28 30 34 40 45 69 82 86 87 88 92 95 100 Sierra Leone 4 5 3 2 3 4 4 4 5 5 5 5 7 8 10 10 10 11 Tanzania 40 22 26 33 45 46 47 55 61 65 78 91 100 104 113 121 132 143 Togo - - - - - - - - 26 28 26 28 27 27 27 27 28 29 Uganda 26 23 28 35 42 46 46 50 58 65 72 82 95 100 105 108 109 118 Zambia 27 15 13 14 21 17 17 20 24 27 32 38 38 40 42 45 46 48
TOTAL 651 560 399 502 562 626 556 617 777 847 912 1035 1105 1130 1223 1350 1444 1522
Projected 1/

24
Table 6B (concluded). World Bank Group Debt Service after HIPC Initiative and MDRI Debt Relief, 2000-2017 (In millions of U.S. dollars)
2000 2001 2002 2003 2004 2005 2006 2007 2008 2009 2010 2011 2012 2013 2014 2015 2016 2017Actual 1/ Projected 1/
Debt Service after HIPC Initiative Debt Relief and MDRIAfghanistan - - - 31 4 5 5 4 2 2 2 3 3 4 9 11 11 11 Benin 12 7 7 9 11 12 7 2 2 2 3 3 4 4 5 7 7 9 Bolivia 31 21 14 14 20 21 12 2 3 4 4 5 7 9 12 14 15 15 Burkina Faso 11 3 7 8 11 13 8 4 5 6 6 9 11 12 13 14 16 20 Burundi 13 14 16 19 20 17 2 2 4 1 1 2 2 3 4 5 5 5 Cameroon 92 86 69 58 59 57 71 17 10 11 10 12 13 13 13 11 8 9 Central African Republic 9 9 0 - - - - 13 7 3 0 0 0 0 0 0 0 0 Chad 9 11 6 7 9 16 21 18 68 26 26 28 29 31 5 6 6 6 Comoros - - - - - - - - 4 4 2 1 1 0 0 0 0 0 Congo, Dem. Rep. of - - - 28 15 26 0 12 19 22 13 6 11 18 24 24 24 24 Congo, Republic of 12 82 12 11 9 9 3 4 4 4 2 1 1 2 2 2 2 2 Côte d’Ivoire - - - - - - - - 50 97 63 69 36 4 4 4 5 5 Ethiopia 34 36 18 26 36 16 10 6 10 12 14 21 26 29 32 36 38 42 Gambia, The 4 2 2 3 3 5 6 7 1 1 1 1 2 2 2 2 2 2 Ghana 57 63 37 32 42 49 24 9 11 12 14 20 25 27 30 35 39 43 Guinea 19 11 11 14 16 19 18 22 37 32 48 49 36 4 4 4 5 5 Guinea-Bissau 5 1 0 1 2 2 2 2 3 3 3 0 1 1 1 2 2 2 Guyana 7 4 5 4 4 3 2 0 0 0 0 0 0 0 0 0 0 0 Haiti 10 4 - - 1 - 16 12 19 10 0 0 0 0 0 1 1 1 Honduras 57 46 45 45 41 92 9 3 3 3 4 7 9 10 12 23 30 34 Liberia - - - - - - - 55 4 4 2 4 0 0 0 0 0 0 Madagascar 28 17 17 21 27 29 18 6 8 9 10 12 15 16 21 25 28 30 Malawi 36 21 18 22 26 27 19 1 1 1 3 3 4 4 5 6 6 6 Mali 21 11 11 13 18 20 12 3 4 5 7 10 12 12 13 14 17 20 Mauritania 7 3 4 5 7 8 5 2 2 2 3 4 6 6 7 8 9 9 Mozambique 8 5 6 9 16 18 12 7 8 10 15 18 22 23 26 28 31 33 Nicaragua 12 7 2 3 6 7 4 2 3 3 4 3 7 7 9 10 11 12 Niger 16 8 6 8 8 7 4 2 2 2 2 3 5 5 5 6 8 8 Rwanda 12 3 2 4 6 6 2 2 2 2 2 4 6 7 7 8 8 8 São Tomé and Príncipe 1 0 0 0 0 1 0 0 0 0 0 0 0 0 0 0 0 0 Senegal 31 20 14 25 33 28 16 5 6 8 11 15 18 19 19 21 23 27 Sierra Leone 4 5 3 2 3 4 4 1 1 1 1 1 2 2 3 4 4 4 Tanzania 40 22 26 33 45 46 26 11 14 16 22 29 34 36 42 49 59 69 Togo - - - - - - - - 26 28 26 0 - - - - - - Uganda 26 23 28 35 42 46 25 5 8 10 13 19 25 27 28 30 31 38 Zambia 27 15 13 14 21 17 9 2 4 4 5 7 8 8 10 10 11 12
TOTAL 651 560 399 502 562 626 375 243 355 359 342 371 381 346 371 422 461 511
Sources: HIPC country documents, and World Bank staff estimates.
1/ From 2001 to 2011, information corresponds to debt service actually paid to the World Bank. Debt service projections from 2012 onwards are based on stocks as of end-December 2011.
2/ Debt Service before HIPC Initiative Debt Relief includes accumulated arrears for Central African Republic - USD 65.9 mil, Democratic Republic of Congo -USD 328.6 mil., Côte d’Ivoire -USD 256.9 mil., Haiti-USD 52.3 mil, Liberia - USD 366.9 mil., and Togo - USD 98.0 mil.
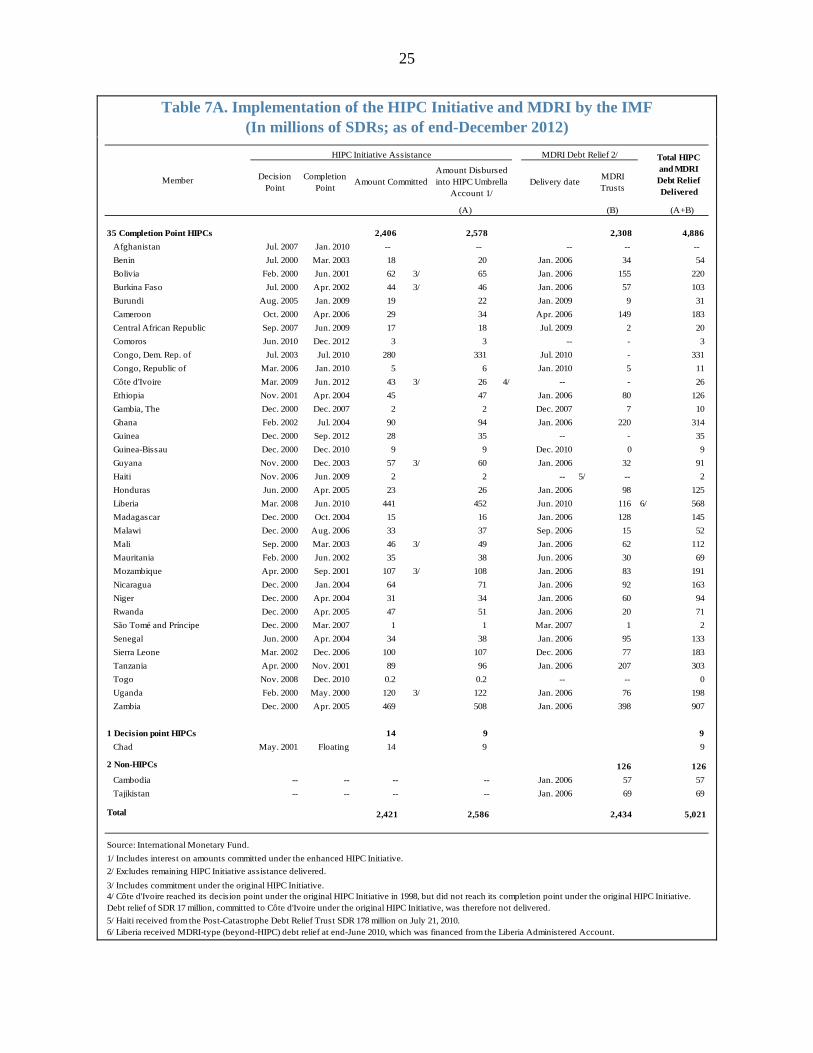
25
Table 7A. Implementation of the HIPC Initiative and MDRI by the IMF (In millions of SDRs; as of end-December 2012)
(A) (A+B)
35 Completion Point HIPCs 2,406 2,578 2,308 4,886 Afghanistan Jul. 2007 Jan. 2010 -- -- -- -- -- Benin Jul. 2000 Mar. 2003 18 20 Jan. 2006 34 54 Bolivia Feb. 2000 Jun. 2001 62 3/ 65 Jan. 2006 155 220 Burkina Faso Jul. 2000 Apr. 2002 44 3/ 46 Jan. 2006 57 103 Burundi Aug. 2005 Jan. 2009 19 22 Jan. 2009 9 31 Cameroon Oct. 2000 Apr. 2006 29 34 Apr. 2006 149 183 Central African Republic Sep. 2007 Jun. 2009 17 18 Jul. 2009 2 20 Comoros Jun. 2010 Dec. 2012 3 3 -- - 3 Congo, Dem. Rep. of Jul. 2003 Jul. 2010 280 331 Jul. 2010 - 331 Congo, Republic of Mar. 2006 Jan. 2010 5 6 Jan. 2010 5 11 Côte d'Ivoire Mar. 2009 Jun. 2012 43 3/ 26 4/ -- - 26 Ethiopia Nov. 2001 Apr. 2004 45 47 Jan. 2006 80 126 Gambia, The Dec. 2000 Dec. 2007 2 2 Dec. 2007 7 10 Ghana Feb. 2002 Jul. 2004 90 94 Jan. 2006 220 314 Guinea Dec. 2000 Sep. 2012 28 35 -- - 35 Guinea-Bissau Dec. 2000 Dec. 2010 9 9 Dec. 2010 0 9 Guyana Nov. 2000 Dec. 2003 57 3/ 60 Jan. 2006 32 91 Haiti Nov. 2006 Jun. 2009 2 2 -- 5/ -- 2 Honduras Jun. 2000 Apr. 2005 23 26 Jan. 2006 98 125 Liberia Mar. 2008 Jun. 2010 441 452 Jun. 2010 116
6/ 568
Madagascar Dec. 2000 Oct. 2004 15 16 Jan. 2006 128 145 Malawi Dec. 2000 Aug. 2006 33 37 Sep. 2006 15 52 Mali Sep. 2000 Mar. 2003 46 3/ 49 Jan. 2006 62 112 Mauritania Feb. 2000 Jun. 2002 35 38 Jun. 2006 30 69 Mozambique Apr. 2000 Sep. 2001 107 3/ 108 Jan. 2006 83 191 Nicaragua Dec. 2000 Jan. 2004 64 71 Jan. 2006 92 163 Niger Dec. 2000 Apr. 2004 31 34 Jan. 2006 60 94 Rwanda Dec. 2000 Apr. 2005 47 51 Jan. 2006 20 71 São Tomé and Príncipe Dec. 2000 Mar. 2007 1 1 Mar. 2007 1 2 Senegal Jun. 2000 Apr. 2004 34 38 Jan. 2006 95 133 Sierra Leone Mar. 2002 Dec. 2006 100 107 Dec. 2006 77 183 Tanzania Apr. 2000 Nov. 2001 89 96 Jan. 2006 207 303 Togo Nov. 2008 Dec. 2010 0.2 0.2 -- -- 0 Uganda Feb. 2000 May. 2000 120 3/ 122 Jan. 2006 76 198 Zambia Dec. 2000 Apr. 2005 469 508 Jan. 2006 398 907
1 Decision point HIPCs 14 9 9 Chad May. 2001 Floating 14 9 9
126 126 Cambodia -- -- -- -- Jan. 2006 57 57 Tajikistan -- -- -- -- Jan. 2006 69 69
2,421 2,586 2,434 5,021
1/ Includes interest on amounts committed under the enhanced HIPC Initiative.2/ Excludes remaining HIPC Initiative assistance delivered.3/ Includes commitment under the original HIPC Initiative.
5/ Haiti received from the Post-Catastrophe Debt Relief Trust SDR 178 million on July 21, 2010.6/ Liberia received MDRI-type (beyond-HIPC) debt relief at end-June 2010, which was financed from the Liberia Administered Account.
(B)
Completion Point
Amount Committed
4/ Côte d'Ivoire reached its decision point under the original HIPC Initiative in 1998, but did not reach its completion point under the original HIPC Initiative. Debt relief of SDR 17 million, committed to Côte d'Ivoire under the original HIPC Initiative, was therefore not delivered.
MDRI Debt Relief 2/ Total HIPC and MDRI Debt Relief Delivered
Member DecisionPoint
HIPC Initiative Assistance
Source: International Monetary Fund.
Delivery date MDRI Trusts
2 Non-HIPCs
Total
Amount Disbursed into HIPC Umbrella
Account 1/

26
Table 7B. IMF HIPC Initiative and MDRI Debt Relief, 1998-2012 1/ 2/
(In millions of US dollars; as of end-December 2012)
HIPC Initiative debt relief 2/Afghanistan - - - - - - - - - - - - - - - - Benin - - 2.4 4.7 4.8 6.0 5.1 2.3 2.9 - - - - - - 28.2 Bolivia 5.5 10.7 9.7 8.6 10.4 9.7 18.8 14.4 9.0 - - - - - - 96.7 Burkina Faso - - 2.9 6.0 6.0 14.3 17.1 14.6 7.5 - - - - - - 68.3 Burundi - - - - - - - 0.1 0.1 0.1 0.1 32.9 - - - 33.3 Cameroon - - 1.2 1.2 0.4 0.0 5.1 1.3 39.8 - - - - - - 49.0 Central African Republic - - - - - - - - - - 5.5 22.7 - - - 28.1 Chad - - - 1.8 2.8 4.0 1.2 2.0 0.0 0.0 0.0 0.0 0.0 - - 11.9 Comoros - - - - - - - - - - - - - - 4.6 4.6 Congo, Dem. Rep. of - - - - - 0.8 1.7 1.7 0.9 0.0 0.0 22.5 467.6 - - 495.2 Congo, Republic of - - - - - - - - - - 0.1 0.1 9.6 - - 9.7 Cote d'Ivoire - - - - - - - - - - - 7.8 7.7 7.9 17.1 40.4 Ethiopia - - - 0.7 5.3 5.6 3.9 6.0 47.7 - - - - - - 69.2 Gambia, The - - - 0.0 0.0 0.1 0.0 0.0 0.0 3.5 - - - - - 3.6 Ghana - - - - 9.5 18.9 20.3 24.4 66.8 - - - - - - 139.9 Guinea - - - 3.1 1.2 2.2 0.4 0.0 0.0 1.1 6.5 0.1 - - 38.9 53.6 Guinea Bissau - - - 0.7 0.0 0.0 0.0 0.0 0.0 0.0 0.0 0.0 13.6 - - 14.3 Guyana - 7.7 8.5 10.4 7.2 9.3 13.8 11.3 19.8 - - - - - - 88.0 Haiti - - - - - - - - 0.0 0.1 0.2 3.3 - - - 3.6 Honduras - - - 1.3 4.6 0.0 5.7 13.4 13.6 - - - - - - 38.5 Liberia - - - - - - - - - - 17.6 10.2 642.5 - - 670.3 Madagascar - - - 0.9 1.9 4.1 1.7 2.6 12.9 - - - - - - 24.1 Malawi - - - 2.9 0.0 2.5 4.2 3.8 41.3 - - - - - - 54.8 Mali - - 0.7 6.7 8.9 11.3 14.0 12.4 18.6 - - - - - - 72.5 Mauritania - - 5.0 7.9 10.4 11.0 8.4 4.9 6.6 - - - - - - 54.2 Mozambique - 14.0 29.7 26.5 17.2 12.1 13.6 15.7 34.6 - - - - - - 163.4 Nicaragua - - - - 0.9 2.6 9.0 24.0 71.7 - - - - - - 108.1 Niger - - - 0.5 1.4 4.2 7.6 10.7 26.1 - - - - - - 50.6 Rwanda - - - 8.6 4.3 0.0 4.7 8.1 47.9 - - - - - - 73.6 São Tomé and Príncipe - - - - - - - - - 1.4 - - - - - 1.4 Senegal - - 1.9 4.3 4.4 7.2 14.8 14.9 8.2 - - - - - - 55.7 Sierra Leone - - - - 30.6 33.3 22.0 6.0 61.0 - - - - - - 152.9 Tanzania - - 15.4 19.4 20.9 17.1 16.2 10.9 39.8 - - - - - - 139.8 Togo - - - - - - - - - - 0.0 0.1 0.2 - - 0.3 Uganda 8.2 15.5 27.6 26.6 22.1 23.1 25.0 17.2 17.5 - - - - - - 182.8 Zambia - - - 170.4 155.1 165.5 2.4 229.0 6.1 - - - - - - 728.4
TOTAL 13.7 47.9 105.0 313.1 330.3 364.9 236.8 451.7 600.3 6.2 30.0 99.7 1,141.3 7.9 60.5 3,809.2
2010 Total2004 2005 2006 2007 2008 2009 2011 201220031998 1999 2000 2001 2002

27
Table 7B. IMF HIPC Initiative and MDRI Debt Relief, 1998-2012 1/ 2/
(In millions of US dollars; as of end-December 2012)
2010 Total2004 2005 2006 2007 2008 2009 2011 201220031998 1999 2000 2001 2002
MDRI debt relief
Afghanistan - - - - - - - - - - - - - - - - Benin - - - - - - - - 49.3 - - - - - - 49.3 Bolivia - - - - - - - - 223.7 - - - - - - 223.7 Burkina Faso - - - - - - - - 82.4 - - - - - - 82.4 Burundi - - - - - - - - - - - 13.4 - - - 13.4 Cameroon - - - - - - - - 219.4 - - - - - - 219.4 Central African Republic - - - - - - - - - - - 2.9 - - - 2.9 Chad - - - - - - - - - - - - - - - - Comoros - - - - - - - - - - - - - - - - Congo, Dem. Rep. of - - - - - - - - - - - - - - - - Congo, Republic of - - - - - - - - - - - - 7.5 - - 7.5 Côte d’Ivoire - - - - - - - - - - - - - - - - Ethiopia - - - - - - - - 115.1 - - - - - - 115.1 Gambia, The - - - - - - - - - 11.6 - - - - - 11.6 Ghana - - - - - - - - 317.9 - - - - - - 317.9 Guinea - - - - - - - - - - - - - - - - Guinea Bissau - - - - - - - - - - - - - - - - Guyana - - - - - - - - 45.6 - - - - - - 45.6 Haiti 3/ - - - - - - - - - - - - - - - - Honduras - - - - - - - - 141.9 - - - - - - 141.9 Liberia 4/ - - - - - - - - - - - - 177.3 - - 177.3 Madagascar - - - - - - - - 185.6 - - - - - - 185.6 Malawi - - - - - - - - 21.6 - - - - - - 21.6 Mali - - - - - - - - 90.2 - - - - - - 90.2 Mauritania - - - - - - - - 44.5 - - - - - - 44.5 Mozambique - - - - - - - - 120.0 - - - - - - 120.0 Nicaragua - - - - - - - - 132.6 - - - - - - 132.6 Niger - - - - - - - - 86.4 - - - - - - 86.4 Rwanda - - - - - - - - 29.1 - - - - - - 29.1 São Tomé and Príncipe - - - - - - - - - 1.6 - - - - - 1.6 Senegal - - - - - - - - 136.9 - - - - - - 136.9 Sierra Leone - - - - - - - - 115.2 - - - - - - 115.2 Tanzania - - - - - - - - 299.0 - - - - - - 299.0 Togo - - - - - - - - - - - - - - - - Uganda - - - - - - - - 109.6 - - - - - - 109.6 Zambia - - - - - - - - 575.7 - - - - - - 575.7
- - To non-HIPCs - -
Cambodia - - - - - - - - 82.1 - - - - - - 82.1 Tajikistan - - - - - - - - 100.1 - - - - - - 100.1
- - - TOTAL - - - - - - - - 3,324.0 13.2 - 16.4 184.8 - - 3,538.3
Source: International Monetary Fund.1/ The figures in this table were converted from SDR amounts using annual average US$/SDR exchange rates for the HIPC disbursements and the exchange rate on the date ofdelivery of final debt relief disbursement.
2/ Includes also interest earned both on the commitment amount in PRG-HIPC Trust and on the amount in HIPC Umbrella Account.3/ Haiti also received from the Post-Catastrophe Debt Relief Trust SDR 178 million on July 21, 2010.4/ Liberia received MDRI-type (beyond-HIPC) debt relief at end-June 2010, which was financed from the Liberia Administered Account.
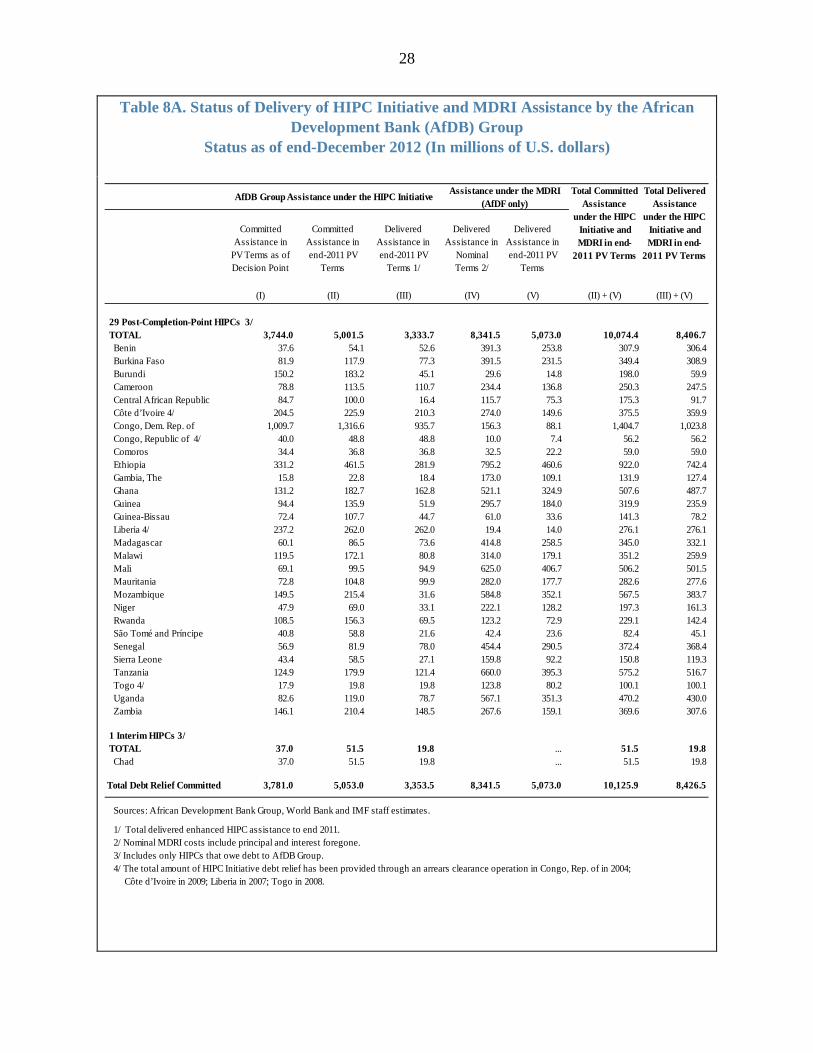
28
Table 8A. Status of Delivery of HIPC Initiative and MDRI Assistance by the African Development Bank (AfDB) Group
Status as of end-December 2012 (In millions of U.S. dollars)
AfDB Group Assistance under the HIPC Initiative Assistance under the MDRI (AfDF only)
Total Committed Assistance
Total Delivered Assistance
Committed Assistance in
PV Terms as of Decision Point
Committed Assistance in end-2011 PV
Terms
Delivered Assistance in end-2011 PV
Terms 1/
Delivered Assistance in
Nominal Terms 2/
Delivered Assistance in end-2011 PV
Terms
under the HIPC Initiative and MDRI in end-
2011 PV Terms
under the HIPC Initiative and MDRI in end-
2011 PV Terms
(I) (II) (III) (IV) (V) (II) + (V) (III) + (V)
29 Post-Completion-Point HIPCs 3/ TOTAL 3,744.0 5,001.5 3,333.7 8,341.5 5,073.0 10,074.4 8,406.7
Benin 37.6 54.1 52.6 391.3 253.8 307.9 306.4Burkina Faso 81.9 117.9 77.3 391.5 231.5 349.4 308.9Burundi 150.2 183.2 45.1 29.6 14.8 198.0 59.9Cameroon 78.8 113.5 110.7 234.4 136.8 250.3 247.5Central African Republic 84.7 100.0 16.4 115.7 75.3 175.3 91.7Côte d’Ivoire 4/ 204.5 225.9 210.3 274.0 149.6 375.5 359.9Congo, Dem. Rep. of 1,009.7 1,316.6 935.7 156.3 88.1 1,404.7 1,023.8Congo, Republic of 4/ 40.0 48.8 48.8 10.0 7.4 56.2 56.2Comoros 34.4 36.8 36.8 32.5 22.2 59.0 59.0Ethiopia 331.2 461.5 281.9 795.2 460.6 922.0 742.4Gambia, The 15.8 22.8 18.4 173.0 109.1 131.9 127.4Ghana 131.2 182.7 162.8 521.1 324.9 507.6 487.7Guinea 94.4 135.9 51.9 295.7 184.0 319.9 235.9Guinea-Bissau 72.4 107.7 44.7 61.0 33.6 141.3 78.2Liberia 4/ 237.2 262.0 262.0 19.4 14.0 276.1 276.1Madagascar 60.1 86.5 73.6 414.8 258.5 345.0 332.1Malawi 119.5 172.1 80.8 314.0 179.1 351.2 259.9Mali 69.1 99.5 94.9 625.0 406.7 506.2 501.5Mauritania 72.8 104.8 99.9 282.0 177.7 282.6 277.6Mozambique 149.5 215.4 31.6 584.8 352.1 567.5 383.7Niger 47.9 69.0 33.1 222.1 128.2 197.3 161.3Rwanda 108.5 156.3 69.5 123.2 72.9 229.1 142.4São Tomé and Príncipe 40.8 58.8 21.6 42.4 23.6 82.4 45.1Senegal 56.9 81.9 78.0 454.4 290.5 372.4 368.4Sierra Leone 43.4 58.5 27.1 159.8 92.2 150.8 119.3Tanzania 124.9 179.9 121.4 660.0 395.3 575.2 516.7Togo 4/ 17.9 19.8 19.8 123.8 80.2 100.1 100.1Uganda 82.6 119.0 78.7 567.1 351.3 470.2 430.0Zambia 146.1 210.4 148.5 267.6 159.1 369.6 307.6
1 Interim HIPCs 3/ TOTAL 37.0 51.5 19.8 ... 51.5 19.8
Chad 37.0 51.5 19.8 ... 51.5 19.8
Total Debt Relief Committed 3,781.0 5,053.0 3,353.5 8,341.5 5,073.0 10,125.9 8,426.5
Sources: African Development Bank Group, World Bank and IMF staff estimates.
1/ Total delivered enhanced HIPC assistance to end 2011.2/ Nominal MDRI costs include principal and interest foregone.3/ Includes only HIPCs that owe debt to AfDB Group.4/ The total amount of HIPC Initiative debt relief has been provided through an arrears clearance operation in Congo, Rep. of in 2004; Côte d’Ivoire in 2009; Liberia in 2007; Togo in 2008.

29
Table 8B. AfDB Group Debt Service after HIPC Initiative and MDRI Debt Relief, 2000-2015
(In millions of U.S. dollars)
2000 2001 2002 2003 2004 2005 2006 2007 2008 2009 2010 2011 2012 2013 2014 2015
Debt service before HIPC Initiative Debt Relief
Benin 5 4 8 7 9 9 12 6 6 10 14 15 16 16 17 17 Burkina Faso 8 4 10 9 9 8 11 6 7 8 10 10 10 12 13 14 Burundi 0 - - 3 29 18 6 7 7 1 1 1 1 1 1 1 Central African Republic - - 0 - - - - 49 5 3 2 2 2 2 2 2 Cameroon 47 25 63 41 40 38 38 28 28 29 16 29 27 26 26 25 Chad 3 1 7 6 3 10 7 9 9 11 12 12 13 14 26 26 Comoros - - - - - 1 0.2 22 8 41 1 1 2 3 3 3 Congo, Democratic Republic of - - 65 73 42 118 121 128 142 156 153 184 155 184 186 186 Congo, Republic of 1/ 7 - 0 33 148 55 27 19 13 13 0 11 11 10 10 1 Côte d'Ivoire 0 46 197 0 1 - - 58 102 598 44 36 31 16 17 11 Ethiopia 45 34 46 46 49 49 50 33 33 23 22 28 42 40 38 39 Gambia, The 3 3 3 3 4 4 4 5 4 3 4 4 4 6 8 8 Ghana 31 16 37 29 30 32 40 24 24 15 14 19 19 28 31 30 Guinea 24 18 26 22 53 18 18 18 17 18 17 19 15 25 25 25 Guinea-Bissau - 4 4 4 4 4 4 4 4 5 6 1 2 2 2 2 Madagascar 13 10 14 12 10 9 13 7 7 9 10 14 23 31 35 35 Malawi 10 7 10 11 12 12 12 6 7 7 7 8 6 7 7 7 Mali 7 6 14 9 13 14 20 9 10 12 16 24 24 27 27 28 Mauritania 12 8 12 12 12 13 18 14 13 14 14 19 18 18 23 21 Mozambique 3 6 7 7 8 7 13 8 9 11 13 26 24 26 27 28 Niger 1 2 3 3 5 5 10 4 4 5 4 5 5 5 6 6 Liberia - - - - - 0 0 149 98 12 3 3 3 3 3 2 Rwanda 6 4 8 7 8 9 11 4 4 5 5 6 6 7 7 8 São Tomé and Príncipe 1 1 2 2 2 2 2 3 1 1 1 1 1 1 1 1 Senegal 25 14 31 24 26 26 29 25 26 28 29 36 22 23 24 25 Sierra Leone 2 2 3 4 5 5 6 5 2 3 3 3 3 4 5 5 Tanzania 11 8 12 15 16 16 21 11 13 15 16 18 18 19 19 21 Togo 0 1 - - - - - - 22 4 4 4 5 5 5 5 Uganda 7 5 9 10 12 12 19 9 9 11 12 19 29 34 36 37 Zambia 31 24 24 26 27 26 28 17 12 11 10 10 10 9 10 9 TOTAL 302 251 616 418 578 521 541 684 648 1,082 463 568 547 603 637 625
Debt service after HIPC Initiative debt relief 2/Benin 3 - 3 2 3 4 6 0 1 7 14 15 16 16 17 17Burkina Faso 4 - 3 2 3 3 6 0 1 2 4 4 4 5 6 8 Burundi 0 - - 3 29 15 0 0 1 - - - - - - - Central African Republic - - 0 - - - - 49 1 - - - - - - - Cameroon 44 13 52 35 40 38 27 10 13 15 10 27 27 26 26 25 Chad 3 - 3 2 - 7 7 9 9 11 12 12 13 14 26 26 Comoros - - - - - 1 0 22 8 6 1 1 2 3 3 3 Congo, Democratic Republic of - - 65 72 - 19 10 13 24 36 31 61 30 60 63 64 Congo, Republic of 1/ 7 - 0 33 106 55 27 19 13 13 0 11 11 10 10 1 Côte d'Ivoire 0 46 197 0 1 - - 58 102 399 44 36 31 16 17 11 Ethiopia 45 34 15 16 19 20 21 5 6 3 2 9 22 19 18 18 Gambia, The 3 0 1 1 4 4 4 5 2 0 1 1 1 4 8 8 Ghana 31 16 19 8 10 13 22 8 8 4 7 12 12 26 31 30 Guinea 24 7 15 12 53 18 18 18 6 18 17 19 15 25 25 25 Guinea-Bissau - - - 0 1 1 1 3 1 - - - - - - - Madagascar 13 1 5 5 10 4 7 1 1 2 3 6 15 28 35 35 Malawi 10 - 3 4 5 12 12 - - - - - - - - - Mali 5 - 5 1 5 6 11 0 1 2 9 24 24 27 27 28 Mauritania 5 - 3 3 4 5 10 6 5 6 6 16 18 18 23 21 Mozambique 2 4 5 5 5 4 11 5 6 7 10 26 24 26 27 28 Niger 1 - 1 1 2 2 7 0 0 1 1 1 1 1 2 2 Liberia - - - - - 0 0 - 98 12 3 3 3 3 3 2 Rwanda 6 - 2 2 3 5 4 - - - - - - - - - São Tomé and Príncipe 1 - 1 0 1 1 1 1 - - - - - - - - Senegal 20 6 23 20 11 8 20 25 26 28 29 36 22 23 24 25 Sierra Leone 2 2 2 1 2 2 3 2 - - - - - 0 1 1 Tanzania 6 - 4 5 6 7 11 1 2 4 5 7 6 6 6 7 Togo 0 1 - - - - - - 5 4 4 4 5 5 5 5 Uganda 3 - 3 4 5 5 12 1 3 4 5 12 27 34 36 37 Zambia 31 2 5 7 27 17 10 3 3 2 2 4 4 4 4 3 TOTAL 271 130 437 243 356 274 269 265 346 588 221 348 334 400 441 429
ProjectedActuals

30
Table 8B (concluded). AfDB Group Debt Service after HIPC Initiative and MDRI Debt
Relief, 2000-2015 (In millions of U.S. dollars)
2000 2001 2002 2003 2004 2005 2006 2007 2008 2009 2010 2011 2012 2013 2014 2015
Debt service after HIPC Initiative debt relief and MDRIBenin 3 - 3 2 3 4 4 - - 1 4 4 4 4 4 4 Burkina Faso 4 - 3 2 3 3 4 - - - - - - - - 0 Burundi 0 - - 3 29 15 0 0 1 - - - - - - - Central African Republic - - 0 - - - - 49 1 - - - - - - - Cameroon 44 13 52 35 40 38 26 8 11 13 8 23 22 21 21 20 Chad 3 - 3 2 - 7 7 9 9 11 12 12 13 14 14 14 Comoros - - - - - 1 0 22 8 6 1 1 2 2 2 2 Congo, Democratic Republic of - - 65 72 - 19 10 13 24 36 30 58 28 57 60 61 Congo, Republic of 1/ 7 - 0 33 106 55 27 19 13 13 - 11 10 10 9 0 Côte d'Ivoire 0 46 197 0 1 - - 58 102 399 44 36 29 11 11 6 Ethiopia 45 34 15 16 19 20 15 - - - - - 12 8 6 7 Gambia, The 3 0 1 1 4 4 4 5 - - - - - - 2 2 Ghana 31 16 19 8 10 13 16 1 1 - - 4 3 10 14 14 Guinea 24 7 15 12 53 18 18 18 6 18 17 19 15 14 14 14 Guinea-Bissau - - - 0 1 1 1 3 1 - - - - - - - Madagascar 13 1 5 5 10 4 4 - - - - 1 10 18 21 21 Malawi 10 - 3 4 5 12 12 - - - - - - - - - Mali 5 - 5 1 5 6 7 - - - - 6 5 6 7 7 Mauritania 5 - 3 3 4 5 9 4 3 3 3 9 10 10 14 12 Mozambique 2 4 5 5 5 4 7 0 1 2 3 14 13 13 13 13 Niger 1 - 1 1 2 2 5 - - - - - - - - - Liberia - - - - - 0 0 - 98 12 2 2 2 2 2 1 Rwanda 6 - 2 2 3 5 2 - - - - - - - - - São Tomé and Príncipe 1 - 1 0 1 1 1 1 - - - - - - - - Senegal 20 6 23 20 11 8 16 17 17 19 19 25 11 11 12 12 Sierra Leone 2 2 2 1 2 2 2 - - - - - - - - - Tanzania 6 - 4 5 6 7 7 - - - - - - - - - Togo 0 1 - - - - - - 5 4 4 0 1 0 0 0 Uganda 3 - 3 4 5 5 8 - - - - 6 14 18 18 20 Zambia 31 2 5 7 27 17 8 0 - - - - - - - - TOTAL 271 130 437 243 356 274 221 228 302 536 148 232 201 229 244 231
Sources: African Development Bank Group.
1/ The total amount of HIPC Initiative debt relief has been provided through arrears clearance operation.2/ Debt service after HIPC for interim HIPC countries assumes that interim debt relief is provided according to the
schedule determined at decision point.
Actuals Projected
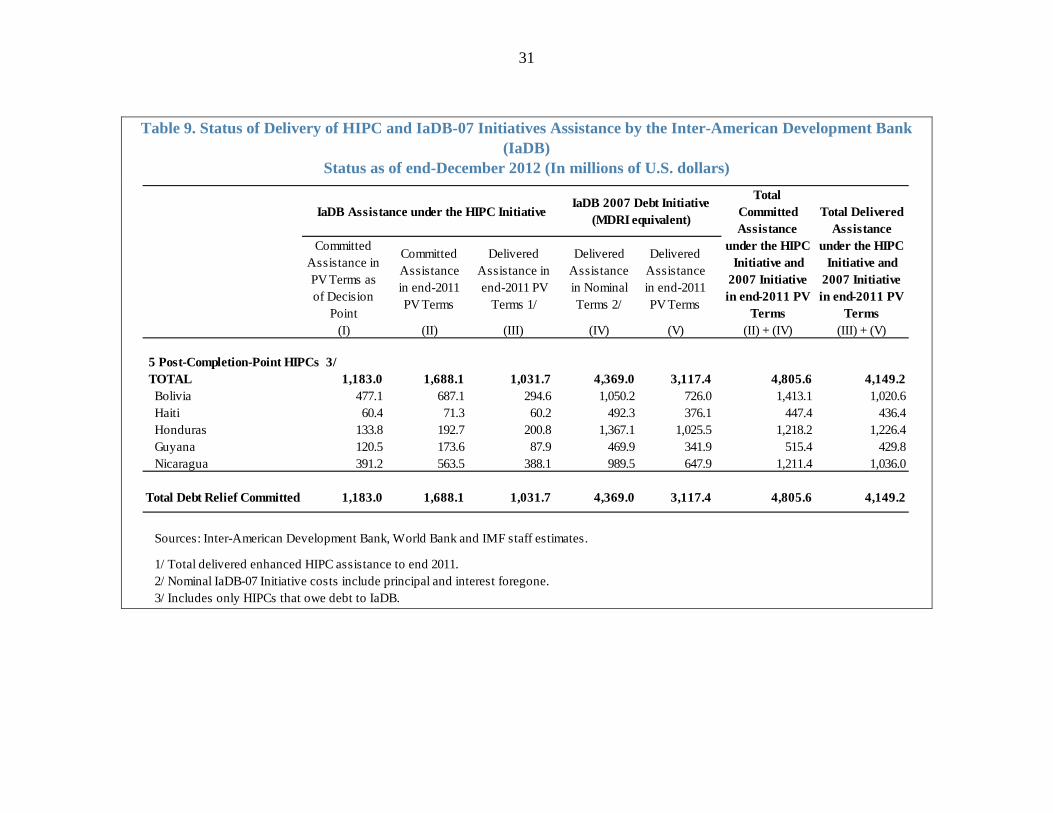
31
Table 9. Status of Delivery of HIPC and IaDB-07 Initiatives Assistance by the Inter-American Development Bank
(IaDB) Status as of end-December 2012 (In millions of U.S. dollars)
IaDB Assistance under the HIPC InitiativeIaDB 2007 Debt Initiative
(MDRI equivalent)
Total Committed Assistance
Total Delivered Assistance
Committed Assistance in PV Terms as of Decision
Point
Committed Assistance in end-2011 PV Terms
Delivered Assistance in end-2011 PV
Terms 1/
Delivered Assistance in Nominal Terms 2/
Delivered Assistance in end-2011 PV Terms
under the HIPC Initiative and
2007 Initiative in end-2011 PV
Terms
under the HIPC Initiative and
2007 Initiative in end-2011 PV
Terms(I) (II) (III) (IV) (V) (II) + (IV) (III) + (V)
5 Post-Completion-Point HIPCs 3/ TOTAL 1,183.0 1,688.1 1,031.7 4,369.0 3,117.4 4,805.6 4,149.2
Bolivia 477.1 687.1 294.6 1,050.2 726.0 1,413.1 1,020.6Haiti 60.4 71.3 60.2 492.3 376.1 447.4 436.4Honduras 133.8 192.7 200.8 1,367.1 1,025.5 1,218.2 1,226.4Guyana 120.5 173.6 87.9 469.9 341.9 515.4 429.8Nicaragua 391.2 563.5 388.1 989.5 647.9 1,211.4 1,036.0
Total Debt Relief Committed 1,183.0 1,688.1 1,031.7 4,369.0 3,117.4 4,805.6 4,149.2
Sources: Inter-American Development Bank, World Bank and IMF staff estimates.
1/ Total delivered enhanced HIPC assistance to end 2011.2/ Nominal IaDB-07 Initiative costs include principal and interest foregone.3/ Includes only HIPCs that owe debt to IaDB.

32
Table 10. Status of Donor Contributions to the Debt Relief Trust Fund (In millions of U.S. dollars, as of end-December 2012)
Bilateral DonorsResources
Contributed /1Accumulated
Investment IncomeResources Allocated
for Debt Relief GrantsAvailable
Balance /6
Australia 13 2 (15) 0Austria /1 62 5 (63) 4Belgium /1/2 59 3 (56) 6Canada /2/3 195 49 (188) 55Denmark 72 0 (55) 17EU 953 70 (1,021) 1Finland /2 94 15 (70) 40France /2/3 59 10 (41) 28Germany /1/2/3/5 195 20 (162) 53Greece 5 2 (5) 3Iceland 3 0 (3) 0Ireland /2 27 7 (24) 10Italy /2 99 7 (89) 16Japan /2 258 50 (205) 104Korea 10 1 (9) 2Luxembourg 1 0 (1) 0Netherlands /1/2 373 25 (356) 42New Zealand 2 0 (2) 0Norway /1 332 47 (314) 66Portugal 15 1 (16) 0Russia 25 6 (19) 11Spain /2 125 6 (113) 18Sweden /2 105 22 (100) 27Switzerland /2 100 25 (96) 28United Kingdom /4 423 5 (428) 1United States /5 675 15 (687) 2Sub-Total 4,280 392 (4,137) 535
Multilateral DonorsIBRD 2,330 202 (2,532) 0NDF 33 5 (35) 4BOAD 1 0 (2) 0Sub-Total 2,365 207 (2,568) 4
TOTAL /4 6,644 599 (6,705) 539
1/ Includes contributions earmarked for IDA under IDA 14th, 15th and 16th Replenishments. IDA Replenishment contributions that have not been converted into U.S. dollars are reported at the market rates of exchange prevailing at the end of the reporting period. 2/ Includes investment income allocations made towards IDA for debt relief to Haiti.3/ Includes investment income allocations made towards IFAD for debt relief to Haiti.4/ Includes the allocation in the amount of US$ 43 million towards IMF for debt relief to Uganda.5/ Does not include pledges that have not been paid-in.6/ The total available balance does not include an amount of approximately US$ 2 million of investment income accumulated in disbursing accounts.

33
Table 11. HIPC Initiative: Cost Estimates to Paris Club Official Bilateral Creditors by Creditor Country 1/
(In millions of U.S. dollars, in end-2011 PV terms)
Au
stra
lia
Au
stri
a
Bel
giu
m
Bra
zil
Can
ada
Den
mar
k
Fin
lan
d
Fra
nce
Ger
man
y
Irel
and
Isra
el
Ital
y
Jap
an
Lu
xem
bo
urg
Net
her
lan
ds
No
rway
Po
rtu
gal
Ru
ssia
So
uth
Afr
ica
Sp
ain
Sw
eden
Sw
itze
rlan
d
Tri
nid
ad &
T
ob
ago
Un
ited
Kin
gd
om
Un
ited
Sta
tes
IDA
-ad
min
iste
red
E
EC
Lo
ans
Total 36 Post-Decision-Point HIPCs 1/ 1/ 2/ 1/ 1/ 1/
86 87 88 89 90 91 92 93 94 95 96 97 98 99 100 101 102 103 104 105 106 107 108 109 110 22Afghanistan - - - - - - - - 8 - - - - - - - - 433 - - - - - - 42 - 482 Benin - - 1 - 0 - - 38 2 - - 14 12 - 5 14 - 2 - - - - - 2 0 - 92 Bolivia - 14 32 - 2 1 - 27 142 - - 30 211 - 12 - - - - 64 1 - - 14 33 - 584 Burkina Faso - 2 - - - - - 15 - - - 4 - - 4 - - 1 - 6 - - - 1 - - 33 Burundi - 4 0 - - 0 - 70 0 - - 0 31 - 0 - - 3 - - - - - 0 - - 108 Central African Republic - 3 - - - - - 8 3 - - 4 2 - - 0 - 1 - - - 12 - 1 6 0 38 Cameroon - 104 48 - 49 23 0 603 208 - - 51 14 - 10 - - - - 36 18 12 - 51 19 - 1,247 Chad - 0 - - - - - 16 0 - - 2 - - 0 - - 0 - 2 - - - - - - 20 Comoros - - - - - - - 8 - - - 0 - 0 - - - - - - - - - - - 0 9 Congo, Dem. Rep. of - 48 639 2 27 - - 1,085 463 - - 547 639 - 217 12 - - - 17 73 11 - 108 1,421 3 5,311 Congo, Republic of - - 14 39 14 0 - 655 51 0 - 57 - 0 0 - - 39 - 71 - 3 - 62 14 - 1,020
Côte d'Ivoire - 12 29 4 38 - - 1,025 91 - - 19 43 - 39 8 - - - 65 - 3 - 22 83 - 1,480 Ethiopia 4 4 1 - 0 - 1 3 38 - - 85 12 - 1 - - 478 - 10 14 - - 7 46 - 705 Gambia, The - 3 - - - - - 2 - - - - - - 1 1 - - - - - - - - - - 7 Ghana - 19 2 - 14 - 6 70 88 - - 23 688 - 61 - - - - 34 21 - - 100 26 - 1,153 Guinea - 2 2 2 - - - 128 1 - - 13 48 - - 5 - 30 - 4 - - - 1 34 0.4 271 Guinea-Bissau - - 5 9 - - - 7 2 - - 103 - - - - - 14 - 10 - - - - - - 150 Guyana - - - - 2 1 - 1 9 - - - 1 - 6 - - 3 - - - - 158 67 17 - 265 Haiti - - - - 0 - - 8 - - - 4 - - - - - - - 2 - - - - 2 0 18 Honduras - - - - 2 2 - 7 11 - - 21 135 - 3 0 - - - 43 - 1 - - 18 - 243 Liberia - - 40 - - 29 1 194 211 - - 63 82 - 35 14 - - - - 10 3 - 16 251 1 948 Madagascar - 11 10 - 9 - - 132 26 - 0 44 199 - - - - 74 - 37 4 2 - 9 8 - 564 Malawi - 10 - - - - - 6 0 - - - 166 - - - - - - 4 - - - 16 - 1 203 Mali - - - - - - - 92 - - - 0 38 - 1 - - 29 - - - - - 4 0 - 164 Mauritania - 30 - 11 - - - 75 2 - - 0 42 - 14 - - - - 17 - - - 4 2 - 198 Mozambique - 10 - 129 - - - 288 123 - - 273 84 - - - 248 225 - 31 5 - - 79 28 - 1,523 Nicaragua 1 1 - 44 - - 8 49 318 - 1 59 148 - 25 - - 361 - 197 - - - 1 38 - 1,253 Niger - - - - - - - 110 - - - - 21 - - - - - - 9 - - - 9 6 - 154 Rwanda - 3 - - 3 - - 31 - - - - 13 - - - - - - - - - - - 1 - 50 São Tomé and Príncipe - - 1 - - - - 4 5 - - 7 - - - - - 1 - 3 - - - - - - 21 Senegal - - 2 - 1 5 - 72 22 - - 21 29 - 3 6 - - - 13 0 - - 0 6 - 182 Sierra Leone - 0 11 - - 0 - 18 10 0 - 41 97 0 20 7 - - - - - 12 - 9 48 - 273 Tanzania - 16 75 102 23 - - 80 47 - - 95 462 - 50 5 - 86 - 7 - - - 92 8 - 1,147 Togo - 4 18 - - - - 31 6 - - 1 15 - 4 - - - - 6 1 19 - 6 - 0 112 Uganda - 16 - - - - 2 17 1 - 6 50 37 - - 0 - - - 30 - - - 11 0 - 171 Zambia - 5 - 35 36 - - 100 284 - - 50 718 - 0 - - 65 - - - - - 152 123 2 1,570
Total 6 323 931 376 219 60 19 5,077 2,170 0 8 1,681 3,986 0 513 73 248 1,844 - 718 148 77 158 846 2,279 8 21,768
Sources: HIPC country documents, World Bank and IMF staff estimates.
1/ Creditor invited on a case-by-case basis to participate in some Paris Club agreements. 2/ Not a Paris Club member. In some cases, IDA-administered European Economic Commission (EEC) loans (which are treated as Paris Club debt) are apportioned among
EEC members. Amounts listed for Luxembourg correspond to its portion of such EEC loans.

34
Table 12. Debt Relief Committed and Delivered by the Paris Club Official Bilateral Creditors
(In millions of U.S. dollars, in end-2011 PV terms)
Debtor Country
HIPC Initiative
Assistance Committed
HIPC Initiative Assistance Provided
Debt Relief Beyond HIPC
Initiative Provided
Total Debt Relief
Provided
Debt-Relief-Provided to Debt-Relief-Committed (In percent)
35 Post-Completion-Point HIPCsTOTAL 21,747.074 21,747.1 17,056 38,803.4 178.4Afghanistan 482.5 482.5 621 1,103.2 228.7Benin 91.8 91.8 - 91.8 100.0Bolivia 583.6 583.6 - 583.6 100.0Burkina Faso 33.1 33.1 26 58.8 177.7Burundi 107.7 107.7 5 112.9 104.8Cameroon 1,246.8 1,246.8 3,728 4,975.0 399.0Central African Republic 38.5 38.5 6.9 45.4 117.9Congo, Democratic Republic of 5,311.4 5,311.4 1,366 6,677.0 125.7Congo, Republic of 1,019.4 1,019.4 1,486 2,504.9 245.7Comoros 3/ 8.7 8.7 - 8.7 100.0Côte d’Ivoire 1,480.3 1,480.3 4,663 6,142.9 415.0Ethiopia 704.6 704.6 233 937.9 133.1Gambia, The 6.9 6.9 - 6.9 100.0Guinea 271.3 271.3 293 564.4 208.0Guinea Bissau 149.7 149.7 28 178.0 118.9Ghana 1,153.0 1,153.0 687 1,839.6 159.6Guyana 264.7 264.7 43 307.7 116.2Haiti 17.6 17.6 77 94.1 534.4Honduras 242.9 242.9 1,069 1,311.9 540.1Liberia 948.3 948.3 112 1,060.8 111.9Madagascar 564.4 564.4 693 1,257.2 222.8Malawi 203.4 203.4 258 461.3 226.8Mali 163.9 163.9 - 163.9 100.0Mauritania 197.6 197.6 25 222.3 112.5Mozambique 1/ 1,522.6 1,522.6 - 1,522.6 100.0Nicaragua 1,252.7 1,252.7 184 1,436.6 114.7Niger 154.4 154.4 62 216.2 140.0Rwanda 49.8 49.8 10 59.4 119.3São Tomé and Príncipe 20.8 20.8 1 21.5 103.4Senegal 181.7 181.7 433 614.9 338.5Sierra Leone 273.3 273.3 26 299.3 109.5Tanzania 1,146.9 1,146.9 - 1,146.9 100.0Togo 111.7 111.7 432 543.4 486.5Uganda 170.8 170.8 - 170.8 100.0Zambia 1,570.1 1,570.1 491 2,061.4 131.3
1 Interim HIPCsTOTAL 2/ 20.4 … ... ... ...Chad 20.4 ... ... ... ...
TOTAL 21,767 ... ... ... ...
Sources: HIPC country documents, HIPC country authorities; and IMF staff estimates. 1/ Agreements with Portugal and Japan are still pending.2/ No information is available regarding the provision of interim debt relief to these countries by the Paris Club creditors.3/ Comoros' negotiations with the Paris Club are scheduled for end-February 2013.

35
Table 13. Paris Club Official Bilateral Creditors' Delivery of Debt Relief under Bilateral Initiatives beyond the HIPC Initiative 1/
Countries Covered ODA (In percent) Non-ODA (In percent) Provision of Relief
Pre-cutoff Date Debt
Post-cutoff Date Debt
Pre-cutoff Date Debt
Post-cutoff Date Debt Decision Point Completion Point
(In percent)(1) (2) (3) (4) (5) (6) (7)
Australia HIPCs 100 100 100 100 2/ 2/ 2/Austria HIPCs 100 - 100 - Case-by-case, flow StockBelgium HIPCs 100 100 3/ 100 - 100 flow StockCanada HIPCs 100 100 100 100 100 flow StockDenmark HIPCs 100 100 4/ 100 100 4/ 100 flow StockFrance HIPCs 100 100 100 - 100 flow 5/ StockFinland HIPCs 100 - 6/ 100 - 6/ - -Germany HIPCs 100 100 100 100 7/ 100 flow StockIreland - - - - - - -Italy HIPCs 100 100 8/ 100 100 8/ 100 flow StockJapan HIPCs 100 100 100 - - StockNetherlands, the HIPCs 100 9/ 100 100 - 90-100 flow 9/ StockNorway HIPCs 10/ 10/ 11/ 11/ - -Russia HIPCS - 12/ - 12/ 100 19/ 100 19/20/ - StockSpain HIPCs 100 100 13/ 100 100 13/ - StockSweden HIPCs - - 14/ 100 - - StockSwitzerland HIPCs - 15/ - 15/ 100 16/ - 100 flow 16/ StockUnited Kingdom HIPCs 100 100 100 100 17/ 100 flow 17/ StockUnited States 18/ HIPCs 100 100 100 100 100 flow Stock
Source: Paris Club Secretariat.
1/ Columns (1) to (7) describe the additional debt relief provided following a specific methodology under bilateral initiatives and need to be read as a whole for each creditor. In column (1), "HIPCs" stands for eligible countries effectively qualifying for the HIPC process. A "100 percent" mention in the table indicates that the debt relief provided under the enhanced HIPC Initiative framework will be topped up to 100 percent through a bilateral initiative.2/ Australia: Australia cancelled all HIPC claims.3/ Belgium: cancellation at completion point 100 percent of ODA loans contracted before December 31, 2000.4/ Denmark provides 100 percent cancellation of ODA loans and non-ODA credits contracted and disbursed before September 27, 1999.5/ France: cancellation of 100 percent of debt service on pre-cutoff date commercial claims on the government as they fall due starting at decision point. Once countries have reached completion point, debt relief on ODA claims on the government will go to a special account and will be used for specific development projects.6/ Finland: no post-Cutoff date claims7/ If not treated in the Agreed Minutes at Completion Point, debt cancellation of 100 % only on a case by case basis.8/ Italy: cancellation of 100 percent of all debts (pre- and post-cutoff date, ODA and non-ODA) incurred before June 20,1999 (the Cologne Summit). At decision point, cancellation of accrued arrears and maturities falling due in the interim period. At completion point, cancellation of the stock of remaining debt. 9/ The Netherlands: 100 percent ODA (pre- and post-cutoff date debt will be cancelled at decision point); for non-ODA: in some particular cases (Benin, Bolivia, Burkina Faso, Ethiopia, Ghana, Mali, Mozambique, Nicaragua, Rwanda, Tanzania, Uganda and Zambia), the Netherlands will write off 100 percent of the consolidated amounts on the flow at decision point; all other HIPCs will receive interim relief up to 90 percent reduction of the consolidated amounts. At completion point, all HIPCs will receive 100 per cent cancellation of the remaining stock of the pre-cutoff date debt.10/ Norway has cancelled all ODA claims.11/ Due to the current World Bank/IMF methodology for recalculating debt reduction needs at HIPC completion point, Norway has postponed the decisions on whether or not to grant 100% debt reduction until after HIPCs' completion point.12/ Russia has no ODA claims13/ Spain provides 100 percent cancellation of ODA and non-ODA claims contracted before January 1, 200414/ Sweden has no ODA claims.15/ Switzerland has cancelled all ODA claims.
of claims held by the ECA (100% cancellation of all remaining claims with the exception of Honduras and Cameroon). 17/ United Kingdom: "beyond 100 percent" full write-off of all debts of HIPCs as of their decision points, and reimbursement at decision point of any debt service paid before the decision point.18/ United States: cancellation of 100 percent of all debts (pre- and post-cutoff date, ODA and non-ODA) incurred before June 20, 1999 (the Cologne Summit). At decision point, cancellation of accrued arrears and maturities falling due in the interim period. At completion point, cancellation of the stock of remaining eligible debt.19/ 100% debt relief provides for countries reached Completion Point before December 31, 2006 as of December 21, 2006 and for countries reached Completion Point after December 31, 2006 as of date of Completion Point. No payments are expected from debtors from those dates.20/ Exception is short term debt category
16/ Switzerland usually writes off 100 percent of government-owned claims of the remaining debt stock at Completion Point and provides at least full HIPC debt relief
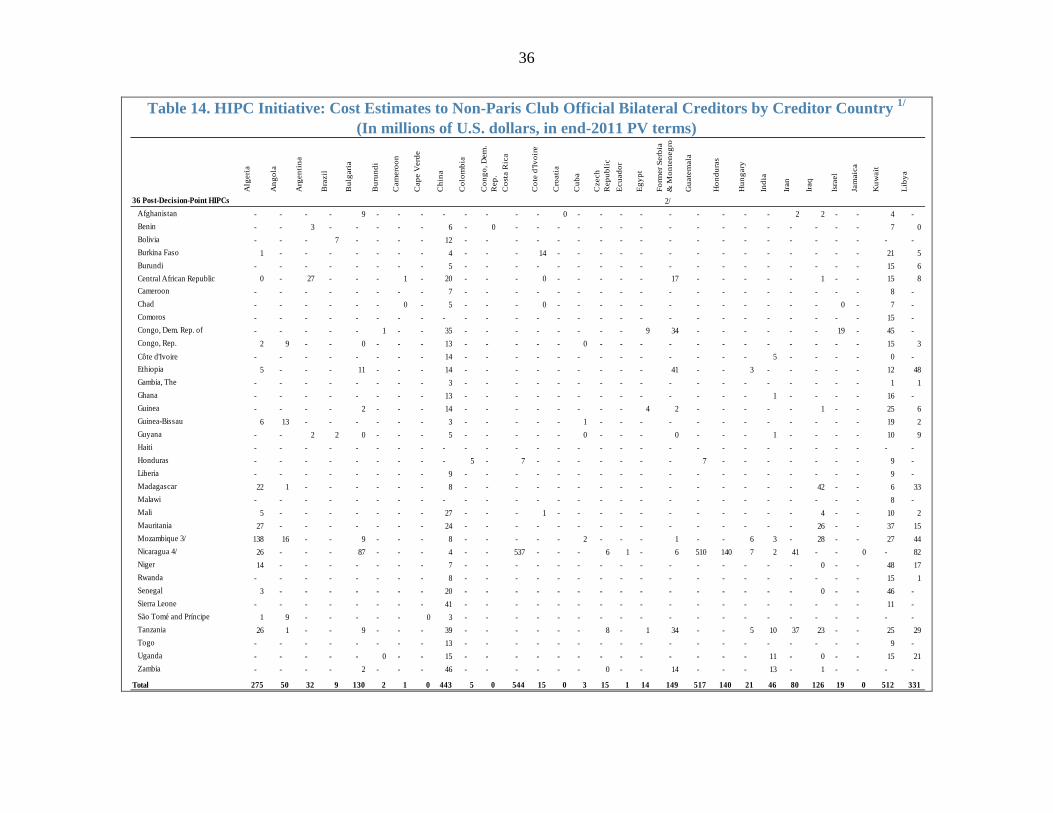
36
Table 14. HIPC Initiative: Cost Estimates to Non-Paris Club Official Bilateral Creditors by Creditor Country 1/ (In millions of U.S. dollars, in end-2011 PV terms)
Alg
eria
Ang
ola
Arg
enti
na
Bra
zil
Bul
gari
a
Bur
undi
Cam
eroo
n
Cap
e V
erde
Chi
na
Col
ombi
a
Con
go, D
em.
Rep
.C
osta
Ric
a
Cot
e d'
Ivoi
re
Cro
atia
Cub
a
Cze
ch
Rep
ubli
cE
cuad
or
Egy
pt
Form
er S
erbi
a &
Mon
tene
gro
Gua
tem
ala
Hon
dura
s
Hun
gary
Indi
a
Iran
Iraq
Isra
el
Jam
aica
Kuw
ait
Lib
ya
36 Post-Decision-Point HIPCs 2/Afghanistan - - - - 9 - - - - - - - - 0 - - - - - - - - - 2 2 - - 4 - Benin - - 3 - - - - - 6 - 0 - - - - - - - - - - - - - - - - 7 0 Bolivia - - - 7 - - - - 12 - - - - - - - - - - - - - - - - - - - - Burkina Faso 1 - - - - - - - 4 - - - 14 - - - - - - - - - - - - - - 21 5 Burundi - - - - - - - - 5 - - - - - - - - - - - - - - - - - - 15 6 Central African Republic 0 - 27 - - - 1 - 20 - - - 0 - - - - - 17 - - - - - 1 - - 15 8 Cameroon - - - - - - - - 7 - - - - - - - - - - - - - - - - - - 8 - Chad - - - - - - 0 - 5 - - - 0 - - - - - - - - - - - - 0 - 7 - Comoros - - - - - - - - - - - - - - - - - - - - - - - - - - - 15 - Congo, Dem. Rep. of - - - - - 1 - - 35 - - - - - - - - 9 34 - - - - - - 19 - 45 - Congo, Rep. 2 9 - - 0 - - - 13 - - - - - 0 - - - - - - - - - - - - 15 3 Côte d'Ivoire - - - - - - - - 14 - - - - - - - - - - - - - 5 - - - - 0 - Ethiopia 5 - - - 11 - - - 14 - - - - - - - - - 41 - - 3 - - - - - 12 48 Gambia, The - - - - - - - - 3 - - - - - - - - - - - - - - - - - - 1 1 Ghana - - - - - - - - 13 - - - - - - - - - - - - - 1 - - - - 16 - Guinea - - - - 2 - - - 14 - - - - - - - - 4 2 - - - - - 1 - - 25 6 Guinea-Bissau 6 13 - - - - - - 3 - - - - - 1 - - - - - - - - - - - - 19 2 Guyana - - 2 2 0 - - - 5 - - - - - 0 - - - 0 - - - 1 - - - - 10 9 Haiti - - - - - - - - - - - - - - - - - - - - - - - - - - - - - Honduras - - - - - - - - - 5 - 7 - - - - - - - 7 - - - - - - - 9 - Liberia - - - - - - - - 9 - - - - - - - - - - - - - - - - - - 9 - Madagascar 22 1 - - - - - - 8 - - - - - - - - - - - - - - - 42 - - 6 33 Malawi - - - - - - - - - - - - - - - - - - - - - - - - - - - 8 - Mali 5 - - - - - - - 27 - - - 1 - - - - - - - - - - - 4 - - 10 2 Mauritania 27 - - - - - - - 24 - - - - - - - - - - - - - - - 26 - - 37 15 Mozambique 3/ 138 16 - - 9 - - - 8 - - - - - 2 - - - 1 - - 6 3 - 28 - - 27 44 Nicaragua 4/ 26 - - - 87 - - - 4 - - 537 - - - 6 1 - 6 510 140 7 2 41 - - 0 - 82 Niger 14 - - - - - - - 7 - - - - - - - - - - - - - - - 0 - - 48 17 Rwanda - - - - - - - - 8 - - - - - - - - - - - - - - - - - - 15 1 Senegal 3 - - - - - - - 20 - - - - - - - - - - - - - - - 0 - - 46 - Sierra Leone - - - - - - - - 41 - - - - - - - - - - - - - - - - - - 11 - São Tomé and Príncipe 1 9 - - - - - 0 3 - - - - - - - - - - - - - - - - - - - - Tanzania 26 1 - - 9 - - - 39 - - - - - - 8 - 1 34 - - 5 10 37 23 - - 25 29 Togo - - - - - - - - 13 - - - - - - - - - - - - - - - - - - 9 - Uganda - - - - - 0 - - 15 - - - - - - - - - - - - - 11 - 0 - - 15 21 Zambia - - - - 2 - - - 46 - - - - - - 0 - - 14 - - - 13 - 1 - - - -
Total 275 50 32 9 130 2 1 0 443 5 0 544 15 0 3 15 1 14 149 517 140 21 46 80 126 19 0 512 331
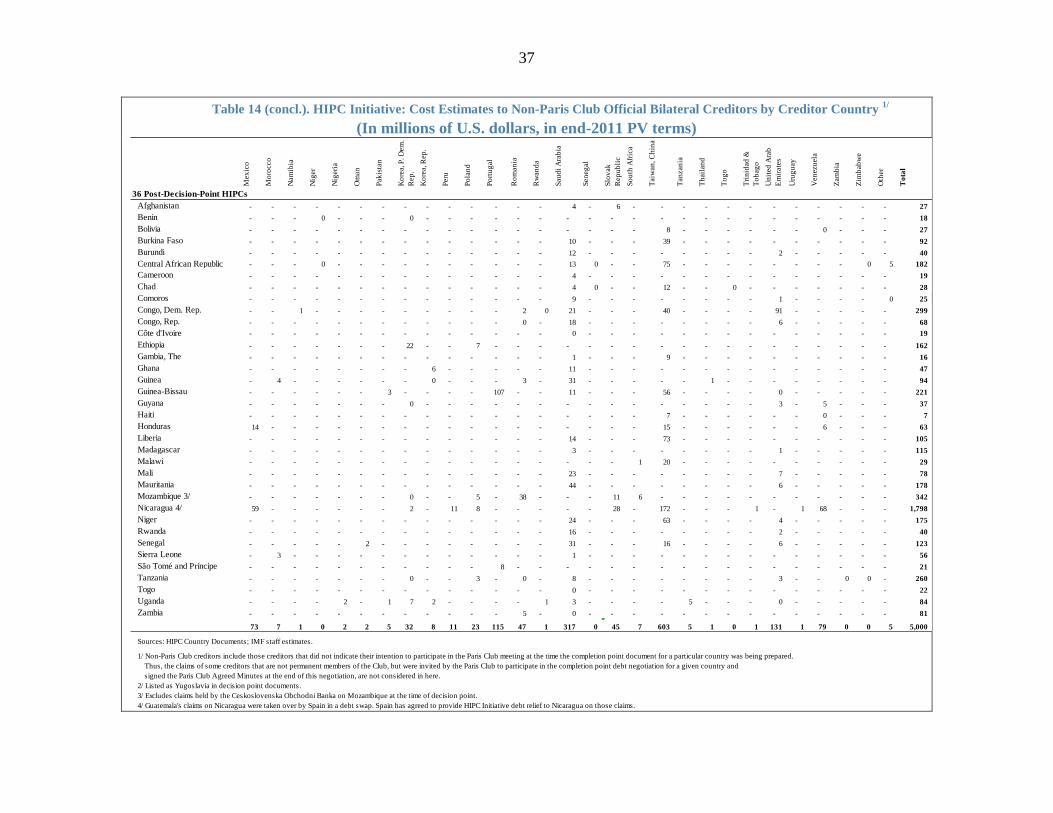
37
Table 14 (concl.). HIPC Initiative: Cost Estimates to Non-Paris Club Official Bilateral Creditors by Creditor Country 1/
(In millions of U.S. dollars, in end-2011 PV terms)
Mex
ico
Mor
occo
Nam
ibia
Nig
er
Nig
eria
Om
an
Paki
stan
Kor
ea, P
. Dem
. R
ep.
Kor
ea, R
ep.
Peru
Pola
nd
Portu
gal
Rom
ania
Rw
anda
Saud
i Ara
bia
Sene
gal
Slov
ak
Rep
ublic
Sout
h A
frica
Taiw
an, C
hina
Tanz
ania
Thai
land
Togo
Trin
idad
&
Toba
goU
nite
d A
rab
Emira
tes
Uru
guay
Ven
ezue
la
Zam
bia
Zim
babw
e
Oth
er
Tot
al
36 Post-Decision-Point HIPCsAfghanistan - - - - - - - - - - - - - - 4 - 6 - - - - - - - - - - - - 27 Benin - - - 0 - - - 0 - - - - - - - - - - - - - - - - - - - - - 18 Bolivia - - - - - - - - - - - - - - - - - - 8 - - - - - - 0 - - - 27 Burkina Faso - - - - - - - - - - - - - - 10 - - - 39 - - - - - - - - - - 92 Burundi - - - - - - - - - - - - - - 12 - - - - - - - - 2 - - - - - 40 Central African Republic - - - 0 - - - - - - - - - - 13 0 - - 75 - - - - - - - - 0 5 182 Cameroon - - - - - - - - - - - - - - 4 - - - - - - - - - - - - - - 19 Chad - - - - - - - - - - - - - - 4 0 - - 12 - - 0 - - - - - - - 28 Comoros - - - - - - - - - - - - - - 9 - - - - - - - - 1 - - - - 0 25 Congo, Dem. Rep. - - 1 - - - - - - - - - 2 0 21 - - - 40 - - - - 91 - - - - - 299 Congo, Rep. - - - - - - - - - - - - 0 - 18 - - - - - - - - 6 - - - - - 68 Côte d'Ivoire - - - - - - - - - - - - - - 0 - - - - - - - - - - - - - - 19 Ethiopia - - - - - - - 22 - - 7 - - - - - - - - - - - - - - - - - - 162 Gambia, The - - - - - - - - - - - - - - 1 - - - 9 - - - - - - - - - - 16 Ghana - - - - - - - - 6 - - - - - 11 - - - - - - - - - - - - - - 47 Guinea - 4 - - - - - - 0 - - - 3 - 31 - - - - - 1 - - - - - - - - 94 Guinea-Bissau - - - - - - 3 - - - - 107 - - 11 - - - 56 - - - - 0 - - - - - 221 Guyana - - - - - - - 0 - - - - - - - - - - - - - - - 3 - 5 - - - 37 Haiti - - - - - - - - - - - - - - - - - - 7 - - - - - - 0 - - - 7 Honduras 14 - - - - - - - - - - - - - - - - - 15 - - - - - - 6 - - - 63 Liberia - - - - - - - - - - - - - - 14 - - - 73 - - - - - - - - - - 105 Madagascar - - - - - - - - - - - - - - 3 - - - - - - - - 1 - - - - - 115 Malawi - - - - - - - - - - - - - - - - - 1 20 - - - - - - - - - - 29 Mali - - - - - - - - - - - - - - 23 - - - - - - - - 7 - - - - - 78 Mauritania - - - - - - - - - - - - - - 44 - - - - - - - - 6 - - - - - 178 Mozambique 3/ - - - - - - - 0 - - 5 - 38 - - - 11 6 - - - - - - - - - - - 342 Nicaragua 4/ 59 - - - - - - 2 - 11 8 - - - - - 28 - 172 - - - 1 - 1 68 - - - 1,798 Niger - - - - - - - - - - - - - - 24 - - - 63 - - - - 4 - - - - - 175 Rwanda - - - - - - - - - - - - - - 16 - - - - - - - - 2 - - - - - 40 Senegal - - - - - 2 - - - - - - - - 31 - - - 16 - - - - 6 - - - - - 123 Sierra Leone - 3 - - - - - - - - - - - - 1 - - - - - - - - - - - - - - 56 São Tomé and Príncipe - - - - - - - - - - - 8 - - - - - - - - - - - - - - - - - 21 Tanzania - - - - - - - 0 - - 3 - 0 - 8 - - - - - - - - 3 - - 0 0 - 260 Togo - - - - - - - - - - - - - - 0 - - - - - - - - - - - - - - 22 Uganda - - - - 2 - 1 7 2 - - - - 1 3 - - - - 5 - - - 0 - - - - - 84 Zambia - - - - - - - - - - - - 5 - 0 - - - - - - - - - - - - - - 81 #N/
73 7 1 0 2 2 5 32 8 11 23 115 47 1 317 0 45 7 603 5 1 0 1 131 1 79 0 0 5 5,000
Sources: HIPC Country Documents; IMF staff estimates.
1/ Non-Paris Club creditors include those creditors that did not indicate their intention to participate in the Paris Club meeting at the time the completion point document for a particular country was being prepared. Thus, the claims of some creditors that are not permanent members of the Club, but were invited by the Paris Club to participate in the completion point debt negotiation for a given country and signed the Paris Club Agreed Minutes at the end of this negotiation, are not considered in here.
2/ Listed as Yugoslavia in decision point documents.3/ Excludes claims held by the Ceskoslovenska Obchodni Banka on Mozambique at the time of decision point.4/ Guatemala's claims on Nicaragua were taken over by Spain in a debt swap. Spain has agreed to provide HIPC Initiative debt relief to Nicaragua on those claims.
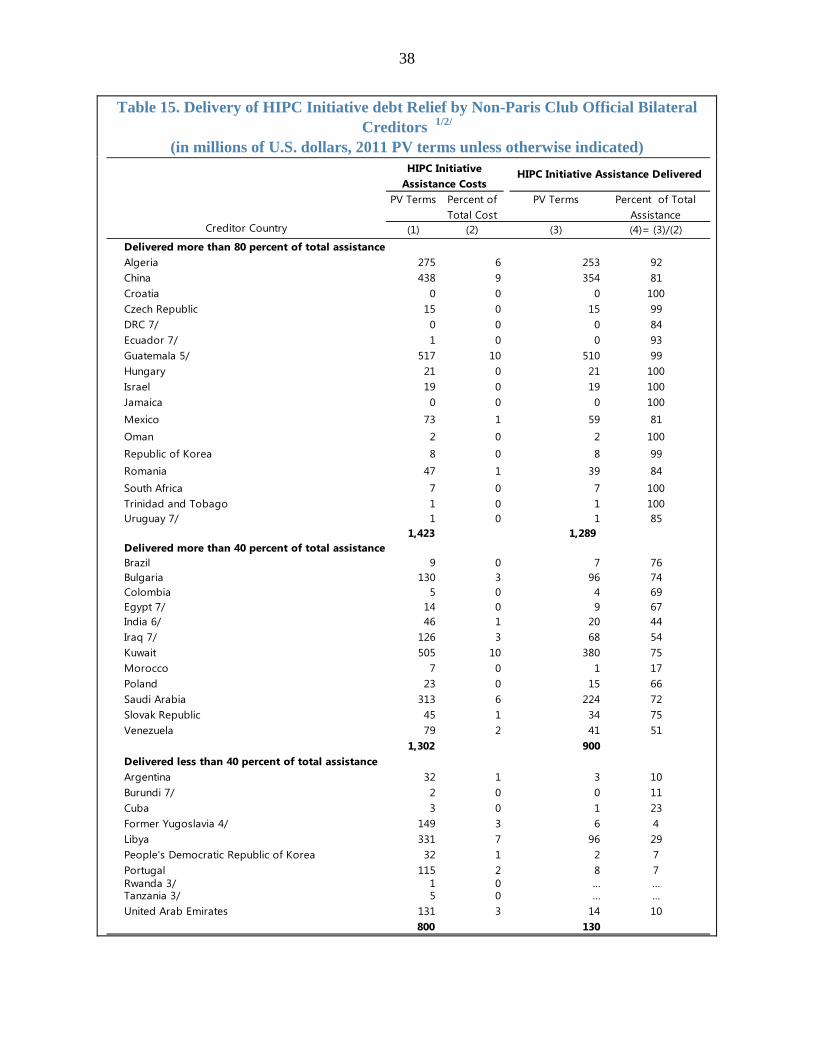
38
Table 15. Delivery of HIPC Initiative debt Relief by Non-Paris Club Official Bilateral Creditors 1/2/
(in millions of U.S. dollars, 2011 PV terms unless otherwise indicated)
Creditor Country (1) (2) (3) (4)= (3)/(2)Delivered more than 80 percent of total assistance Algeria 275 6 253 92China 438 9 354 81Croatia 0 0 0 100Czech Republic 15 0 15 99DRC 7/ 0 0 0 84Ecuador 7/ 1 0 0 93Guatemala 5/ 517 10 510 99Hungary 21 0 21 100Israel 19 0 19 100Jamaica 0 0 0 100Mexico 73 1 59 81Oman 2 0 2 100Republic of Korea 8 0 8 99Romania 47 1 39 84South Africa 7 0 7 100Trinidad and Tobago 1 0 1 100Uruguay 7/ 1 0 1 85
1,423 1,289 Delivered more than 40 percent of total assistance Brazil 9 0 7 76Bulgaria 130 3 96 74Colombia 5 0 4 69Egypt 7/ 14 0 9 67India 6/ 46 1 20 44Iraq 7/ 126 3 68 54Kuwait 505 10 380 75Morocco 7 0 1 17Poland 23 0 15 66Saudi Arabia 313 6 224 72Slovak Republic 45 1 34 75Venezuela 79 2 41 51
1,302 900Delivered less than 40 percent of total assistance Argentina 32 1 3 10Burundi 7/ 2 0 0 11Cuba 3 0 1 23Former Yugoslavia 4/ 149 3 6 4Libya 331 7 96 29People's Democratic Republic of Korea 32 1 2 7Portugal 115 2 8 7Rwanda 3/ 1 0 … …Tanzania 3/ 5 0 … …United Arab Emirates 131 3 14 10
800 130
Percent of Total Cost
PV Terms PV Terms
HIPC Initiative Assistance Delivered
Percent of Total Assistance
HIPC Initiative Assistance Costs

39
Table 15 (concl.). Delivery of HIPC Initiative debt Relief by Non-Paris Club Official
Bilateral Creditors 1/2/ (in millions of U.S. dollars, 2011 PV terms unless otherwise indicated)
Creditor Country (1) (2) (3) (4)= (3)/(2)
Percent of Total Cost
PV Terms PV Terms
HIPC Initiative Assistance Delivered
Percent of Total Assistance
HIPC Initiative Assistance Costs
No delivery of HIPC reliefAngola 50 1 0 0Cameroon 1 0 0 0Cape Verde 0 0 0 0Costa Rica 544 11 0 0Cote d'Ivoire 15 0 0 0Honduras 140 3 0 0Iran 80 2 0 0Namibia 1 0 0 0Niger 0 0 0 0Nigeria 2 0 0 0Pakistan 5 0 0 0Peru 11 0 0 0Taiwan, Province of China 592 12 0 0Zambia 0 0 0 0Zimbabwe 0 0 0 0Other 5 0 0 0
1,441 4,966 100 2,319 0
Sources: HIPC documents; country authorities; and Fund and Bank staff estimates.
3/ In these cases, debtors have indicated that some relief has been provided but the information received is insufficient to q
7/ The details for the debt relief provided are now available to be able to better estimate the effort by these creditors.
5/ Guatemala's claims on Nicaragua were taken over by Spain in a debt swap. Spain has agreed to provide HIPC debt relief to Nicaragua on those claims.6/ In June 2003, India announced its intention to write off all non-export credit claims on HIPCs. However, several agreements remain unsigned.
1/ Based on information received as of December 2012. The information covers only creditors that have claims on post-completion-point countries. The information presented in the table is now based only on responses received from the IMF country team with consultations from the authorities. Creditors are not going to be surveyed which is a change in methodology compared to the previous status reports monitoring relief from the non-Paris creditors.2/ Argentina, Brazil, the Republic of Korea, Kuwait, Mexico, Morocco, Portugal, South Africa, and Trinidad and Tobago are associated members of the Paris Club. As such, these countries participate in negotiation sessions of the Paris Club on a case-by-case basis, provided that certain conditions are met. Generally, creditors participating in a negotiation session for a particular country are considered Paris Club members for the purpose of HIPC calculations.
4/ Partition of HIPC loans outstanding at decision point and the associated debt relief among members of the Former Yugoslavia is being determined with the help of the authorities.

40
Table 16. Commercial Creditor Lawsuits against HIPCs 1/
Status of Legal Action 3/ Original Claim 4/ 5/ Amount
Claimed by the Creditor 6/
Judgment for Creditor
Ongoing, Judgement Awarded or Settled
Afghanistan Originally a loan from Czechoslovakia d b h h bli d
… Germany Judgment Awarded7/ - 32.1 -
Congo, Dem. Rep. of FG Hemisphere United States France Ongoing 44.0 150.0 -
Frans Edward Prins Rootman Israel South Africa Ongoing 12.5 54.1 - Themis Capital … United States Ongoing 18.0 79.7 - Triple A International United States … Ongoing 14.0 - -
Congo, Rep. of Groupe Antoine Tabet (GAT) Lebanon France Ongoing 100.0 78.7 -
Commissimpex Rep. of Congo France Judgement Awarded 8/ - - 220.4
Commissimpex Rep. of Congo France Ongoing - 6.5 - Incofi (Jean Pierre Coutard) France Congo, Rep. of Ongoing 178.6 196.4 -
Ethiopia Kintex-Bulgaria Bulgaria Russia Ongoing 8.7 8.7 -
Honduras Bago Laboratories Argentina Honduras Ongoing 1.5 1.5 -
Sao Tome and Principe Yugoslavia (Anandale Associates) … … Ongoing - 8.8 - Italy Italy … Ongoing - 25.8 -
Sudan Namco Anstalt Switzerland Sudan Ongoing 4.63 5.05 -
Africa Alfa Fund Dubai Dubai Ongoing 26.25 - -
Togo GDF/Suez Paris ICSID (US; France) Judgement Awarded 52.0 78.0 78.0
Uganda NA Iraq Uganda Ongoing 6.0 6.4 -
Zambia ABSA Limited of South Africa South Africa Zambia Consent Judgement 9/ 95.0 27.0 27.0
Source: Country Authorities and IMF Staff
2/ Either original creditor or holder of current claim.
4/ Exchange rates at decision-point were used for reporting claims in U.S. dollars (else average exchange rates are used).5/ Excludes accumulated interest, charges, and penalties.6/ Amount could include interest, charges, and penalties.7/ Originally a loan from Czechoslovakia assumed by the Czech Republic and subsequently assigned to a private party in Germany. Claims have been dismissed.8/ Judgement has been appealed. Approximate amount in USD, amount reported EUR 167 million (exchange rate used USD/EUR 1.32 for 2011).9/ There was a consent judgement between the creditor and the government of Zambia. Due to this negotiation, the outstanding debt is US$ 27 million. Zambian authorities are
following a agreed payment schedule which isincluded in the budget.
1/ Commercial creditors lawsuits against HIPCs are reported without assessing the merits of these disputes. The information reported in this table reflects responses by the authorities, and it should not be considered a
3/ "Judgment awarded" refers to cases in which the creditor has obtained a judgement against the HIPC but has not yet recovered the full payment on its claim. Settled refers to cases where the judgement has been awarded and both parties have been settled on their claims.
(In millions of U.S. dollars)
HIPC Debtor Creditor 2/ Domicile of Creditor Court Location