HEATING SYSTEM RETURN TEMPERATURE EFFECT ON HEAT …
8
Poster P.5.5 - 1 - 11 th IEA Heat Pump Conference 2014, 12 - 16 May 2014, Montréal (Québec) Canada HEATING SYSTEM RETURN TEMPERATURE EFFECT ON HEAT PUMP PERFORMANCE M. Maivel, early-stage researcher, J. Kurnitski, Professor Tallinn University of Technology Tallinn, Estonia Abstract. The revision of EPBD directive raises the role of increasing heating system efficiency. Due to low primary energy consumption heat pumps will be one of the key solutions for residential sector where district heating network are far. Statistical data shows that heat pumps will replace fossil fuel boilers. The aim of the study was to quantify the return temperature effect on heat pump performance. There are several studies for improving heat pump efficiency on component level, but analyzing whole annual heating system efficiency with detailed dynamical heating system model is previously not analyzed enough deeply. Simulated results with IDA-ESBO heat pump model were compared to laboratory measurements of a heat pump performance at different testing points. Based on measurements the correlation between heating system flow/return temperature and condensing temperature were derived. Results show that calculation with derived condensing temperature correlation gave about 7% higher seasonal performance factor compared to IDA-ESBO simulation model stressing the effect of relatively low return temperature in a radiator heating system. Key Words: dynamic simulation, heat pump seasonal efficiency, calculating SPF List of nomenclature: COP – coefficient of performance SPF – seasonal performance factor 1 INTRODUCTION Heat pump heating systems are popular and widely used for preparing domestic hot water and space heating in all over the Europe especially in Nordic countries. By common solutions heat pump is connected with floor heating system where temperature curve is lower than conventional radiator heating system. According to recent study in low-energy buildings it is also possible to use low temperature radiator heating system [1]. Radiator system temperature drop is higher compared with floor heating and it insures lower return water temperature, which have an effect on heat pump performance. Mostly existing heat pump models does not consider return water temperature and they are more suitable for floor heating systems. Heat pump COP is influenced by working mode i.e. space heating or preparing domestic hot water. This paper will concentrate on space heating mode therefore energy need for space heating is dynamic process; energy need for domestic hot water is influenced by usage profile. Heat pump performance testing is described in EN14511-2 [2]. IEA HPP (International Energy Agency Heat Pump Program has launched Annex 28 to compare different standards [3]. Karlsson work under IEA HPP Annex 28 include heat pump tests by both standards and it resulted that the former standard EN 255-2 [4] gives higher COP values compared to EN 14511-2 duo to mass-flows that were not defined in EN 255 and it resulted in unrealistic low inlet condensing temperatures in a few testing points. According to the EN 14511-2 heat pumps were tested at standard rating conditions temperature difference
Transcript of HEATING SYSTEM RETURN TEMPERATURE EFFECT ON HEAT …
Poster P.5.5 - 1 -
11thIEA Heat Pump Conference 2014, 12 - 16 May 2014, Montréal (Québec) Canada
HEATING SYSTEM RETURN TEMPERATURE EFFECT ON HEAT
PUMP PERFORMANCE
M. Maivel, early-stage researcher, J. Kurnitski, Professor Tallinn University of Technology
Tallinn, Estonia
Abstract. The revision of EPBD directive raises the role of increasing heating system efficiency. Due to low primary energy consumption heat pumps will be one of the key solutions for residential sector where district heating network are far. Statistical data shows that heat pumps will replace fossil fuel boilers. The aim of the study was to quantify the return temperature effect on heat pump performance. There are several studies for improving heat pump efficiency on component level, but analyzing whole annual heating system efficiency with detailed dynamical heating system model is previously not analyzed enough deeply. Simulated results with IDA-ESBO heat pump model were compared to laboratory measurements of a heat pump performance at different testing points. Based on measurements the correlation between heating system flow/return temperature and condensing temperature were derived. Results show that calculation with derived condensing temperature correlation gave about 7% higher seasonal performance factor compared to IDA-ESBO simulation model stressing the effect of relatively low return temperature in a radiator heating system.
Key Words: dynamic simulation, heat pump seasonal efficiency, calculating SPF
List of nomenclature:
COP – coefficient of performance SPF – seasonal performance factor
1 INTRODUCTION
Heat pump heating systems are popular and widely used for preparing domestic hot water and space heating in all over the Europe especially in Nordic countries. By common solutions heat pump is connected with floor heating system where temperature curve is lower than conventional radiator heating system. According to recent study in low-energy buildings it is also possible to use low temperature radiator heating system [1]. Radiator system temperature drop is higher compared with floor heating and it insures lower return water temperature, which have an effect on heat pump performance. Mostly existing heat pump models does not consider return water temperature and they are more suitable for floor heating systems. Heat pump COP is influenced by working mode i.e. space heating or preparing domestic hot water. This paper will concentrate on space heating mode therefore energy need for space heating is dynamic process; energy need for domestic hot water is influenced by usage profile. Heat pump performance testing is described in EN14511-2 [2]. IEA HPP (International Energy Agency Heat Pump Program has launched Annex 28 to compare different standards [3]. Karlsson work under IEA HPP Annex 28 include heat pump tests by both standards and it resulted that the former standard EN 255-2 [4] gives higher COP values compared to EN 14511-2 duo to mass-flows that were not defined in EN 255 and it resulted in unrealistic low inlet condensing temperatures in a few testing points. According to the EN 14511-2 heat pumps were tested at standard rating conditions temperature difference
Poster P.5.5 - 2 -
11thIEA Heat Pump Conference 2014, 12 - 16 May 2014, Montréal (Québec) Canada
of 5°C (for outlet temperature up to 45°C). Karlsson’s test results show that heat pump COP is influenced by condenser inlet temperature (i.e. lowering return water temperature will increase heat pump performance). In this paper it is shown by dynamic simulation model that condenser inlet temperature have an impact on heat pump COP. Many heat pump models are prepared to quantify the heat pump performance in working conditions, but most of such models won`t consider condenser inlet temperature and are more suitable for systems with small delta T. The effect of large temperature drops of a radiator heating systems are quantified in this paper.
2 METHODS
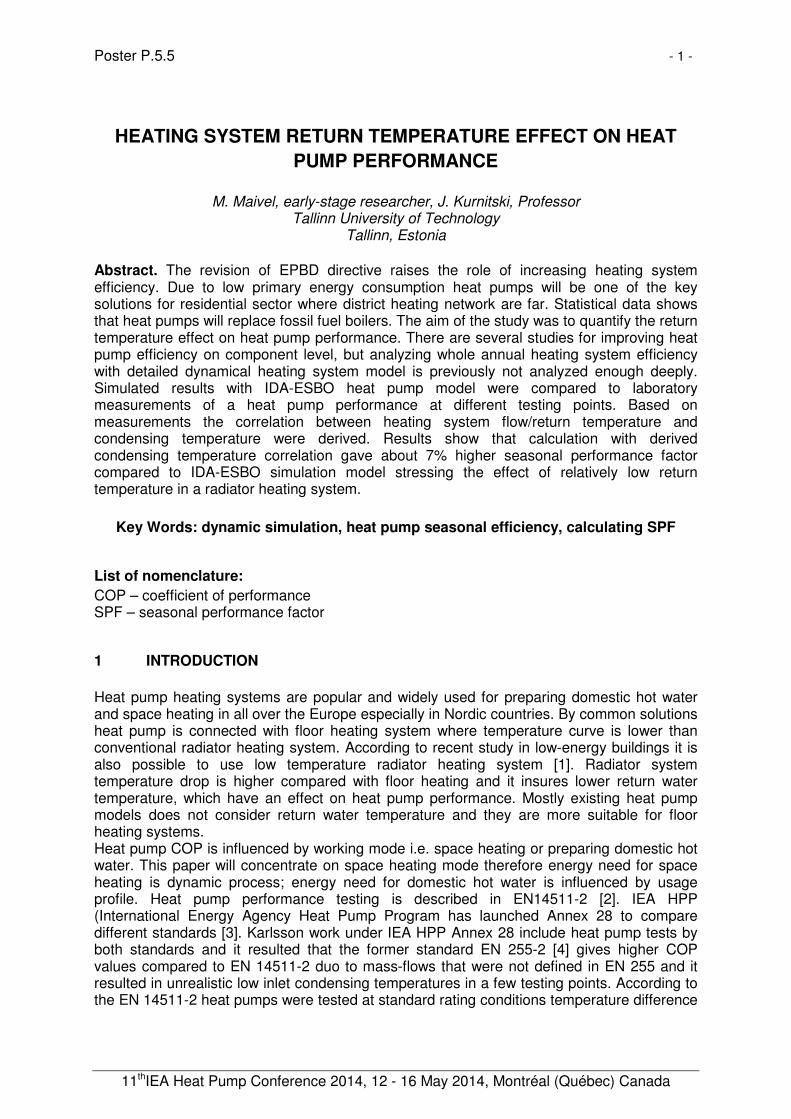
Two methods were used to calculate the heat pump performance as a function of heating system flow/return temperature. In first step dynamic simulation were conducted with IDA-ICE simulation software including a heat pump model. Afterwards, the laboratory test results of heat pump performance were used to calculate heat pump performance manually. According to measurements the correlation of the condensing temperature was derived to calculate simplified heat pump seasonal performance ratio with simulated heating system flow/return temperatures. Therefore, the derived correlation was applied for whole building/heating system simulation model results, and the heat pump was operated with real flow/return temperatures changing at each time step. 2.1 Dynamic Model of Heat Pump Heating System Analyzed building is typical recently built detached house, which has been chosen in earlier study for reference building in Estonian cost optimal calculations [5]. Investigated building is two-story with heated area of 178 m2. Building has 3 bedrooms, sauna and living room together with kitchen (Figure 1, left). Main building elements thermal transmittance values are presented in the Table 1. Room set-point temperature during analyze was 21°C. Heating system supply water temperature is outdoor air temperature compensated i.e. the supply water temperature increases as the outdoor temperature decreases. Low-temperature radiator heating system has simulated by temperature curve of 45°C/35°C (Error! Reference source not found.1, right). There is no cooling system in the building. Mechanical supply-exhaust ventilation system with plate heat exchanger (heat recovery efficiency of 80%; supply air temperature during the winter +18 °C) was used. All energy calculation input data follows the Estonian regulation of minimum requirements for energy performance [6].
Figure 1 Analyzed building 3D view (left) and heating curve 45 °C/ 35 °C (right).
Table 1 Thermal transmittance values for main building envelope elements.
No. Building envelope element U-value (W/(m² K)) 1 Exterior wall 0.17 W/(m² K) 2 Roof 0.14 W/(m² K) 3 Ground floor 0.17 W/(m² K) 4 Windows (g=0.5) 0.8 W/(m² K)

Poster P.5.5 - 3 -
11thIEA Heat Pump Conference 2014, 12 - 16 May 2014, Montréal (Québec) Canada
Detailed overview about dynamic heating system simulation model can be find in previous paper [1]. Standard plant model were replaced to IDA ESBO plant model which include heat pump calculation model [7]. Selected heat pump is common on-off type pump with variable condensing temperature. Main parameters of investigated heat pump are shown in Table 2. In radiator heating system equipped with thermostatic valves, the water mass-flow fluctuates a lot and influences a temperature drop which is for most of the time much higher compared to standard testing value of 5°C temperature difference (Figure 2 left). Constant pressure circulation pump were used in all simulation cases and annual mass-flow in space heating circuit is shown in Figure 2 (right).
Table 2 Basic information about heat pump.
Producer/type IVT Greenline HTPlus
Power 5 kW
∆tlog.eva. 8°C
∆tlog.cond. 8°C
tbrine.in 0°C
tbrine.out -3°C
twater.in 30°C
twater.out 35°C
COPtest.conditions 4.3
Figure 2 Simulated flow and return temperature duration curves in radiator heating system (left) and annual mass flow duration curve in space heating circuit (right).
2.2. Connection Scheme On-off type heat pump model was connected to the heating system through stratification tank. This connection has three circulation pumps (between ground loop and evaporator; condenser and stratification tank and space heating system side pump). Stratification tank have usually additional top heater because heat pumps normally have designed to cover approximately 60% of heating power in design outdoor temperature [8] but in calculation the additional heater was neglected and selected heat pump was sized to cover building heat losses at design outdoor temperature which is in Tallinn -22 °C.

Poster P.5.5 - 4 -
11thIEA Heat Pump Conference 2014, 12 - 16 May 2014, Montréal (Québec) Canada
Figure 3 Calculation scheme (E- evaporator; C- condenser; ST – stratification tank; SHS –
space heating system).
2.3. Basic Equations The efficiency of heat pump can be expressed with the COP which is the quotation between the useful heating capacity and the power input (Equation 1). The theoretical upper limit for the COP of a heat pump operating between the condensation temperature and evaporation temperature is expressed by the Carnot coefficient of performance. The real COP should consider the compressor power factor or cycle efficiency (Equation 2).
121
21 +−
==TT
T
W
QCOPc (1)
cCOP is Carnot coefficient of performance; 1Q is a useful heating capacity (W), W is a power
input (W); 1T is a condensing absolute temperature (K); 2T is an evaporating absolute
temperature (K).
η∗= cr COPCOP (2)
rCOP is real heat pump coefficient of the performance; η is device efficiency, which is in a
range of 0.4…0.6 for conventional domestic heat pumps [8]. Heat pump SPF was calculated by equitation 3.
PSPF
φ= (3)
where φ is produced energy by heat pump (kWh/a), P is used electrical energy for producing
energy (kWh/a). 2.2.1 IDA-ESBO simulation In ordinary heat pump selection programs the condensing temperatures calculated from condenser outlet temperature (heating system flow temperature). IDA-ESBO heat pump model includes physical models of heat exchangers. Water side heat balance is given with Equation 4 and heat exchanger with Equation 5. These equations allow to derive condensing temperature equation (6).
)(** 11121 TTCmQ p −= (4)
1Q is heat flux from heat exchanger (condenser) W; m is mass flow in space heating circuit
kg/s; pC is specific heat of water (J/kgK); 11T is return water temperature from space heating
circuit K; 12T is flow water temperature from space heating circuit K.
−
−
−=
121
111
1112
1
ln
)(**
TT
TT
TTAUQ (5)
U is condenser heat transfer coefficient W/ (m2K); A is condenser area m2; 1T is condensing
temperature K.

Poster P.5.5 - 5 -
11thIEA Heat Pump Conference 2014, 12 - 16 May 2014, Montréal (Québec) Canada
)*
*(1(
1112
111
pCm
AUEXP
TTTT
−−
−+= (6)
Equation 6 is illustrated in Figure 4 showing the dependency between return and condensing temperature at constant flow temperature of 50 °C and constant heat exchanger conductance of 200 W/K
Figure 4 Dependency between return and condensing temperature in the case of constant
power of 1000 W(left) and constant mass-flow (right) of 0.012 kg/s at constant flow (T12) temperature of 50°C
2.2.2 Hand Calculations with Measured Correlation In real heat pump working process condensing temperature is not conditionally constant i.e. heat exchanger heat transfer is dynamic process. A correlation was derived for condensing temperature as a function of flow and return temperature. For that purpose the laboratory measurements were made for a domestic on-off type ground source heat pump with variable condensing at constant flow temperature and heat pump heating capacity and four different return temperatures.
3 RESULTS
Results are presented in two chapters. First, seasonal coefficient of performance value is calculated with IDA-ESBO. Second part covers the derivation of variable condensing temperature formula from laboratory test measurement and SPF calculation. 3.1. Constant Refrigerant Temperature Heat Exchanger For making hand calculations with equation 1 and 2, heat pump annual efficiency η was first
calculated with IDA-ESBO simulation. Hourly η values calculated with equation 2 were in the
range of 0.50…0.63 with an average efficiency value η = 0.57. In figure 5 corresponding
hourly COP values of IDA ESBO simulation; Carnot ideal process with equation 1 (evaporating and condensing temperature from ESBO results) and hand calculated with equation 2 with heat pump efficiency of 0.57 are shown.
Figure 5 Hourly COP values (left) and the duration curve (right), calculated with simulated
evaporating and condensing temperatures.

Poster P.5.5 - 6 -
11thIEA Heat Pump Conference 2014, 12 - 16 May 2014, Montréal (Québec) Canada
Results in Figure 5 show that hand calculation with constant heat pump efficiency value of 0.57 gave accurate results on annual bases. In next step, the condensing temperature was calculated with equation 5 from flow/return temperatures, and the result is compared to IDA-ESBO condensing temperature in Figure 6.
Figure 6 Hourly based condensing temperature values by IDA simulation and by handmade
calculation (left) and duration curve of condensing temperature values (right).
Differences exist, IDA-ESBO simulation provided average condensing temperature 39.8°C and hand calculation 35.9°C. However, the differences mainly occur during summer and period with very low heating need. From calculated hourly condensing temperatures, hourly COP values were calculated with an average constant evaporation temperature of -8°C. Figure 7 describes the difference of IDA-ESBO calculated hourly COP values from hand calculated COP showing an annual average value of 3.80 vs. 4.12 respectively. Such a large difference in COP values resulted only in minor difference in the seasonal coeficient of performance being 3.48 in IDA-ESBO simulation and 3.44 in hand calculation (the difference ~1.2%). This shows that the difference of COP hourly values at low or missing heating need did not affected the results.
Figure 7 Comparison of IDA-ESBO COP values with hand calculation (left- hourly values and
right the duration curve of COP values).
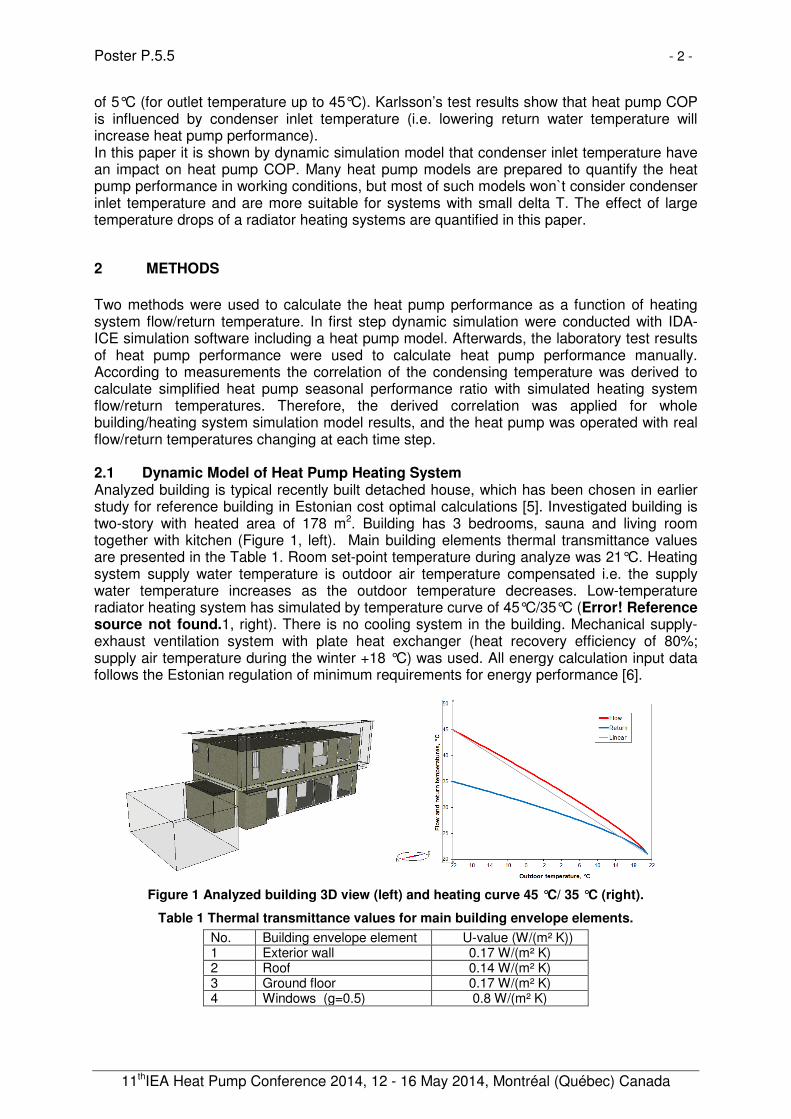
3.2. Condensing Temperature Correlation Laboratory measurements data was used to describe the measured condensing temperature as a function of heating system flow/return temperatures with simple correlation equation. Results of the laboratory measurements with a flow temperature of about 50 °C for wide range of return temperatures are shown in Table 3.
Poster P.5.5 - 7 -
11thIEA Heat Pump Conference 2014, 12 - 16 May 2014, Montréal (Québec) Canada
Table 3 Laboratory measurement results (T2 – evaporating temperature °C) of the heat pump performance.
T1 T2 EER
Carnot EERlab
.measure Ƞ T11 T12 Avg. kW
Volume flow l/s
U*A radiator
Case 1 45.06 -6.98 5.11 2.31 0.45 29.64 49.62 8.09 0.36 0.45
Case 2 46.98 -6.69 4.96 2.15 0.43 35.38 50.05 7.94 0.48 0.36
Case 3 48.67 -6.64 4.82 1.97 0.41 40.15 49.98 7.79 0.7 0.31
Case 4 50.88 -6.87 4.61 1.81 0.39 44.99 50.01 7.56 1.33 0.28
Measured results show that the lower return temperature decreased the condensing temperature resulting in higher COPcarnot (Figure 8). Decrease of condensing temperature by 12.9% increased the COP by about 9%.
Figure 8 Laboratory measurements showing the effect of return temperature on condensing
temperature and resulting COP in four measurement points.
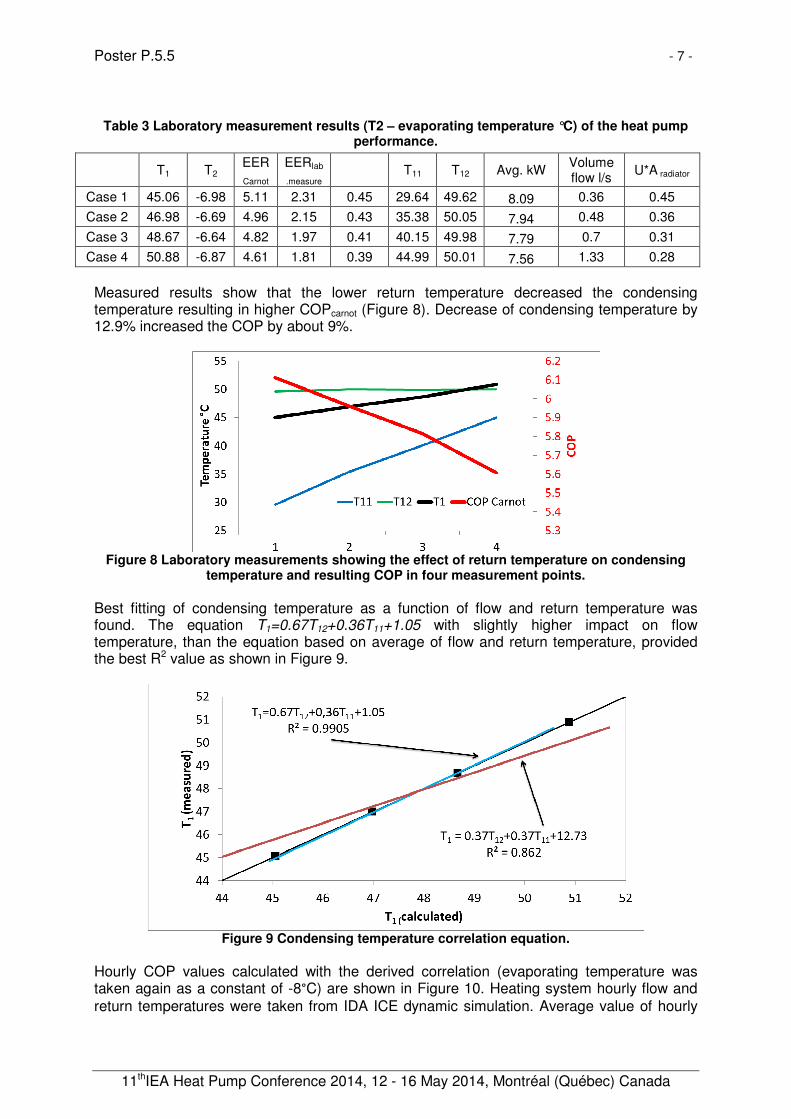
Best fitting of condensing temperature as a function of flow and return temperature was found. The equation T1=0.67T12+0.36T11+1.05 with slightly higher impact on flow temperature, than the equation based on average of flow and return temperature, provided the best R2 value as shown in Figure 9.
Figure 9 Condensing temperature correlation equation.
Hourly COP values calculated with the derived correlation (evaporating temperature was taken again as a constant of -8°C) are shown in Figure 10. Heating system hourly flow and return temperatures were taken from IDA ICE dynamic simulation. Average value of hourly

Poster P.5.5 - 8 -
11thIEA Heat Pump Conference 2014, 12 - 16 May 2014, Montréal (Québec) Canada
COP values was 4.12. The data calculated with the correlation in figure 10 resulted in SPF of 3.72 which was 6.9 % higher than that of hand calculation result with condenser model (SPF= 3.44).
Figure 10 Comparison hourly COP (left) and the duration curve (right) of hand calculation with
condenser model and derived correlation.
4 CONCLUSION In this paper the heating system return temperature effect on condensation temperature of the heat pump was quantified based on laboratory measurements and IDA-ESBO heat pump model. Results show that IDA-ESBO dynamic simulation together with detailed outdoor temperature controlled heating system model gave very similar SPF value than that calculated with constant refrigerant temperature condenser model, 3.48 vs. 3.44 respectively. Hourly calculation with derived condensing temperature correlation stressed the effect of relatively low return temperature in a radiator heating system and provided about 7% higher SFP value of 3.72. ACKNOWLEDGEMENT The research was supported by the Estonian Research Council, with Institutional research funding grant IUT1−15, and with a grant of the European Union, the European Social Fund, Mobilitas grant No MTT74. 5 REFERENCES [1] Maivel, M.; Kurnitski, J. (2013). Low Temperature Radiator Heating Distribution and Emission Efficiency in Residential Buildings. Energy and Buildings, 69C, 224 - 236. [2] EN 14511-2, Air conditioners, liquid chilling packages and heat pumps with electrically driven compressors for space heating and cooling - Part 2: Test conditions. 2013, CEN, Brussels, Belgium. [3] Test procedure and seasonal performance calculation for residential heat pumps with combined space and domestic hot water heating - Swedish country report for IEA HPP Annex 28 SP Rapport 2004:38 Energy Technology Borås 2005 [4] EN 255-2, Air conditioners, liquid chilling packages and heat pumps with electrically driven compressors - Heating mode - Part 2: Testing and requirements for marking for space heating units. 1997, CEN, Brussels, Belgium. [5] Kurnitski, J.; Saari, A.; Kalamees, T.; Vuolle, M.; Niemelä, J.; Tark, T. (2011). Cost optimal and nearly zero (nZEB) energy performance calculations for residential buildings with REHVA definition for nZEB national implementation. Energy and Buildings, 43(11), 3279 - 3288. [6] Ministry of Economic Affairs and Communication. Regulation no. 68 ,,Minimum requirements for energy performance”, 2013 [7] IDA ESBO, http://www.equaonline.com/esbo/IDAESBOUserguide.pdf [8] Karlsson F. (2007). Capacity Control of Residential Heat Pump Heating System. Building Services Engineering, Department of Energy and Environment Chalmers University of Technology. Ph.D. thesis.