Heat Transfer and Entropy Generation Through Finned ...
16
Turkish Journal of Computer and Mathematics Education Vol.12 No.9 (2021), 606 - 621 606 Research Article Heat Transfer and Entropy Generation Through Finned Tubeess and Behavioral Analysis of Employees using Statistical and Correlation Methods Prabir Kumar Nayak a , Mr. Santosh Kumar Tripathy b and Dr. Ajit Kumar Senapati c a M.Tech Scholar Thermal Engineering, Department of Mechanical Engineering, GIET University, Gunupur. b Assistant Professor, Department of Mechanical Engineering, GIET University, Gunupur. c Professor & Head of Department, Department of Mechanical Engineering, GIET University, Gunupur. Article History: Received: 10 January 2021; Revised: 12 February 2021; Accepted: 27 March 2021; Published online: 20 April 2021 _____________________________________________________________________________________________________ Abstract: The study deals with the heat transfer through helical finned tube. The helical finned tube is taken in order to increase the heat transfer rate. Through the helical finned tube, the heat transfer and entropy generation are evaluated numerically on the basis of constant heat flux and constant wall temperature conditions. In case of constant wall temperature, optimised condition for fin height is obtained. At fin height of 0.002538m the heat transfer is maximum and entropy generation is neither minimum and nor maximum and it lies in between the maximum and minimum value. In case of constant heat flux conditions the entropy generation is continuously decreasing with fin height. Since, the values of heat transfer and entropy generation are calculated for helical finned tube the results obtained are fairly good, as the entropy is not increasing, using helical finned tube we can increase the heat transfer to a larger extent. The report also deals with the heat transfer through external fins, which is used in radiator. The heat transfer and entropy generation of automotive radiator have been numerically evaluated for different fin configurations (louvered, plain, and wavy fin). ___________________________________________________________________________ 1. Introduction This enhancement is accompanied by an increase in pressure drop. The heat transfer performance of offset strip fin is often as much as 5 times that of a plain fin surface of comparable geometry, but at the expense of higher pressure drop. For specified heat transfer and pressure drop requirements, the offset strip fin surface demands a somewhat higher frontal area compared to those with plain fin, but results in a shorter flow length and lower overall volume. An undesirable characteristic of this type of fin is that at high Reynolds numbers the friction factor remains nearly constant (because of the higher contribution of form drag), while the heat transfer performance goes down. Therefore, offset strip fins are used less frequently in very high Reynolds number applications. On the other hand, they are extensively used in air separation and other cryogenic applications where mass velocities are low and high thermal effectiveness is essential. The louvered fin geometry shown in Fig. 1(e) bears a similarity to the offset strip fin. Instead of shifting the slit strips laterally, small segments of the fin are slit and rotated 20 to 45 degrees relative to the flow direction. The base surface of the louvered fin geometry can be of triangular or rectangular shape, and louvers can be cut in many different forms. The multi louvered fin has the highest heat transfer enhancement relative to pressure drop in comparison with most other fin types. Flow over louvered fin surfaces is similar in nature to that through the offset strip fin geometry, with boundary layer interruption and vortex shedding playing major roles. An important aspect of louvered fin performance is the degree to which the flow follows the louver. At low Reynolds number the flow is nearly parallel to the axial direction (duct flow), whereas at high Reynolds number the flow is in the direction of the louvers (boundary layer flow). Louvered fins are extensively used in automotive heat exchangers. Perforated fins shown in Fig. 1(f) are made by punching a pattern of spaced holes in the fin material before it is folded to form the flow channels. The channels may be triangular or rectangular in shape with either round or rectangular perforations. While this geometry, with boundary layer interruptions, is a definite improvement over plain fins, its performance is generally poorer than that of a good offset strip fin. Furthermore, the perforated fin represents a wasteful way of making an enhanced surface, since the material removed in creating the perforations is thrown out as scrap. Perforated fins are now used only in limited number of applications such as turbulators in oil coolers. In a pin fin exchanger, a large number of small pins are sandwiched between plates in either an inline or staggered arrangement. Pins may have a round, an elliptical, or a rectangular cross section. These types of finned
Transcript of Heat Transfer and Entropy Generation Through Finned ...

Turkish Journal of Computer and Mathematics Education Vol.12 No.9 (2021), 606 - 621
606
Research Article
Heat Transfer and Entropy Generation Through Finned Tubeess and Behavioral Analysis of Employees using Statistical and Correlation Methods
Prabir Kumar Nayaka, Mr. Santosh Kumar Tripathy
b and Dr. Ajit Kumar Senapati
c
a M.Tech Scholar Thermal Engineering, Department of Mechanical Engineering,
GIET University, Gunupur. bAssistant Professor, Department of Mechanical Engineering, GIET University, Gunupur. c
Professor & Head of Department, Department of Mechanical Engineering, GIET
University, Gunupur.
Article History: Received: 10 January 2021; Revised: 12 February 2021; Accepted: 27 March 2021; Published
online: 20 April 2021
_____________________________________________________________________________________________________
Abstract: The study deals with the heat transfer through helical finned tube. The helical finned tube is taken in
order to increase the heat transfer rate. Through the helical finned tube, the heat transfer and entropy generation are evaluated numerically on the basis of constant heat flux and constant wall temperature conditions. In case of
constant wall temperature, optimised condition for fin height is obtained. At fin height of 0.002538m the heat
transfer is maximum and entropy generation is neither minimum and nor maximum and it lies in between the maximum and minimum value. In case of constant heat flux conditions the entropy generation is continuously
decreasing with fin height. Since, the values of heat transfer and entropy generation are calculated for helical finned
tube the results obtained are fairly good, as the entropy is not increasing, using helical finned tube we can increase the heat transfer to a larger extent. The report also deals with the heat transfer through external fins, which is used
in radiator. The heat transfer and entropy generation of automotive radiator have been numerically evaluated for
different fin configurations (louvered, plain, and wavy fin).
___________________________________________________________________________
1. Introduction
This enhancement is accompanied by an increase in pressure drop. The heat transfer performance of offset
strip fin is often as much as 5 times that of a plain fin surface of comparable geometry, but at the expense of higher
pressure drop. For specified heat transfer and pressure drop requirements, the offset strip fin surface demands a
somewhat higher frontal area compared to those with plain fin, but results in a shorter flow length and lower overall
volume. An undesirable characteristic of this type of fin is that at high Reynolds numbers the friction factor remains
nearly constant (because of the higher contribution of form drag), while the heat transfer performance goes down.
Therefore, offset strip fins are used less frequently in very high Reynolds number applications. On the other hand,
they are extensively used in air separation and other cryogenic applications where mass velocities are low and high
thermal effectiveness is essential.
The louvered fin geometry shown in Fig. 1(e) bears a similarity to the offset strip fin. Instead of shifting
the slit strips laterally, small segments of the fin are slit and rotated 20 to 45 degrees relative to the flow direction.
The base surface of the louvered fin geometry can be of triangular or rectangular shape, and louvers can be cut in
many different forms. The multi louvered fin has the highest heat transfer enhancement relative to pressure drop
in comparison with most other fin types. Flow over louvered fin surfaces is similar in nature to that through the
offset strip fin geometry, with boundary layer interruption and vortex shedding playing major roles. An important
aspect of louvered fin performance is the degree to which the flow follows the louver. At low Reynolds number
the flow is nearly parallel to the axial direction (duct flow), whereas at high Reynolds number the flow is in the
direction of the louvers (boundary layer flow). Louvered fins are extensively used in automotive heat exchangers.
Perforated fins shown in Fig. 1(f) are made by punching a pattern of spaced holes in the fin material
before it is folded to form the flow channels. The channels may be triangular or rectangular in shape with either
round or rectangular perforations. While this geometry, with boundary layer interruptions, is a definite
improvement over plain fins, its performance is generally poorer than that of a good offset strip fin. Furthermore,
the perforated fin represents a wasteful way of making an enhanced surface, since the material removed in creating
the perforations is thrown out as scrap. Perforated fins are now used only in limited number of applications such
as turbulators in oil coolers.
In a pin fin exchanger, a large number of small pins are sandwiched between plates in either an inline or
staggered arrangement. Pins may have a round, an elliptical, or a rectangular cross section. These types of finned

Turkish Journal of Computer and Mathematics Education Vol.12 No.9 (2021), 606 - 621
607
Research Article
surfaces are not widely used due to low compactness and high cost per unit surface area compared to multi louvered
or offset strip fins. Due to vortex shedding behind the pins, noise and flow-induced vibration are produced, which
are generally not acceptable in most heat exchanger applications. The potential application of pin fin surfaces is at
low flow velocities (Re < 500), where pressure drop is negligible. Pin fins are used as electronic cooling devices
with free-convection flow on the pin fin side. Extended or finned surfaces are widely used in compact heat
exchanger to enhance the heat transfer and reduce the size. Common among these are automobile radiators, charge
air coolers, automobile air-conditioning evaporators and condensers to meet the demand for saving energy and
resources. In these applications, the heat transfer is normally limited by the thermal resistance on the air side of
the heat exchangers. Therefore, various augmented surfaces have been developed to improve air side heat transfer
performance. Typical fin geometries are plain fins, wavy fins, offset strip fins, perforated fins and multi-louvered
fins, which, besides increasing the surface area density of the exchanger, also improve the convection heat transfer
coefficients. Of these, wavy fins are particularly attractive for their simplicity of manufacture and potentials for
enhanced thermal-hydraulic performance. The air side thermal hydraulic performance of wavy fin and round tube
heat exchangers have been studied by many researchers. However, the study of wavy fin and flat tube heat
exchanger is very limited
Figure: 1.6: Types Of Plate fin Surfaces (A) Plain Rectangular (B) Plain trapezoidal (c) Wavy
(D) Off set strep pin (E) Louvered (F) Perorated
1.1 Entropy Generation :
Entropy is a measure of molecular disorder or randomness of a system, and the second law states that entropy
can be created but it cannot be destroyed. The increase of entropy principle is expressed as
Entropy change = Entropy transfer + Entropy generation
∆Ssystem = Stransfer+Sgen
The entropy change of a system or its surroundings can be negative; but entropy generation can not.
Sgen = 0 for reversible process
Sgen > 0 for irreversible process
Sgen < 0 for impossible process
2. Mathematical Modelling
2.1 Physical geometry:
2.1.1 For internally finned tube
One contemporary enhancement geometry is the helical fin shown in figure which is described by several
geometric variables. Figure also provides a pictorial description of these variables, which include: the fin height
(e), the fin pitch (p), the helix angle (α), number of starts (Ns), and included angle (β). The fin height is the distance
measured from the internal wall of the tube to the top of the fin. The fin pitch is the distance between the centers
of two fins measured in the axial direction. The helix angle is the angle the fin forms with the tube axis. The
number of starts refers to how many fins one can count around the circumference of the tube. Finally, the angle
at which the sides of the fin meet is called the included angle

Turkish Journal of Computer and Mathematics Education Vol.12 No.9 (2021), 606 - 621
608
Research Article
Assumptions:
• Steady state
• Fully developed flow
• Fluid flow only inside the tube
• The potential and kinetic energy changes are negligible.
• The radiation heat transfer from tubes is negligible
Equations:
The following equations are used to correlate the numerical data shown:
The following correlation are used
f = 0.128Re–0.305 Ns0.235 (e/D)0.319 0.397. (1)
and
j = 0.029Re–0.347 Ns0.253 (e/D)0.0877 0.362 (2)
From the above correlation we can get
Nu = 0.029Re0.653 Ns0.253 (e/D)0.0877 0.362Pr(1/3) (3)
Heat transfer coefficient
D
kNuh
= (4)
Perimeter of the pipe
bcos
e2p +
= (5)
Pressure drop in the tube
D2
VLfdP
2
= (6)
Surface area of the helically finned tube
+
−=
cos
LpNL
cos
aNDA sss
(7)
Cross sectional area of the helically finned tube
( )
+−
=cos
eba
2
ND
4A s2
c (8)

Turkish Journal of Computer and Mathematics Education Vol.12 No.9 (2021), 606 - 621
609
Research Article
Mass flow rate, VAm c= (9)
There are two conditions for the tube
(1) Constant wall temperature of the tube
Heat transfer rate from the tube
Q = UAs(Tm) (10)
( ) ( ) inletbexitbp TTmC −= (11)
Logarithmic mean temperature difference
( ) ( )
−
−
−−−=
ew
aw
ewawm
TT
TTn
TTTTT
(12)
From above we get,
−−=
p
s
mC
UA
awwe
e
TTTT (13)
Pressure at inlet side of the tube
P1 = P2+dP (14)
Entropy generation
w1
2
a
epgen
T
Q
P
PnR
T
TnCmS −
−= (15)
(2) Constant heat flux of the tube
Q = Ash(Tw – Te) = mCp(Te –Ta) (16)
Exit temperature
( ) a
p
e TmC
QT += (17)
Entropy generation
( )( )
−
−−
−
=
a
e
ae
eww
1
2
a
epgen
T
Tn
TT
TThLp
P
PnR
T
TnCmS (18)
2.1.2 Air side calculation
Initially, air side calculations were performed to determine air heat capacity, air heat transfer coefficient,
fin efficiency and total surface temperature effectiveness. These data were needed to calculate heat exchanger
effectiveness, NTU number and overall heat transfer coefficient for the base fluid side calculation. The
mathematical formulations are shown below.
Air heat capacity rate, Ca can be expressed as [16]
Ca = WaCp,a (19)
Core mass velocity of air is expressed as [16]
afr
aa
A
WG
= (20)
Heat transfer coefficient, ha can be expressed as [16]
3/2
a
a,paa
aPr
CGjh = (21)
Correlation for the Colburn j factor
383.0
a
aRe
174.0j = (For plate fin [16]) (22)
7159.1
p
h
9045.1
p
h
5177.0
p
p
257.0
a1944.0
aaL
L
L
F
L
F
90
LRe26712.0j
=
−−
− 05.0
p
2147.0
p
d
L
t
L
L−−
Turkish Journal of Computer and Mathematics Education Vol.12 No.9 (2021), 606 - 621
610
Research Article
(For Louvered fin[17]) (23)
326.0
d
153.0
p
1284.0
h
p2309.0
aaL
L
A2
F
F
FRe0836.0j
−−
−
=
(For Wavy fin) (24)
1152.0
d
25.0
p
3707.0
h
p309.0
aaL
L
A2
F
F
FRe16.1f
−−
−
=
Reynolds number expression for plate fin and louvered fin is expressed as Fh
a
haaa
DGRe
= (Plate fin [16]) (25)
a
paa
a
LuRe
= (Louvered fin [17]) (26)
Where air velocity is given by,
a
aa
Gu
= (27)
Plate fin efficiency , f can be expressed as [16]
m
mtanh= (28)
Where, kt
h2m a= (29)
Total surface temperature effectiveness, can be expressed as [16]
( )ff
0 1A
A1 −−= (30)
Entropy generation on air side :
−
=
in
outaa
in
outa,paa
P
PnRW
T
TnCWdS (31)
2.1.3 Coolant side calculation
The parameters needed for base fluid side calculation are base fluid heat transfer coefficient, base fluid
heat capacity rate.
Heat transfer coefficient can be expressed as:
bf,h
bfu,bf
bfD
kNh
= (32)
(Nu)bf = 0.021 (Rebf)0.8 (Prbf)0.5 (33)
Reynolds no. expression for base fluid
bf
bf,hf
ef
DGR
= (34)
Prandtl number expression for base fluid is
( )bf
bf,p
bfk
CPr
= (35)
Pressure drop can be expressed as:
( )
4
D2
HfGdP
bf,h
2
bfbf
= (36)
Where , the friction factor correlation of base fluid is given by
f = 0.3164 Re–0.25 (37)

Turkish Journal of Computer and Mathematics Education Vol.12 No.9 (2021), 606 - 621
611
Research Article
Entropy generation on fluid side:
( )T
Dw
T
TnCwds
bf,pf
in
outbf,pbff
+
= (38)
Where ( ) ( )
2
TTT inout += (39)
2.1.4 Performance calculation:
Overall heat transfer coefficient, based on air side can be expressed as below where wall resistance and
fouling factors are neglected.
bfaa h
1
h
1
U
1+= (40)
Number of heat transfer unit is expressed as
a
a,fra
C
AUNTU = (41)
Heat exchanger effectiveness for cross-flow unmixed fluid can be expressed as [16],
−−
−=
178.0NTUC22.0
eC
NTU
e1 (42)
Where,
max
min
C
CC =
(43)
Total heat transfer rate can be expressed as:
Q = Cmin(Tbf, in –Ta, in) (44)
Total entropy generation is given by:
Sgen = dSa + dSbf (45)
Validation:
The result of this analysis is same as theoretically and data with an error of less than 10% experimentally.
2.2 Input parameters:
The input parameter of internally finned tube is given in the table 1 and for the radiator in table 2 to 6.
The radiator which is considered here is mounted on the present turbo-charged diesel engine of type TBD 232V-
12 is cross flow compact exchanger with unmixed fluids in (Fig.2). Radiator consists of 644 tubes make of brass
and 346 continuous fins made of Aluminum alloy whose thermal conductivity is 177W/m K [16]. The common
geometrical factors and operating conditions are described in the Tables 2 and 3. Additional geometric parameters
for louvered fin are given in Table 4. Properties of base fluid and air are given in Table 5. Properties of wavy are
given in Table 6.
Table 2.1: Parameters for the internally finned tube
Input Parameter Values
D(m) 0.01564
e(m) 0.00038 to0.0055
Ns 10
α(˚) 25
E=e/D 0.0243
k(w/m-k) 0.026
v(m/s) 10
Re 10000
β(˚) 41
Pr 0.70
a(m) 0.00048
b(m) 0.0002
L(m) 1
Ta(K) 298
Turkish Journal of Computer and Mathematics Education Vol.12 No.9 (2021), 606 - 621
612
Research Article
Tw(K) 353
Cp(J/kg-k) 1005
R(J/kg-k) 287
g(m/s2) 9.81
P2=P(N/m2) 101325
ρ(kg/m3) 1.2
Table 2.2: Fluid parameters and Normal Operating conditions
S.NO. Description Air Coolant
1 Fluid mass rate 10-20kg/s 4-6kg/s
2 Fluid inlet temperature 10-500C 80-1000C
3 Core Width 0.6m
4 Core height 0.5m
5 Core depth 0.4m
Table 2.3: Surface core geometry of flat tubes, continuous fins.
S.N
O.
Description Air side Coolant side
1 Fin pitch 4.46fin/cm
2 Fin metal thickness 0.01cm
3 Hydraulic diameter Dh 0.351cm 0.373cm
4 Min free flow area/frontal area σ 0.780 0.129
5 Total heat transfer area/total volume α 886 m2/m3 138 m2/m3
6 Fin area/Total area β 0.845
Table 2.4: Thermal physical properties of Base fluid (80%water-20%etylene glycol) and Air
S.NO. Thermal physical properties Base fluid Air
1 Density(kg/m3) 1008 1.1614
2 Specific heat (J/kg K) 4020 1007
3 Viscosity(N-s/m2) 0.0019 0.00001846
4 Conductivity(W/m K) 0.58
Table 2.5: Specification of multi-louvered fin parameters
1 La 28ᵒ
2 Fp 2 mm
3 Lp 1.2
mm
4 Fh 8 mm
5 Lh 6.5
mm
6 Ld 36.6
mm
Table 2.6: Specification of wavy fin parameters
1 Fp 2 mm
2 2A 1.5
mm
3 Fh 8 mm
4 L 10.8
mm
5 Ld 65
mm
2.3 Result and Discussion:
A computer software programme in MATLAB has been developed to determine all the parameters i.e. heat
transfer rate, entropy generation, pressure drop etc. for both internally finned tube and automotive radiator.
2.4. Results for internally finned tube:
2.4.1 For constant wall temperature:
2.4.1(a) Variation of heat transfer with respect to fin height
Turkish Journal of Computer and Mathematics Education Vol.12 No.9 (2021), 606 - 621
613
Research Article
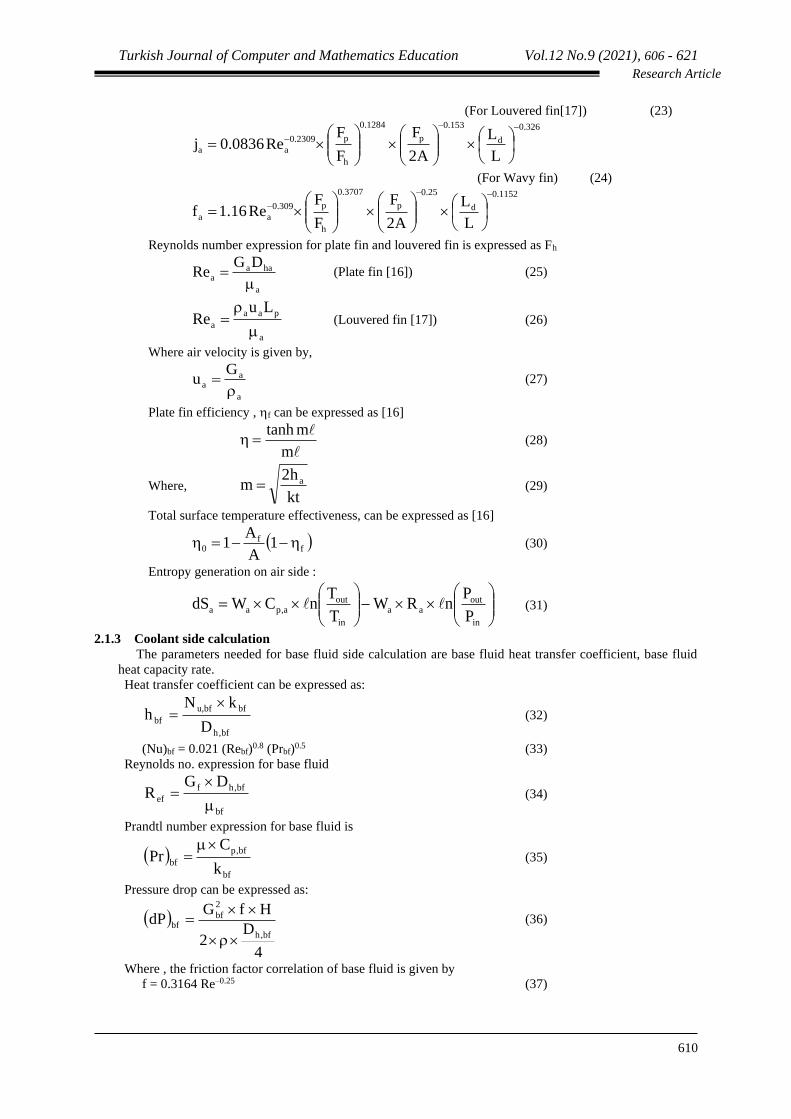
Fig2.1: Heat transfer vs fin height
In the Fig. 2.1, initially heat transfer increases after some time it will be maximum and then decreases.
The maximum heat transfer = 119.2 Watt
The fin height at maximum heat transfer =0.00253m
2.4.1(b) Variation of entropy generation with respect to fin height
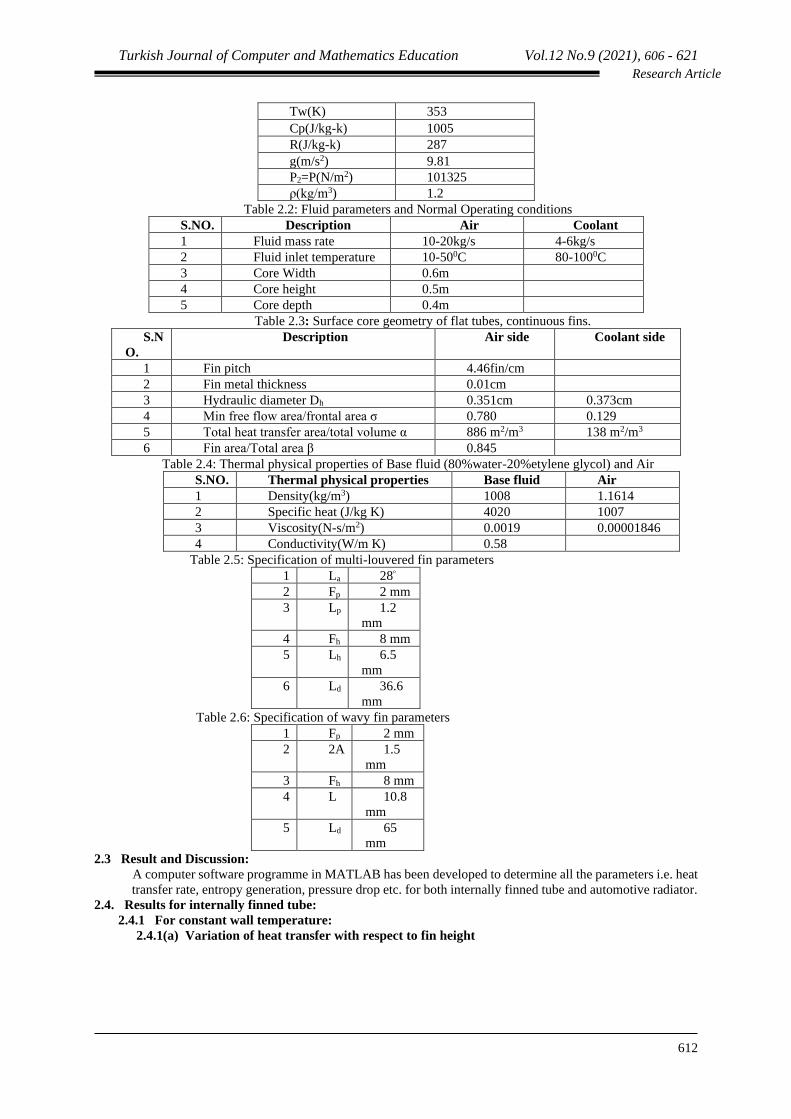
Fig2.2: Entropy generation vs fin height
In this Fig. 2.2 entropy generation increases initially it will be maximum after some time and then
decreases. Maximum entropy generation =0.0311 W/K& Fin height at maximum entropy generation =0.0011m
2.4.1(c) Variation of pressure drop with respect to fin height
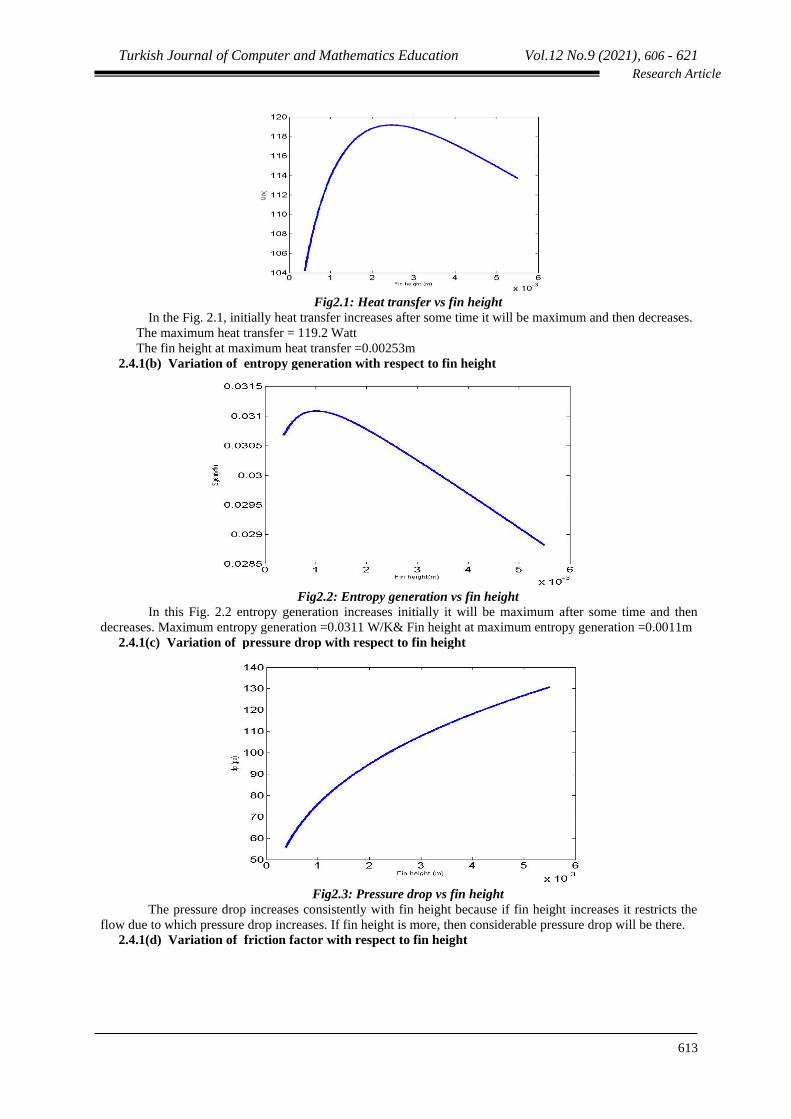
Fig2.3: Pressure drop vs fin height
The pressure drop increases consistently with fin height because if fin height increases it restricts the
flow due to which pressure drop increases. If fin height is more, then considerable pressure drop will be there.
2.4.1(d) Variation of friction factor with respect to fin height
Turkish Journal of Computer and Mathematics Education Vol.12 No.9 (2021), 606 - 621
614
Research Article
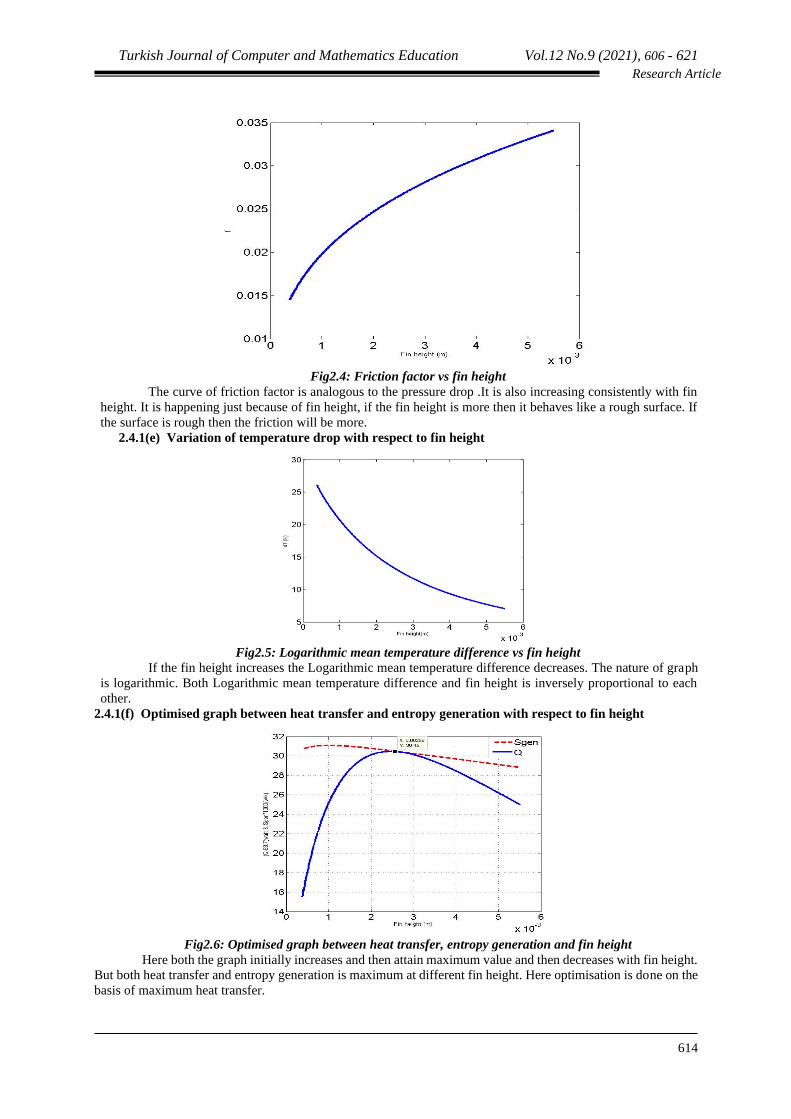
Fig2.4: Friction factor vs fin height
The curve of friction factor is analogous to the pressure drop .It is also increasing consistently with fin
height. It is happening just because of fin height, if the fin height is more then it behaves like a rough surface. If
the surface is rough then the friction will be more.
2.4.1(e) Variation of temperature drop with respect to fin height
Fig2.5: Logarithmic mean temperature difference vs fin height
If the fin height increases the Logarithmic mean temperature difference decreases. The nature of graph
is logarithmic. Both Logarithmic mean temperature difference and fin height is inversely proportional to each
other.
2.4.1(f) Optimised graph between heat transfer and entropy generation with respect to fin height
Fig2.6: Optimised graph between heat transfer, entropy generation and fin height
Here both the graph initially increases and then attain maximum value and then decreases with fin height.
But both heat transfer and entropy generation is maximum at different fin height. Here optimisation is done on the
basis of maximum heat transfer.
Turkish Journal of Computer and Mathematics Education Vol.12 No.9 (2021), 606 - 621
615
Research Article
Maximum heat transfer =119.2 watt at fin height = 0.0053m
Maximum entropy generation =0.0311 W/K at fin height = 0.0011m
Optimised value
At fin height = 0.00253m
Maximum heat transfer = 119.2 Watt
Entropy generation = 0.00305 W/K
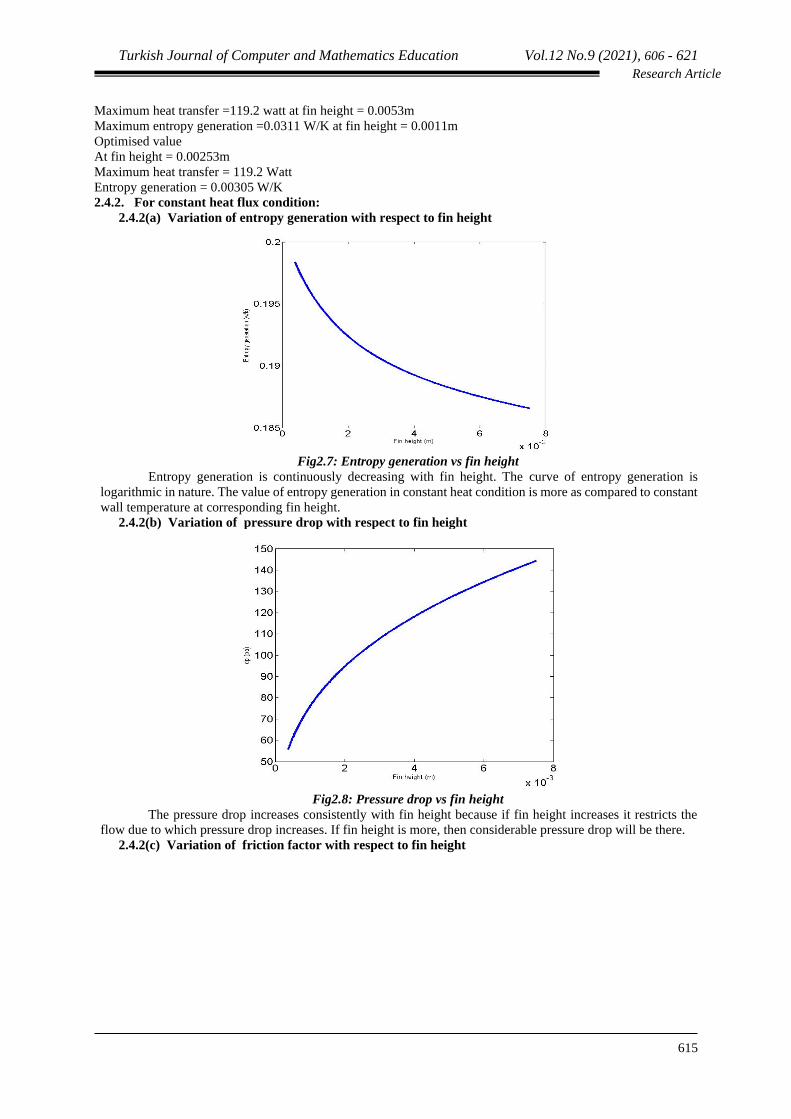
2.4.2. For constant heat flux condition:
2.4.2(a) Variation of entropy generation with respect to fin height
Fig2.7: Entropy generation vs fin height
Entropy generation is continuously decreasing with fin height. The curve of entropy generation is
logarithmic in nature. The value of entropy generation in constant heat condition is more as compared to constant
wall temperature at corresponding fin height.
2.4.2(b) Variation of pressure drop with respect to fin height
Fig2.8: Pressure drop vs fin height
The pressure drop increases consistently with fin height because if fin height increases it restricts the
flow due to which pressure drop increases. If fin height is more, then considerable pressure drop will be there.
2.4.2(c) Variation of friction factor with respect to fin height

Turkish Journal of Computer and Mathematics Education Vol.12 No.9 (2021), 606 - 621
616
Research Article
Co
oli
ng
ca
pa
city
(W
)
Coolant mass flow rate
(kg/s) Figure 2.11: Effect of mass flow rate of
air on cooling capacity
En
tro
py
gen
era
tio
n
(J/K
)
Air mass flow rate (kg/s)
Figure 2.12: Effect of mass flow rate of
air on entropy generation
Fig2.9: Friction factor vs fin height
The curve of friction factor is analogous to the pressure drop .It is also increasing consistently with fin
height. It is happening just because of fin height, if the fin height is more then it behaves like a rough surface. If
the surface is rough then the friction will be more.
2.4.2(d) Variation of temperature drop with respect to fin height
Fig2.10: Temperature difference vs fin height
If the fin height increases the temperature difference decreases. The nature of graph is logarithmic. Both
temperature difference and fin height is inversely proportional to each other.
2.5. Results for Plate fin Radiator:
2.5.1 Influence of varying inlet air mass flow rate:
The variation of cooling capacity and effectiveness with air mass flow rate from 10 to 20 kg/s is shown
in Fig. keeping constant average values for other input data (mc = 5 kg/s, Tai = 30C, Tnfi = 90C). It has been
found that with increase in mass flow rate of air, cooling capacity goes on increasing because of increasing heat
transfer coefficient and the effectiveness for cooling is goes on decreasing. And in Fig.2.12 entropy generation
increases with air mass flow rate.

Turkish Journal of Computer and Mathematics Education Vol.12 No.9 (2021), 606 - 621
617
Research Article
Pre
ssu
re d
rop
(P
a)
Coolant mass flow rate
(kg/s) Figure 2.13: Effect of mass flow rate of
coolant on pressure drop
En
tro
py
gen
era
tio
n
(J/K
)
Coolant mass flow rate
(kg/s) Figure 2.14: Effect of mass flow rate of
coolant on entropy generation
2.5.2 Influence of varying coolant mass flow rate:
Result (Fig.2.13) shows that with the variation of coolant mass flow rate, pressure drop increases because
pressure drop is directly proportional to the velocity of the coolant, and velocity is directly proportional to the
mass flow rate of the coolant. And in Fig.2.14 entropy generation increases with coolant mass flow rate.
2.5.3 Influence of varying inlet air temperature:
The variation of cooling capacity and effectiveness with air inlet temperature is shown in Fig.2.15 for
(mc = 5kg/s, ma = 10 kg/s, Tnfi = 90C). As expected the heat transfer rate clearly decreases with air inlet
temperature rise, as the cooling temperature difference is being reduced.
Figure 2.15: Effect of air inlet temperature on cooling capacity
2.5.4 Influence of varying coolant inlet temperature:
The variation of cooling capacity with coolant inlet temperature is shown in Fig.2.16 for (mc = 5kg/s, ma
= 10kg/s, Tai = 300C). As expected the heat transfer rate increases with coolant inlet temperature rise due to
increment in the cooling temperature difference.
Co
oli
ng
ca
pa
city
(W
)
Air inlet temperature (K)

Turkish Journal of Computer and Mathematics Education Vol.12 No.9 (2021), 606 - 621
618
Research Article
Coolant mass flow rate (kg/s)
Pre
ssu
re d
rop
(P
a)
Figure 2.18: Effect of mass flow
rate of coolant on pressure drop
Air inlet temperature
(K)
Co
oli
ng
ca
pa
city
(W
)
Figure 2.19: Effect of air inlet
temperature on cooling capacity
Coolant inlet temperature
(K)
Co
oli
ng
ca
pa
city
(W
)
Figure 2.20: Effect of coolant inlet
temperature on cooling capacity
Air mass flow rate (kg/s)
Co
oli
ng
ca
pa
city
(W)
Fig.2.17: Effect of mass flow rate of
air on cooling capacity
Figure 2.16: Effect of coolant inlet temperature on cooling capacity
2.6. Results for louvered fin Radiator:
For enhancing heat transfer rate, louvered fin geometry has been used. As shown in Figs.2.17-2.21, the
parametric variations are similar to plate fin. As discussed earlier for the plate fin geometry that with the variation
of inlet air mass flow rate, cooling capacity increases while effectiveness decreases, on comparing its performance
with plate fin geometry about 8% enhancement in the cooling capacity is observed (Fig. 2.17). In the similar
manner, cooling capacity, effectiveness, pressure drop increases with increase in coolant mass flow rate keeping
other factors as a constant (Fig. 2.18). On increasing inlet air temperature, the reduction in cooling capacity of
radiator is observed (Fig. 2.19) while the cooling capacity increases with the increase in coolant inlet temperature
(Fig. 2.20). And on increasing in mass flow rate of coolant, the entropy generation increases (Fig. 2.21).
Co
oli
ng
ca
pa
city
(W
)
Coolant inlet temperature (K)

Turkish Journal of Computer and Mathematics Education Vol.12 No.9 (2021), 606 - 621
619
Research Article
Coolant mass flow rate
(kg/s)
En
tro
py
g
ener
ati
on
(J/K
)
Figure 2.21: Effect of coolant mass flow
rate on entropy generation
Air mass flow rate (kg/s)
Co
oli
ng
ca
pa
city
(W
)
Figure 2.22: Effect of mass flow rate of
air on cooling capacity
Coolant mass flow rate
(kg/s)
Pre
ssu
re d
rop
(P
a)
Figure 2.23: Effect of mass flow rate of
coolant on pressure drop
Air inlet temperature (K)
Co
oli
ng
ca
pa
city
(W
)
Figure 2.24: Effect of air inlet
temperature on cooling capacity
Coolant inlet temperature
(K)
Co
oli
ng
ca
pa
city
(W
)
Figure 2.25: Effect of coolant
inlet temperature on cooling capacity
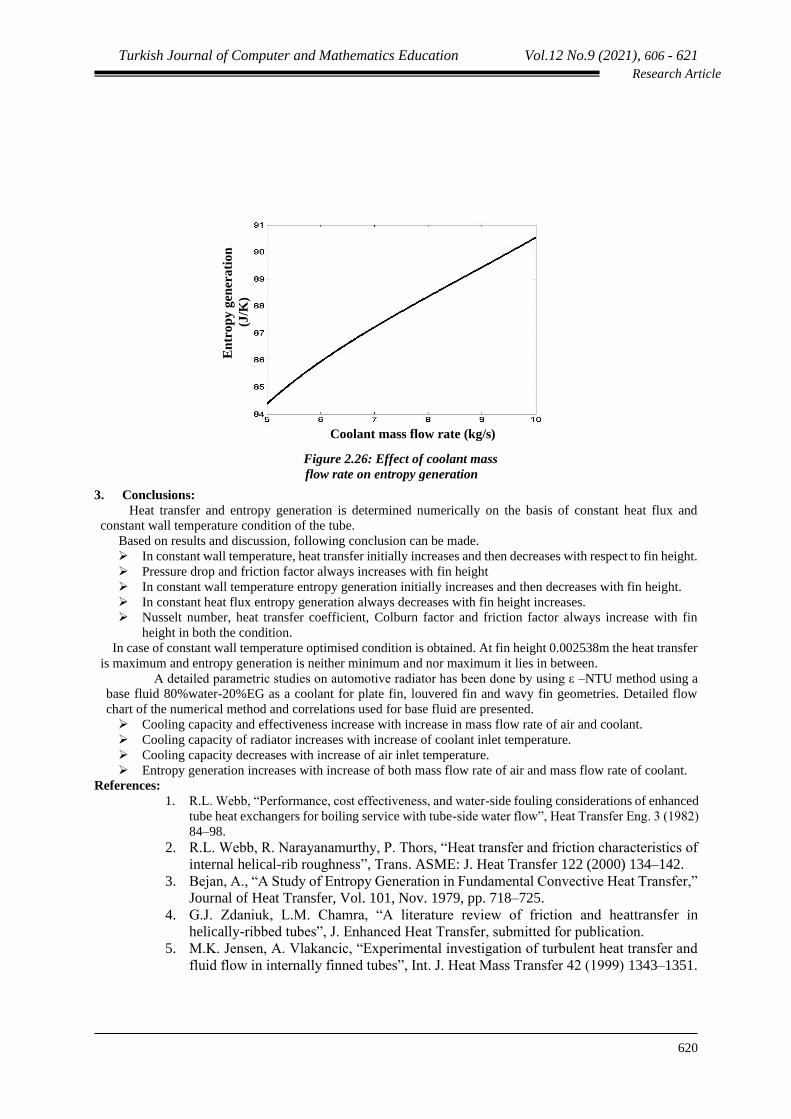
2.7. Results for wavy fin Radiator:
For enhancing heat transfer rate, wavy fin geometry has been used. As shown in Figs.2.22-2.26, the
parametric variations are similar to louvered fin. As discussed earlier for the louvered fin geometry that with the
variation of inlet air mass flow rate (Fig. 2.22), cooling capacity increases. In the similar manner, cooling capacity,
pressure drop (Fig. 2.23) increases with increase in coolant mass flow rate keeping other factors as a constant.
On increasing inlet air temperature, the reduction in cooling capacity of radiator is observed (Fig. 2.24) while the
cooling capacity increases with the increase in coolant inlet temperature (Fig. 2.25). And on increasing in mass
flow rate of coolant, the entropy generation increases (Fig.2.26).
Turkish Journal of Computer and Mathematics Education Vol.12 No.9 (2021), 606 - 621
620
Research Article
Coolant mass flow rate (kg/s)
En
tro
py
gen
era
tio
n
(J/K
)
Figure 2.26: Effect of coolant mass
flow rate on entropy generation
3. Conclusions:
Heat transfer and entropy generation is determined numerically on the basis of constant heat flux and
constant wall temperature condition of the tube.
Based on results and discussion, following conclusion can be made.
➢ In constant wall temperature, heat transfer initially increases and then decreases with respect to fin height.
➢ Pressure drop and friction factor always increases with fin height
➢ In constant wall temperature entropy generation initially increases and then decreases with fin height.
➢ In constant heat flux entropy generation always decreases with fin height increases.
➢ Nusselt number, heat transfer coefficient, Colburn factor and friction factor always increase with fin
height in both the condition.
In case of constant wall temperature optimised condition is obtained. At fin height 0.002538m the heat transfer
is maximum and entropy generation is neither minimum and nor maximum it lies in between.
A detailed parametric studies on automotive radiator has been done by using ε –NTU method using a
base fluid 80%water-20%EG as a coolant for plate fin, louvered fin and wavy fin geometries. Detailed flow
chart of the numerical method and correlations used for base fluid are presented.
➢ Cooling capacity and effectiveness increase with increase in mass flow rate of air and coolant.
➢ Cooling capacity of radiator increases with increase of coolant inlet temperature.
➢ Cooling capacity decreases with increase of air inlet temperature.
➢ Entropy generation increases with increase of both mass flow rate of air and mass flow rate of coolant.
References:
1. R.L. Webb, “Performance, cost effectiveness, and water-side fouling considerations of enhanced
tube heat exchangers for boiling service with tube-side water flow”, Heat Transfer Eng. 3 (1982)
84–98.
2. R.L. Webb, R. Narayanamurthy, P. Thors, “Heat transfer and friction characteristics of
internal helical-rib roughness”, Trans. ASME: J. Heat Transfer 122 (2000) 134–142.
3. Bejan, A., “A Study of Entropy Generation in Fundamental Convective Heat Transfer,”
Journal of Heat Transfer, Vol. 101, Nov. 1979, pp. 718–725.
4. G.J. Zdaniuk, L.M. Chamra, “A literature review of friction and heattransfer in
helically-ribbed tubes”, J. Enhanced Heat Transfer, submitted for publication.
5. M.K. Jensen, A. Vlakancic, “Experimental investigation of turbulent heat transfer and
fluid flow in internally finned tubes”, Int. J. Heat Mass Transfer 42 (1999) 1343–1351.

Turkish Journal of Computer and Mathematics Education Vol.12 No.9 (2021), 606 - 621
621
Research Article
6. G.J. Zdaniuk, L.M. Chamra, P.J. Mago, “Experimental determination of heat transfer
and friction in helically-finned tubes”, Exp. Therm. Fluid Sci., submitted for
publication.
7. McClintock, F. A., “The Design of Heat Exchangers for Minimum Irreversibility,”
ASME Paper 51-A-108, 1951.
8. Abbassi H. et al. “Entropy generation analysis in a uniformly heated tube heat sink.
Energy” 2007;32:1932–47.
9. Naterer, G.F., Camberos, J.A. “Entropy-based Design and Analysis of Fluids
Engineering Systems”. CRC Press, Boca Raton (2008)
10. Y. Demirel, R. Kahraman, Entropy generation in a rectangular packed duct with wall
heat flux, Int. J. Heat Mass Transfer 42 (1999) 2337–2344.
11. Ahmet Z. Sahin and Rached Ben-Mansour.,(2003).Entropy generation in laminar fluid
flow through circular pipes. ISSN 1099-4300, Entropy
12. C. Oliet, A. Oliva, J. Castro, C.D. Pe´rezSegarra.,(2007).parametric studies on
automotive radiator. Applied Thermal Engineering.
13. S.M.Peyghambarh, S.H. HashemabadiS.M.Hoseini,M. SeifiJamnani.,(2011)
Experimental study of heat transfer Enhancement using water/ethylene Glycol based
nano fluids as a new Coolant for car radiators.
14. K. Y. Leong, R. Saidur, S. N. Kazi, A. H. Mamun, Performance investigation of an
automotive car radiator operated with nanofluid-based coolants (nanofluid as a coolant
in a radiator), Applied Thermal Engineering 30 (2010) 2685–2692.
15. S. M. Peyghambarzadeh , S. H. Hashemabadi , S. M. Hoseini , M. SeifiJamnani,
Experimental study of heat transfer enhancement using water/ethylene glycol based
nanofluids as a new coolant for car radiators, International communication of Heat and
Mass transfer ,Article in press (2011).
16. K. Y. Leong, R. Saidur, S. N. Kazi, A. H. Mamun, Performance investigation of an
automotive car radiator operated with nanofluid-based coolants (nanofluid as a coolant
in a radiator), Applied Thermal Engineering 30 (2010) 2685–2692.
17. Y. J. Chang and C. C. Wang, A generalized heat transfer correlation for Louver fin
geometry, International journal of heat transfer, 40(3) (1997) 533-544.