Heat Pump Water Heater Modeling - Energy
37
NREL is a national laboratory of the U.S. Department of Energy, Office of Energy Efficiency and Renewable Energy, operated by the Alliance for Sustainable Energy LLC Heat Pump Water Heater Modeling in EnergyPlus Building America Residential Energy Efficiency Stakeholder Meeting Eric Wilson Craig Christensen March 1, 2012
Transcript of Heat Pump Water Heater Modeling - Energy

NREL is a national laboratory of the U.S. Department of Energy, Office of Energy Efficiency and Renewable Energy, operated by the Alliance for Sustainable Energy LLC
Heat Pump Water Heater Modeling in EnergyPlus
Building America Residential Energy Efficiency Stakeholder Meeting
Eric Wilson Craig Christensen March 1, 2012

2
Modeling Issues Results Motivation
Heat Pump Water Heater Modeling…

3
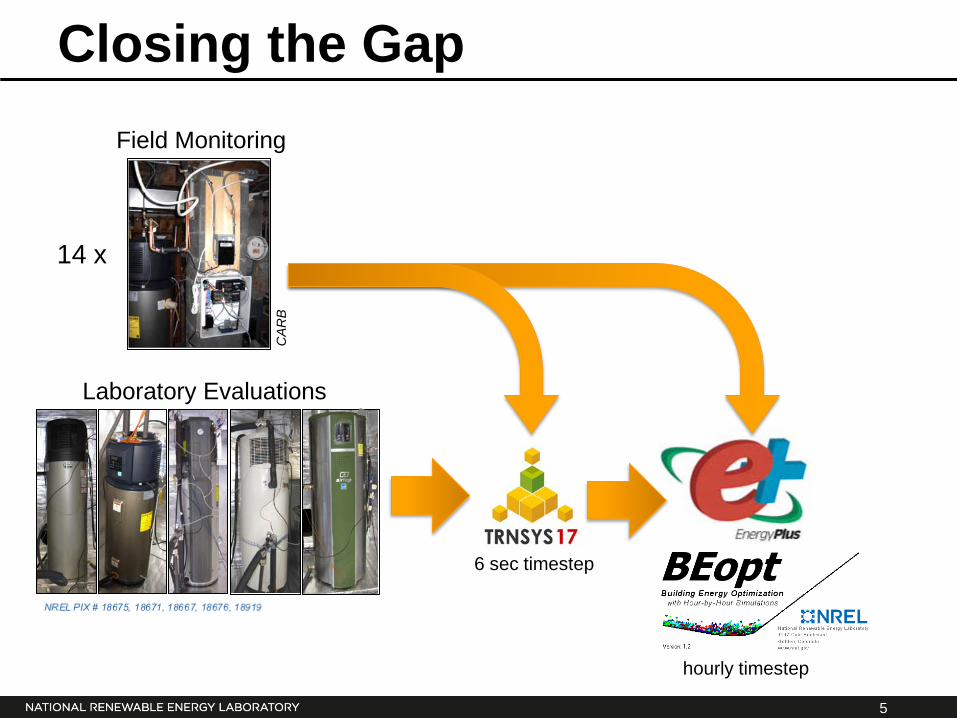
Gap: Existing analysis tools cannot accurately model HPWHs with reasonable runtime.

4
What have we achieved so far?
Laboratory Evaluations
14 x
Field Monitoring
5
Closing the Gap
Laboratory Evaluations
6 sec timestep
hourly timestep
14 x
Field Monitoring
CA
RB

6
Why is modeling important?
• Performance varies: Can’t just use EF
• System interaction
o HPWH affects building heating and cooling
o Space conditions affect HPWH performance

7
Modeling Goals
• Manage Risks o Accuracy o Run time o Occupant satisfaction
• Flexibility to explore the effects of:
o Tank location, volume, setpoint o Hot water use patterns
• HPWH vs. all other measures (optimization)

8
Heat Pump Water Heater Modeling…
Results Motivation
1) Tank Stratification
2) Draw Profile
3) Performance Maps
4) Sizing
Modeling Issues

9
1) Tank Stratification
Mixed tank
Tmains
Existing Model EnergyPlus HPWH mixed tank

10
1) Tank Stratification
Mixed tank
Tmains
Existing Model EnergyPlus HPWH mixed tank
Tmains
Stratified tank
Realistic Performance Stratified tank

11
1) Tank Stratification
Mixed tank
Tmains
2) warmer coil worse performance
1) Colder water supplied
Existing Model EnergyPlus HPWH mixed tank
Tmains
Stratified tank
Realistic Performance Stratified tank
Implications of using a mixed tank model…

12
1) Tank Stratification
Tmains Mixed tank
Mixed tank
New Model Two tanks in Series
Tmains
Realistic Performance Stratified tank
Stratified tank

13
2) Draw Profile
HPWH Power
Hot Water Use
Existing Model Smooth Draw Profile
Hourly Timestep

14
2) Draw Profile Existing Model
Smooth Draw Profile Hourly Timestep

15
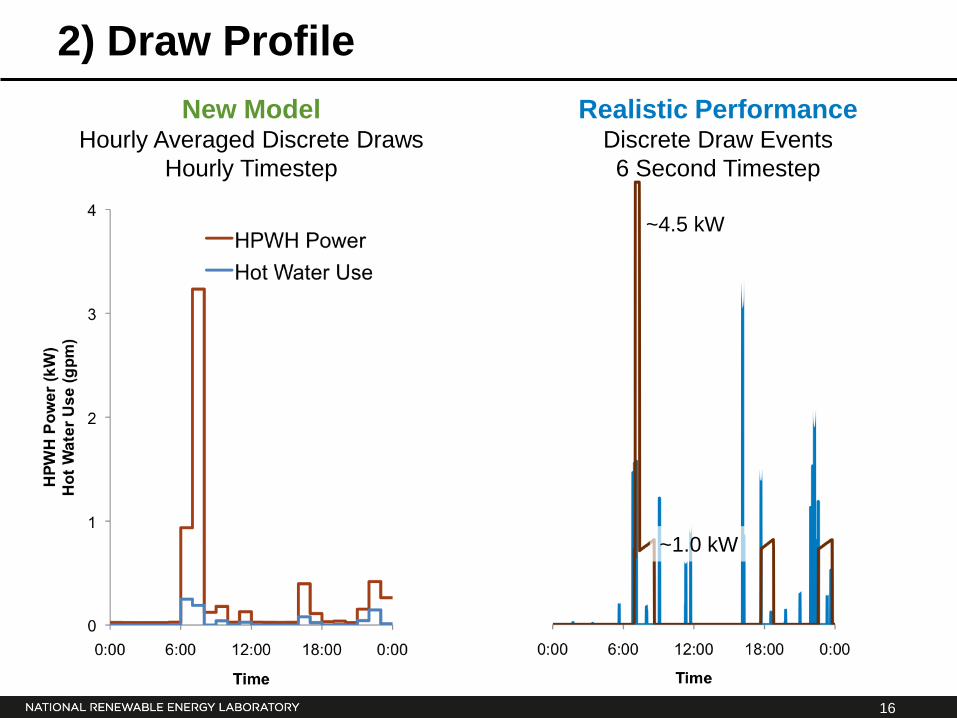
2) Draw Profile Realistic Performance
Discrete Draw Events 6 Second Timestep
Existing Model Smooth Draw Profile
Hourly Timestep
HPWH Energy
14 MBtu/yr HPWH Energy
23 MBtu/yr
~4.5 kW
~1.0 kW
If these draw profiles are used for an annual simulation…
16
2) Draw Profile Realistic Performance
Discrete Draw Events 6 Second Timestep
New Model Hourly Averaged Discrete Draws
Hourly Timestep
~4.5 kW
~1.0 kW

17
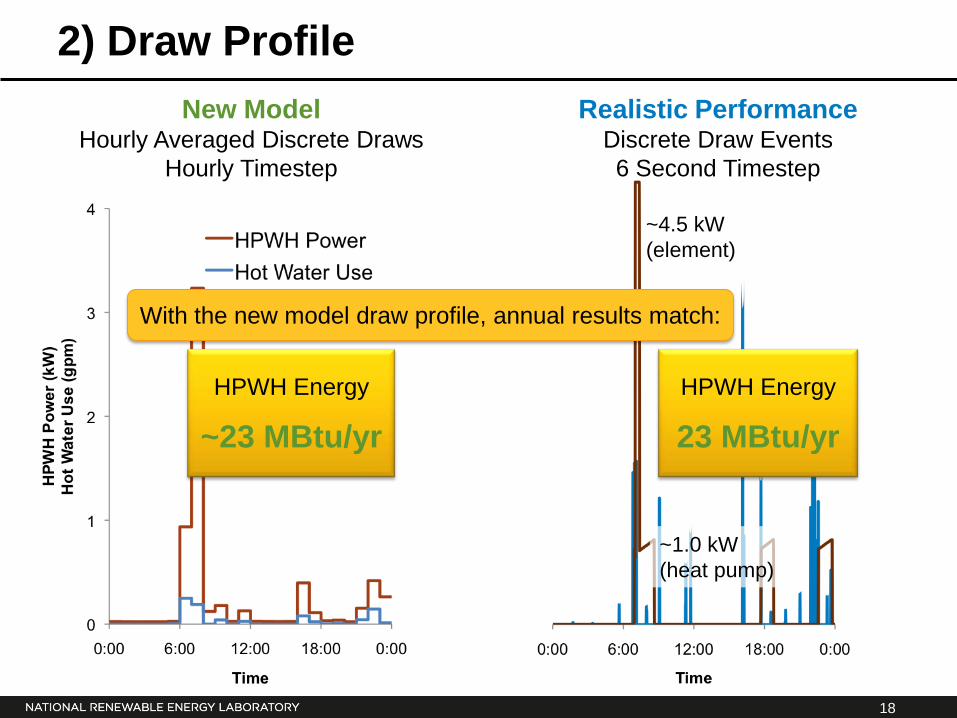
2) Draw Profile Realistic Performance
Discrete Draw Events 6 Second Timestep
New Model Hourly Averaged Discrete Draws
Hourly Timestep
February9 10 11 12 13 14 15
0.00
0.02
0.04
0.06
0.08
0.10
Tota
l Hot
Wat
er F
low
Rat
e (c
fm)
Hourly Time Series
~4.5 kW
~1.0 kW
18
2) Draw Profile Realistic Performance
Discrete Draw Events 6 Second Timestep
New Model Hourly Averaged Discrete Draws
Hourly Timestep
HPWH Energy
~23 MBtu/yr HPWH Energy
23 MBtu/yr
~4.5 kW (element)
~1.0 kW (heat pump)
With the new model draw profile, annual results match:

19
3) Performance Maps Existing Model
Constant Performance?

20
(constant 67°F, 50% RH air)
Mfgr 1 Mfgr 2
Mfgr 3
Realistic Performance Manufacturer Specific
3) Performance Maps Existing Model
Constant Performance?
21
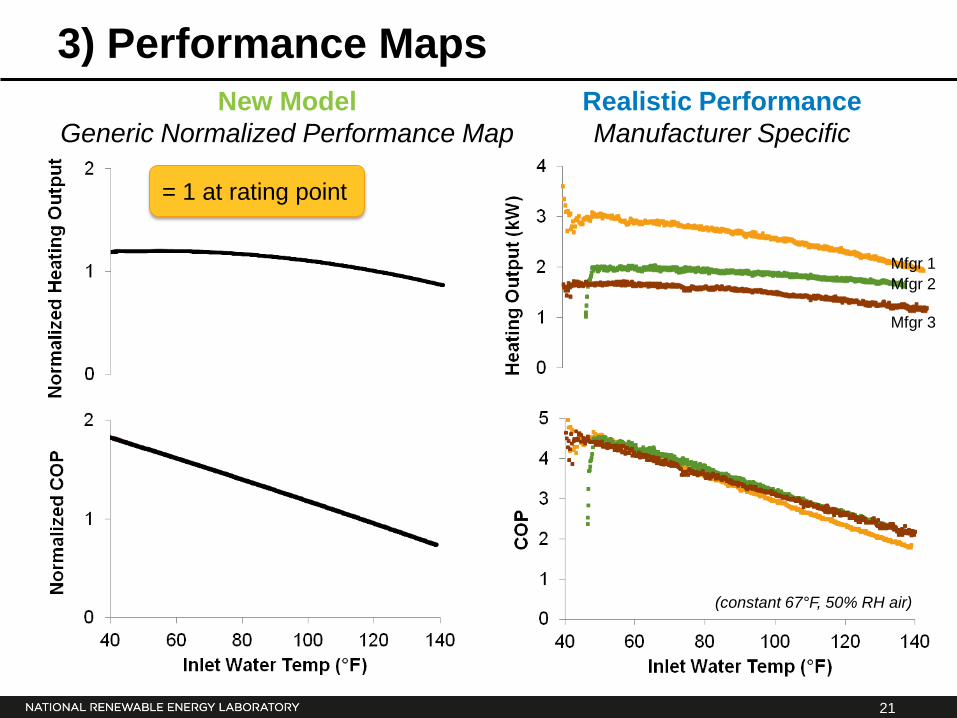
3) Performance Maps New Model
Generic Normalized Performance Map
(constant 67°F, 50% RH air)
Realistic Performance Manufacturer Specific
Mfgr 1 Mfgr 2
Mfgr 3
= 1 at rating point

22
3) Performance Maps New Model
Generic Normalized Performance Map
(constant 67°F, 50% RH air)
Realistic Performance Manufacturer Specific
Mfgr 1 Mfgr 2
Mfgr 3

23
3) Performance Maps New Model
Generic Normalized Performance Map
(constant 67°F, 50% RH air)
Realistic Performance Manufacturer Specific
Mfgr 1 Mfgr 2
Mfgr 3
Use rated values to get specific performance map:

24
4) HPWH Sizing
• No existing method for HPWH sizing
Conventional Electric WH Sizing:
Existing Model
0 10 20 30 40 50 60 70
1 2 3 4 5
Tank
Vol
ume
(gal
)
# Bedrooms
Range = f(# baths)

25
4) HPWH Sizing
• No existing method for HPWH sizing
Conventional Electric WH Sizing:
Existing Model
0 10 20 30 40 50 60 70
1 2 3 4 5
Tank
Vol
ume
(gal
)
# Bedrooms
Reduced capacity to meet DHW demand (vs. conventional WHs)
Function of: o Climate o # bedrooms o Tank Volume o Setpoint Temperature
April
Realistic Performance
Range = f(# baths)

26
4) HPWH Sizing
New Model “Percent Unmet Showers”
Realistic Performance
Reduced capacity to meet DHW demand (vs. conventional WHs)
Function of: o Climate o # bedrooms o Tank Volume o Setpoint Temperature
Option Display Variable
April
Percent Unmet Showers • Function of climate, # bedrooms, tank volume, setpoint • Estimate of shower time < 110 F • Helps users select acceptable options • Sensitive to hot water use patterns so will vary from one set of occupants to the next

27
Modeling Issues Results Motivation
Heat Pump Water Heater Modeling…

28
Model Calibration Calibrated to TRNSYS results ±5%
12 cases: Chicago, Houston; 1, 3, 5 BR; 50, 80 gal

29
Model Calibration
Daily Draw Volume (gal/day)
Dai
ly S
yste
m C
OP
Chicago, 50 gal Unfinished Basement

30
Model Calibration
Daily Draw Volume (gal/day)
Dai
ly S
yste
m C
OP
Chicago, 50 gal Unfinished Basement

31
Model Calibration
Daily Draw Volume (gal/day)
Dai
ly S
yste
m C
OP
Houston, 50 gal Garage

32
Model Calibration
Daily Draw Volume (gal/day)
Dai
ly S
yste
m C
OP
Houston, 50 gal Garage

33
BEoptE+ Modeling Results HPWH vs. Electric Resistance
With Cooling Impact (Air-Source HP)
Model: A-B Setpoint: 120-140°F Location: Conditioned, Unconditioned
34
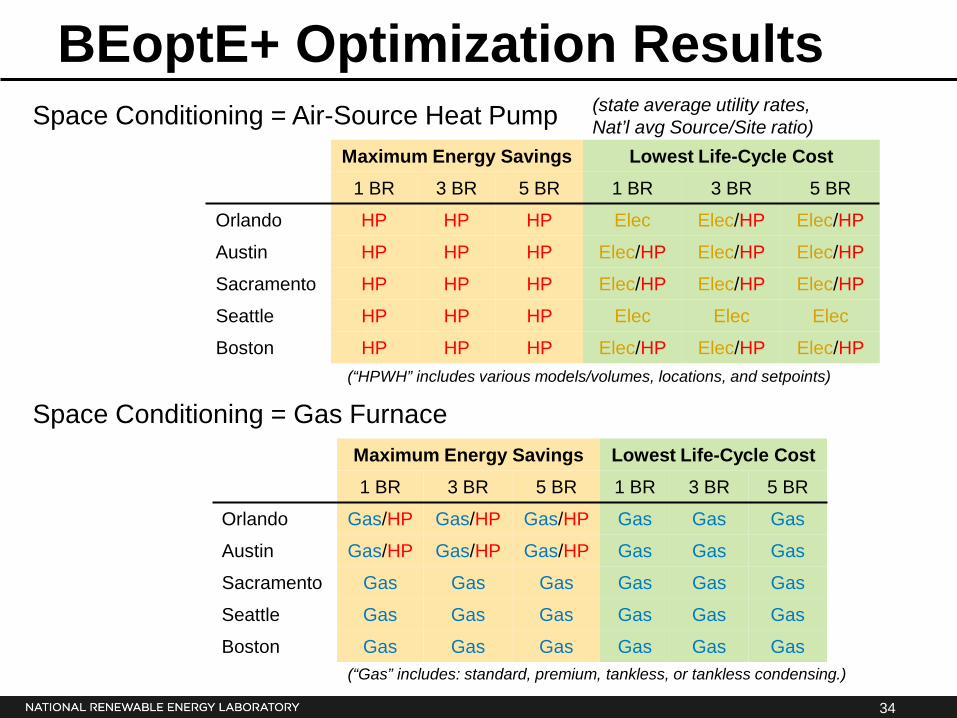
BEoptE+ Optimization Results Space Conditioning = Air-Source Heat Pump
Maximum Energy Savings Lowest Life-Cycle Cost 1 BR 3 BR 5 BR 1 BR 3 BR 5 BR
Orlando HP HP HP Elec Elec/HP Elec/HP
Austin HP HP HP Elec/HP Elec/HP Elec/HP
Sacramento HP HP HP Elec/HP Elec/HP Elec/HP
Seattle HP HP HP Elec Elec Elec
Boston HP HP HP Elec/HP Elec/HP Elec/HP
Maximum Energy Savings Lowest Life-Cycle Cost 1 BR 3 BR 5 BR 1 BR 3 BR 5 BR
Orlando Gas/HP Gas/HP Gas/HP Gas Gas Gas
Austin Gas/HP Gas/HP Gas/HP Gas Gas Gas
Sacramento Gas Gas Gas Gas Gas Gas
Seattle Gas Gas Gas Gas Gas Gas
Boston Gas Gas Gas Gas Gas Gas
Space Conditioning = Gas Furnace
(“Gas” includes: standard, premium, tankless, or tankless condensing.)
(“HPWH” includes various models/volumes, locations, and setpoints)
(state average utility rates, Nat’l avg Source/Site ratio)

35
Conclusions
HPWH model for EnergyPlus/BEopt • Market Benefits:
o Integrated with existing tool o Fast o Flexible o Accurate

36
Conclusions
Lessons Learned • Rated EF for HPWHs not good indicator of performance • Don’t use “smooth” BA HSP draw profile for HPWH testing • Control logic matters • Sizing HPWHs for adequate HW delivery: many factors
Remaining Issues • Better draw profiles for HPWH modeling/testing • Performance in enclosed spaces

For more information:
Laboratory Testing Report:
Sparn, B.; Hudon, K.; Christensen, D. (2011). Laboratory Performance Evaluation of Residential Integrated Heat Pump Water Heaters. 77 pp.; NREL Report No. TP-5500-52635.
TRNSYS Modeling Results: Maguire, J. (2011). A Parametric Analysis of Residential Water Heaters. Master’s
Thesis. Boulder, CO: University of Colorado.