Heat Pump Assisted Drying - Freeze Drying Technologyeti.mstu.edu.ru/kaf_tpp/science/files/Freeze...
57
Trygve M. Eikevik Professor Norwegian University of Science and Technology (NTNU) Department of Energy and Process Engineering E-mail: [email protected] http://folk.ntnu.no/tme Heat Pump Assisted Drying - Freeze Drying Technology
Transcript of Heat Pump Assisted Drying - Freeze Drying Technologyeti.mstu.edu.ru/kaf_tpp/science/files/Freeze...

Trygve M. EikevikProfessor
Norwegian University of Science and Technology (NTNU)
Department of Energy and Process Engineering
E-mail: [email protected]
http://folk.ntnu.no/tme
Heat Pump Assisted Drying -Freeze Drying Technology
Introduction
Open system
2
Content
Closed loop system
Vacuum freeze drying
Atmospheric freeze drying
Conclusions

Quality vs. production costs3
Hot Air
Vacuum
freeze drying
Heat Pump Drying
Quality
Pro
du
ction
Cost
High
HighLow
Low

4
Comparing different drying methods
Vacuum
Freeze driers
Spray driers
Immobilisated particles
Frozen particles Solid particles
Heat pump driers
Tunnel driers
Belt driers
Drum driers
Etc.
+60oC-40oC -15oC 0oC
5
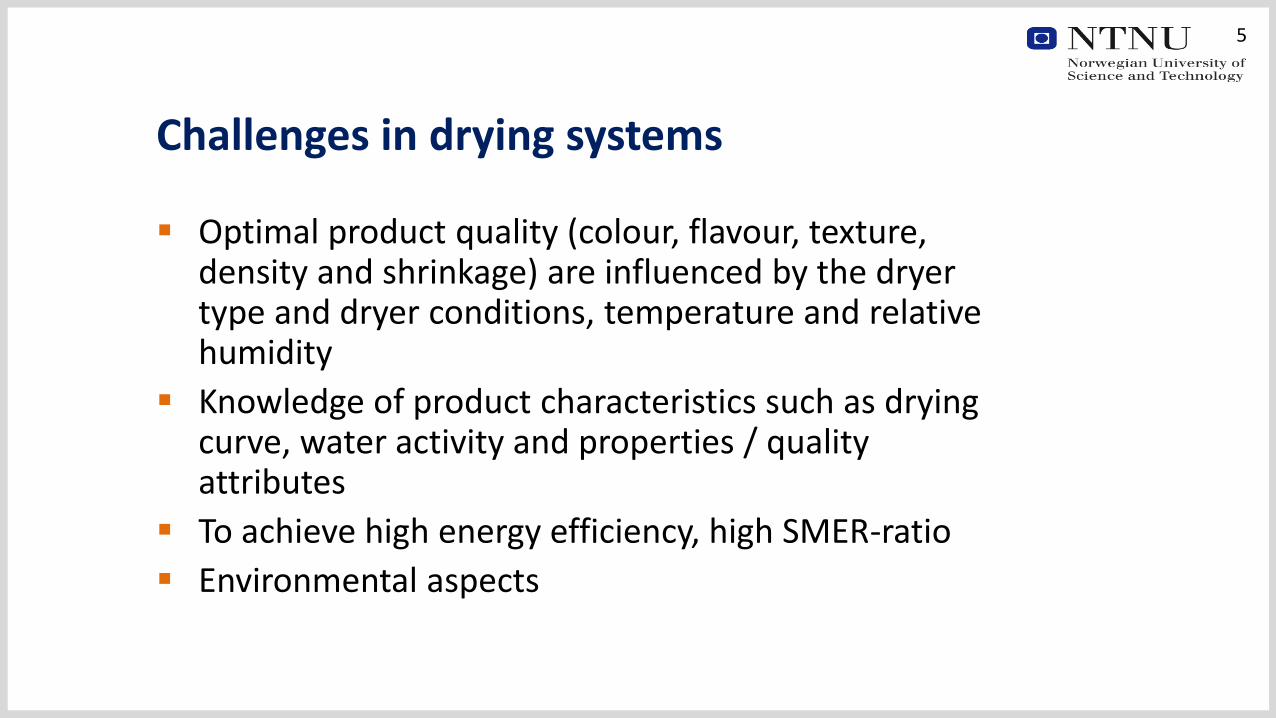
Challenges in drying systems
Optimal product quality (colour, flavour, texture, density and shrinkage) are influenced by the dryer type and dryer conditions, temperature and relative humidity
Knowledge of product characteristics such as drying curve, water activity and properties / quality attributes
To achieve high energy efficiency, high SMER-ratio
Environmental aspects

Introduction
Open system
6
Content
Closed loop system
Vacuum freeze drying
Atmospheric freeze drying
Conclusions

7
Drying of cod at the clips of west Norway

8
Traditional tunnel dryers (Hordetørke)
A
C
E B
L
Lo
Recirculation air
Discharge airInlet fresh air
Side view
Product
9
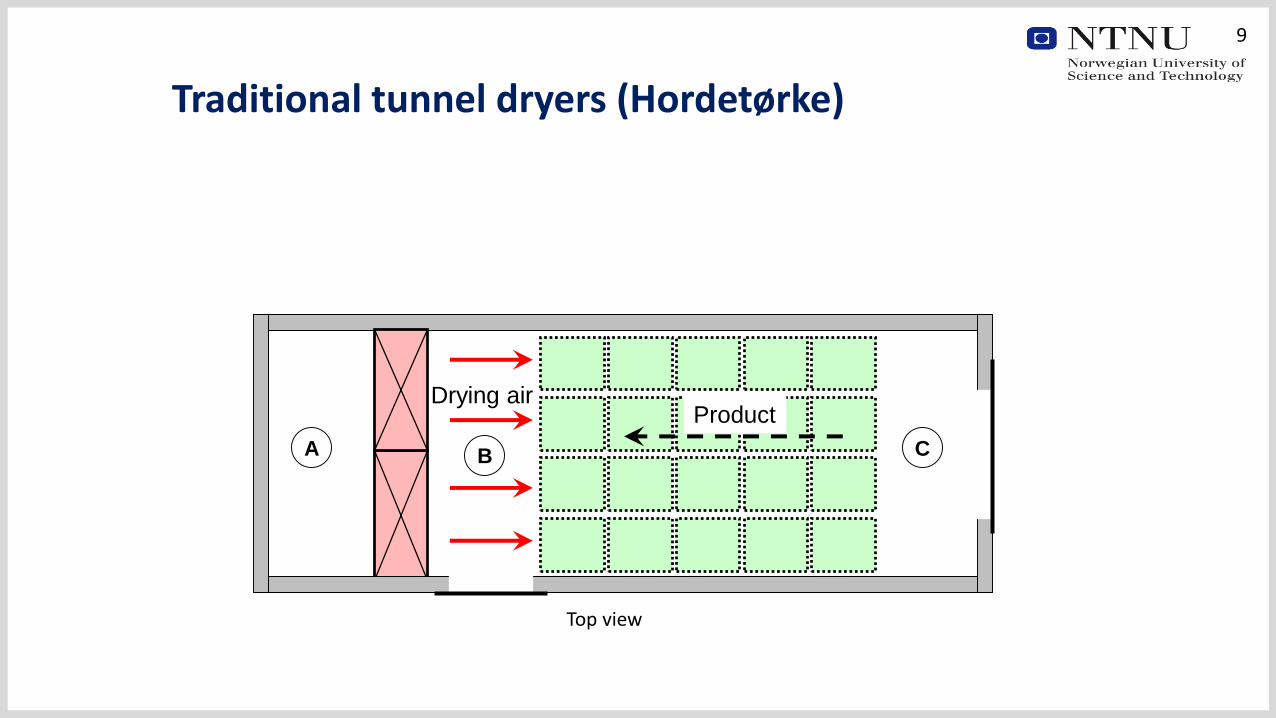
Traditional tunnel dryers (Hordetørke)
A B C
Drying air
Top view
Product

10
Hot air dryers
Max. temperature
Outdoor air
E
BB
A
CC
Lo
L

11
Influence of recirculation of air
0,60
0,65
0,70
0,75
0,80
0,85
0,90
0,95
1,00
1,05
1,10
0 10 20 30 40 50 60 70 80
Recirculation of air (%)
SM
ER
(kg
w/k
Wh
)
0 %
10 %
20 %
30 %
40 %
50 %
60 %
70 %
80 %
90 %
100 %
En
eg
y a
nd
Cap
acit
y r
ed
ucti
on
(%
)
SMER
Capacity
Energy

12
Reduction in thermal efficiency
3.500
3.550
3.600
3.650
3.700
3.750
3.800
3.850
3.900
0 10 20 30 40 50 60 70 80
Recirculation of air (%)
Th
erm
al
eff
icia
ncy,
Dh
/ DY
(kJ/k
gw)

Introduction
Open system
13
Content
Closed loop system
Vacuum freeze drying
Atmospheric freeze drying
Conclusions

14
Heat pump drying - Status
HP tunnel dryersHave successfully been designed, dimensioned and installed in Norway for drying of fish products (70 industrial plants in Norway)
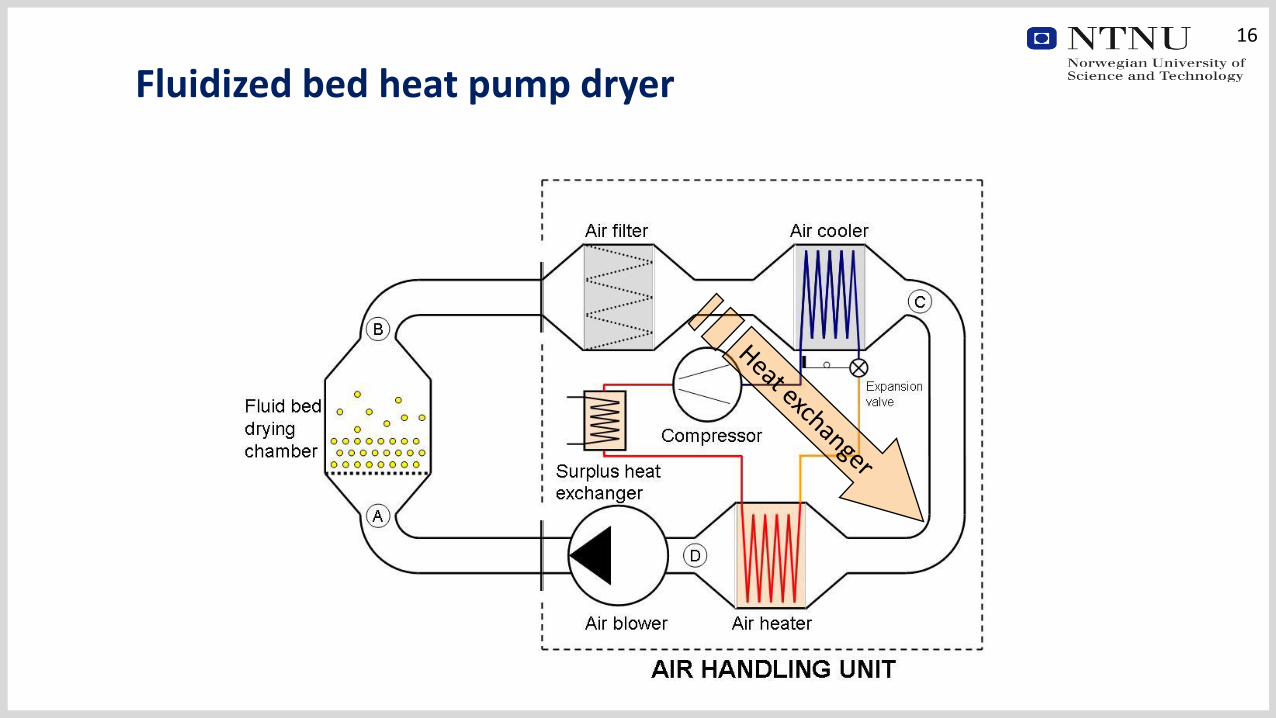
HP fluidized bed dryersBy using drying temperatures below and above the freezing point, the rehydration, colour, taste and bulk density of food products can be regulated. Medicine, pharmaceutical and biotechnological products can be dried without loss in biological activity (5 units in Norway, 1 very large HPD plant constructed in Hungary)
Non-adiabatic HP fluidizes bed dryersHP condenser is put in the fluidized bed to increase the drying capacity (1 unit in Norway)

15
Advantages with heat pumps in combination with driers
Product qualityDrying temperatures from -20oC to +100oC secure high
quality for heat sensitive products
Environmental aspectsRecirculation of drying gas (air or inert gas)
eliminates waste gas from the dryer. Electric driven
machinery have not emissions of CO2, SO2 or NOx
Energy aspectsEnergy consumptions for a heat pump dryer are typical
20% to 35% compared to conventional dryers
16
Fluidized bed heat pump dryer

17
Tunnel dryer with heat pump

18
Schematic layout of a heat pump fluidised bed dryer
A
CB
ReceiverExternal
condenser
Condenser Evaporator
Compressor
Expansion
valve
M
Water
Fluidized
bed
chamber
Air flow

19
Water activity, aw(product in equilibrium with the ambient air)
Wate
r acti
vit
y,
aw
Moisture content, Xwb %
0
100
100
0
A
C
B
aw =p
pw’
A), B) and C) showsdifferent types of materials/products

20
Water activity vs. relative humidity
aw =pp
pw’
φ =pa
pw’
Water activity
Relativ humidity
aw > φ Product will dry (loosing moisture/weight)
aw = φ Product is in equilibrium (is not loosing or gaining weight - stable)
aw < φ Product will gain water/moisture from air (weight is increasing)
pp: vapor pressure closeto product surface
pa: vapor pressure in freeair
pw’: saturated vapor pressure for water at t
21
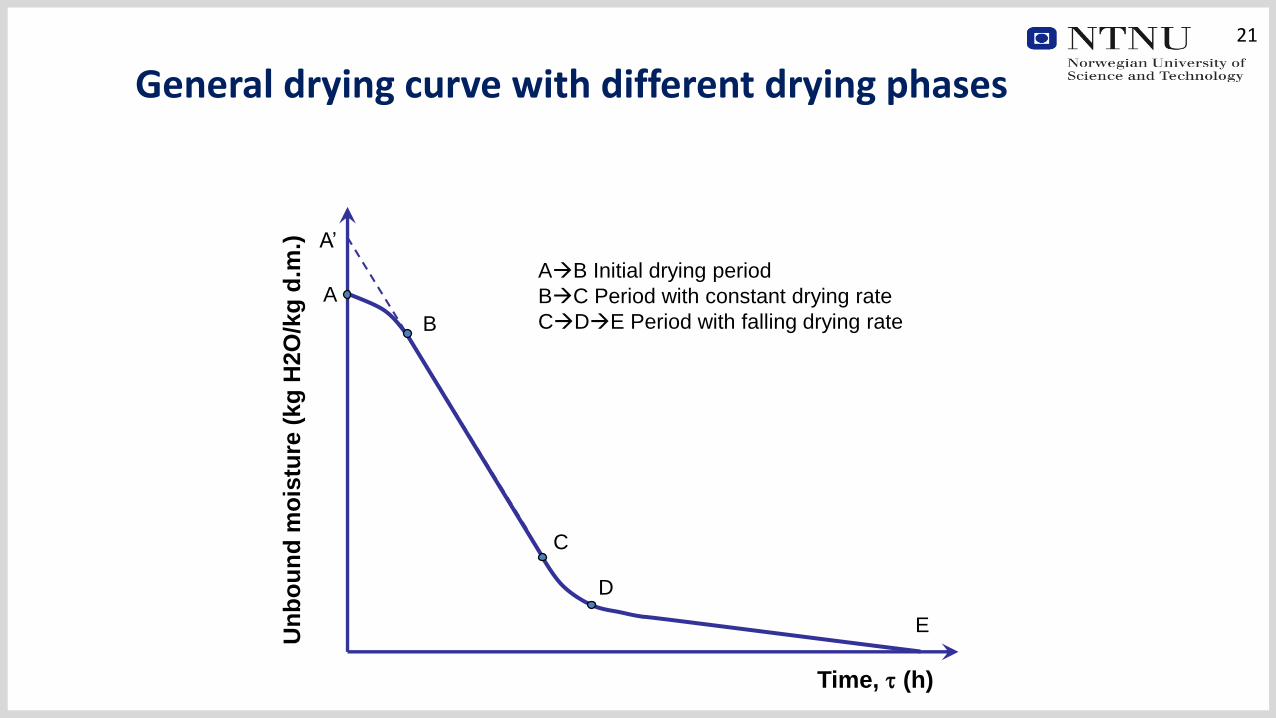
General drying curve with different drying phases
B
A
A’
D
C
E
Time, t (h)
Un
bo
un
d m
ois
ture
(kg
H2O
/kg
d.m
.)AB Initial drying period
BC Period with constant drying rate
CDE Period with falling drying rate

22
General drying rate curves
Dry
ing
rate
[kg
H2O
/(s m
2)]
BA
A’
D
C
E
Unbound moisture [kg H2O/kg d.m.]
Constant
drying rate
Falling
drying rate
XC
RC
23
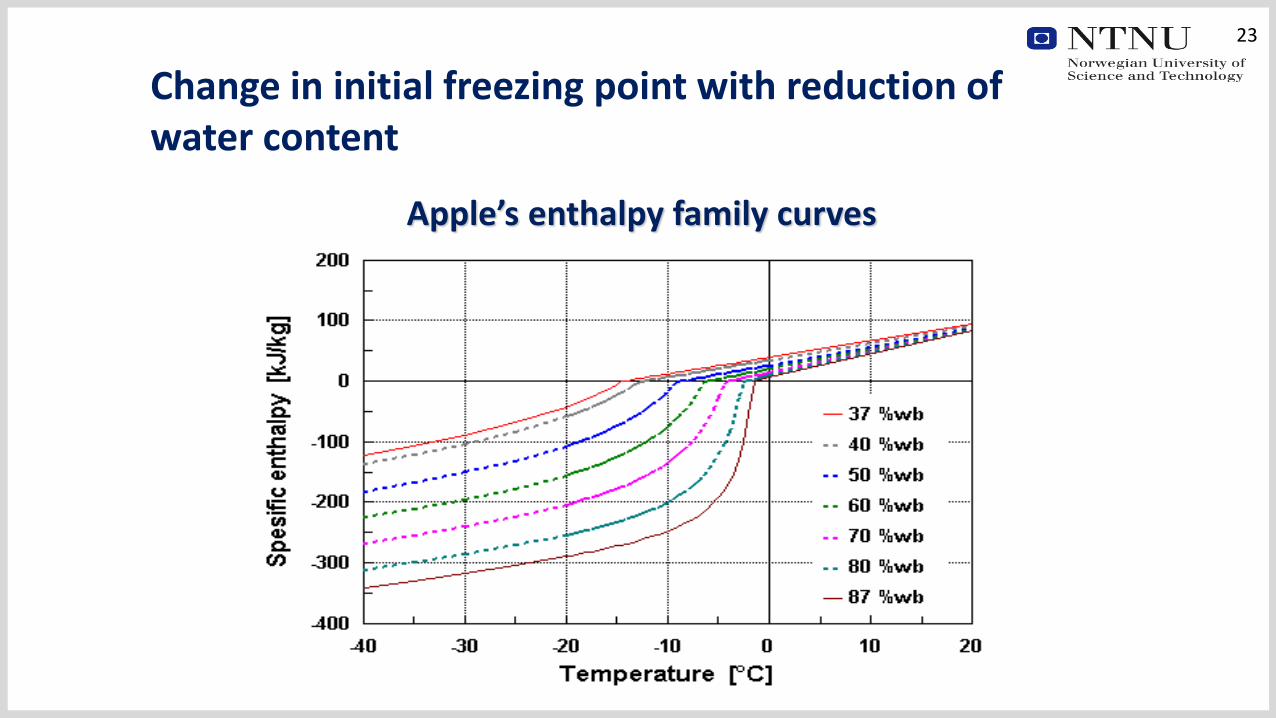
Change in initial freezing point with reduction of water content
Apple’s enthalpy family curves

24
Enthalpy as a function of temperature and
water content
Temperature, t (oC)
En
tha
lpy,
h (
kJ
/kg
)
Zone A
Zone B
Zone C
tif
Zone A:
Atmospheric drying – unfrozen
Zone B.
Atmospheric drying – partly frozen
Zone C:
Atmospheric drying - frozen

25
Design rules for heat pump dryers
Continuous operation
Countercurrent operation (air – product)
Inlet air temperature to the drying chamber as high as possible
Avoid over dimensioning the refrigeration capacity
Provide for the air flows over product without possibility to by-pass
Optimal SMER

26
Design of heat pump dryersLengthwise countercurrent drying
φ = crosswise
φ = lengthwise
φ = 100%
SMER = (kg H2O/kWh)COP
dh/dx
lengtwise crosswise
dh dh
dx dx

27
Design of heat pump dryersAs high inlet temperature as possible
tlow
thigh
φ = 100%
SMER = (kg H2O/kWh)COP
dh/dx
high low
dh dh
dx dx

28
Design of heat pump dryersHeat pump capacity: Qo
Qohigh Qolow φ = 100%
SMER = (kg H2O/kWh)COP
dh/dx
low highQo Qo
dh dh
dx dx

29
Design of heat pump dryersThe choice of to, tc
to,high
φ = 100%
SMER = (kg H2O/kWh)COP
dh/dx
low highto to
dh dh
dx dx
to,low
Influence of COP = Qo / W

30
Mollier diagram
Absolute humidity, x [kg/kg dry air]
Te
mp
era
ture
, t
[oC
]
d
c
b
a
dhopt
dhmax
dx
dhmin
φ = 1
ts

31
Equations
Evaporator capacity
Qo = ma * (hb - hc) [kW]
Compressor power
Wcompr = (Qo / dhre) * (dhis/ηis) [kW]
Coefficient Of Performance
COP = Qo / (Wcompr + Wfan) [-]
Specific Moisture Extraction Rate
SMER = COP / (dh/dx) [kg water/kWh]

32
SMER (40/60%, R717)
0
1
2
3
4
5
6
10 11 12 13 14 15 16 17 18 19 20Temperature difference, tb - td [oC]
SM
ER
ta = -5 oCta = 10 oCta = 25 oC
ta = 45 oCta = 75 oCOpt.SMER

33
Optimal temperature difference (R717)
8
10
12
14
16
18
20
-10 0 10 20 30 40 50 60 70 80
Air inlet temperature drying chamber, ta [oC]
Op
tim
al te
mp
.dif
f., tb
- t
d [
oC
]
30/50 %
40/60 %
50/70 %

34
Optimal SMER (R717)
0
1
2
3
4
5
6
7
-10 0 10 20 30 40 50 60 70 80
Air inlet temperature drying chamber, ta [oC]
Op
tim
al S
ME
R [
kg
/kW
h]
30/50 %
40/60 %
50/70 %

Introduction
Open system
35
Content
Closed loop system
Vacuum freeze drying
Atmospheric freeze drying
Conclusions

36
Phase diagram for water
Sublim
ation
Evapora
tion
Temperature, t (oC)
-30 -20 -10 0 +10
3
0
4
2
1
Pre
ssure
, p (
mm
Hg)
5
6
7
8
Vapour phase
Solid phase
Liquid
phase

37
Freeze drying, solid structure
• Vacuum freeze drying are carried out by
first freeze the product to achieve a solid
structure and than dry at pressure lower
than the triple point. The drying will occur
by sublimation – ice crystals evaporates
directly without melting
• Only water vapor will be transported in
the product and cause no internal
transport of dissolved components like
sugar, salt etc.
• Conventional convective drying at air
temperatures above 0oC will a larger part
of the water removal be done by
evaporation from the surface of the
product. Liquid will be transported from
internal out to the outer layers of the
product. This will cause a internal transport
of dissolved components.

38
Benefits with vacuum freeze drying
Tastes as fresh
• Will retain taste and nutrition's. Only water will be removed. (some light volatiles will be lost)
Look fresh
• Will retain shape and color
Lower weight than fresh product
• Freeze drying will normally remove up to 98% of the water. That means the weight of the product will be reduced with 90%
Can be stored like fresh
• Can be stored at room temperatures

39
Retention of morphologic, biochemical and immunological properties
High viability / activity of biological components
Lower temperatures, oxygen level and operational conditions than other comparable methods
High recovery of volatile components
Retention of structure, surface area
High yield
Long shelf life
Reduced weight at storage, transport and handling
Drawbacks
Higher investment costs
Higher energy consumption
Higher maintenance costs
Benefits and drawbacks compared with traditionally conservation methods
40
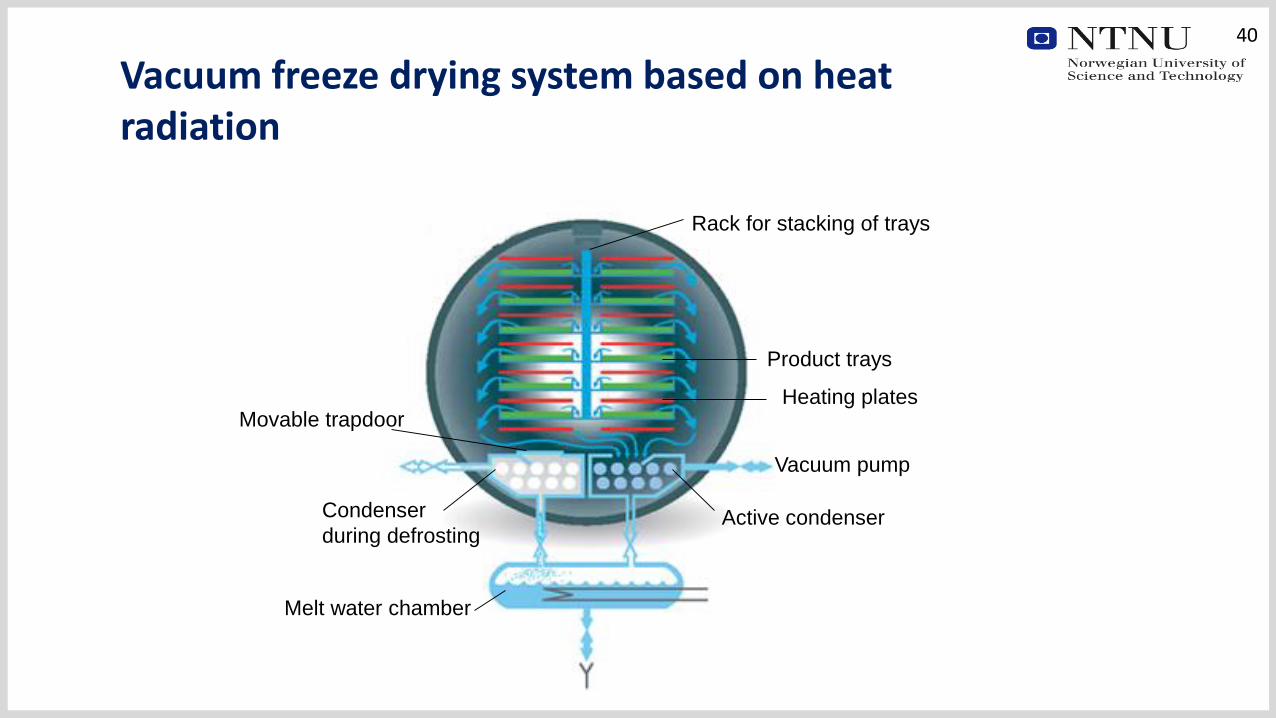
Vacuum freeze drying system based on heat radiation
Movable trapdoor
Condenser
during defrosting
Melt water chamber
Vacuum pump
Active condenser
Heating plates
Product trays
Rack for stacking of trays

Introduction
Open system
41
Content
Closed loop system
Vacuum freeze drying
Atmospheric freeze drying
Conclusions

Advantages with Atmospheric Freeze Drying
42
• Constant or step vice temperature program
• -15oC to +30oC
• Product quality control of
• Shrinkage
• Rehydration ability
• Color
• Taste
• Aroma
• Close to vacuum freeze drying qualities
• Peas (Industrialized)
• Corn (Industrialized)
• Vegetables, fruits, berries, herbs (Tested)
• Biological active components (Tested)

43
Actual products
Fish/meat (snacks, fast food etc.)Rehydration, colour, taste, aroma
Peas, corn (bag food, quick preparation)Rehydration, formation of cracks, colour, taste
Herbs (ethereal oils, spice)Extraction level, taste, aroma, appearance, biological
effect
Berry, fruits (breakfast cereals ingredients, ”topping”)Rehydration, colour, taste, aroma
Dairy (bioactive products, aroma products)Biological activity, rancidity, taste
44
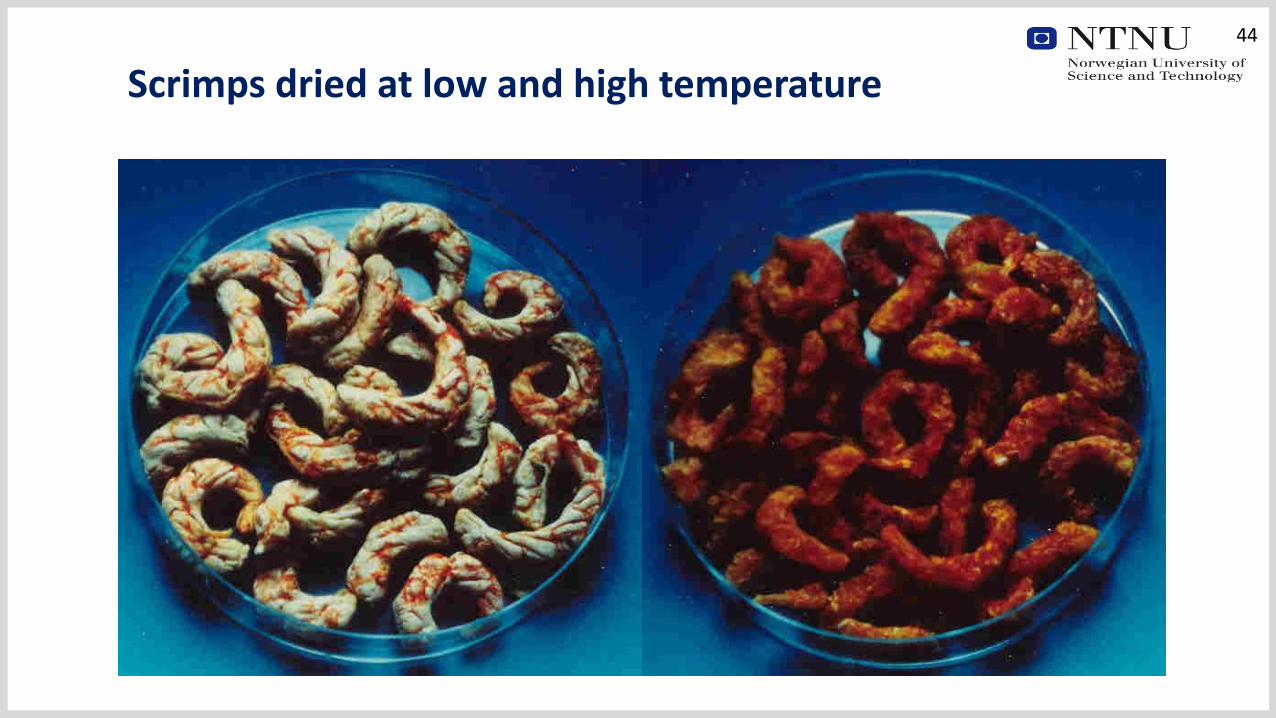
Scrimps dried at low and high temperature

Pieces of Cod dried at –5oC and +30oC45

Drying curves - temperature programPieces of Cod (5*5*5 mm)
46
0
10
20
30
40
50
60
70
80
90
0 1 2 3 4 5 6 7 8 9 10 11 12 13
Drying time (hour)
Wat
er c
on
ten
t (%
)
Dried at -5 oC in 1 hour
Dried at -5 oC in 3 hour
Dried at -5 oC in 5 hour
Dried at -5 oC in 10 hour

Bulk density of cod after drying47
0
0,1
0,2
0,3
0,4
-20 -10 0 10 20 30 40
Temperature in drying chamber [oC]
Bulk d
ens
ity [g/m
l]
0
0,1
0,2
0,3
0,4
0 5 10 15Drying time at -5 oC [hours]
Bulk d
ens
ity [g/m
l]

Energy consumption in a heat pump dryer operated at a continued mode drying
48
COPLT
(dh/dx)LT
tLTSMER =
ttot(( )) +*
COPHT
(dh/dx)HT
tHT
ttot(( )) *
Assumptions:LT HT
Air inlet drying temperature -5C 30C
Air inlet relative humidity 40 % 40 %
Air outlet relative humidity 80 % 80 %
Surface temperature of air cooler tdp – 5C tdp – 5C
Heat pump evaporating temperature air cooler surface temperature –
2C
air cooler surface temperature –2C
Heat pump condensing temperature air inlet drying temperature
+5C
air inlet drying temperature + 5C
Heat pump refrigerant NH3 NH3

Energy consumption in a heat pump dryer 0perated at a continued mode drying
49
0
1
2
3
4
5
6
7
8
0 2 4 6 8 10 12
Drying time at -5 oC air inlet temperature, [hours]
En
erg
y c
on
su
mp
tio
n [
kW
h/k
g d
rie
d
pro
du
ct]

SMER for a heat pump dryer operated at a continued mode drying
50
0
1
2
3
4
5
0 2 4 6 8 10 12
Drying time at -5 oC air inlet temperature, [hours]
SM
ER
, [k
g w
ate
r/kW
h]

51
Production line for instant products
Product
Pure/jamCold expansion
equipment
Freezing
from cold
expansion
Heat Pump
Drying
-35oC
CO2
52
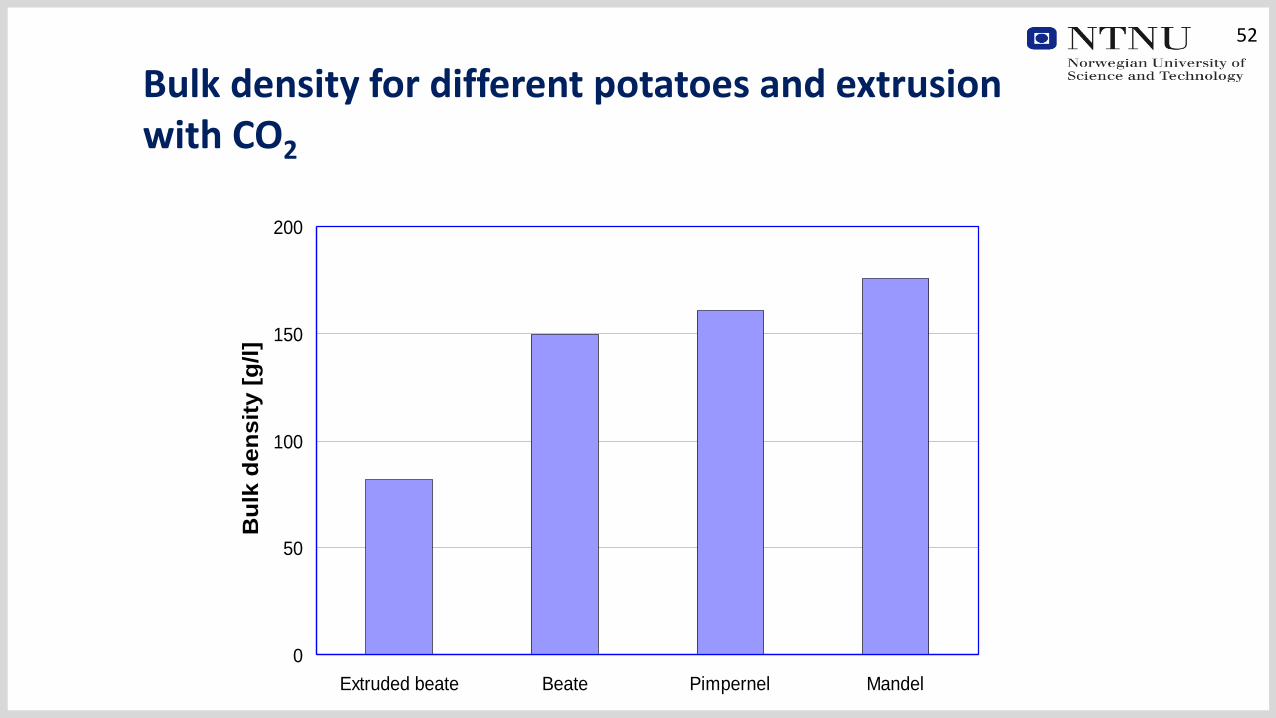
Bulk density for different potatoes and extrusion with CO2
0
50
100
150
200
Extruded beate Beate Pimpernel Mandel
Bu
lk d
en
sit
y [
g/l]

53
Standard rehydration (30 sec) for different potatoes and CO2 extrusion
0
5
10
15
Extruded beate Beate Pimpernel Mandel
RE
HY
DR
AT
ION
IN
DE
X

54
Rehydration in cold water of dried products (after 2 minutes)
0
50
100
150
200
250
300
350
400
450
Cod Meat Apples Carrot
Reh
yd
rati
on
[%
]Dried at -5 oC only
Dried at +30 oC only
Ra = (M water / M dry matter) * 100
Introduction
Open system
55
Content
Closed loop system
Vacuum freeze drying
Atmospheric freeze drying
Conclusions
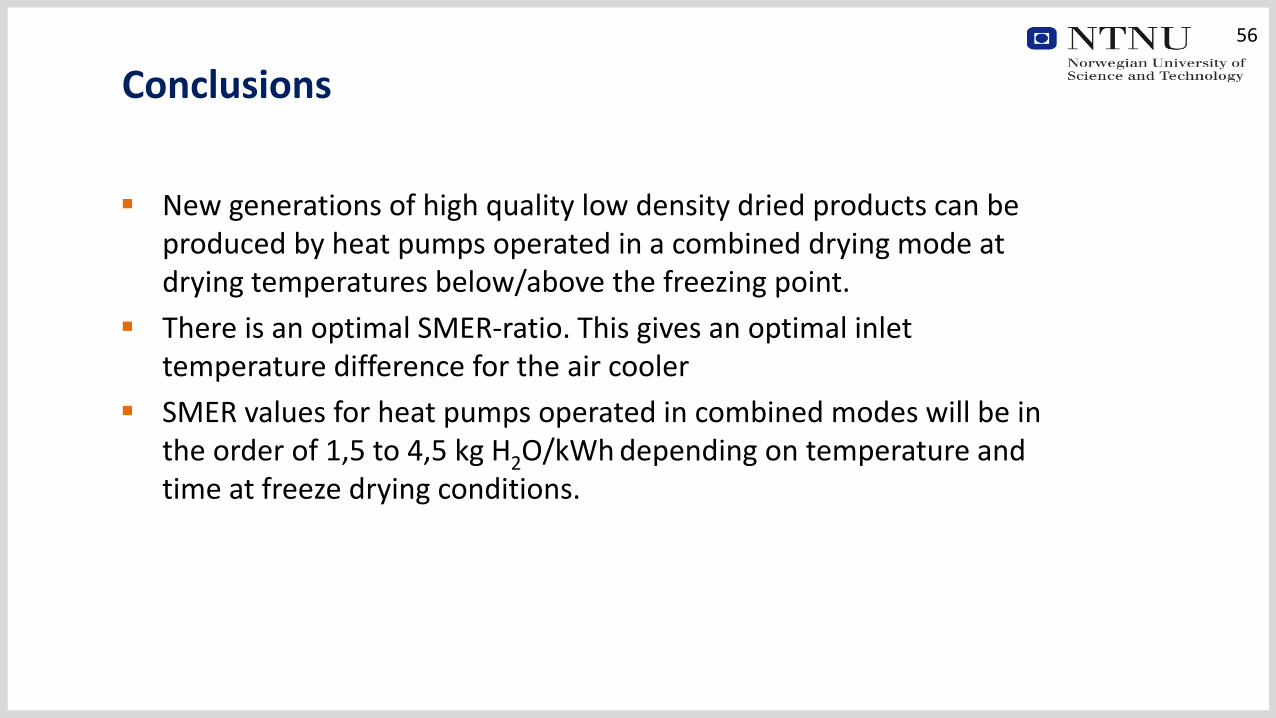
Conclusions
56
New generations of high quality low density dried products can be produced by heat pumps operated in a combined drying mode at drying temperatures below/above the freezing point.
There is an optimal SMER-ratio. This gives an optimal inlet temperature difference for the air cooler
SMER values for heat pumps operated in combined modes will be in the order of 1,5 to 4,5 kg H2O/kWh depending on temperature and time at freeze drying conditions.

Thank you for your attention!
Спасибо завнимание!