Hearing loss in adults: assessment and management · Hearing loss in adults: assessment and...
277
National Institute for Health and Care Excellence Draft Hearing loss Hearing loss in adults: assessment and management NICE guideline Methods, evidence and recommendations November 2017 Draft for consultation Developed by the National Guideline Centre, hosted by the Royal College of Physicians
Transcript of Hearing loss in adults: assessment and management · Hearing loss in adults: assessment and...

National Institute for Health and Care Excellence
Draft
Hearing loss Hearing loss in adults: assessment and management
NICE guideline
Methods, evidence and recommendations
November 2017
Draft for consultation
Developed by the National Guideline Centre, hosted by the Royal College of Physicians

Hearing loss Contents
© NICE 2017. All rights reserved. Subject to Notice of rights.
Hearing loss
Disclaimer
The recommendations in this guideline represent the view of NICE, arrived at after careful consideration of the evidence available. When exercising their judgement, professionals are expected to take this guideline fully into account, alongside the individual needs, preferences and values of their patients or service users. The recommendations in this guideline are not mandatory and the guideline does not override the responsibility of healthcare professionals to make decisions appropriate to the circumstances of the individual patient, in consultation with the patient and, where appropriate, their carer or guardian.
Local commissioners and providers have a responsibility to enable the guideline to be applied when individual health professionals and their patients or service users wish to use it. They should do so in the context of local and national priorities for funding and developing services, and in light of their duties to have due regard to the need to eliminate unlawful discrimination, to advance equality of opportunity and to reduce health inequalities. Nothing in this guideline should be interpreted in a way that would be inconsistent with compliance with those duties.
NICE guidelines cover health and care in England. Decisions on how they apply in other UK countries are made by ministers in the Welsh Government, Scottish Government, and Northern Ireland Executive. All NICE guidance is subject to regular review and may be updated or withdrawn.
Copyright © NICE 2017. All rights reserved. Subject to Notice of rights.

Hearing loss Contents
© NICE 2017. All rights reserved. Subject to Notice of rights. 4
Contents Guideline committee members ...................................................................................................... 9
NGC technical team members ......................................................................................................... 9
Co-optees ........................................................................................................................................ 9
Acknowledgements .................................................................................................................... 11
1 Guideline summary .............................................................................................................. 12
Full list of recommendations .............................................................................................. 12 1.1
2 Introduction ........................................................................................................................ 18
3 Development of the guideline .............................................................................................. 20
What is a NICE guideline? ................................................................................................... 20 3.1
Remit ................................................................................................................................... 20 3.2
Who developed this guideline? .......................................................................................... 21 3.3
3.3.1 What this guideline covers ..................................................................................... 21
3.3.2 What this guideline does not cover ....................................................................... 21
3.3.3 Relationships between the guideline and other NICE guidance ............................ 22
4 Methods .............................................................................................................................. 23
Developing the review questions and outcomes ................................................................ 23 4.1
Searching for evidence ........................................................................................................ 32 4.2
4.2.1 Clinical literature search ......................................................................................... 32
4.2.2 Health economic literature search ......................................................................... 32
Identifying and analysing evidence of effectiveness .......................................................... 33 4.3
4.3.1 Inclusion and exclusion criteria .............................................................................. 33
4.3.2 Type of studies ....................................................................................................... 34
4.3.3 Methods of combining clinical studies ................................................................... 34
4.3.4 Appraising the quality of evidence by outcomes ................................................... 37
4.3.5 Assessing clinical importance ................................................................................. 47
4.3.6 Clinical evidence statements .................................................................................. 48
Identifying and analysing evidence of cost effectiveness ................................................... 48 4.4
4.4.1 Literature review .................................................................................................... 48
4.4.2 Undertaking new health economic analysis .......................................................... 50
4.4.3 Cost-effectiveness criteria ...................................................................................... 51
4.4.4 In the absence of health economic evidence ......................................................... 51
Developing recommendations ............................................................................................ 51 4.5
4.5.1 Research recommendations .................................................................................. 52
4.5.2 Validation process .................................................................................................. 52
4.5.3 Updating the guideline ........................................................................................... 53
4.5.4 Disclaimer ............................................................................................................... 53

Hearing loss Contents
© NICE 2017. All rights reserved. Subject to Notice of rights. 5
4.5.5 Funding ................................................................................................................... 53
5 Urgent and routine referral .................................................................................................. 54
Introduction ........................................................................................................................ 54 5.1
Review question: What are the signs and symptoms that allow early recognition of 5.2hearing loss needing immediate or urgent referral to a secondary care specialist? .......... 54
5.2.1 Clinical evidence ..................................................................................................... 55
5.2.2 Economic evidence ................................................................................................. 55
5.2.3 Evidence statements .............................................................................................. 55
5.2.4 Recommendations and link to evidence ................................................................ 55
Review question: Who should be routinely referred to audiovestibular medicine or 5.3ear, nose and throat (ENT) surgery for medical assessment? ............................................ 59
5.3.1 Clinical evidence ..................................................................................................... 59
5.3.2 Economic evidence ................................................................................................. 59
5.3.3 Evidence statements .............................................................................................. 60
5.3.4 Recommendations and link to evidence ................................................................ 60
6 MRI ..................................................................................................................................... 64
Introduction ........................................................................................................................ 64 6.1
Review question: In people who have been referred to secondary care with 6.2sensorineural hearing loss, who needs MRI to assess the underlying cause of hearing loss? ..................................................................................................................................... 64
6.2.1 Clinical evidence ..................................................................................................... 65
6.2.2 Economic evidence ................................................................................................. 74
6.2.3 Evidence statements .............................................................................................. 74
6.2.4 Recommendations and link to evidence ................................................................ 75
7 Subgroups ........................................................................................................................... 78
Introduction ........................................................................................................................ 78 7.1
Review question: Which groups of people are more likely than the general population 7.2to miss having hearing loss identified? ............................................................................... 78
7.2.1 Clinical evidence ..................................................................................................... 79
7.2.2 Economic evidence ................................................................................................. 79
7.2.3 Evidence statements .............................................................................................. 79
7.2.4 Recommendations and link to evidence ................................................................ 79
8 Early versus delayed management of hearing loss ................................................................ 82
Introduction ........................................................................................................................ 82 8.1
Review question: What is the clinical and cost effectiveness of early versus delayed 8.2management of hearing loss on patient outcomes? .......................................................... 82
8.2.1 Clinical evidence ..................................................................................................... 82
8.2.2 Economic evidence ................................................................................................. 90
8.2.3 Evidence statements .............................................................................................. 92
8.2.4 Recommendations and link to evidence ................................................................ 92

Hearing loss Contents
© NICE 2017. All rights reserved. Subject to Notice of rights. 6
9 Communication needs ......................................................................................................... 95
Introduction ........................................................................................................................ 95 9.1
Review question: What is the clinical and cost effectiveness of communication needs 9.2assessment in adults with hearing loss? ............................................................................. 95
9.2.1 Clinical evidence ..................................................................................................... 96
9.2.2 Economic evidence ................................................................................................. 96
9.2.3 Evidence statements .............................................................................................. 96
9.2.4 Recommendations and link to evidence ................................................................ 96
10 Management of earwax ....................................................................................................... 99
Introduction ........................................................................................................................ 99 10.1
Review question: What is the most clinically and cost-effective method of removing 10.2earwax? ............................................................................................................................... 99
10.2.1 Clinical evidence ................................................................................................... 100
10.2.2 Economic evidence ............................................................................................... 120
10.2.3 Evidence statements ............................................................................................ 122
10.2.4 Recommendations and link to evidence .............................................................. 124
Review question: What is the most clinically and cost-effective setting for the 10.3identification and treatment of earwax? .......................................................................... 128
10.3.1 Clinical evidence ................................................................................................... 129
10.3.2 Economic evidence ............................................................................................... 129
10.3.3 Evidence statements ............................................................................................ 130
10.3.4 Recommendations and link to evidence .............................................................. 130
11 Sudden sensorineural hearing loss (SSNHL)......................................................................... 132
Introduction ...................................................................................................................... 132 11.1
Review question: What is the most clinically and cost-effective treatment for 11.2idiopathic sudden sensorineural hearing loss (SSNHL)? ................................................... 132
11.2.1 Clinical evidence ................................................................................................... 133
11.2.2 Economic evidence ............................................................................................... 146
11.2.3 Evidence statements ............................................................................................ 146
11.2.4 Recommendations and link to evidence .............................................................. 147
Review question: What is the clinical and cost effectiveness of different routes of 11.3administration of steroids (for example oral or intratympanic) in the treatment of sudden sensorineural hearing loss (SSNHL)? .................................................................... 149
11.3.1 Clinical evidence ................................................................................................... 150
11.3.2 Economic evidence ............................................................................................... 166
11.3.3 Evidence statements ............................................................................................ 166
11.3.4 Recommendations and link to evidence .............................................................. 167
12 Information and advice ...................................................................................................... 170
Introduction ...................................................................................................................... 170 12.1
Review question: What are the information, support and advice needs of people with 12.2

Hearing loss Contents
© NICE 2017. All rights reserved. Subject to Notice of rights. 7
hearing difficulty and their families and carers? .............................................................. 170
12.2.1 Qualitative evidence............................................................................................. 171
12.2.2 Economic evidence ............................................................................................... 181
12.2.3 Evidence statements ............................................................................................ 181
12.2.4 Recommendations and link to evidence .............................................................. 181
13 Decision tools .................................................................................................................... 185
Introduction ...................................................................................................................... 185 13.1
Review question: What is the clinical and cost effectiveness of using patient-centred 13.2tools to help patients with hearing loss decide between different management strategies? ......................................................................................................................... 185
13.2.1 Clinical evidence ................................................................................................... 186
13.2.2 Economic evidence ............................................................................................... 186
13.2.3 Evidence statements ............................................................................................ 186
13.2.4 Recommendations and link to evidence .............................................................. 187
14 Assistive listening devices .................................................................................................. 188
Introduction ...................................................................................................................... 188 14.1
Review question: What is the clinical and cost effectiveness of assistive listening 14.2devices (such as loops) to support communication? ........................................................ 188
14.2.1 Clinical evidence ................................................................................................... 189
14.2.2 Economic evidence ............................................................................................... 192
14.2.3 Evidence statements ............................................................................................ 192
14.2.4 Recommendations and link to evidence .............................................................. 192
15 Hearing aids....................................................................................................................... 195
Introduction ...................................................................................................................... 195 15.1
Review question: What is the clinical and cost effectiveness of hearing aids for mild 15.2to moderate hearing loss in adults who have been prescribed at least 1 hearing aid? ... 195
15.2.1 Clinical evidence ................................................................................................... 196
15.2.2 Economic evidence ............................................................................................... 199
15.2.3 Evidence statements ............................................................................................ 201
15.2.4 Recommendations and link to evidence .............................................................. 202
Review question: What is the clinical and cost effectiveness of fitting 1 hearing aid 15.3compared with fitting 2 hearing aids for people when both ears have an aidable hearing loss? ..................................................................................................................... 205
15.3.1 Clinical evidence ................................................................................................... 207
15.3.2 Economic evidence ............................................................................................... 211
15.3.3 Evidence statements ............................................................................................ 212
15.3.4 Recommendations and link to evidence .............................................................. 212
16 Hearing aid microphones and noise reduction algorithms ................................................... 216
Introduction ...................................................................................................................... 216 16.1
Review question: What is the clinical and cost effectiveness of directional versus 16.2

Hearing loss Contents
© NICE 2017. All rights reserved. Subject to Notice of rights. 8
omnidirectional microphones? ......................................................................................... 216
16.2.1 Clinical evidence ................................................................................................... 217
16.2.2 Economic evidence ............................................................................................... 220
16.2.3 Evidence statements ............................................................................................ 220
16.2.4 Recommendations and link to evidence .............................................................. 220
Review question: What is the clinical and cost effectiveness of noise reduction 16.3algorithms? ....................................................................................................................... 222
16.3.1 Clinical evidence ................................................................................................... 223
16.3.2 Economic evidence ............................................................................................... 223
16.3.3 Evidence statements ............................................................................................ 223
16.3.4 Recommendations and link to evidence .............................................................. 223
17 Monitoring and follow-up .................................................................................................. 225
Introduction ...................................................................................................................... 225 17.1
Review question 1: What is the most clinically and cost-effective method of delivery 17.2of monitoring and follow-up of people with hearing-related communication needs (including those with hearing aids)? ................................................................................. 225
Review question 2: When should people with hearing-related communication needs 17.3(including those with hearing aids) be monitored and followed up? ............................... 226
17.3.1 Clinical evidence ................................................................................................... 227
17.3.2 Economic evidence ............................................................................................... 227
17.3.3 Evidence statements ............................................................................................ 228
17.3.4 Recommendations and link to evidence .............................................................. 228
18 Interventions to support the use of hearing aids ................................................................. 231
Introduction ...................................................................................................................... 231 18.1
Review question: What is the clinical and cost effectiveness of interventions to 18.2support continuing use of hearing aids? ........................................................................... 231
18.2.1 Clinical evidence ................................................................................................... 232
18.2.2 Economic evidence ............................................................................................... 249
18.2.3 Evidence statements ............................................................................................ 251
18.2.4 Recommendations and link to evidence .............................................................. 252
19 Reference list ..................................................................................................................... 257
20 Acronyms and abbreviations .............................................................................................. 265
21 Glossary ............................................................................................................................ 267
Guideline-specific terms ................................................................................................... 267 21.1
General terms ................................................................................................................... 268 21.2
Hearing loss Acknowledgements
© NICE 2017. All rights reserved. Subject to Notice of rights. 9
Guideline committee members 1
Name Role
Graham Easton GP, London
Melanie Ferguson Consultant Clinical Scientist (Audiology), Nottingham University Hospitals NHS Trust
Julia Garlick Lay member
Katherine Harrop-Griffiths (Chair)
Currently retired, formerly Consultant Paediatric Audiovestibular Physician, Royal National Throat Nose and Ear Hospital/ UCLH NHS Foundation Trust
Richard Irving Consultant ENT Surgeon, University Hospital Birmingham NHS Trust
Ted Leverton Retired GP
Kevin Munro Professor of Audiology, University of Manchester
Rudrapathy Palaniappan Consultant Physician in Audiovestibular Medicine, Royal National Throat Nose and Ear Hospital/ UCLH NHS Foundation Trust
Linda Parton Lay member
Neil Pendleton Professor of Medical Gerontology and Honorary Consultant in Geriatric Medicine, University of Manchester and Salford Royal NHS Foundation Trust
Jane Wild Consultant Clinical Scientist (Audiology), Betsi Cadwaladr University Health Board
NGC technical team members 2
Name Role
Joanna Ashe Senior Information Specialist (to November 2016)
Katie Broomfield Document Editor/Process Assistant
Katrina Davis Research Fellow (until June 2016)
Lefteris Floros Health Economist (to November 2016)
Saoussen Ftouh Senior Research Fellow
Lina Gulhane Head of Information Specialists (from November 2016)
Martin Harker Health Economics Lead
Rishi Mandavia NICE Scholar and NIHR Clinical Fellow
Natalie Pink Project Manager (to November 2016)
Silvia Rabar Senior Research Fellow (from February 2017)
Gill Ritchie Associate Director
Joseph Runicles Information Specialist (from September 2017)
Eleanor Samarasekera Senior Research Fellow (from October 2016 to July 2017)
Giulia Zuodar Project Manager (from January 2017)
Co-optees 3
Name Role
Michael Akeroyd Unit Director, MRC Institute of Hearing Research
& Professor of Hearing Sciences, University of Nottingham, MRC Institute of Hearing Research, University of Nottingham
Caroline Carr Social Worker, Managing Director, Sensing Change ,Ipswich, Suffolk
Chris Armitage Professor of Health Psychology, University of Manchester

Hearing loss Acknowledgements
© NICE 2017. All rights reserved. Subject to Notice of rights. 10
Name Role
Steve Connor Consultant in Neuroradiology, King's College Hospital NHS Trust
Helen Gallacher Registered Nurse, Royal National Throat Nose and Ear Hospital/ UCLH NHS Foundation Trust
Padraig Kitterick Associate Professor, NIHR Nottingham Biomedical Research Centre, School of Medicine, University of Nottingham
1 2

Hearing loss Acknowledgements
© NICE 2017. All rights reserved. Subject to Notice of rights. 11
Acknowledgements 1
The development of this guideline was greatly assisted by the following people: 2
Jenny Bellorini, Managing Editor, Cochrane ENT 3
George Browning, Emeritus Professor of Otolaryngology, University of Glasgow; Cochrane ENT 4
Martin Burton, Joint Co-ordinating Editor, Cochrane ENT 5
Sophie Carlisle, Research Fellow, NGC 6
Lee Yee Chong, Consultant Systematic Reviewer/Methodologist, Cochrane ENT 7
Emma Pottinger, Research Fellow, NGC 8
Jill Cobb, Information Specialist, NGC 9
Tamara Diaz, Project Manager, NGC 10
11

Hearing loss Guideline summary
© NICE 2017. All rights reserved. Subject to Notice of rights. 12
1 Guideline summary 1
Full list of recommendations 1.12
Urgent and routine referral 3
4 1. Refer adults with sudden or rapid onset of hearing loss that is not explained 5
by external or middle ear causes as follows. 6
If the hearing loss developed suddenly (over a period of 3 days or less) 7 within the past 30 days, refer immediately to an ear, nose and throat 8 service or an emergency department. 9
If the hearing loss developed suddenly more than 30 days ago, refer 10 urgently to an ear, nose and throat or audiovestibular medicine 11 service. 12
If the hearing loss developed rapidly (over a period of 4 to 90 days) refer 13 urgently to an ear, nose and throat or audiovestibular medicine 14 service. 15
2. Refer immediately adults with acquired unilateral hearing loss and altered 16 sensation or facial droop on the same side to an ear, nose and throat service 17 or, if stroke is suspected, follow a local stroke referral pathway. 18
3. Refer immediately adults with hearing loss who are immunocompromised 19 and have otalgia (ear ache) with otorrhoea (discharge from the ear) that has 20 not responded to treatment within 72 hours to an ear, nose and throat 21 service. 22
4. Consider a suspected cancer pathway referral to an ear, nose and throat 23 service for adults of southeast Asian family origin with hearing loss and a 24 unilateral middle ear effusion not associated with an upper respiratory tract 25 infection. 26
5. Consider referring people aged over 40 with unilateral hearing loss and 27 otalgia that has lasted for more than 3 weeks to an ear, nose and throat 28 service. 29
6. Refer adults with hearing loss that is not explained by external or middle ear 30 causes to an ear, nose and throat or audiovestibular medicine service, or an 31 audiology service using a local complex audiology pathway, if they have any 32 of: 33
hearing loss that is asymmetric 34
hearing loss that fluctuates and is not associated with an upper 35 respiratory tract infection 36
hyperacusis (intolerance to everyday sounds) 37
unilateral tinnitus that is persistent, or pulsatile, or has significantly 38 changed in nature 39
vertigo that has not fully resolved or is recurrent. 40
7. Refer adults with hearing loss to an ear, nose and throat service if, after 41 initial treatment of any earwax or acute infection, they have any of: 42

Hearing loss Guideline summary
© NICE 2017. All rights reserved. Subject to Notice of rights. 13
partial or complete obstruction of the external auditory canal that 1 prevents full examination of the eardrum or taking an aural 2 impression 3
pain affecting either ear (including in and around the ear) that has lasted 4 for 1 week or more and has not responded to first-line treatment 5
a history of discharge (other than wax) from either ear that has not 6 resolved, has not responded to prescribed treatment or is recurrent 7
abnormal appearance of the outer ear or the eardrum, such as: 8
i. inflammation 9
ii. polyp formation 10
iii. perforated eardrum 11
iv. abnormal bony or skin growths 12
v. swelling of the outer ear 13
vi. blood in the ear canal. 14
MRI 15
16 8. Offer MRI of the internal auditory meati to adults with hearing loss and 17
localising symptoms or signs (such as facial nerve weakness) that might 18 indicate a vestibular schwannoma or CPA (cerebellopontine angle) lesion, 19 irrespective of pure tone thresholds. 20
9. Consider MRI of the internal auditory meati for adults with sensorineural 21 hearing loss and no localising signs if there is an asymmetry of 20 dB or more 22 at any single frequency between 0.5 kHz and 4.0 kHz on pure tone 23 audiometry. 24
Subgroups 25
26 10. Consider referring adults with diagnosed or suspected dementia or mild 27
cognitive impairment to an audiology service for a hearing assessment, 28 because hearing loss is a comorbid condition. 29
11. Consider referring adults with diagnosed dementia or mild cognitive 30 impairment, without hearing loss, to an audiology service for a hearing 31 assessment every 2 years. 32
12. Consider referring people with a diagnosed learning (intellectual) disability to 33 an audiology service for a hearing assessment when they transfer from child 34 to adult services, and then every 2 years. 35
Early versus delayed management of hearing loss 36
37 13. Refer all adults, regardless of their age, who present for the first time with 38
hearing difficulties, or in whom you suspect hearing difficulties, to audiology 39 services for an assessment, unless they have: 40
sudden or rapid onset of hearing loss (see recommendation 1) 41
hearing loss with specific additional symptoms or signs (see 42 recommendations 2 to 7). 43

Hearing loss Guideline summary
© NICE 2017. All rights reserved. Subject to Notice of rights. 14
Communication needs 1
2 14. Include and record the following as part of the audiological assessment for 3
adults: 4
a full history including relevant symptoms, comorbidities, cognitive 5 ability, physical mobility and dexterity 6
the person’s hearing and communication needs at home, at work or in 7 education, and in social situations 8
any psychosocial difficulties related to hearing 9
the person’s expectations and motivations with respect to their hearing 10 loss and the listening and communication strategies available to 11 them 12
any restrictions on activity, assessed using a validated self-report 13 instrument such as the Glasgow Hearing Aid Benefit Profile or the 14 Client-Orientated Scale of Improvement 15
otoscopy 16
pure tone audiometry 17
tympanometry. 18
15. After the audiological assessment: 19
discuss with the person: 20
i. the pure tone audiogram and the impact their hearing loss might have 21 on communication 22
ii. hearing deficits (such as speech in noise) that are not obvious from the 23 audiogram 24
iii. the options for managing their hearing needs, such as hearing aids, 25 assistive listening devices and communication strategies, and the 26 potential benefits and limitations of each option. 27
agree and record a personalised management plan, taking into account 28 the person’s preferences, including goals, and give the person a copy. 29
Management of earwax 30
31 16. Offer to remove earwax in primary or community care for adults if it is 32
contributing to hearing loss or other symptoms, or prevents examination of 33 the ear. 34
17. Consider ear irrigation using an electronic irrigator to remove earwax in 35 adults, provided there are no contraindications such as eardrum perforation, 36 ear infection or ear surgery. 37
18. When carrying out ear irrigation in adults: 38
use pre-treatment wax softeners, either immediately before ear 39 irrigation or for up to 5 days beforehand 40
if irrigation is unsuccessful: 41
i. repeat use of wax softeners or 42

Hearing loss Guideline summary
© NICE 2017. All rights reserved. Subject to Notice of rights. 15
ii. instil water into the ear canal 15 minutes before repeating ear irrigation 1 with an electronic irrigator 2
If irrigation is unsuccessful after the second attempt, refer the person to 3 a specialist ear care service or an ear, nose and throat service for 4 removal of earwax. 5
19. Consider microsuction or other methods of earwax removal (such as manual 6 removal using a probe) for adults in primary or community care only if: 7
the practitioner (such as a community nurse or audiologist) has training 8 and expertise in using these methods to remove earwax and 9
the correct equipment is available. 10
20. Do not offer adults manual ear syringing to remove earwax. 11
21. Advise adults not to remove earwax or clean their ears by inserting small 12 objects, such as cotton buds, into the ear canal. Explain that this could 13 damage the ear canal and eardrum, and push the wax further down into the 14 ear. 15
Sudden sensorineural hearing loss (SSNHL) 16
17 22. Consider a steroid to treat idiopathic sudden sensorineural hearing loss in 18
adults. 19
20
Information and advice 21
22 23. Give the person and, if they wish, their family or carers, information about 23
the causes of hearing loss, how hearing loss affects communication and how 24 it can be managed. 25
24. Follow the principles on tailoring healthcare services for each person and 26 enabling people to actively participate in their care in the NICE guideline on 27 patient experience in adult NHS services by, for example: 28
taking measures, such as reducing background noise, to ensure that the 29 clinical and care environment is conducive to communication for 30 people with hearing loss, particularly in group settings such as 31 waiting rooms, clinics and care homes 32
establishing the most effective way of communicating with each person, 33 including the use of hearing loop systems and other assistive listening 34 devices 35
ensuring that staff are trained and have demonstrated competency in 36 communication skills for people with hearing loss 37
encouraging people with hearing loss to give feedback about the health 38 and social care services they receive, and responding to their 39 feedback. 40
When offering people audiology appointments follow recommendation 1.3.1 in 41 the NICE guideline on patient experience in adult NHS services. 42
43

Hearing loss Guideline summary
© NICE 2017. All rights reserved. Subject to Notice of rights. 16
Assistive listening devices 1
2 25. Give adults with hearing loss information about assistive listening devices 3
such as personal loops, personal communicators, TV amplifiers, telephone 4 devices, smoke alarms, doorbell sensors, and technologies such as streamers 5 and apps. 6
26. Tell adults with hearing loss about organisations that can demonstrate and 7 provide advice on how to obtain assistive listening devices, such as social 8 services, the fire service, or the government through its Access to Work or 9 Disabled Student Allowance programmes. 10
11
Hearing aids 12
13 27. Offer hearing aids to adults whose hearing loss affects their ability to 14
communicate. 15
28. Offer 2 hearing aids to adults with hearing loss in both ears. Explain that 16 wearing 2 hearing aids can improve sound quality, help to make speech 17 easier to understand when there is background noise, and make it easier to 18 tell where sounds are coming from. 19
29. For adults with hearing loss in both ears who chose a single hearing aid, 20 consider a second hearing aid at the follow-up appointment. 21
22
Hearing aid microphones and noise reduction algorithms 23
24 30. When offering hearing aids to adults, explain the features on the hearing aid 25
that can help the person to hear in background noise, such as directional 26 microphone and noise reduction settings. 27
31. Advise adults with hearing aids about choosing microphone and noise 28 reduction settings that will meet their needs in different environments, and 29 ensure that they know how to use them. 30
31
Monitoring and follow-up 32
33 32. Offer adults with hearing aids a face-to-face audiology appointment 6 to 12 34
weeks after the hearing aids are fitted. 35
33. For adults with hearing loss who have chosen a management strategy other 36 than hearing aids, such as assistive listening devices or communication 37 strategies, offer a follow-up appointment when the effectiveness of the 38 device or strategy can be evaluated. 39
34. Tell adults with hearing loss how to contact audiology services in the future if 40 they have chosen not to have a hearing aid or other device. 41
42

Hearing loss Guideline summary
© NICE 2017. All rights reserved. Subject to Notice of rights. 17
Interventions to support the use of hearing aids 1
2 35. Consider using motivational interviewing or engagement strategies when 3
discussing hearing aids with adults for the first time, to encourage 4 acceptance and use of hearing aids. 5
36. Demonstrate how to use hearing aids at the time they are first discussed. 6
37. At the follow-up audiology appointment for adults with hearing aids: 7
ask the person if they have any concerns or questions 8
address any difficulties with inserting, removing or maintaining their 9 hearing aids 10
provide information on communication, social care or rehabilitation 11 support services if needed 12
tell the person how to contact audiology services in the future 13
ensure that the person’s hearing aids and other devices meet their needs 14 by checking: 15
i. the comfort, sound quality and volume of hearing aids, including 16 microphone and noise reduction settings, and fine-tuning them if 17 needed 18
ii. hearing aid cleaning, battery life and use with a telephone 19
iii. use of assistive listening devices 20
iv. hours the hearing aid has been used, if shown by automatic data-logging 21
review the goals identified in the person’s care plan and agree how to 22 address any that have not been met 23
update the person’s care plan and give them a copy. 24
38. Give adults with hearing aids information about getting used to hearing aids, 25 cleaning and caring for their hearing aids, and troubleshooting. 26
27
Key research recommendations 28
29 1. In adults with hearing loss, does the use of hearing aids reduce the incidence 30
of dementia? 31
2. What is the prevalence of hearing loss among populations who under-32 present for possible hearing loss? 33
3. What is the clinical and cost effectiveness of microsuction compared with 34 irrigation to remove earwax? 35
4. What is the most effective first-line treatment for idiopathic sudden 36 sensorineural hearing loss? 37
5. What is the clinical and cost effectiveness of monitoring and follow-up of 38 adults with hearing loss post-intervention compared with usual care? 39
For the full list of research recommendations please see appendix Q. 40

Hearing loss Introduction
© NICE 2017. All rights reserved. Subject to Notice of rights. 18
2 Introduction 1
Impact 2
Hearing loss is a major public health issue affecting about 11 million people in the UK.29 Because the 3 population is ageing it is estimated that by 2035 there will be around 15.6 million people with 4 hearing loss in the UK – a fifth of the population. Hearing loss ranks second in terms of prevalence of 5 impairment and fifth for disease burden. 6
Hearing loss has a significant impact on the individual leading to difficulty with communication at 7 work, socially and at home. This can affect family relationships, employment or educational 8 opportunities, enjoyment of leisure pursuits such as music and family gatherings, and independence. 9 Hearing loss can cause feelings of isolation and low self-esteem and can lead to a significant 10 reduction in the individual’s quality of life. 11
Research shows that hearing loss doubles the risk of developing depression and increases the risk of 12 anxiety and other mental health issues.29;47;24 ,100Research also suggests that the use of hearing aids 13 reduces these risks.47 Although hearing loss affects all ages it is more prevalent in older people and 14 there is an association between hearing loss and cognitive performance as well as dementia: this 15 association is more marked with more severe hearing loss. 63 16
It is estimated that in 2013 the UK economy lost more than £28.4 billion in potential output because 17 of high unemployment rates among people with hearing loss. The cost may be higher if rates of 18 underemployment are also taken into account. These high rates of unemployment and 19 underemployment reflect the communication and participation difficulties experienced by people 20 with hearing loss. 21
The vast majority of permanent hearing loss is bilateral (in both ears) and slowly progressive, with 22 the most common complaint of adults with hearing loss being difficulty in hearing speech in noise. It 23 takes time for people to accept they have a difficulty and 1 study found that on average there is a 10 24 year delay in people aged 55 to 74 years seeking help for their hearing loss. 24 Around 45% of adults 25 who report hearing problems to their GP are not referred to NHS hearing services, with reports that 26 they are advised to wait until their symptoms are more severe.29 27
Pathways 28
The main referral pathway for an adult with hearing loss is direct from their GP to audiology services. 29 Primary management involves provision of hearing aids through the NHS by audiology services. For 30 those who do not meet these criteria and require medical input referral is direct to ENT or 31 audiovestibular medicine services. 32
Audiology services are provided in a number of NHS settings. In some parts of England this is through 33 the AQP (any qualified provider) scheme, which means that people have a choice of services ranging 34 from traditional hospital or clinic-based audiology services, to independent high street providers. 35 Basic assessment for hearing loss includes, as a minimum, a history, examination of the ears, pure 36 tone audiometry and tympanometry. In addition, it is important to establish if the individual 37 recognises a hearing problem and if they are ready and willing to seek help. 38
The findings on pure tone audiometry are often summarised using descriptors such as mild, 39 moderate, severe or profound; however, this classification should not be used as the sole 40 determinant for the provision of hearing support because this is not a reliable indicator of the 41 difficulty experienced with communication in background noise. Although important, assessment of 42 functional hearing and impact of the loss on the individual is variable and currently does not always 43 occur routinely. 44

Hearing loss Introduction
© NICE 2017. All rights reserved. Subject to Notice of rights. 19
Management pathways for adults with disabling hearing loss vary. In general, if there is hearing loss 1 in both ears, hearing aids are recommended for both ears, unless there are reasons why this is 2 inappropriate. However, in some areas of the country, adults are not offered NHS hearing aids for 3 disabling hearing losses where the pure tone audiogram findings are described as mild or moderate, 4 while others are offered 1 hearing aid rather than 2. Low uptake of hearing aids and adherence to 5 treatment are often dependent on the individuals’ recognition of their loss as well as the support 6 given. Hearing aids are sometimes trialled but discontinued because the person has not had advice 7 about strategies to improve hearing and listening nor the aftercare necessary to enable effective use. 8
Causes 9
Treatable difficulties in hearing can arise from problems such as occluding earwax or infection which 10 can be managed in primary care. However, the identification and management of these causes of 11 hearing difficulty is not always robust, leading to some people waiting a long time to see a specialist 12 when they could have been treated successfully in primary care. When earwax or infection prevents 13 the use of hearing aids it compounds the difficulties faced by those with hearing loss; delay in 14 resolving the problem can have a significant impact. 15
In this guideline we consider ‘diagnosis’ to refer to the medical diagnosis of the underlying cause, or 16 the aetiology, of the condition. When hearing is measured and a loss discovered, this is referred to as 17 ‘identification’. Identifying a hearing loss is not an end point in itself and it is important to consider 18 what has caused the loss. For the majority, this will be permanent damage due to ageing, noise 19 exposure or both, but for others there may be an underlying pathology, for example, middle ear 20 disease, or hearing loss may be part of a significant systemic illness, such as autoimmune or renal 21 disease, or the first symptom of neurological disease or it may have a specific genetic cause. 22 Addressing the diagnosis is beyond the scope of this guideline but is important because treatment 23 will affect the eventual outcome for the individual and their family. It is for this reason we have 24 considered the symptoms and signs that should alert a GP or audiologist to the need for a medical 25 assessment by an ENT surgeon or an audiovestibular physician, without wishing to limit discretion in 26 other cases. 27
Summary 28
Variations in assessment and management pathways for hearing loss can have a major impact, 29 adversely affecting individuals’ outcomes and prognoses, and contributing to the overall financial and 30 psychological burden of hearing loss. Identifying the correct routes of referral and optimal 31 management pathways for people with hearing loss is therefore very important. 32
This guideline explores the most urgent questions about referral, assessment and management of 33 hearing loss in adults in order to offer best practice advice. It cannot address the whole topic. One of 34 the issues the guideline committee has encountered when preparing this guideline is that the quality 35 of evidence on which to base recommendations is not high. There is scope for more robust research 36 in all areas. 37
This guideline seeks to inform people with hearing difficulties, their families and carers, all healthcare 38 professionals dealing with adults, social care professionals and commissioners of health and social 39 care services about best practice in assessing and managing hearing loss. It is important that 40 audiological care is patient-centred and that people should have the opportunity to make informed 41 decisions about their care and treatment in partnership with their healthcare professionals (NICE 42 guideline CG138) and this is reflected in the guideline. 43

Hearing loss Development of the guideline
© NICE 2017. All rights reserved. Subject to Notice of rights. 20
3 Development of the guideline 1
What is a NICE guideline? 3.12
NICE guidelines are recommendations for the care of individuals in specific clinical conditions or 3 circumstances within the NHS – from prevention and self-care through primary and secondary care 4 to more specialised services. These may also include elements of social care or public health 5 measures. We base our guidelines on the best available research evidence, with the aim of improving 6 the quality of healthcare. We use predetermined and systematic methods to identify and evaluate 7 the evidence relating to specific review questions. 8
NICE guidelines can: 9
provide recommendations for the treatment and care of people by health professionals 10
be used to develop standards to assess the clinical practice of individual health professionals 11
be used in the education and training of health professionals 12
help patients to make informed decisions 13
improve communication between patient and health professional. 14
While guidelines assist the practice of healthcare professionals, they do not replace their knowledge 15 and skills. 16
We produce our guidelines using the following steps: 17
A guideline topic is referred to NICE from NHS England. 18
Stakeholders register an interest in the guideline and are consulted throughout the development 19 process. 20
The scope is prepared by the National Guideline Centre (NGC). 21
The NGC establishes a guideline committee. 22
A draft guideline is produced after the group assesses the available evidence and makes 23 recommendations. 24
There is a consultation on the draft guideline. 25
The final guideline is produced. 26
The NGC and NICE produce a number of versions of this guideline: 27
The ‘full guideline’ contains all the recommendations, plus details of the methods used and the 28 underpinning evidence. 29
The ‘NICE guideline’ lists the recommendations. 30
‘Information for the public’ is written using suitable language for people without specialist 31 medical knowledge. 32
NICE Pathways brings together all connected NICE guidance. 33
This version is the full version. The other versions can be downloaded from NICE at www.nice.org.uk. 34
Remit 3.235
NICE received the remit for this guideline from NHS England. NICE commissioned the NGC to produce 36 the guideline. 37
The remit for this guideline is: to produce a guideline on the assessment and management of hearing 38 loss (adult presentation). 39

Hearing loss Development of the guideline
© NICE 2017. All rights reserved. Subject to Notice of rights. 21
Who developed this guideline? 3.31
A multidisciplinary guideline committee comprising health professionals and researchers as well as 2 lay members developed this guideline (see the list of guideline committee members and the 3 acknowledgements). 4
The National Institute for Health and Care Excellence (NICE) funds the National Guideline Centre 5 (NGC) and thus supported the development of this guideline. The committee was convened by the 6 NGC and chaired by Katherine Harrop-Griffiths in accordance with guidance from NICE. 7
The group met approximately every 6 weeks during the development of the guideline. At the start of 8 the guideline development process all committee members declared interests including 9 consultancies, fee-paid work, shareholdings, fellowships and support from the healthcare industry. 10 At all subsequent committee meetings, members declared arising conflicts of interest. 11
Members were either required to withdraw completely or for part of the discussion if their declared 12 interest made it appropriate. The details of declared interests and the actions taken are shown in 13 appendix B. 14
Staff from the NGC provided methodological support and guidance for the development process. The 15 team working on the guideline included a project manager, systematic reviewers (research fellows), 16 health economists and information specialists. They undertook systematic searches of the literature, 17 appraised the evidence, conducted meta-analysis and cost-effectiveness analysis where appropriate 18 and drafted the guideline in collaboration with the committee. 19
3.3.1 What this guideline covers 20
The guideline covers the key areas of: 21
Initial assessment (first presentation) and referral from primary care. 22
Further assessment of hearing and communication needs. 23
Management of hearing difficulties. 24
The following groups are covered: 25
Adults (aged 18 years and older) with hearing loss, including those with onset before the age of 18 26 but presenting for the first time in adulthood. 27
For further details please refer to the scope in appendix A and the review questions in section 4.1. 28
3.3.2 What this guideline does not cover 29
The guideline does not cover: 30
Tinnitus (without hearing loss). 31
Vertigo (without hearing loss). 32
Acute temporary hearing loss caused by traumatic head injuries, for example perforated tympanic 33 membranes or middle ear effusions. 34
Management of disease processes underlying hearing loss. 35
Surgical management of hearing loss. 36
Screening programmes for hearing loss. 37
The following groups are not covered: 38
Adults who presented with hearing loss before the age of 18. 39

Hearing loss Development of the guideline
© NICE 2017. All rights reserved. Subject to Notice of rights. 22
3.3.3 Relationships between the guideline and other NICE guidance 1
Related NICE technology appraisals: 2
Cochlear implants for children and adults with severe to profound deafness. NICE technology 3 appraisal guidance 166 (2009). 4
Related NICE interventional procedures guidance: 5
Auditory brain stem implants. NICE interventional procedure guidance 108(2005). 6
Related NICE guidelines: 7
Patient experience in adult NHS services. NICE guideline CG138 (2012) 8
Service user experience in adult mental health. NICE guideline CG136 (2011) 9
Medicines adherence. NICE guideline CG76 (2009) 10

Hearing loss Methods
© NICE 2017. All rights reserved. Subject to Notice of rights. 23
4 Methods 1
This chapter sets out in detail the methods used to review the evidence and to develop the 2 recommendations that are presented in subsequent chapters of this guideline. This guidance was 3 developed in accordance with the methods outlined in the NICE guidelines manual, 2014 version.71 4
Sections 4.1 to 4.3 describe the process used to identify and review clinical evidence (summarised in 5 Figure 1), sections 4.2 and 4.4 describe the process used to identify and review the health economic 6 evidence, and section 4.5 describes the process used to develop recommendations. 7
Figure 1: Step-by-step process of review of evidence in the guideline
Developing the review questions and outcomes 4.18
Review questions were developed using a PICO framework (population, intervention, comparison 9 and outcome) for intervention reviews; using a framework of population, index tests, reference 10 standard and target condition for reviews of diagnostic test accuracy; using population, presence or 11 absence of factors under investigation (for example prognostic factors) and outcomes for clinical 12 prediction reviews; and using a framework of population, setting and context for qualitative reviews. 13
This use of a framework guided the literature searching process, critical appraisal and synthesis of 14 evidence, and facilitated the development of recommendations by the guideline committee. The 15 review questions were drafted by the NGC technical team and refined and validated by the 16 committee. The questions were based on the key clinical areas identified in the scope (appendix A). 17
A total of 20 review questions were identified. 18

Hearing loss Methods
© NICE 2017. All rights reserved. Subject to Notice of rights. 24
Full literature searches, critical appraisals and evidence reviews were completed for all the specified 1 review questions. 2
Table 1: Review questions 3
Chapter Type of review Review questions Outcomes
Chapter 5 Clinical prediction
What are the signs and symptoms that allow early recognition of hearing loss needing immediate or urgent referral to a secondary care specialist?
Severe infections: otitis media with facial nerve impairment, otitis externa (malignant or necrotising)
Sudden sensorineural hearing loss
Rapidly progressing cholesteatoma
Rapidly growing vestibular schwannoma
Nasopharyngeal cancer and intracranial tumours
Stroke
Long-term neurological damage
Autoimmune disease
Chapter 5 Diagnostic Who should be routinely referred to audiovestibular medicine or ear, nose and throat (ENT) surgery for medical assessment?
Sensitivity
Specificity
Positive predictive value
Negative predictive value
ROC curve or area under the curve
Adjusted odds ratios
Chapter 6 Diagnostic In people who have been referred to secondary care with sensorineural hearing loss, who needs MRI to assess the underlying cause of hearing loss?
Sensitivity
Specificity
Positive predictive value
Negative predictive value
ROC curve or area under the curve
Adjusted odds ratios
Chapter 7 Clinical prediction
Which groups of people are more likely than the general population to miss having hearing loss identified?
Missed identification (no diagnosis prior to assessment and new diagnosis after assessment)
Identification rates
Chapter 8 Intervention What is the clinical and cost effectiveness of early versus delayed management of hearing loss on patient outcomes?
Hearing-specific health-related quality of life
Health-related quality of life
Listening ability
Usage of hearing aids (including data logging and self-report
Change in cognitive function (Mini-Mental State Examination, MMSE; Modified Mini-Mental State Examination (3MS)
Social functioning or employment
Sound localisation as measured by laboratory test
Speech in noise detection as measured by laboratory tests
Chapter 9 Intervention What is the clinical and cost effectiveness of
Critical
Hearing-specific health-related quality of life
o Hearing Handicap Inventory for the Elderly (HHIE)

Hearing loss Methods
© NICE 2017. All rights reserved. Subject to Notice of rights. 25
Chapter Type of review Review questions Outcomes
communication needs assessment in adults with hearing loss?
or HHI for Adults (HHIA)
o Quantified Denver Scale of Communication (QDS)
o Auditory Disability Preference – Visual Analog Scale (ADPI-VAS)
o GHABP
o CPHI
o COSI
o Device Orientated Subjective Outcome Scale
o Any questionnaire not specified above that is relevant
Listening ability
o Abbreviated Profile of Hearing Aid Benefit (APHAB)
o Speech, Spatial and Qualities of Hearing (SSQ)
o Glasgow Hearing Aid Benefit Profile (GHABP) residual disability subscale
Important
Social functioning or employment
Chapter 10 Intervention What is the most clinically and cost-effective method of removing earwax?
Critical
Health-related quality of life
Hearing (objective and patient reported)
Wax-related outcomes
o amount and occlusion
o ability / ease of removal
o global impression of treatment efficacy (patient or clinician)
Adverse effects: perforation, infection, vertigo, bleeding, discomfort
Time to recurrence of wax
Important
pure tone audiometry
Chapter 10 Intervention What is the most clinically and cost-effective setting for the identification and treatment of earwax?
Critical
Success of earwax removal
Improvement in hearing
Adverse events
o Earwax related
- perforation
- Infection
- vertigo
- bleeding
- Discomfort
Hearing-specific health-related quality of life
o Any patient-reported scale that has been validated to provide health utility measure, for example:
- WHO DAS II
- HUI2/HUI3

Hearing loss Methods
© NICE 2017. All rights reserved. Subject to Notice of rights. 26
Chapter Type of review Review questions Outcomes
- Cambridge Otology QOL Questionnaire
- Speech, Spatial and Qualities of Hearing (SSQ) Scale
Patient-reported disability or benefit
Measures validated to demonstrate changes with audiology care in the population under study, for example:
o Device Orientated Subjective Outcome Scale
o Glasgow Hearing Aid Benefit Profile
o Hearing Handicap Inventory for the Elderly
Chapter 11 Intervention What is the most clinically and cost-effective treatment for idiopathic sudden sensorineural hearing loss (SSNHL)?
Critical
Pure-tone audiometry
Speech discrimination
Health-related quality of life
Hearing-specific health-related quality of life
Important
Adverse events for example, gastrointestinal bleeding, mood alteration or psychosis
Chapter 11 Intervention What is the clinical and cost effectiveness of different routes of administration of steroids (for example oral or intratympanic) in the treatment of sudden sensorineural hearing loss (SSNHL)?
Critical
Pure-tone audiometry
Speech discrimination
Health-related quality of life
Hearing-specific health-related quality of life
Important
Adverse events for example, gastrointestinal bleeding, mood alteration or psychosis
Chapter 12 Qualitative What are the information, support and advice needs of people with hearing difficulty and their families and carers?
Any type of information, support and advice described by studies. For example:
o Content of information, support and advice required
o How and by whom information, support and advice is delivered
o Information for carers and family members as well as information for patients
o Timing of information and support
Chapter 13 Intervention What is the clinical and cost effectiveness of using patient-centred tools to help patients with hearing loss decide between different management strategies?
Critical
Hearing-specific health-related quality of life
o Hearing Handicap Inventory for the Elderly (HHIE) or HHI for Adults (HHIA)
o Quantified Denver Scale of Communication (QDS)
o Auditory Disability Preference – Visual Analog Scale (ADPI-VAS)
o Device Orientated Subjective Outcome Scale
o Abbreviated Profile of Hearing Aid Benefit (APHAB)
o Speech, Spatial and Qualities of Hearing (SSQ)

Hearing loss Methods
© NICE 2017. All rights reserved. Subject to Notice of rights. 27
Chapter Type of review Review questions Outcomes
o Glasgow Hearing Aid Benefit Profile (GHABP) residual disability subscale
o Any questionnaire not specified above that is relevant
Adherence to chosen strategy for example usage of hearing aids (including data logging and self-report (if applicable)
Important
Any outcomes reporting:
o Restricted participation or activity limitation
o Social interactions, employment and education
Health-related quality of life
o Health Utilities Index Mark 3 (HUI-3)
o EQ-5D
o SF-36
o Glasgow Benefit Inventory (GBI)
o WHO Disability Assessment Schedule (WHODAS)
o Self-Evaluation of Life Function (SELF)
o Any questionnaire not specified above that is relevant
Chapter 14 Intervention What is the clinical and cost effectiveness of assistive listening devices (such as loops) to support communication?
Critical
Hearing-specific health-related quality of life
o Hearing Handicap Inventory for the Elderly (HHIE) or HHI for Adults (HHIA)
o Quantified Denver Scale of Communication (QDS)
o Auditory Disability Preference – Visual Analog Scale (ADPI-VAS)
o Device Orientated Subjective Outcome Scale
o Any questionnaire not specified above that is relevant
Health-related quality of life
o Health Utilities Index Mark 3 (HUI-3)
o EQ-5D
o SF-36
o Glasgow Benefit Inventory (GBI)
o WHO Disability Assessment Schedule (WHODAS)
o Self-Evaluation of Life Function (SELF)
o Any questionnaire mot specified above that is relevant
Listening ability
o Abbreviated Profile of Hearing Aid Benefit (APHAB)
o Speech, Spatial and Qualities of Hearing (SSQ)
o Glasgow Hearing Aid Benefit Profile (GHABP) residual disability subscale
o Speech intelligibility (BKB, HINT, QuickSIN)
o Ease of listening/listening effort

Hearing loss Methods
© NICE 2017. All rights reserved. Subject to Notice of rights. 28
Chapter Type of review Review questions Outcomes
Important
Any outcomes reporting:
o Restricted participation or activity limitation
o Social interactions, employment (including voluntary work) and education
Chapter 15 Intervention What is the clinical and cost effectiveness of hearing aids for mild to moderate hearing loss in adults who have been prescribed at least 1 hearing aid?
Critical
Hearing-specific health-related quality of life (key domain: participation)
Adverse effects: Pain
Important
Health-related quality of life
Listening ability
Adverse effects: Noise-induced hearing loss
Chapter 15 Intervention What is the clinical and cost effectiveness of fitting 1 hearing aid compared with fitting 2 hearing aids for people when both ears have an aidable hearing loss?
Critical
Hearing-specific health-related quality of life
o Hearing Handicap Inventory for the Elderly (HHIE) or HHI for Adults (HHIA)
o Quantified Denver Scale of Communication (QDS)
o Auditory Disability Preference – Visual Analog Scale (ADPI-VAS)
o Any questionnaire not specified above that is relevant
Health-related quality of life
o Health Utilities Index Mark 3 (HUI-3)
o EQ-5D
o SF-36
o Glasgow Benefit Inventory (GBI)
o WHO Disability Assessment Schedule (WHODAS)
o Self-Evaluation of Life Function (SELF)
o Any questionnaire mot specified above that is relevant
Listening ability
o Abbreviated Profile of Hearing Aid Benefit (APHAB)
o Speech, Spatial and Qualities of Hearing (SSQ)
o Glasgow Hearing Aid Benefit Profile (GHABP) disability subscale
o Any questionnaire not specified above that is relevant
Device Orientated Subjective Outcome Scale
Outcomes reported by carer or ‘communications partner’
Patient preference
Chapter 16 Intervention What is the clinical and cost effectiveness of directional versus omnidirectional
Critical
Speech recognition in noise
Ease of listening or listening effort (objective or self-reported)
Hearing loss Methods
© NICE 2017. All rights reserved. Subject to Notice of rights. 29
Chapter Type of review Review questions Outcomes
microphones? Hearing-specific health-related quality of life
o Hearing Handicap Inventory for the Elderly (HHIE) or HHI for Adults (HHIA)
o Quantified Denver Scale of Communication (QDS)
o Auditory Disability Preference – Visual Analog Scale (ADPI-VAS)
o Device Orientated Subjective Outcome Scale
o Any questionnaire not specified above that is relevant
Important
Any outcomes reporting:
o Restricted participation or activity limitation
o Social interactions, employment and education
o Health-related quality of life:
o Health Utilities Index Mark 3 (HUI-3)
o EQ-5D
o SF-36
o Glasgow Benefit Inventory (GBI)
o WHO Disability Assessment Schedule (WHODAS)
o Self-Evaluation of Life Function (SELF)
Listening ability
o Abbreviated Profile of Hearing Aid Benefit (APHAB)
o Speech, Spatial and Qualities of Hearing (SSQ)
o Glasgow Hearing Aid Benefit Profile (GHABP) disability subscale
o Any questionnaire not specified above that is relevant
Safety for example lack of awareness of environmental noise as an adverse effect
Adherence
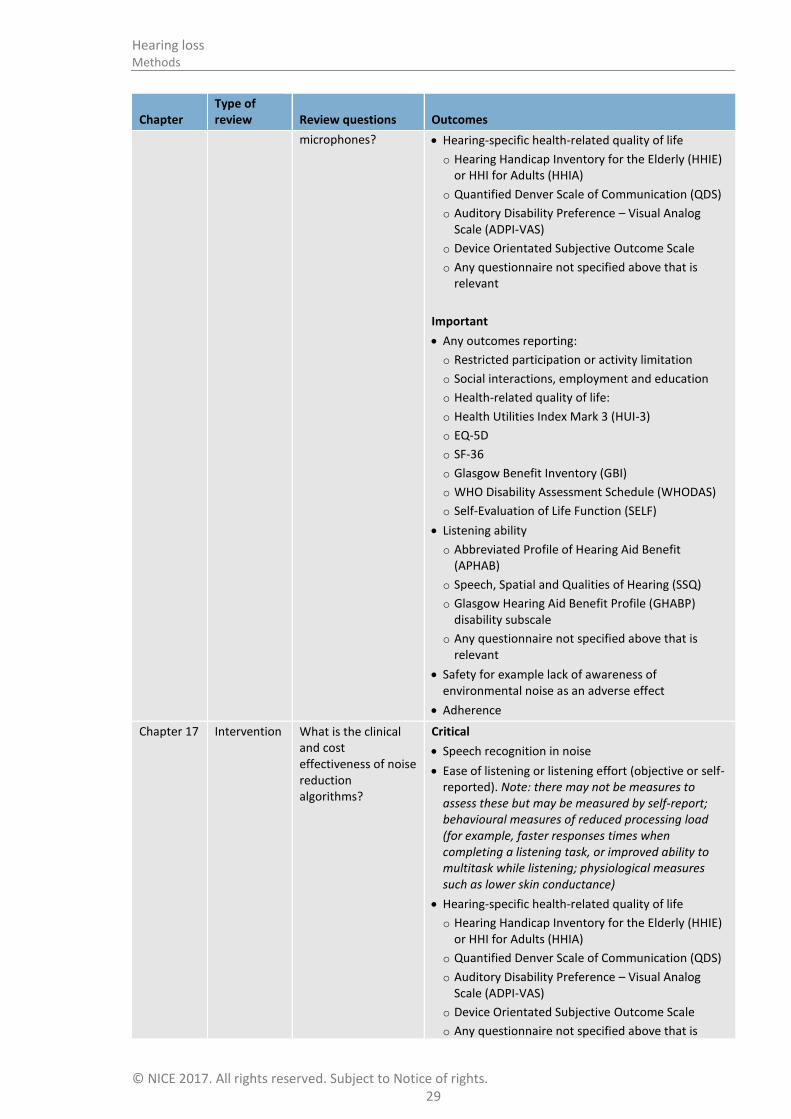
Chapter 17 Intervention What is the clinical and cost effectiveness of noise reduction algorithms?
Critical
Speech recognition in noise
Ease of listening or listening effort (objective or self-reported). Note: there may not be measures to assess these but may be measured by self-report; behavioural measures of reduced processing load (for example, faster responses times when completing a listening task, or improved ability to multitask while listening; physiological measures such as lower skin conductance)
Hearing-specific health-related quality of life
o Hearing Handicap Inventory for the Elderly (HHIE) or HHI for Adults (HHIA)
o Quantified Denver Scale of Communication (QDS)
o Auditory Disability Preference – Visual Analog Scale (ADPI-VAS)
o Device Orientated Subjective Outcome Scale
o Any questionnaire not specified above that is

Hearing loss Methods
© NICE 2017. All rights reserved. Subject to Notice of rights. 30
Chapter Type of review Review questions Outcomes
relevant
Important
Any outcomes reporting:
o Restricted participation or activity limitation
o Social interactions, employment and education
o Listening ability Abbreviated Profile of Hearing Aid Benefit (APHAB)
o Speech, Spatial and Qualities of Hearing (SSQ)
o Glasgow Hearing Aid Benefit Profile (GHABP) residual disability subscale
Health-related quality of life
o Health Utilities Index Mark 3 (HUI-3)
o EQ-5D
o SF-36
o Glasgow Benefit Inventory (GBI)
o WHO Disability Assessment Schedule (WHODAS)
o Self-Evaluation of Life Function (SELF)
o Any questionnaire not specified above that is relevant
Safety (for example, lack of awareness of environmental noise as adverse effect)
Adherence
Chapter 18 Intervention What is the most clinically and cost-effective method of delivery of monitoring and follow-up of people with hearing-related communication needs (including those with hearing aids)?
Critical
Hearing-specific health-related quality of life
o Hearing Handicap Inventory for the Elderly (HHIE) or HHI for Adults (HHIA)
o Quantified Denver Scale of Communication (QDS)
o Auditory Disability Preference – Visual Analog Scale (ADPI-VAS)
o Device Orientated Subjective Outcome Scale
o Any questionnaire not specified above that is relevant
Health-related quality of life
o Health Utilities Index Mark 3 (HUI-3)
o EQ-5D
o SF-36
o Glasgow Benefit Inventory (GBI)
o WHO Disability Assessment Schedule (WHODAS)
o Self-Evaluation of Life Function (SELF)
o Any questionnaire mot specified above that is relevant
Listening ability
o Abbreviated Profile of Hearing Aid Benefit (APHAB)
o Speech, Spatial and Qualities of Hearing (SSQ)
o Glasgow Hearing Aid Benefit Profile (GHABP) residual disability subscale
Speech recognition in noise test

Hearing loss Methods
© NICE 2017. All rights reserved. Subject to Notice of rights. 31
Chapter Type of review Review questions Outcomes
Usage of hearing aids (including data logging and self-report (if applicable)
Important
Social functioning or employment
Chapter 18 Intervention When should people with hearing-related communication needs (including those with hearing aids) be monitored and followed up?
Critical
Hearing-specific health-related quality of life
o Hearing Handicap Inventory for the Elderly (HHIE) or HHI for Adults (HHIA)
o Quantified Denver Scale of Communication (QDS)
o Auditory Disability Preference – Visual Analog Scale (ADPI-VAS)
o Device Orientated Subjective Outcome Scale
o Any questionnaire not specified above that is relevant
Health-related quality of life
o Health Utilities Index Mark 3 (HUI-3)
o EQ-5D
o SF-36
o Glasgow Benefit Inventory (GBI)
o WHO Disability Assessment Schedule (WHODAS)
o Self-Evaluation of Life Function (SELF)
o Any questionnaire mot specified above that is relevant
Listening ability
o Abbreviated Profile of Hearing Aid Benefit (APHAB)
o Speech, Spatial and Qualities of Hearing (SSQ)
o Glasgow Hearing Aid Benefit Profile (GHABP) residual disability subscale
Speech recognition in noise test
Usage of hearing aids (including data logging and self-report (if applicable)
Important
Social functioning or employment
Chapter 19 Intervention What is the clinical and cost effectiveness of interventions to support continuing use of hearing aids?
Critical
Hearing aid use (measured as adherence or daily hours of use)
Adverse effects (inappropriate advice or clinical practice, or patient complaints)
Patient-reported outcomes including:
o quality of life,
o hearing handicap,
o hearing aid benefit and communication
Outcomes reported by carers or relatives
Outcomes measured over the short (≤12 weeks), medium (>12 to <52 weeks) and long term (≥1 year).

Hearing loss Methods
© NICE 2017. All rights reserved. Subject to Notice of rights. 32
Searching for evidence 4.21
4.2.1 Clinical literature search 2
Systematic literature searches were undertaken to identify all published clinical evidence relevant to 3 the review questions. Searches were undertaken according to the parameters stipulated within the 4 NICE guidelines manual 2014.71 Databases were searched using relevant medical subject headings, 5 free-text terms and study-type filters where appropriate. Where possible, searches were restricted 6 to papers published in English. Studies published in languages other than English were not reviewed. 7 All searches were conducted in Medline, Embase, and The Cochrane Library. Additional subject 8 specific databases were used for some questions: CINAHL, Current Nursing and Allied Health 9 Literature and PsycINFO. Final searches were between 3 October 2016 and 21 June 2017, please see 10 appendix G for specific dates. 11
Search strategies were quality assured by cross-checking reference lists of highly relevant papers, 12 analysing search strategies in other systematic reviews, and asking committee members to highlight 13 any additional studies. Searches were quality assured by a second information specialist before being 14 run. The questions, the study types applied, the databases searched and the years covered can be 15 found in appendix G. 16
During the scoping stage, a search was conducted for guidelines and reports on the websites listed 17 below from organisations relevant to the topic. 18
Guidelines International Network database (www.g-i-n.net) 19
National Guideline Clearing House (www.guideline.gov) 20
NHS Evidence Search (www.evidence.nhs.uk) 21
TRIP, Turning Research Into Practice (www.tripdatabase.com). 22
All references sent by stakeholders were considered. Searching for unpublished literature was not 23 undertaken. The NGC and NICE do not have access to drug manufacturers’ unpublished clinical trial 24 results, so the clinical evidence considered by the committee for pharmaceutical interventions may 25 be different from that considered by the MHRA and European Medicines Agency for the purposes of 26 licensing and safety regulation. 27
4.2.2 Health economic literature search 28
Systematic literature searches were also undertaken to identify health economic evidence within 29 published literature relevant to the review questions. The evidence was identified by conducting a 30 broad search relating to hearing loss population in the NHS Economic Evaluation Database (NHS EED) 31 and the Health Technology Assessment database (HTA) with no date restrictions (NHS EED ceased to 32 be updated after March 2015). Additionally, the search was run on Medline and Embase using a 33 health economic filter, from January 2014, to ensure recent publications that had not yet been 34 indexed by the economic databases were identified. This was supplemented by additional searches 35 that looked for economic papers specifically relating to Earwax on Medline, Embase, NHSEED and 36 HTA as it became apparent that some papers in this area had not been identified by the first search. 37 Where possible, searches were restricted to papers published in English. Studies published in 38 languages other than English were not reviewed. 39
The health economic search strategies are included in appendix G. The search for quality of life was 40 updated on 16 February 2016, the general hearing loss health economic search and the earwax 41 health economic search were updated on 18 October 2017 and the hearing aids health economic 42 search was updated on 4 September 2017. No papers published after these dates were considered. 43
Hearing loss Methods
© NICE 2017. All rights reserved. Subject to Notice of rights. 33
Identifying and analysing evidence of effectiveness 4.31
Research fellows conducted the tasks listed below, which are described in further detail in the rest of 2 this section: 3
Identified potentially relevant studies for each review question from the relevant search results 4 by reviewing titles and abstracts. Full papers were then obtained. 5
Reviewed full papers against prespecified inclusion and exclusion criteria to identify studies that 6 addressed the review question in the appropriate population, and reported on outcomes of 7 interest (review protocols are included in appendix C). 8
Critically appraised relevant studies using the appropriate study design checklist as specified in 9 the NICE guidelines manual.71 clinical prediction studies were critically appraised using NGC 10 checklists. Qualitative studies were critically appraised using the GRADE CERQual approach for 11 rating confidence in the body of evidence as a whole and using an NGC checklist for the 12 methodological limitations section of the quality assessment. 13
Extracted key information about interventional study methods and results using ‘Evibase’, NGC’s 14 purpose-built software. Evibase produces summary evidence tables, including critical appraisal 15 ratings. Key information about non-interventional study methods and results was manually 16 extracted onto standard evidence tables and critically appraised separately (evidence tables are 17 included in appendix H). 18
Generated summaries of the evidence by outcome. Outcome data were combined, analysed and 19 reported according to study design: 20
o Randomised data were meta-analysed where appropriate and reported in GRADE profile 21 tables. 22
o Data from non-randomised studies were presented as a range of values in GRADE profile 23 tables or meta-analysed if appropriate. 24
o Prognostic clinical prediction data were meta-analysed where appropriate and reported in 25 GRADE profile tables. 26
o Diagnostic data studies were meta-analysed where appropriate or presented as a range of 27 values in adapted GRADE profile tables 28
o Qualitative data were synthesised across studies and presented as summary statements with 29 accompanying GRADE CERQual ratings for each review finding. 30
A sample of a minimum of 10% of the abstract lists of the first 3 sifts by new reviewers and those 31 for complex review questions (for example, clinical prediction reviews) were double-sifted by a 32 senior research fellow and any discrepancies were rectified. All of the evidence reviews were 33 quality assured by a senior research fellow. This included checking: 34
o papers were included or excluded appropriately 35
o a sample of the data extractions 36
o correct methods were used to synthesise data 37
o a sample of the risk of bias assessments. 38
4.3.1 Inclusion and exclusion criteria 39
The inclusion and exclusion of studies was based on the criteria defined in the review protocols, 40 which can be found in appendix C. Excluded studies by review question (with the reasons for their 41 exclusion) are listed in appendix L. The committee was consulted about any uncertainty regarding 42 inclusion or exclusion. 43
The key population inclusion criterion was: 44

Hearing loss Methods
© NICE 2017. All rights reserved. Subject to Notice of rights. 34
Adults (aged 18 years and older) with hearing loss, including those with onset before the age 1 of 18 but presenting for the first time in adulthood. 2 3
The key population exclusion criterion was: 4
Adults who presented with hearing loss before the age of 18. 5
Conference abstracts were not automatically excluded from any review. The abstracts were initially 6 assessed against the inclusion criteria for the review question and further processed when a full 7 publication was not available for that review question. If the abstracts were included the authors 8 were contacted for further information. No relevant conference abstracts were identified for this 9 guideline. Literature reviews, posters, letters, editorials, comment articles, unpublished studies and 10 studies not in English were excluded. 11
4.3.1.1 Saturation of qualitative studies 12
Data extraction in qualitative reviews is a thorough process and may require more time compared to 13 intervention reviews. It is common practice to stop extracting data once saturation has been 14 reached. This is the point when no new information emerges from studies that match the review 15 protocol. The remaining identified studies are, however, not directly excluded from the review as 16 they nevertheless fit the criteria defined in the review protocol. Any studies for which data were not 17 extracted due to saturation having been reached, but that fit the inclusion criteria of the protocol, 18 were listed in the table for studies ‘identified but not included due to saturation’ in the appendix for 19 the qualitative evidence review. 20
4.3.2 Type of studies 21
Randomised trials, non-randomised intervention studies, and other observational studies (including 22 diagnostic or clinical prediction studies) were included in the evidence reviews as appropriate. 23
For most intervention reviews in this guideline, parallel randomised controlled trials (RCTs) were 24 included because they are considered the most robust type of study design that can produce an 25 unbiased estimate of the intervention effects. Crossover RCTs were considered if the studies 26 reported data before cross over. If non-randomised intervention studies were considered 27 appropriate for inclusion (for example, where no randomised evidence was available for critical 28 outcomes) the committee stated a priori in the protocol that either certain identified variables must 29 be equivalent at baseline or else the analysis had to adjust for any baseline differences. If the study 30 did not fulfil either criterion it was excluded. Please refer to the review protocols in appendix C for 31 full details on the study design of studies selected for each review question. 32
For diagnostic review questions, diagnostic RCTs, cross-sectional studies and retrospective studies 33 were included. For clinical prediction review questions, prospective and retrospective cohort studies 34 were included. Case–control studies were not included. 35
Where data from non-randomised studies were included, the results for each outcome were 36 presented separately for each study or meta-analysed if appropriate. 37
4.3.3 Methods of combining clinical studies 38
4.3.3.1 Data synthesis for intervention reviews 39
Where possible, meta-analyses were conducted using Cochrane Review Manager (RevMan5)87 40 software to combine the data given in all studies for each of the outcomes of interest for the review 41 question. 42

Hearing loss Methods
© NICE 2017. All rights reserved. Subject to Notice of rights. 35
4.3.3.1.1 Analysis of different types of data 1
Dichotomous outcomes 2
Fixed-effects (Mantel-Haenszel) techniques (using an inverse variance method for pooling) were used 3 to calculate risk ratios (relative risk, RR) for the binary outcomes, which included: 4
adverse events. 5
missed diagnosis or misdiagnosis 6
patient-assessed symptoms 7
The absolute risk difference was also calculated using GRADEpro41 software, using the median event 8 rate in the control arm of the pooled results. 9
For binary variables where there were zero events in either arm or a less than 1% event rate, Peto 10 odds ratios, rather than risk ratios, were calculated. Peto odds ratios are more appropriate for data 11 with a low number of events. 12
Continuous outcomes 13
Continuous outcomes were analysed using an inverse variance method for pooling weighted mean 14 differences. These outcomes included: 15
Heath-related quality of life (HRQoL) such as: 16
o Health Utilities Index Mark 3 (HUI-3) 17
o EQ-5D 18
o SF-36 19
o Glasgow Benefit Inventory (GBI) 20
o WHO Disability Assessment Schedule (WHODAS) 21
22
Hearing-related quality of life such as: 23
o Hearing Handicap Inventory for the Elderly (HHIE) or HHI for Adults (HHIA) 24
o Quantified Denver Scale of Communication (QDS) 25
o Auditory Disability Preference – Visual Analog Scale (ADPI-VAS) 26
Where the studies within a single meta-analysis had different scales of measurement, standardised 27 mean differences were used (providing all studies reported either change from baseline or final 28 values rather than a mixture of both); each different measure in each study was ‘normalised’ to the 29 standard deviation value pooled between the intervention and comparator groups in that same 30 study. 31
The means and standard deviations of continuous outcomes are required for meta-analysis. 32 However, in cases where standard deviations were not reported, the standard error was calculated if 33 the p values or 95% confidence intervals (95% CI) were reported, and meta-analysis was undertaken 34 with the mean and standard error using the generic inverse variance method in Cochrane Review 35 Manager (RevMan587 software. Where p values were reported as ‘less than’, a conservative 36 approach was undertaken. For example, if a p value was reported as ‘p≤0.001’, the calculations for 37 standard deviations were based on a p value of 0.001. If these statistical measures were not available 38 then the methods described in section 16.1.3 of the Cochrane Handbook (version 5.1.0, updated 39 March 2011) were applied. 40

Hearing loss Methods
© NICE 2017. All rights reserved. Subject to Notice of rights. 36
4.3.3.1.2 Generic inverse variance 1
If a study reported only the summary statistic and 95% CI the generic-inverse variance method was 2 used to enter data into RevMan5.87 If the control event rate was reported this was used to generate 3 the absolute risk difference in GRADEpro.41 If multivariate analysis was used to derive the summary 4 statistic but no adjusted control event rate was reported no absolute risk difference was calculated. 5
4.3.3.1.3 Heterogeneity 6
Statistical heterogeneity was assessed for each meta-analysis estimate by considering the chi-7 squared test for significance at p<0.1 or an I-squared (I2) inconsistency statistic (with an I-squared 8 value of more than 50% indicating significant heterogeneity) as well as the distribution of effects. 9 Where significant heterogeneity was present, predefined subgrouping of studies was carried out for 10 the following subgroups where relevant: 11
Severity of hearing loss 12
Type of hearing aid 13
Age 14
Cognitive impairment 15
Asymmetric hearing loss 16
Visual impairment 17
Tinnitus with hearing loss 18
First-time users of hearing aids 19
Assessments of potential differences in effect between subgroups were based on the chi-squared 20 tests for heterogeneity statistics between subgroups. Any subgroup differences were interpreted 21 with caution as separating the groups breaks the study randomisation and as such is subject to 22 uncontrolled confounding. These additional subgrouping strategies were applied independently, so 23 subunits of subgroups were not created. If all predefined strategies of subgrouping were unable to 24 explain statistical heterogeneity within each derived subgroup, then a random effects (DerSimonian 25 and Laird) model was employed to the entire group of studies in the meta-analysis. A random-effects 26 model assumes a distribution of populations, rather than a single population. This leads to a 27 widening of the confidence interval around the overall estimate, thus providing a more realistic 28 interpretation of the true distribution of effects across more than 1 population. If, however, the 29 committee considered the heterogeneity was so large that meta-analysis was inappropriate, then the 30 results were described narratively. 31
4.3.3.2 Data synthesis for clinical prediction reviews 32
Odds ratios (ORs), risk ratios (RRs), or hazard ratios (HRs), with their 95% CIs, for the effect of the 33 prespecified prognostic factors were extracted from the studies. Studies were only included if the 34 confounders prespecified by the committee were either matched at baseline or were adjusted for in 35 multivariate analysis. 36
Studies of lower risk of bias were preferred, taking into account the analysis and the study design. In 37 particular, prospective cohort studies were preferred if they reported multivariable analyses that 38 adjusted for key confounders identified by the committee at the protocol stage for that outcome. 39
4.3.3.3 Data synthesis for diagnostic test accuracy reviews 40
4.3.3.3.1 Diagnostic accuracy studies 41
For diagnostic test accuracy studies, a positive result on the index test was found if the patient had 42 values of the measured quantity above or below a threshold value, and different thresholds could be 43

Hearing loss Methods
© NICE 2017. All rights reserved. Subject to Notice of rights. 37
used. The thresholds were pre-specified by the committee including whether or not data could be 1 pooled across a range of thresholds. Diagnostic test accuracy measures used in the analysis were: 2 area under the receiver operating characteristics (ROC) curve (AUC), and, for different thresholds (if 3 appropriate), sensitivity and specificity. The threshold of a diagnostic test is defined as the value at 4 which the test can best differentiate between those with and without the target condition. In 5 practice this varies amongst studies. If a test has a high sensitivity then very few people with the 6 condition will be missed (few false negatives). For example, a test with a sensitivity of 97% will only 7 miss 3% of people with the condition. Conversely, if a test has a high specificity then few people 8 without the condition would be incorrectly diagnosed (few false positives). For example, a test with a 9 specificity of 97% will only incorrectly diagnose 3% of people who do not have the condition as 10 positive. -Coupled forest plots of sensitivity and specificity with their 95% CIs across studies (at 11 various thresholds if available) were produced for each test, using RevMan5.87 In order to do this, 12 2×2 tables (the number of true positives, false positives, true negatives and false negatives) were 13 directly taken from the study if given, or else were derived from raw data or calculated from the set 14 of test accuracy statistics. 15
Heterogeneity or inconsistency amongst studies was visually inspected in the forest plots and pooled 16 diagnostic meta-analysis plots. 17
Heterogeneity or inconsistency amongst studies was visually inspected. 18
4.3.3.4 Data synthesis for qualitative study reviews 19
The main findings for each included paper were identified and thematic analysis methods were used 20 to synthesise this information into broad overarching themes which were summarised into the main 21 review findings. The evidence was presented in the form of a narrative summary detailing the 22 evidence from the relevant papers and how this informed the overall review finding plus a statement 23 on the level of confidence for that review finding. Considerable limitations and issues around 24 relevance were listed. A summary evidence table with the succinct summary statements for each 25 review finding was produced including the associated quality assessment. 26
4.3.4 Appraising the quality of evidence by outcomes 27
4.3.4.1 Intervention reviews 28
The evidence for outcomes from the included RCTs and, where appropriate, non-randomised 29 intervention studies, were evaluated and presented using an adaptation of the ‘Grading of 30 Recommendations Assessment, Development and Evaluation (GRADE) toolbox’ developed by the 31 international GRADE working group (http://www.gradeworkinggroup.org/). The software 32 (GRADEpro41) developed by the GRADE working group was used to assess the quality of each 33 outcome, taking into account individual study quality and the meta-analysis results. 34
Each outcome was first examined for each of the quality elements listed and defined in Table 2. 35
Table 2: Description of quality elements in GRADE for intervention studies 36
Quality element Description
Risk of bias Limitations in the study design and implementation may bias the estimates of the treatment effect. Major limitations in studies decrease the confidence in the estimate of the effect. Examples of such limitations are selection bias (often due to poor allocation concealment), performance and detection bias (often due to a lack of blinding of the patient, healthcare professional or assessor) and attrition bias (due to missing data causing systematic bias in the analysis).
Indirectness Indirectness refers to differences in study population, intervention, comparator and outcomes between the available evidence and the review question.

Hearing loss Methods
© NICE 2017. All rights reserved. Subject to Notice of rights. 38
Quality element Description
Inconsistency Inconsistency refers to an unexplained heterogeneity of effect estimates between studies in the same meta-analysis.
Imprecision Results are imprecise when studies include relatively few patients and few events (or highly variable measures) and thus have wide confidence intervals around the estimate of the effect relative to clinically important thresholds. 95% confidence intervals denote the possible range of locations of the true population effect at a 95% probability, and so wide confidence intervals may denote a result that is consistent with conflicting interpretations (for example a result may be consistent with both clinical benefit AND clinical harm) and thus be imprecise.
Publication bias Publication bias is a systematic underestimate or overestimate of the underlying beneficial or harmful effect due to the selective publication of studies. A closely related phenomenon is where some papers fail to report an outcome that is inconclusive, thus leading to an overestimate of the effectiveness of that outcome.
Other issues Sometimes randomisation may not adequately lead to group equivalence of confounders, and if so this may lead to bias, which should be taken into account. Potential conflicts of interest, often caused by excessive pharmaceutical company involvement in the publication of a study, should also be noted.
Details of how the 4 main quality elements (risk of bias, indirectness, inconsistency and imprecision) 1 were appraised for each outcome are given below. Publication or other bias was only taken into 2 consideration in the quality assessment if it was apparent. 3
4.3.4.1.1 Risk of bias 4
The main domains of bias for RCTs are listed in Table 3. Each outcome had its risk of bias assessed 5 within each study first. For each study, if there were no risks of bias in any domain, the risk of bias 6 was given a rating of 0. If there was risk of bias in just 1 domain, the risk of bias was given a ‘serious’ 7 rating of −1, but if there was risk of bias in 2 or more domains the risk of bias was given a ‘very 8 serious’ rating of −2. A weighted average score was then calculated across all studies contributing to 9 the outcome, by taking into account the weighting of studies according to study precision. For 10 example if the most precise studies tended to each have a score of −1 for that outcome, the overall 11 score for that outcome would tend towards −1. 12
Table 3: Principle domains of bias in randomised controlled trials 13
Limitation Explanation
Selection bias (sequence generation and allocation concealment)
If those enrolling patients are aware of the group to which the next enrolled patient will be allocated, either because of a non-random sequence that is predictable, or because a truly random sequence was not concealed from the researcher, this may translate into systematic selection bias. This may occur if the researcher chooses not to recruit a participant into that specific group because of:
knowledge of that participant’s likely prognostic characteristics, and
a desire for one group to do better than the other.
Performance and detection bias (lack of blinding of patients and healthcare professionals)
Patients, caregivers, those adjudicating or recording outcomes, and data analysts should not be aware of the arm to which patients are allocated. Knowledge of the group can influence:
the experience of the placebo effect
performance in outcome measures
the level of care and attention received, and
the methods of measurement or analysis
all of which can contribute to systematic bias.
Attrition bias Attrition bias results from an unaccounted for loss of data beyond a certain level (a differential of 10% between groups). Loss of data can occur when participants are

Hearing loss Methods
© NICE 2017. All rights reserved. Subject to Notice of rights. 39
Limitation Explanation
compulsorily withdrawn from a group by the researchers (for example, when a per-protocol approach is used) or when participants do not attend assessment sessions. If the missing data are likely to be different from the data of those remaining in the groups, and there is a differential rate of such missing data from groups, systematic attrition bias may result.
Selective outcome reporting
Reporting of some outcomes and not others on the basis of the results can also lead to bias, as this may distort the overall impression of efficacy.
Other limitations For example:
Stopping early for benefit observed in randomised trials, in particular in the absence of adequate stopping rules.
Use of unvalidated patient-reported outcome measures.
Lack of washout periods to avoid carry-over effects in crossover trials.
Recruitment bias in cluster-randomised trials.
The assessment of risk of bias differs for non-randomised intervention studies, as they are inherently 1 at high risk of selection bias. For this reason, GRADE requires that non-randomised evidence is 2 initially downgraded on the basis of study design, starting with a rating of −2. This accounts for 3 selection bias and so non-randomised intervention studies are not downgraded any further on that 4 domain. Non-randomised evidence was assessed against the remaining domains used for RCTs in 5 Table 3, and downgraded further as appropriate. 6
4.3.4.1.2 Indirectness 7
Indirectness refers to the extent to which the populations, interventions, comparisons and outcome 8 measures are dissimilar to those defined in the inclusion criteria for the reviews. Indirectness is 9 important when these differences are expected to contribute to a difference in effect size, or may 10 affect the balance of harms and benefits considered for an intervention. As for the risk of bias, each 11 outcome had its indirectness assessed within each study first. For each study, if there were no 12 sources of indirectness, indirectness was given a rating of 0. If there was indirectness in just 1 source 13 (for example in terms of population), indirectness was given a ‘serious’ rating of −1, but if there was 14 indirectness in 2 or more sources (for example, in terms of population and treatment) the 15 indirectness was given a ‘very serious’ rating of −2. A weighted average score was then calculated 16 across all studies contributing to the outcome by taking into account study precision. For example, if 17 the most precise studies tended to have an indirectness score of −1 each for that outcome, the 18 overall score for that outcome would tend towards −1. 19
4.3.4.1.3 Inconsistency 20
Inconsistency refers to an unexplained heterogeneity of results for an outcome across different 21 studies. When estimates of the treatment effect across studies differ widely, this suggests true 22 differences in the underlying treatment effect, which may be due to differences in populations, 23 settings or doses. When heterogeneity existed within an outcome (chi-squared p<0.1, or I2>50%), but 24 no plausible explanation could be found, the quality of evidence for that outcome was downgraded. 25 Inconsistency for that outcome was given a ‘serious’ score of −1 if the I2 was 50–74%, and a ‘very 26 serious’ score of −2 if the I2 was 75% or more. 27
If inconsistency could be explained based on prespecified subgroup analysis (that is, each subgroup 28 had an I2<50%), the committee took this into account and considered whether to make separate 29 recommendations on new outcomes based on the subgroups defined by the assumed explanatory 30 factors. In such a situation the quality of evidence was not downgraded for those emergent 31 outcomes. 32

Hearing loss Methods
© NICE 2017. All rights reserved. Subject to Notice of rights. 40
Since the inconsistency score was based on the meta-analysis results, the score represented the 1 whole outcome and so weighted averaging across studies was not necessary. 2
4.3.4.1.4 Imprecision 3
The criteria applied for imprecision were based on the 95% CIs for the pooled estimate of effect, and 4 the minimal important differences (MID) for the outcome. The MIDs are the threshold for 5 appreciable benefits and harms, separated by a zone either side of the line of no effect where there 6 is assumed to be no clinically important effect. If either end of the 95% CI of the overall estimate of 7 effect crossed 1 of the MID lines, imprecision was regarded as serious and a ‘serious’ score of −1 was 8 given. This was because the overall result, as represented by the span of the confidence interval, was 9 consistent with 2 interpretations as defined by the MID (for example, both no clinically important 10 effect and clinical benefit were possible interpretations). If both MID lines were crossed by either or 11 both ends of the 95% CI then imprecision was regarded as very serious and a ‘very serious’ score of 12 −2 was given. This was because the overall result was consistent with all 3 interpretations defined by 13 the MID (no clinically important effect, clinical benefit and clinical harm). This is illustrated in Figure 14 2. As for inconsistency, since the imprecision score was based on the meta-analysis results, the score 15 represented the whole outcome and so weighted averaging across studies was not necessary. 16
The position of the MID lines is ideally determined by values reported in the literature. ‘Anchor-17 based’ methods aim to establish clinically meaningful changes in a continuous outcome variable by 18 relating or ‘anchoring’ them to patient-centred measures of clinical effectiveness that could be 19 regarded as gold standards with a high level of face validity. For example, a MID for an outcome 20 could be defined by the minimum amount of change in that outcome necessary to make patients feel 21 their quality of life had ‘significantly improved’. MIDs in the literature may also be based on expert 22 clinician or consensus opinion concerning the minimum amount of change in a variable deemed to 23 affect quality of life or health. For binary variables, any MIDs reported in the literature will inevitably 24 be based on expert consensus, as such MIDs relate to all-or-nothing population effects rather than 25 measurable effects on an individual, and so are not amenable to patient-centred ‘anchor’ methods. 26
In the absence of values identified in the literature, the alternative approach to deciding on MID 27 levels is the ‘default’ method, as follows: 28
For categorical outcomes the MIDs were taken to be RRs of 0.75 and 1.25. For ‘positive’ outcomes 29 such as ‘patient satisfaction’, the RR of 0.75 is taken as the line denoting the boundary between 30 no clinically important effect and a clinically significant harm, whilst the RR of 1.25 is taken as the 31 line denoting the boundary between no clinically important effect and a clinically significant 32 benefit. For ‘negative’ outcomes such as ‘bleeding’, the opposite occurs, so the RR of 0.75 is taken 33 as the line denoting the boundary between no clinically important effect and a clinically 34 significant benefit, whilst the RR of 1.25 is taken as the line denoting the boundary between no 35 clinically important effect and a clinically significant harm. 36
For mortality any change was considered to be clinically important and the imprecision was 37 assessed on the basis of the whether the confidence intervals crossed the line of no effect, that is 38 whether the result was consistent with both benefit and harm. 39
For continuous outcome variables the MID was taken as half the median baseline standard 40 deviation of that variable, across all studies in the meta-analysis. Hence the MID denoting the 41 minimum clinically significant benefit was positive for a ‘positive’ outcome (for example, a quality 42 of life measure where a higher score denotes better health), and negative for a ‘negative’ 43 outcome (for example, a visual analogue scale [VAS] pain score). Clinically significant harms will be 44 the converse of these. If baseline values are unavailable, then half the median comparator group 45 standard deviation of that variable will be taken as the MID. 46
If standardised mean differences have been used, then the MID will be set at the absolute value 47 of +0.5. This follows because standardised mean differences are mean differences normalised to 48 the pooled standard deviation of the 2 groups, and are thus effectively expressed in units of 49
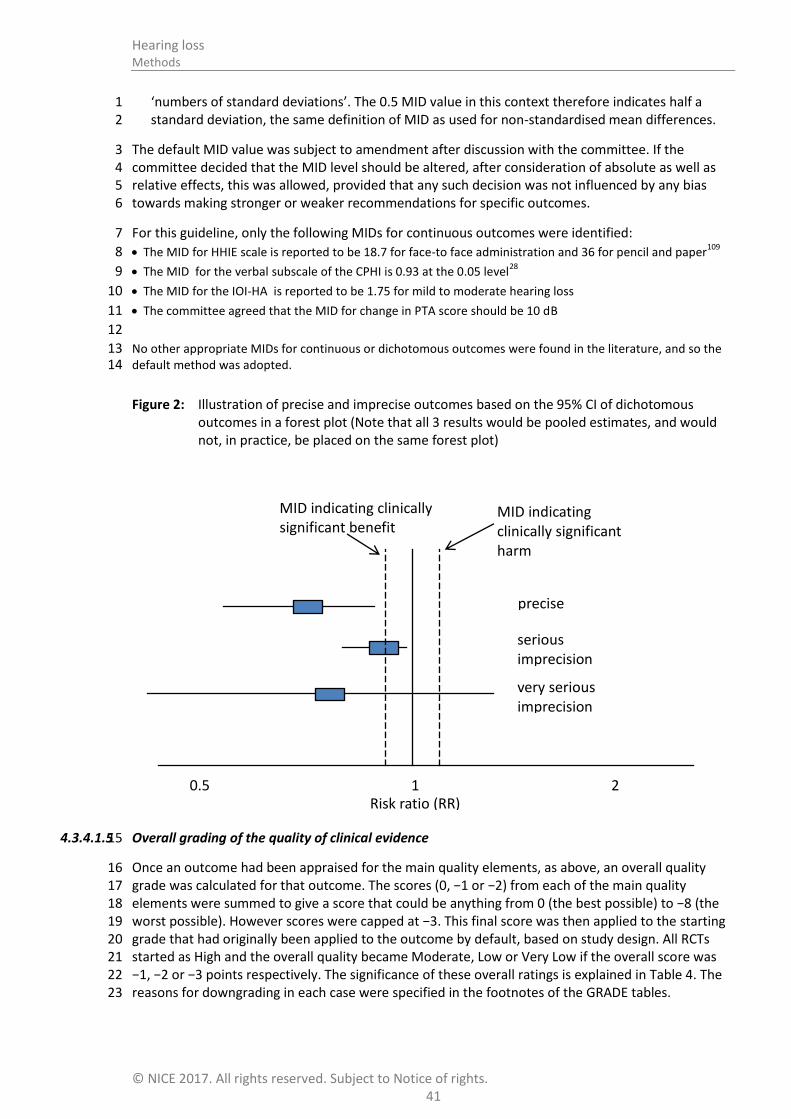
Hearing loss Methods
© NICE 2017. All rights reserved. Subject to Notice of rights. 41
‘numbers of standard deviations’. The 0.5 MID value in this context therefore indicates half a 1 standard deviation, the same definition of MID as used for non-standardised mean differences. 2
The default MID value was subject to amendment after discussion with the committee. If the 3 committee decided that the MID level should be altered, after consideration of absolute as well as 4 relative effects, this was allowed, provided that any such decision was not influenced by any bias 5 towards making stronger or weaker recommendations for specific outcomes. 6
For this guideline, only the following MIDs for continuous outcomes were identified: 7
The MID for HHIE scale is reported to be 18.7 for face-to face administration and 36 for pencil and paper109
8
The MID for the verbal subscale of the CPHI is 0.93 at the 0.05 level28
9
The MID for the IOI-HA is reported to be 1.75 for mild to moderate hearing loss 10
The committee agreed that the MID for change in PTA score should be 10 dB 11
12
No other appropriate MIDs for continuous or dichotomous outcomes were found in the literature, and so the 13 default method was adopted. 14
Figure 2: Illustration of precise and imprecise outcomes based on the 95% CI of dichotomous outcomes in a forest plot (Note that all 3 results would be pooled estimates, and would not, in practice, be placed on the same forest plot)
4.3.4.1.5 Overall grading of the quality of clinical evidence 15
Once an outcome had been appraised for the main quality elements, as above, an overall quality 16 grade was calculated for that outcome. The scores (0, −1 or −2) from each of the main quality 17 elements were summed to give a score that could be anything from 0 (the best possible) to −8 (the 18 worst possible). However scores were capped at −3. This final score was then applied to the starting 19 grade that had originally been applied to the outcome by default, based on study design. All RCTs 20 started as High and the overall quality became Moderate, Low or Very Low if the overall score was 21 −1, −2 or −3 points respectively. The significance of these overall ratings is explained in Table 4. The 22 reasons for downgrading in each case were specified in the footnotes of the GRADE tables. 23
1 2 0.5
MID indicating clinically significant harm
MID indicating clinically significant benefit
precise
serious imprecision
very serious imprecision
Risk ratio (RR)

Hearing loss Methods
© NICE 2017. All rights reserved. Subject to Notice of rights. 42
Non-randomised intervention studies started at Low, and so a score of −1 would be enough to take 1 the grade to the lowest level of Very Low. Non-randomised intervention studies could, however, be 2 upgraded if there was a large magnitude of effect or a dose-response gradient. 3
Table 4: Overall quality of outcome evidence in GRADE 4
Level Description
High Further research is very unlikely to change our confidence in the estimate of effect
Moderate Further research is likely to have an important impact on our confidence in the estimate of effect and may change the estimate
Low Further research is very likely to have an important impact on our confidence in the estimate of effect and is likely to change the estimate
Very low Any estimate of effect is very uncertain
4.3.4.2 Prognostic clinical prediction reviews 5
A modified GRADE methodology was used for clinical prediction studies, considering risk of bias, 6 indirectness, inconsistency and imprecision. 7
Risk prediction studies were evaluated according to the criteria given in Table 5. This table was 8 adapted from the Quality In Prognosis Studies tool (QUIPS) 46
. If data were meta-analysed, the quality 9 for pooled studies was presented. If the data were not pooled, then a quality rating was presented 10 for each study. 11
Table 5: Description of quality elements for prospective studies (adapted from the QUIPS tool) 12
Domain Risk of bias clinical prediction studies Response and score
Selection bias
Was there a lack of reported attempts made to achieve some group comparability between the risk factor and non-risk factor groups? (ignore if 2 or more risk factors considered)
Consider if this was moderate, high or very high risk of bias if answer was ‘yes’.
Was there a lack of consideration of any of the key confounders, or was this unclear?
[Note that if the study can show that a particular confounder was not at risk of causing bias (for example, by being well-matched at baseline between groups), then this confounder does not have to have been adjusted for in a multivariate analysis.]
Exclude.
Was there a lack of consideration of non-key plausible confounders, or was this unclear?
[Note that if the study can show that a particular confounder was not at risk of causing bias (for example, by being well-matched at baseline between groups), then this confounder does not have to have been adjusted for in a multivariate analysis.]
Consider if this was moderate, high or very high risk of bias if answer was ‘yes’.
If the outcome is categorical: Were there <10 events per variable included in the multivariable analysis?
If the outcome is continuous: Were there <10 people per variable included in the multivariable analysis?
Consider if this was moderate, high or very high risk of bias if answer was ‘yes’ to either.
Was it very clear that 1 group was more likely to have had more outcomes occurring at baseline than another group?
Consider if this was moderate, high or very high risk of bias if answer was ‘yes’.
Detection bias
Was there a lack of assessor blinding AND the outcome was not completely objective?
Consider if this was moderate, high or very high risk of bias if answer
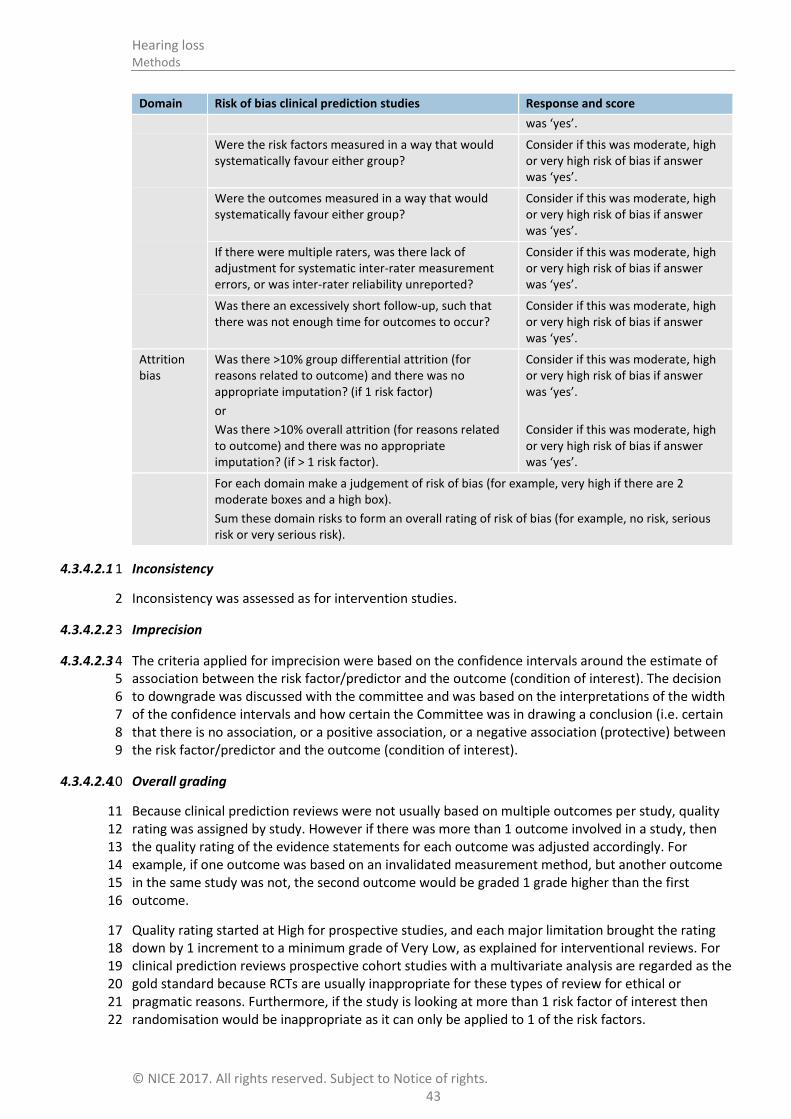
Hearing loss Methods
© NICE 2017. All rights reserved. Subject to Notice of rights. 43
Domain Risk of bias clinical prediction studies Response and score
was ‘yes’.
Were the risk factors measured in a way that would systematically favour either group?
Consider if this was moderate, high or very high risk of bias if answer was ‘yes’.
Were the outcomes measured in a way that would systematically favour either group?
Consider if this was moderate, high or very high risk of bias if answer was ‘yes’.
If there were multiple raters, was there lack of adjustment for systematic inter-rater measurement errors, or was inter-rater reliability unreported?
Consider if this was moderate, high or very high risk of bias if answer was ‘yes’.
Was there an excessively short follow-up, such that there was not enough time for outcomes to occur?
Consider if this was moderate, high or very high risk of bias if answer was ‘yes’.
Attrition bias
Was there >10% group differential attrition (for reasons related to outcome) and there was no appropriate imputation? (if 1 risk factor)
or
Was there >10% overall attrition (for reasons related to outcome) and there was no appropriate imputation? (if > 1 risk factor).
Consider if this was moderate, high or very high risk of bias if answer was ‘yes’.
Consider if this was moderate, high or very high risk of bias if answer was ‘yes’.
For each domain make a judgement of risk of bias (for example, very high if there are 2 moderate boxes and a high box).
Sum these domain risks to form an overall rating of risk of bias (for example, no risk, serious risk or very serious risk).
4.3.4.2.1 Inconsistency 1
Inconsistency was assessed as for intervention studies. 2
4.3.4.2.2 Imprecision 3
4.3.4.2.3 The criteria applied for imprecision were based on the confidence intervals around the estimate of 4 association between the risk factor/predictor and the outcome (condition of interest). The decision 5 to downgrade was discussed with the committee and was based on the interpretations of the width 6 of the confidence intervals and how certain the Committee was in drawing a conclusion (i.e. certain 7 that there is no association, or a positive association, or a negative association (protective) between 8 the risk factor/predictor and the outcome (condition of interest). 9
4.3.4.2.4 Overall grading 10
Because clinical prediction reviews were not usually based on multiple outcomes per study, quality 11 rating was assigned by study. However if there was more than 1 outcome involved in a study, then 12 the quality rating of the evidence statements for each outcome was adjusted accordingly. For 13 example, if one outcome was based on an invalidated measurement method, but another outcome 14 in the same study was not, the second outcome would be graded 1 grade higher than the first 15 outcome. 16
Quality rating started at High for prospective studies, and each major limitation brought the rating 17 down by 1 increment to a minimum grade of Very Low, as explained for interventional reviews. For 18 clinical prediction reviews prospective cohort studies with a multivariate analysis are regarded as the 19 gold standard because RCTs are usually inappropriate for these types of review for ethical or 20 pragmatic reasons. Furthermore, if the study is looking at more than 1 risk factor of interest then 21 randomisation would be inappropriate as it can only be applied to 1 of the risk factors. 22

Hearing loss Methods
© NICE 2017. All rights reserved. Subject to Notice of rights. 44
4.3.4.3 Diagnostic studies 1
Risk of bias and indirectness of evidence for diagnostic data were evaluated by study using the 2 Quality Assessment of Diagnostic Accuracy Studies version 2 (QUADAS-2) checklists (see appendix H 3 in the NICE guidelines manual 201471). Risk of bias and applicability in primary diagnostic accuracy 4 studies in QUADAS-2 consists of 4 domains (see Table 6): 5
patient selection 6
index test 7
reference standard 8
flow and timing. 9
Table 6: Summary of QUADAS-2 with list of signalling, risk of bias and applicability questions 10
Domain Patient selection Index test Reference standard Flow and timing
Description Describe methods of patient selection. Describe included patients (prior testing, presentation, intended use of index test and setting)
Describe the index test and how it was conducted and interpreted
Describe the reference standard and how it was conducted and interpreted
Describe any patients who did not receive the index test(s) and/or reference standard or who were excluded from the 2×2 table (refer to flow diagram). Describe the time interval and any interventions between index test(s) and reference standard
Signalling questions (yes/no/ unclear)
Was a consecutive or random sample of patients enrolled?
Were the index test results interpreted without knowledge of the results of the reference standard?
Is the reference standard likely to correctly classify the target condition?
Was there an appropriate interval between index test(s) and reference standard?
Was a case–control design avoided?
If a threshold was used, was it pre-specified?
Were the reference standard results interpreted without knowledge of the results of the index test?
Did all patients receive a reference standard?
Did the study avoid inappropriate exclusions?
Did all patients receive the same reference standard?
Were all patients included in the analysis?
Risk of bias; (high/low/ unclear)
Could the selection of patients have introduced bias?
Could the conduct or interpretation of the index test have introduced bias?
Could the reference standard, its conduct or its interpretation have introduced bias?
Could the patient flow have introduced bias?
Concerns regarding applicability (high/low/ unclear)
Are there concerns that the included patients do not match the review question?
Are there concerns that the index test, its conduct, or interpretation differ from the review question?
Are there concerns that the target condition as defined by the reference standard does not match the review question?

Hearing loss Methods
© NICE 2017. All rights reserved. Subject to Notice of rights. 45
4.3.4.3.1 Inconsistency 1
Inconsistency was assessed by inspection of the sensitivity or specificity (based on the most 2 important outcome for each particular review question) using the point estimates and 95% CIs of the 3 individual studies on the forest plots. Particular attention was placed on values above or below 50% 4 (diagnosis based on chance alone) and the threshold set by the committee (the threshold above 5 which it would be acceptable to recommend a test). The evidence was downgraded by 1 increment if 6 the individual studies varied across 2 areas [(for example, 50–90% and 90–100%)] and by 2 7 increments if the individual studies varied across 3 areas [(for example, 0–50%, 50–90% and 90–8 100%)]. Reasons for heterogeneity between studies included the populations which varied in the 9 proportions of people presenting with hearing loss and other audiovestibular symptoms, different 10 definitions of the target condition and different methods of testing. 11
4.3.4.3.2 Imprecision 12
The judgement of precision was based on visual inspection of the confidence region around the 13 summary sensitivity and specificity point from the diagnostic meta-analysis, if a diagnostic meta-14 analysis was conducted. Where a diagnostic meta-analysis was not conducted, imprecision was 15 assessed according to the range of point estimates or, if only one study contributed to the evidence, 16 the 95% CI around the single study. As a general rule (after discussion with the committee) a 17 variation of 0–20% was considered precise, 20–40% serious imprecision, and >40% very serious 18 imprecision. Imprecision was assessed on the primary outcome measure for decision-making. 19
4.3.4.3.3 Overall grading 20
Quality rating started at High for prospective and retrospective cross-sectional studies, and each 21 major limitation (risk of bias, indirectness, inconsistency and imprecision) brought the rating down by 22 1 increment to a minimum grade of Very Low, as explained for intervention reviews. 23
4.3.4.4 Qualitative reviews 24
Review findings from the included qualitative studies were evaluated and presented using the 25 ‘Confidence in the Evidence from Reviews of Qualitative Research’ (CERQual) Approach developed by 26 the GRADE-CERQual Project Group, a subgroup of the GRADE Working Group. 27
The CERQual Approach assesses the extent to which a review finding is a reasonable representation 28 of the phenomenon of interest (the focus of the review question). Each review finding was assessed 29 for each of the 4 quality elements listed and defined below in Table 7. 30
Table 7: Description of quality elements in GRADE-CERQual for qualitative studies 31
Quality element Description
Methodological limitations
The extent of problems in the design or conduct of the included studies that could decrease the confidence that the review finding is a reasonable representation of the phenomenon of interest. Assessed at the study level using an NGC checklist.
Coherence The extent to which the reviewer is able to identify a clear pattern across the studies included in the review.
Relevance The extent to which the body of evidence from the included studies is applicable to the context (study population, phenomenon of interest, setting) specified in the protocol.
Adequacy The degree of the confidence that the review finding is being supported by sufficient data. This is an overall determination of the richness (depth of analysis) and quantity of the evidence supporting a review finding or theme.
Details of how the 4 quality elements (methodological limitations, coherence, relevance and 32 adequacy) were appraised for each review finding are given below. 33
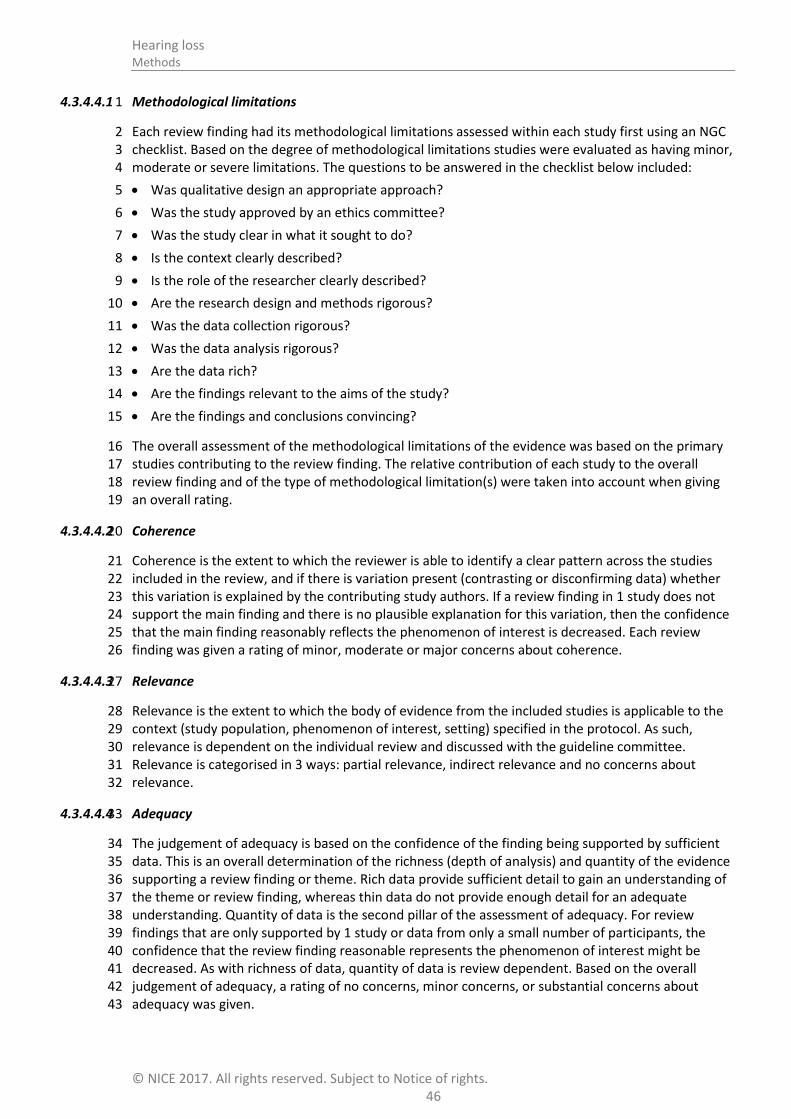
Hearing loss Methods
© NICE 2017. All rights reserved. Subject to Notice of rights. 46
4.3.4.4.1 Methodological limitations 1
Each review finding had its methodological limitations assessed within each study first using an NGC 2 checklist. Based on the degree of methodological limitations studies were evaluated as having minor, 3 moderate or severe limitations. The questions to be answered in the checklist below included: 4
Was qualitative design an appropriate approach? 5
Was the study approved by an ethics committee? 6
Was the study clear in what it sought to do? 7
Is the context clearly described? 8
Is the role of the researcher clearly described? 9
Are the research design and methods rigorous? 10
Was the data collection rigorous? 11
Was the data analysis rigorous? 12
Are the data rich? 13
Are the findings relevant to the aims of the study? 14
Are the findings and conclusions convincing? 15
The overall assessment of the methodological limitations of the evidence was based on the primary 16 studies contributing to the review finding. The relative contribution of each study to the overall 17 review finding and of the type of methodological limitation(s) were taken into account when giving 18 an overall rating. 19
4.3.4.4.2 Coherence 20
Coherence is the extent to which the reviewer is able to identify a clear pattern across the studies 21 included in the review, and if there is variation present (contrasting or disconfirming data) whether 22 this variation is explained by the contributing study authors. If a review finding in 1 study does not 23 support the main finding and there is no plausible explanation for this variation, then the confidence 24 that the main finding reasonably reflects the phenomenon of interest is decreased. Each review 25 finding was given a rating of minor, moderate or major concerns about coherence. 26
4.3.4.4.3 Relevance 27
Relevance is the extent to which the body of evidence from the included studies is applicable to the 28 context (study population, phenomenon of interest, setting) specified in the protocol. As such, 29 relevance is dependent on the individual review and discussed with the guideline committee. 30 Relevance is categorised in 3 ways: partial relevance, indirect relevance and no concerns about 31 relevance. 32
4.3.4.4.4 Adequacy 33
The judgement of adequacy is based on the confidence of the finding being supported by sufficient 34 data. This is an overall determination of the richness (depth of analysis) and quantity of the evidence 35 supporting a review finding or theme. Rich data provide sufficient detail to gain an understanding of 36 the theme or review finding, whereas thin data do not provide enough detail for an adequate 37 understanding. Quantity of data is the second pillar of the assessment of adequacy. For review 38 findings that are only supported by 1 study or data from only a small number of participants, the 39 confidence that the review finding reasonable represents the phenomenon of interest might be 40 decreased. As with richness of data, quantity of data is review dependent. Based on the overall 41 judgement of adequacy, a rating of no concerns, minor concerns, or substantial concerns about 42 adequacy was given. 43

Hearing loss Methods
© NICE 2017. All rights reserved. Subject to Notice of rights. 47
4.3.4.4.5 Overall judgement of the level of confidence for a review finding 1
GRADE-CERQual is used to assess the body of evidence as a whole through a confidence rating 2 representing the extent to which a review finding is a reasonable representation of the phenomenon 3 of interest. The 4 components (methodological limitations, coherence, relevance and adequacy) are 4 used in combination to form an overall judgement. GRADE-CERQual uses 4 levels of confidence: high, 5 moderate, low and very low confidence. The significance of these overall ratings is explained in Table 6 8. Each review finding starts at a high level of confidence and is downgraded based on the concerns 7 identified in any 1 or more of the 4 components. Quality assessment of qualitative reviews is a 8 subjective judgement by the reviewer based on the concerns that have been noted. A detailed 9 explanation of how such a judgement had been made was included in the narrative summary. 10
Table 8: Overall level of confidence for a review finding in GRADE-CERQual 11
Level Description
High confidence It is highly likely that the review finding is a reasonable representation of the phenomenon of interest.
Moderate confidence
It is likely that the review finding is a reasonable representation of the phenomenon of interest.
Low confidence It is possible that the review finding is a reasonable representation of the phenomenon of interest.
Very low confidence
It is not clear whether the review finding is a reasonable representation of the phenomenon of interest.
4.3.5 Assessing clinical importance 12
The committee assessed the evidence by outcome in order to determine if there was, or potentially 13 was, a clinically important benefit, a clinically important harm or no clinically important difference 14 between interventions. To facilitate this, binary outcomes were converted into absolute risk 15 differences (ARDs) using GRADEpro41 software: the median control group risk across studies was 16 used to calculate the ARD and its 95% CI from the pooled risk ratio. 17
The assessment of clinical benefit, harm, or no benefit or harm was based on the point estimate of 18 absolute effect for intervention studies, which was standardised across the reviews. The committee 19 considered for most of the outcomes in the intervention reviews that if at least 100 more 20 participants per 1000 (10%) achieved the outcome of interest in the intervention group compared to 21 the comparison group for a positive outcome then this intervention was considered beneficial. The 22 same point estimate but in the opposite direction applied for a negative outcome. For the critical 23 outcome of mortality any reduction represented a clinical benefit. For adverse events 50 events (20 24 for the ear wax review) or more per 1000 (5%) represented clinical harm. For continuous outcomes if 25 the mean difference was greater than the minimally important difference (MID) then this 26 represented a clinical benefit or harm. Where an SMD is used, this was converted back to mean 27 difference into the units of one of scales (for example one that is most commonly used or more 28 meaningful). Then the committee discussed whether the change in score represented a clinically 29 important difference based on the change relative to the mean in the control group and to the 30 number of points on the scale. For outcomes such as mortality any reduction or increase was 31 considered to be clinically important. 32
This assessment was carried out by the committee for each outcome of interest, and an evidence 33 summary table was produced to compile the committee’s assessments of clinical importance per 34 outcome, alongside the evidence quality and the uncertainty in the effect estimate (imprecision). 35

Hearing loss Methods
© NICE 2017. All rights reserved. Subject to Notice of rights. 48
4.3.6 Clinical evidence statements 1
Clinical evidence statements are summary statements that are included in each review chapter, and 2 which summarise the key features of the clinical effectiveness evidence presented. The wording of 3 the evidence statements reflects the certainty or uncertainty in the estimate of effect. The evidence 4 statements are presented by outcome and encompass the following key features of the evidence: 5
The number of studies and the number of participants for a particular outcome. 6
An indication of the direction of clinical importance (if one treatment is beneficial or harmful 7 compared to the other, or whether there is no difference between the 2 tested treatments). 8
A description of the overall quality of the evidence (GRADE overall quality). 9
Identifying and analysing evidence of cost effectiveness 4.410
The committee is required to make decisions based on the best available evidence of both clinical 11 effectiveness and cost effectiveness. Guideline recommendations should be based on the expected 12 costs of the different options in relation to their expected health benefits (that is, their ‘cost 13 effectiveness’) rather than the total implementation cost. However, the committee will also need to 14 be increasingly confident in the cost effectiveness of a recommendation as the cost of 15 implementation increases. Therefore, the committee may require more robust evidence on the 16 effectiveness and cost effectiveness of any recommendations that are expected to have a substantial 17 impact on resources; any uncertainties must be offset by a compelling argument in favour of the 18 recommendation. The cost impact or savings potential of a recommendation should not be the sole 19 reason for the committee’s decision.71 20
Health economic evidence was sought relating to the key clinical issues being addressed in the 21 guideline. Health economists: 22
Undertook a systematic review of the published economic literature. 23
Undertook new cost-effectiveness analysis in priority areas. 24
4.4.1 Literature review 25
The health economists: 26
Identified potentially relevant studies for each review question from the health economic search 27 results by reviewing titles and abstracts. Full papers were then obtained. 28
Reviewed full papers against prespecified inclusion and exclusion criteria to identify relevant 29 studies (see below for details). 30
Critically appraised relevant studies using economic evaluations checklists as specified in the NICE 31 guidelines manual.71 32
Extracted key information about the studies’ methods and results into health economic evidence 33 tables (included in appendix I). 34
Generated summaries of the evidence in NICE health economic evidence profile tables (included 35 in the relevant chapter for each review question) – see below for details. 36
4.4.1.1 Inclusion and exclusion criteria 37
Full economic evaluations (studies comparing costs and health consequences of alternative courses 38 of action: cost–utility, cost-effectiveness, cost–benefit and cost–consequences analyses) and 39 comparative costing studies that addressed the review question in the relevant population were 40 considered potentially includable as health economic evidence. 41

Hearing loss Methods
© NICE 2017. All rights reserved. Subject to Notice of rights. 49
Studies that only reported cost per hospital (not per patient), or only reported average cost 1 effectiveness without disaggregated costs and effects were excluded. Literature reviews, abstracts, 2 posters, letters, editorials, comment articles, unpublished studies and studies not in English were 3 excluded. Studies published before 2001 and studies from non-OECD countries or the USA were also 4 excluded, on the basis that the applicability of such studies to the present UK NHS context is likely to 5 be too low for them to be helpful for decision-making. 6
For more details about the assessment of applicability and methodological quality see Table 9 below 7 and the economic evaluation checklist (appendix H of the NICE guidelines manual71) and the health 8 economics review protocol in appendix D. 9
When no relevant health economic studies were found from the health economic literature review, 10 relevant UK NHS unit costs related to the compared interventions were presented to the committee 11 to inform the possible economic implications of the recommendations. 12
4.4.1.2 NICE health economic evidence profiles 13
NICE health economic evidence profile tables were used to summarise cost and cost-effectiveness 14 estimates for the included health economic studies in each review chapter. The health economic 15 evidence profile shows an assessment of applicability and methodological quality for each economic 16 study, with footnotes indicating the reasons for the assessment. These assessments were made by 17 the health economist using the economic evaluation checklist from the NICE guidelines manual.71 It 18 also shows the incremental costs, incremental effects (for example, quality-adjusted life years 19 [QALYs]) and incremental cost-effectiveness ratio (ICER) for the base case analysis in the study, as 20 well as information about the assessment of uncertainty in the analysis. See Table 9 for more details. 21
When a non-UK study was included in the profile, the results were converted into pounds sterling 22 using the appropriate purchasing power parity.80 23
Table 9: Content of NICE health economic evidence profile 24
Item Description
Study Surname of first author, date of study publication and country perspective with a reference to full information on the study.
Applicability An assessment of applicability of the study to this guideline, the current NHS situation and NICE decision-making:
(a)
Directly applicable – the study meets all applicability criteria, or fails to meet 1 or more applicability criteria but this is unlikely to change the conclusions about cost effectiveness.
Partially applicable – the study fails to meet 1 or more applicability criteria, and this could change the conclusions about cost effectiveness.
Not applicable – the study fails to meet 1 or more of the applicability criteria, and this is likely to change the conclusions about cost effectiveness. Such studies would usually be excluded from the review.
Limitations An assessment of methodological quality of the study:(a)
Minor limitations – the study meets all quality criteria, or fails to meet 1 or more quality criteria, but this is unlikely to change the conclusions about cost effectiveness.
Potentially serious limitations – the study fails to meet 1 or more quality criteria, and this could change the conclusions about cost effectiveness.
Very serious limitations – the study fails to meet 1 or more quality criteria, and this is highly likely to change the conclusions about cost effectiveness. Such studies would usually be excluded from the review.
Other comments Information about the design of the study and particular issues that should be

Hearing loss Methods
© NICE 2017. All rights reserved. Subject to Notice of rights. 50
Item Description
considered when interpreting it.
Incremental cost The mean cost associated with a strategy minus the mean cost of a comparator strategy.
Incremental effects The mean QALYs (or other selected measure of health outcome) associated with a strategy minus the mean QALYs of a comparator strategy.
Cost effectiveness Incremental cost-effectiveness ratio (ICER): the incremental cost divided by the incremental effects (usually in £ per QALY gained).
Uncertainty A summary of the extent of uncertainty about the ICER reflecting the results of deterministic or probabilistic sensitivity analyses, or stochastic analyses of trial data, as appropriate.
(a) Applicability and limitations were assessed using the economic evaluation checklist in appendix H of the NICE guidelines 1 manual
71 2
4.4.2 Undertaking new health economic analysis 3
As well as reviewing the published health economic literature for each review question, as described 4 above, new health economic analysis was undertaken by the health economist in selected areas. 5 Priority areas for new analysis were agreed by the committee after formation of the review 6 questions and consideration of the existing health economic evidence. 7
The committee identified the following as the highest priority questions for original health economic 8 modelling: 9
What is the clinical and cost effectiveness of early versus delayed management of hearing loss on 10 patient outcomes? 11
What is the clinical and cost effectiveness of hearing aids for mild to moderate hearing loss in 12 adults who have been prescribed at least 1 hearing aid? 13
What is the clinical and cost effectiveness of fitting 1 hearing aid compared with fitting 2 hearing 14 aids for people when both ears have an aidable hearing loss? 15
These questions were chosen due to the very large number of people in England using or who could 16 benefit from hearing aids (and hence their high annual cost), and the existence of sufficient clinical 17 and economic data for original analyses to be conducted on these questions. 18
The following general principles were adhered to in developing the cost-effectiveness analyses: 19
case for interventions with health outcomes in NHS settings.71 ,73 20
The committee was involved in the design of the model, selection of inputs and interpretation of 21 the results. 22
Model inputs were based on the systematic review of the clinical literature supplemented with 23 other published data sources where possible. 24
When published data were not available committee expert opinion was used to populate the 25 model. 26
Model inputs and assumptions were reported fully and transparently. 27
The results were subject to sensitivity analysis and limitations were discussed. 28
The model was peer-reviewed by another health economist at the NGC. 29
Full methods for the cost-effectiveness analysis for early versus delayed management of hearing loss 30 are described in appendix N, and for the cost-threshold analysis are described in section 15.2.2.2. 31

Hearing loss Methods
© NICE 2017. All rights reserved. Subject to Notice of rights. 51
4.4.3 Cost-effectiveness criteria 1
NICE’s report ‘Social value judgements: principles for the development of NICE guidance’ sets out the 2 principles that committees should consider when judging whether an intervention offers good value 3 for money.72 In general, an intervention was considered to be cost effective (given that the estimate 4 was considered plausible) if either of the following criteria applied: 5
the intervention dominated other relevant strategies (that is, it was both less costly in terms of 6 resource use and more clinically effective compared with all the other relevant alternative 7 strategies), or 8
the intervention cost less than £20,000 per QALY gained compared with the next best strategy. 9
If the committee recommended an intervention that was estimated to cost more than £20,000 per 10 QALY gained, or did not recommend one that was estimated to cost less than £20,000 per QALY 11 gained, the reasons for this decision are discussed explicitly in the ‘Recommendations and link to 12 evidence’ section of the relevant chapter, with reference to issues regarding the plausibility of the 13 estimate or to the factors set out in ‘Social value judgements: principles for the development of NICE 14 guidance’.72 15
When QALYs or life years gained are not used in the analysis, results are difficult to interpret unless 16 one strategy dominates the others with respect to every relevant health outcome and cost. 17
4.4.4 In the absence of health economic evidence 18
When no relevant published health economic studies were found, and a new analysis was not 19 prioritised, the committee made a qualitative judgement about cost effectiveness by considering 20 expected differences in resource use between options and relevant UK NHS unit costs, alongside the 21 results of the review of clinical effectiveness evidence. 22
The UK NHS costs reported in the guideline are those that were presented to the committee and 23 were correct at the time recommendations were drafted. They may have changed subsequently 24 before the time of publication. However, we have no reason to believe they have changed 25 substantially. 26
Developing recommendations 4.527
Over the course of the guideline development process, the committee was presented with: 28
Evidence tables of the clinical and health economic evidence reviewed from the literature. All 29 evidence tables are in appendices H and I. 30
Summaries of clinical and health economic evidence and quality (as presented in chapters 5–19). 31
Forest plots (appendix K). 32
A description of the methods and results of the cost-effectiveness analyses undertaken for the 33 guideline (appendix N and chapter 15). 34
Recommendations were drafted on the basis of the committee’s interpretation of the available 35 evidence, taking into account the balance of benefits, harms and costs between different courses of 36 action. This was either done formally in an economic model, or informally. Firstly, the net clinical 37 benefit over harm (clinical effectiveness) was considered, focusing on the critical outcomes. When 38 this was done informally, the committee took into account the clinical benefits and harms when one 39 intervention was compared with another. The assessment of net clinical benefit was moderated by 40 the importance placed on the outcomes (the committee’s values and preferences), and the 41 confidence the committee had in the evidence (evidence quality). Secondly, the committee assessed 42 whether the net clinical benefit justified any differences in costs between the alternative 43 interventions. 44

Hearing loss Methods
© NICE 2017. All rights reserved. Subject to Notice of rights. 52
When clinical and health economic evidence was of poor quality, conflicting or absent, the 1 committee drafted recommendations based on its expert opinion. The considerations for making 2 consensus-based recommendations include the balance between potential harms and benefits, the 3 economic costs compared to the economic benefits, current practices, recommendations made in 4 other relevant guidelines, patient preferences and equality issues. The consensus recommendations 5 were agreed through discussions in the committee. The committee also considered whether the 6 uncertainty was sufficient to justify delaying making a recommendation to await further research, 7 taking into account the potential harm of failing to make a clear recommendation (see section 4.5.1 8 below). 9
The committee considered the appropriate ‘strength’ of each recommendation. This takes into 10 account the quality of the evidence but is conceptually different. Some recommendations are 11 ’strong’ in that the committee believes that the vast majority of healthcare and other professionals 12 and patients would choose a particular intervention if they considered the evidence in the same way 13 that the committee has. This is generally the case if the benefits clearly outweigh the harms for most 14 people and the intervention is likely to be cost effective. However, there is often a closer balance 15 between benefits and harms, and some patients would not choose an intervention whereas others 16 would. This may happen, for example, if some patients are particularly averse to some side effect 17 and others are not. In these circumstances the recommendation is generally weaker, although it may 18 be possible to make stronger recommendations about specific groups of patients. 19
The committee focused on the following factors in agreeing the wording of the recommendations: 20
The actions health professionals need to take. 21
The information readers need to know. 22
The strength of the recommendation (for example the word ‘offer’ was used for strong 23 recommendations and ‘consider’ for weaker recommendations). 24
The involvement of patients (and their carers if needed) in decisions on treatment and care. 25
Consistency with NICE’s standard advice on recommendations about drugs, waiting times and 26 ineffective interventions (see section 9.2 in the NICE guidelines manual71). 27
The main considerations specific to each recommendation are outlined in the ‘Recommendations 28 and link to evidence’ sections within each chapter. 29
4.5.1 Research recommendations 30
When areas were identified for which good evidence was lacking, the committee considered making 31 recommendations for future research. Decisions about the inclusion of a research recommendation 32 were based on factors such as: 33
the importance to patients or the population 34
national priorities 35
potential impact on the NHS and future NICE guidance 36
ethical and technical feasibility. 37
4.5.2 Validation process 38
This guidance is subject to a 6-week public consultation and feedback as part of the quality assurance 39 and peer review of the document. All comments received from registered stakeholders are 40 responded to in turn and posted on the NICE website. 41

Hearing loss Methods
© NICE 2017. All rights reserved. Subject to Notice of rights. 53
4.5.3 Updating the guideline 1
Following publication, and in accordance with the NICE guidelines manual, NICE will undertake a 2 review of whether the evidence base has progressed significantly to alter the guideline 3 recommendations and warrant an update. 4
4.5.4 Disclaimer 5
Healthcare providers need to use clinical judgement, knowledge and expertise when deciding 6 whether it is appropriate to apply guidelines. The recommendations cited here are a guide and may 7 not be appropriate for use in all situations. The decision to adopt any of the recommendations cited 8 here must be made by practitioners in light of individual patient circumstances, the wishes of the 9 patient, clinical expertise and resources. 10
The National Guideline Centre disclaims any responsibility for damages arising out of the use or non-11 use of this guideline and the literature used in support of this guideline. 12
4.5.5 Funding 13
The National Guideline Centre was commissioned by the National Institute for Health and Care 14 Excellence to undertake the work on this guideline. 15

Hearing loss Urgent and routine referral
© NICE 2017. All rights reserved. Subject to Notice of rights. 54
5 Urgent and routine referral 1
Introduction 5.12
The majority of hearing loss occurs as a consequence of aging and excessive noise exposure; 3 conditions for which there are no specific treatments that will change the outcome with respect to 4 the hearing loss or the cause. There are, however, other causes of hearing loss where the underlying 5 cause needs specific treatment, such as autoimmune diseases or Meniere’s disease; or where 6 surgery is required to correct an abnormality, such as conductive hearing loss in otosclerosis or a 7 perforated ear drum; or to remove a tumour or chronic infection. These cases are in the minority but 8 for these patients timely medical care can make a significant difference to the prognosis of their 9 hearing loss or of their underlying general medical problem. In rare cases, such as necrotising otitis 10 externa, delay can result in death rather than recovery. 11
There are several clinical guidelines for GPs and audiologists outlining the circumstances in which 12 they should consider referral for more specialist medical care – for example the British Academy of 13 Audiologists’ Guidance for Audiologists and for Primary Care which reflect a broad clinical consensus. 14 However, there remains wide regional variation in both guidance and practice in the UK and 15 unnecessary delay in care is frequently encountered. 16
The review questions in this chapter have been investigated with the aim of helping primary 17 healthcare professionals and audiologists decide which symptoms and signs would indicate the need 18 for more specialist medical assessment and with what degree of urgency. Clear national guidance 19 may reduce disparities in care and improve the outcomes for people with causes of hearing loss that 20 require specific treatment. Defining those who should be seen in secondary care, may also avoid 21 people having several referrals before being seen by the correct team. 22
Review question: What are the signs and symptoms that allow early 5.223
recognition of hearing loss needing immediate or urgent referral to 24
a secondary care specialist? 25
For full details see review protocol in appendix C. 26
The objective is to determine the diagnostic accuracy of specific signs and symptoms associated with 27 hearing loss that may be indicative of serious underlying conditions such as stroke, autoimmune 28 diseases or severe infections (see list in Table 10) and which require urgent referral for specialist 29 care. 30
Table 10: Characteristics of review question 31
Population Adults (18 years and over) presenting with hearing loss
Prognostic variables under consideration
Sudden onset
Rapid progression
Cranial nerve involvement (or CNS symptoms), for example, facial paralysis, diplopia, speech and swallowing difficulties (bulbar paralysis)
Vertigo (sudden onset)
Recent-onset unilateral hearing loss
Additional systemic symptoms (skin, eye problems, joint problems, symptoms suggestive of autoimmune disease)
Severe pain with comorbid conditions, for example, diabetes
Spontaneous bleeding from ear (exclude malignancy)

Hearing loss Urgent and routine referral
© NICE 2017. All rights reserved. Subject to Notice of rights. 55
Confounding factors
For studies reporting odds ratios, the following factors have been identified as key confounders and papers should include a multivariable analysis that adjusts for at least some of these confounders:
Earwax
Otitis externa (ordinary)
Ear infections
Middle ear effusion (due to infection, flight or diving)
Meniere’s disease
Multiple sclerosis
Outcomes Malignant or necrotising otitis externa, otitis media with facial nerve impairment,
Rapidly progressing cholesteatoma
Rapidly growing vestibular schwannoma
Nasopharyngeal cancer and intracranial tumours
Stroke
Long-term neurological damage
Autoimmune disease
Study design Prospective and retrospective cohort studies, cross-sectional studies
Systematic reviews of the above
5.2.1 Clinical evidence 1
No relevant clinical studies were identified. See study selection flow chart in appendix E and the 2 excluded studies list in appendix L. 3
5.2.2 Economic evidence 4
No relevant economic evaluations were identified. 5
See also the economic article selection flow chart in appendix F. 6
5.2.3 Evidence statements 7
Clinical 8
No relevant published evidence was identified. 9
Economic 10
No relevant economic evaluations were identified. 11
5.2.4 Recommendations and link to evidence 12
Recommendations 1. Refer adults with sudden or rapid onset of hearing loss that is not explained by external or middle ear causes as follows.
If the hearing loss developed suddenly (over a period of 3 days or less) within the past 30 days, refer immediately to an ear, nose and throat service or an emergency department.
If the hearing loss developed suddenly more than 30 days ago, refer urgently to an ear, nose and throat or audiovestibular medicine service.
If the hearing loss developed rapidly (over a period of 4 to 90 days)
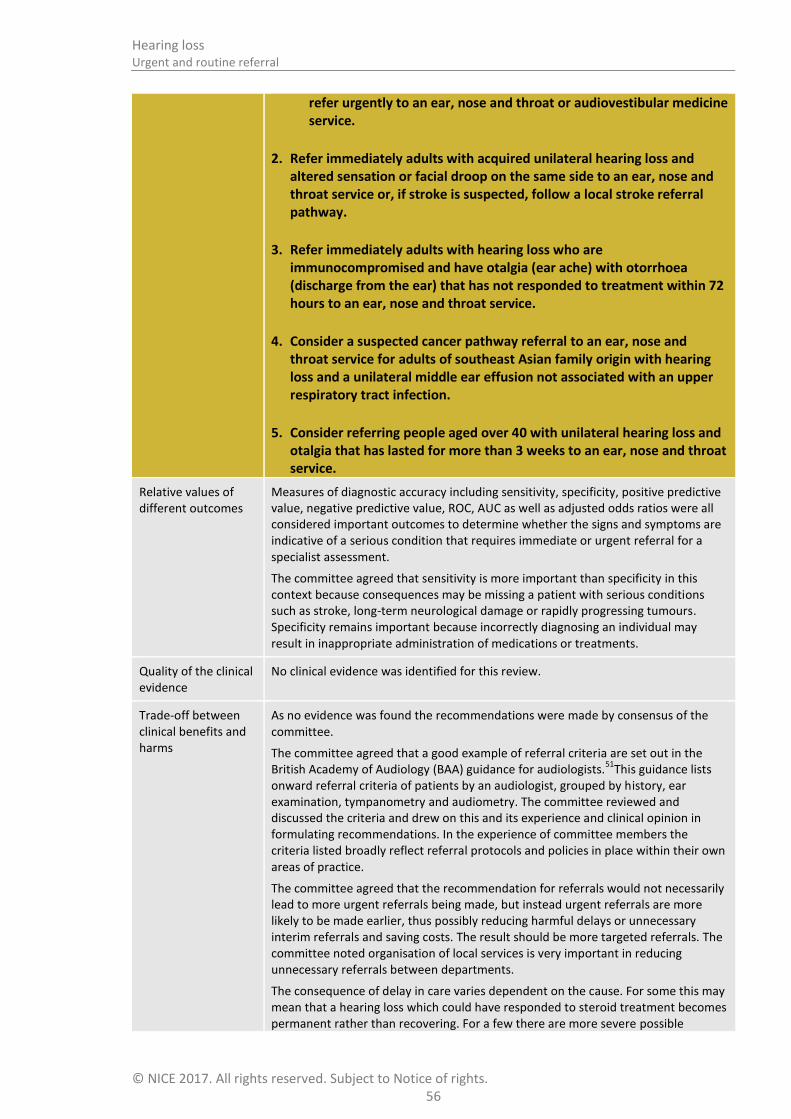
Hearing loss Urgent and routine referral
© NICE 2017. All rights reserved. Subject to Notice of rights. 56
refer urgently to an ear, nose and throat or audiovestibular medicine service.
2. Refer immediately adults with acquired unilateral hearing loss and altered sensation or facial droop on the same side to an ear, nose and throat service or, if stroke is suspected, follow a local stroke referral pathway.
3. Refer immediately adults with hearing loss who are immunocompromised and have otalgia (ear ache) with otorrhoea (discharge from the ear) that has not responded to treatment within 72 hours to an ear, nose and throat service.
4. Consider a suspected cancer pathway referral to an ear, nose and throat service for adults of southeast Asian family origin with hearing loss and a unilateral middle ear effusion not associated with an upper respiratory tract infection.
5. Consider referring people aged over 40 with unilateral hearing loss and otalgia that has lasted for more than 3 weeks to an ear, nose and throat service.
Relative values of different outcomes
Measures of diagnostic accuracy including sensitivity, specificity, positive predictive value, negative predictive value, ROC, AUC as well as adjusted odds ratios were all considered important outcomes to determine whether the signs and symptoms are indicative of a serious condition that requires immediate or urgent referral for a specialist assessment.
The committee agreed that sensitivity is more important than specificity in this context because consequences may be missing a patient with serious conditions such as stroke, long-term neurological damage or rapidly progressing tumours. Specificity remains important because incorrectly diagnosing an individual may result in inappropriate administration of medications or treatments.
Quality of the clinical evidence
No clinical evidence was identified for this review.
Trade-off between clinical benefits and harms
As no evidence was found the recommendations were made by consensus of the committee.
The committee agreed that a good example of referral criteria are set out in the British Academy of Audiology (BAA) guidance for audiologists.
51This guidance lists
onward referral criteria of patients by an audiologist, grouped by history, ear examination, tympanometry and audiometry. The committee reviewed and discussed the criteria and drew on this and its experience and clinical opinion in formulating recommendations. In the experience of committee members the criteria listed broadly reflect referral protocols and policies in place within their own areas of practice.
The committee agreed that the recommendation for referrals would not necessarily lead to more urgent referrals being made, but instead urgent referrals are more likely to be made earlier, thus possibly reducing harmful delays or unnecessary interim referrals and saving costs. The result should be more targeted referrals. The committee noted organisation of local services is very important in reducing unnecessary referrals between departments.
The consequence of delay in care varies dependent on the cause. For some this may mean that a hearing loss which could have responded to steroid treatment becomes permanent rather than recovering. For a few there are more severe possible

Hearing loss Urgent and routine referral
© NICE 2017. All rights reserved. Subject to Notice of rights. 57
consequences of delay: a stroke may be missed and further stokes could lead to permanent brain damage or death, autoimmune disease may not be treated promptly leading to serious sequelae such as aortitis or visual loss, if the cause of a sudden loss is bleeding into a vestibular schwannoma this could lead to brain stem compression and permanent neurological difficulties and , if the problem is necrotising otitis externa then delay usually results in death. Most of these problems are likely to be picked up eventually and treatment given but the permanent damage could be worse than if early treatment is given.
Rationales for immediate or urgent referrals:.
Most cases of hearing loss have no identifiable cause or specific treatment but some do and it is important to recognise the causes where treatment can be offered to prevent or limit morbidity. The committee considered and discussed the presentations where an urgent referral would be made and what time frames should be used to distinguish between different levels of urgency. The following definitions for referral times made in the recommendations were agreed:
‘ Refer immediately’ means the person should be seen by the specialist service within 24 hours.
‘Refer urgently’ means the person should be seen by the specialist service within 2 weeks.
‘Refer’ means a routine referral.
It is expected that the GP will first exclude impacted wax, otitis externa/media or middle ear effusion (serous or mucoid fluid behind an intact ear drum on one side) related to upper respiratory tract infections such as a cold, sinisitus or influenza as the cause of the hearing complaint and treat appropriately. It should be noted that wax removal may be an urgent requirement in order to exclude this as the cause of hearing loss and avoid delay in treatment of underlying pathology.
Sudden loss or sudden deterioration of hearing occurring over a period of 72 hours or less and presenting within 30 days.
This requires immediate or urgent investigation for treatable causes such as autoimmune disease, chronic infection, rapidly expanding vestibular schwannoma or stroke. Immediate treatment with steroids is current practice. Delay in management may lead to increased morbidity. If the sudden hearing loss occurred more than 30 days prior to presentation urgent investigation is still required but immediate care is not.
Loss or rapid deterioration of hearing over the last 90 days
Deteriorating hearing requires urgent investigation for treatable causes such as autoimmune disease, chronic infection, vestibular schwannoma or intracranial tumours. Delay in treating some causes can lead to increased morbidity.
Unilateral hearing loss on the same side as altered sensation to face or facial droop
These symptoms may indicate a vestibular schwannoma or CPA tumour, a viral infection, an aggressive cholesteatoma or a stroke. Immediate investigation is required and surgery may be needed.
Unilateral persistent middle ear effusion not associated with upper respiratory tract infection in the South East Asian population
There is a high incidence of nasopharyngeal carcinoma in the South East Asian population and presentation is usually a middle ear effusion not associated with, or not resolving after, an upper respiratory tract infection. This pathology can be seen

Hearing loss Urgent and routine referral
© NICE 2017. All rights reserved. Subject to Notice of rights. 58
in other racial groups but is rare. Early recognition and treatment of the tumour leads to a much better outcome. The committee agreed, based on their clinical experience, that this presentation is strongly associated with nasopharyngeal cancer in this population, and was likely to be associated with a positive predictive value of 3% or above and would prompt the clinician to consider a suspected cancer pathway referral.
Persistent otalgia and otorrhoea in immuno-compromised patients
This population are at risk of developing necrotising otitis externa (previously known as malignant otitis externa) in which an otitis externa infection extends inwards and affects the skull base and cranial nerves. Early and effective management is needed to prevent death.
Persistent otalgia (>3weeks duration) in >40 years old person
This can indicate a malignancy affecting the ear, postnasal space or throat. There are other causes of otalgia but, in the absence of a definite cause for the pain, a referral for further investigation should be considered.
Trade-off between net clinical effects and costs
No health economic evidence was identified for this question.
The committee judged that these recommendations reflect current best practice, though there is local variation and not all clinicians would currently be aware that all of these signs and symptoms should lead to urgent referral.
The committee agreed that everyone with the symptoms listed in these recommendations would currently eventually receive specialist assessment and care. While some would currently be referred to receive this care urgently, others could face delay in receiving specialist care. They may be referred elsewhere (such as emergency departments) as an interim step, or be referred for non-urgent assessment, or may not be referred anywhere at first presentation, but then would later present again to primary care or at an emergency department before being referred to secondary care.
As the assessment and care people will receive once they access specialist services will not vary based on how long it takes them to arrive there, there should not be a difference in costs from urgent or later referral to specialist care. However a direct urgent referral may reduce costs of unnecessary interim steps or repeat presentations. Crucially, seeing referred patients urgently is also likely to lead to better long-term health outcomes and possibly reduced later expenditure on avoidable complications. Delay in care increases morbidity and in some cases leads to death. This is a risk particularly for people with auto-immune disease, necrotising otitis externa, stroke or large intracranial tumours.
Therefore, ensuring that people with the symptoms listed here are referred urgently will give rise to equivalent costs in specialist services, slightly reduced costs to other services, and the same or better health outcomes. The committee hence expects these recommendations to be cost effective or cost saving compared to current practice.
Other considerations The committee agreed that having a checklist or table of signs and symptoms with the action and where to refer to and in what timeframe would be a useful quick guide for practitioners.

Hearing loss Urgent and routine referral
© NICE 2017. All rights reserved. Subject to Notice of rights. 59
Review question: Who should be routinely referred to 5.31
audiovestibular medicine or ear, nose and throat (ENT) surgery for 2
medical assessment? 3
This review is to identify who needs to go to secondary or specialist medical care in addition to (non-4 medical) audiology, that is, they need audiological assessment but also medical care. It will look at 5 routine referral criteria for people with hearing loss who need to be referred to audiovestibular 6 medicine or ear, nose and throat (ENT) surgery for medical assessment. 7
For full details see review protocol in appendix C. 8
Table 11: Characteristics of review question 9
Population Adults (18 years and over)
Index tests Referral criteria
Risk assessment tools
Reference standard
Confirmed diagnosis of conditions requiring medical and audiological assessment, for example:
Vestibular schwannoma and cholesteatoma in the absence of sudden hearing loss
Temporomandibular joint disorder
Perforated tympanic membrane
Ear infections
Statistical measures
Sensitivity
Specificity
Positive predictive value
Negative predictive value
ROC curve or area under the curve
Adjusted odds ratios
Study design Diagnostic accuracy study (2-gate studies will be excluded unless no other data are available from single gate-studies)
Systematic reviews of diagnostic accuracy studies
Prospective cohort studies with multivariate analyses that adjust for age and medication
Systematic reviews of the above
5.3.1 Clinical evidence 10
No relevant clinical studies were identified investigating the diagnostic accuracy of routine referral 11 criteria or risk assessment tools for people with hearing loss who need to be referred to 12 audiovestibular medicine or ear, nose and throat (ENT) surgery for medical assessment. See study 13 selection flow chart in appendix E and the excluded studies list in appendix L. 14
15
5.3.2 Economic evidence 16
No relevant economic evaluations were identified. 17
See also the economic article selection flow chart in appendix F. 18

Hearing loss Urgent and routine referral
© NICE 2017. All rights reserved. Subject to Notice of rights. 60
5.3.3 Evidence statements 1
Clinical 2
No relevant evidence was identified. 3
Economic 4
No relevant economic evaluations were identified. 5
5.3.4 Recommendations and link to evidence 6
Recommendations 6. Refer adults with hearing loss that is not explained by external or middle ear causes to an ear, nose and throat or audiovestibular medicine service, or an audiology service using a local complex audiology pathway, if they have any of:
hearing loss that is asymmetric
hearing loss that fluctuates and is not associated with an upper respiratory tract infection
hyperacusis (intolerance to everyday sounds)
unilateral tinnitus that is persistent, or pulsatile, or has significantly changed in nature
vertigo that has not fully resolved or is recurrent.
7. Refer adults with hearing loss to an ear, nose and throat service if, after initial treatment of any earwax or acute infection, they have any of:
partial or complete obstruction of the external auditory canal that prevents full examination of the eardrum or taking an aural impression
pain affecting either ear (including in and around the ear) that has lasted for 1 week or more and has not responded to first-line treatment
a history of discharge (other than wax) from either ear that has not resolved, has not responded to prescribed treatment or is recurrent
abnormal appearance of the outer ear or the eardrum, such as:
i. inflammation
ii. polyp formation
iii. perforated eardrum
iv. abnormal bony or skin growths
v. swelling of the outer ear
vi. blood in the ear canal.
Relative values of different outcomes
Measures of diagnostic accuracy including sensitivity, specificity, positive predictive value, negative predictive value, ROC, AUC as well as adjusted odds ratios were all considered important outcomes to determine whether the signs and symptoms whether the signs and symptoms are indicative of a condition that requires onward routine referral for audiological assessment and medical care. The relative value of sensitivity compared to specificity would depend on the risk assessment tool or referral criteria being considered. Sensitivity was considered to be the most important outcome for assessment tools that aim to rule out patients that don’t have the target condition and do not require onward referral and specificity was considered

Hearing loss Urgent and routine referral
© NICE 2017. All rights reserved. Subject to Notice of rights. 61
important for assessment tools that aim to identify patients with the target conditions who need onward referral. The guideline committee agreed that a risk assessment tool or referral criteria should have a sensitivity or specificity threshold of 90%.
Only adjusted odds ratios from studies that had conducted a multivariate analysis including the clinical prediction factors of interest were considered.
Quality of the clinical evidence
No clinical evidence was identified for this review.
Trade-off between clinical benefits and harms
As no evidence was found the recommendations were based on consensus of the committee.
The committee felt that these recommendations would not necessarily lead to an increase in the number of referrals, but are likely to lead to earlier referrals thus possibly reducing unnecessary interim referrals and saving costs. The result should be more targeted referrals. The committee noted that organisation of local services is very important in reducing unnecessary referrals between departments.
Most cases of hearing loss have no identifiable cause or specific treatment but some do and it is important to recognise the causes where treatment can be offered to prevent or limit morbidity. The symptoms and signs listed are those where it is very likely that medical or surgical investigation and treatment will be needed. The committee considered and discussed these outlining the rationale why these would usually be considered requiring a routine referral to specialist services. It is expected that the GP will first exclude impacted wax, otitis externa/media or middle ear effusion related to upper respiratory tract infections as the cause of the hearing complaint and treat appropriately. It should be noted that wax removal may be an urgent requirement in order to exclude this as the cause of hearing loss and avoid delay in treatment of underlying pathology.
All cases of persistent asymmetric hearing loss
An asymmetric hearing loss can indicate a possible vestibular schwannoma or CPA tumour, a cholesteatoma or conditions such as otosclerosis. Unless the hearing loss is sudden or rapidly progressive a routine referral is usual. In some areas investigation for an asymmetric hearing loss can initially be taken forward by audiologists.
Persistent pain affecting either ear (including in and around the ear) lasting a week or more and unresponsive to first line treatment
Persistent pain around the ear can have a number of causes, for example, persistent infection, temporomandibular joint disorder or a malignant lesion in the ear or throat. The urgency of the referral is dependent on the presumed diagnosis with necrotizing otitis externa being immediate and suspected malignancy on a 2 week cancer pathway with other cases being routine.
History of discharge (other than wax) from either ear which has not resolved or responded to prescribed treatment or which is recurrent
Persistent otorrhoea can indicate persistent infection due to otitis externa or chronic middle ear disease or cholesteatoma. Malignant tumours of the external ear can present with bloody discharge. If otorrhoea does not resolve with first line treatment specialist care and investigation is required. If malignancy is suspected a 2 week cancer pathway should be considered.
Abnormal appearance of the outer ear or the eardrum
It is important for abnormal appearances to be properly diagnosed as some will require surgical treatment and delay can increase morbidity. These will include chronic middle ear disease or cholesteatoma, perforated tympanic membrane,

Hearing loss Urgent and routine referral
© NICE 2017. All rights reserved. Subject to Notice of rights. 62
malignant tumours or foreign bodies. If malignancy is suspected a 2 week cancer pathway should be considered. Obstruction of the external auditory canal preventing examination of the eardrum or taking of an aural impression can be caused by foreign bodies, oedema, polyps or tumours. Proper identification and treatment of the cause is important and can be urgent.
Fluctuating hearing loss, other than associated with upper respiratory tract infection
Fluctuating hearing loss is commonly caused by Meniere’s disease which needs careful evaluation and treatment. Other causes can include fluctuating middle ear effusion which could be linked with nasal pathology and in these cases it is important to exclude nasopharyngeal tumours.
Hyperacusis
Hyperacusis or increased sensitivity to sound can have a number of causes. When associated with hearing loss it is important to exclude causes that require specific treatment, such as dehiscent superior semi-circular canal which may require surgery
Unilateral tinnitus that is persistent, or is pulsatile or has significantly changed in nature
A significant change in tinnitus is defined as one which the patient reports as significant. Examination should exclude other causes for change such as wax or infection.
Tinnitus is a symptom that can change with time and the changes may not be associated with worrying pathology. However, these types of tinnitus with hearing loss need further investigation:
Unilateral tinnitus can be associated with conditions such as vestibular schwannoma, Meniere’s disease or otosclerosis
Pulsatile tinnitus can be caused by intracranial vascular tumours, aneurysms or carotid atherosclerosis and by brainstem pathology (myoclonus).
A significant change in tinnitus may be caused by anxiety or stress but could be related to advancing pathology such as cholesteatoma.
Vertigo which has not fully resolved or which is recurrent
Vertigo associated with hearing loss can indicate Meniere’s disease, a CPA tumour or brainstem pathology. Full assessment and investigation is needed.
Trade-off between net clinical effects and costs
No health economic evidence was identified for this question.
The committee judged that these recommendations largely reflect current practice. All those recommended to be referred for assessment by a specialist need this referral and would currently be expected to be referred. The committee agreed that any patients currently not referred in line with these recommendations by GPs at their first presentation, would in any case present again subsequently and would eventually be referred. Or, following referral to an audiologist for assessment, would be referred on to ear nose and throat services where that is appropriate. Referring directly to the right person in the first referral is much more efficient and will reduce morbidity. Timelier referral would not increase costs but would lead to faster treatment and so better health outcomes.
In total the number of referrals is not expected to change, though some people may progress through a shorter patient journey involving fewer steps along the way. There should therefore be either no change or a small reduction in overall costs, and a

Hearing loss Urgent and routine referral
© NICE 2017. All rights reserved. Subject to Notice of rights. 63
probable small improvement in outcomes. Therefore, these recommendations will be very likely to be cost saving or cost effective compared to current practice.
Other considerations The committee agreed that a good example of referral criteria was set out by the BAA guidance
50 for audiologists based on history, examination and audiological
assessment. The committee referred to this when drawing up the recommendations above which were based primarily on experience and clinical opinion. The above recommendations are for all medical professionals within primary care and it is acknowledged that in some areas audiologists make direct referral into the medical service and may even investigate unilateral hearing loss directly.
The committee mentioned persistent unilateral tinnitus associated with hearing loss in the recommendations, but notes that a comprehensive assessment on tinnitus is set out in the NICE clinical knowledge summary on tinnitus.
The committee did not discuss referral for investigation into the cause of hearing loss when genetic or genomic aetiology is suspected. There is currently insufficient robust evidence to consider making a recommendation.

Hearing loss MRI
© NICE 2017. All rights reserved. Subject to Notice of rights. 64
6 MRI 1
Introduction 6.12
Acquired audiovestibular symptoms may be an indicator of cerebellopontine angle (CPA), internal 3 auditory meatus (IAM) or inner ear disorders such as meningioma, vestibular schwannoma (VS), 4 cholesterol granuloma and fibrosis of the labyrinth and such pathologies may be accurately 5 diagnosed with MRI. Hearing loss (asymmetric or unilateral) as a clinical symptom or as 6 demonstrated on pure tone audiometry (PTA) is an important consideration when selecting patients 7 for MRI. 8
Vestibular schwannoma (also known as acoustic neuroma) is a rare benign tumour of the cells that 9 form the sheath around the nerve of balance (vestibular nerve). The vestibular nerves run with the 10 nerve of hearing (cochlear nerve) in the internal auditory meatus. These tumours can cause hearing 11 loss by compressing the cochlear nerve in this narrow bony channel or in the inner ear, or they can 12 grow into the posterior cranial fossa and cause brain stem compression giving neurological 13 symptoms and signs, and, in time, can be life-threatening if not treated. Small tumours may be very 14 slow growing in older people, requiring observation only, but in younger people growth can be 15 quicker and surgical removal may be needed. 16
Whilst the main focus of investigation with MRI is on the detection of vestibular schwannomas or 17 similar tumours, other abnormalities may be demonstrated with a similar frequency.104 In a paper by 18 Vandervelde in 2009 looking at 881 consecutive MRI scans performed for audiovestibular symptoms 19 1.4% were positive for vestibular schwannomas, 0.4% identified other relevant pathology and in 1.4% 20 incidental pathologies were found which were irrelevant to the presenting complaint. 104 MRI is 21 increasingly performed in this clinical setting due to wider availability of scanners, quicker 22 scanning protocols, changes in diagnostic algorithms and easier access to audiological testing, 23 as well as due to heightened patient awareness and expectations. It has been noted that up to 24 20% of new ENT referrals with audiovestibular symptoms are deemed appropriate for 25 MRI.45This has contributed to an increased incidence of vestibular schwannoma detection in 26 the past 30 years,39 ,93 ,94 ,101 and the average tumour size at detection has decreased from 3 cm 27 to 1 cm. 28
When developing referral guidelines for MRI it is important to maximise diagnostic yield 29 without missing pathologies which would benefit from earlier diagnosis, monitoring or 30 treatment; however, it should be noted that vestibular schwannomas only grow in the medium 31 term in 30–90% of cases94 and are frequently managed conservatively. There is also a potential 32 cost to the ‘overdiagnosis’ of asymptomatic vestibular schwannomas (or other abnormalities) 33 which do not require intervention, in terms of increased resources required for clinical follow-34 up or MRI monitoring and increased patient anxiety. There is no clear consensus on the clinical 35 and audiological parameters which should prompt MRI referral in order to optimise the 36 diagnostic efficacy for clinically relevant pathology. 37
Review question: In people who have been referred to secondary 6.238
care with sensorineural hearing loss, who needs MRI to assess the 39
underlying cause of hearing loss? 40
For full details see review protocol in appendix C. 41
Table 12: Characteristics of review question 42
Population Adults (18 years and over) presenting with hearing loss who have been referred to

Hearing loss MRI
© NICE 2017. All rights reserved. Subject to Notice of rights. 65
secondary care
Target condition Vestibular schwannoma (or other causative lesion) confirmed by MRI
Index tests Referral criteria
Risk assessment tools
Reference standard
MRI
Statistical measures
Sensitivity
Specificity
Positive predictive value
Negative predictive value
ROC curve or area under the curve
Adjusted odds ratios
Study design Diagnostic accuracy study (2-gate studies will be excluded unless no other data are available from single gate-studies)
Systematic reviews of diagnostic accuracy studies
6.2.1 Clinical evidence 1
We searched for prospective and retrospective studies assessing the diagnostic test accuracy of 2 referral criteria or risk assessment tools to identify the presence (as indicated by MRI) of vestibular 3 schwannoma (or other causative lesions) in people under investigation in secondary care for hearing 4 loss (symmetric or asymmetric). We initially sought cohort (single-gate) studies, but if these were not 5 available for a specific test, case–control (2-gate) studies were also considered. Studies were 6 excluded if they included mixed populations (a mix of people with hearing loss and with other 7 audiovestibular symptoms) and the proportion with hearing loss was unclear. Studies with mixed 8 populations, but the majority having hearing loss at presentation were included but downgraded for 9 indirectness. 10
Seven studies were included in the review; 16 ,23 ,56 ,64 ,89 ,91 ,98 these are summarised in Table 13 below. 11 Evidence from these studies is summarised in the clinical evidence summary (Table 15). See also the 12 study selection flow chart in appendix E, forest plots of sensitivity and specificity in appendix K, study 13 evidence tables in appendix H and excluded studies list in appendix L. 14
The included studies covered a range of different clinical and audiological tests to triage those with 15 hearing loss for further investigation with MRI. The MRI method also varied between studies as 16 detailed in Table 13. A variety of thresholds or definitions of positive result were also used, which are 17 shown in Table 14. One of the studies included some participants with symmetrical hearing loss.56 18 Although the majority of studies did not state whether assessors were blinded, this was not 19 considered as a source of bias because it is unlikely that prior knowledge significantly influences 20 interpretation of the MRI findings in this setting. Due to the variability in the studies such as the MRI 21 methods used and the definitions of the causative lesions, the study results have not been meta-22 analysed but have been presented as ranges of sensitivities and specificities for each outcome. 23
24

MR
I
Hearin
g loss
© N
ICE 2
01
7. A
ll rights reserved
. Sub
ject to N
otice o
f rights.
66
Table 13: Summary of studies included in the review 1
Study
n (incidence of VS/other lesion) Study design
Population (country)
Target condition Index test Reference standard Comments
Cheng 201216
1751 (131) Retrospective cohort
Sensorineural hearing loss
(UK)
CPA lesion 15 pure tone audiometry protocols
MRI – High resolution non-enhanced FSE T2-weighted (n=217) or T1-weighted with gadolinium enhancement (n=1672); reason for different approaches unclear
Slice thickness not stated
Assessed by consultant radiologist (and a second assessor)
Sensitivity calculation based on taking non-acoustic tumours and non-pathological cases as negatives. See evidence table for specificity values based on taking only non-pathological cases as negatives.
Cueva 200423
316 (4) Prospective cohort
Asymmetric sensorineural hearing loss
(USA)
Causative lesion
Auditory brainstem response
MRI – T1-weighted with gadolinium enhancement
Slice thickness not stated
Assessed by neuroradiologist
Blinded assessors
Kumar 201656
756 (8) Retrospective cohort
Suspected vestibular schwannoma (majority had either hearing loss or unilateral tinnitus)
(UK)
Vestibular schwannoma
4 pure tone audiometry protocols
MRI of internal auditory meatus [no further details]
Scanner and slice thickness not stated
Assessor not stated
13–19% of sample did not have hearing loss at presentation (none of these had VS)
Those with hearing loss had a mix of unilateral and bilateral, symmetrical and asymmetrical symptoms
Mandala 201364
102 (49) Prospective case–control
Confirmed vestibular schwannoma cases or controls with unilateral sensorineural
Vestibular schwannoma
Hyperventilation test
Caloric irrigation
MRI – T1-weighted with gadolinium enhancement
Scanner and slice thickness not stated
Assessor not stated
PTA and ABR tests also presented but not analysed in this review as we have higher level data from other studies

MR
I
Hearin
g loss
© N
ICE 2
01
7. A
ll rights reserved
. Sub
ject to N
otice o
f rights.
67
Study
n (incidence of VS/other lesion) Study design
Population (country)
Target condition Index test Reference standard Comments
hearing loss
(Italy)
Rupa 200389
90 (4) Prospective cohort
Asymmetric hearing loss and tinnitus
(India)
Vestibular schwannoma
Auditory brainstem response
MRI – T1-weighted with gadolinium enhancement
Scanner and slice thickness not stated
Assessor not stated
18 patients (2 with VS) excluded because they had no response on ABR due to severe to profound sensorineural hearing loss.
14% of sample did not have hearing loss at presentation
Saliba 201191
212 (84) Retrospective cohort
Asymmetric sensorineural hearing loss
(Canada)
Vestibular schwannoma
9 pure tone audiometry protocols
Posterior fossa MRI [no further details]
Scanner and slice thickness not stated
Assessed by a radiologist
High proportion (40%) with VS (referred tertiary care centre setting).
Excluded patients without data at 3 kHz
Suzuki 201098
500 (13) Retrospective cohort
Asymmetric sensorineural hearing loss
(Japan)
Vestibular schwannoma
Pure tone audiogram shapes
MRI – T2 without Gd-enhancement
1.5 Tesla scanner; 0.8 mm gapless slice
Assessed by a radiologist/otolaryngologist
Included patients from 15 years of age
Abbreviations: VS: vestibular schwannoma 1
Table 14: Index test thresholds for included studies 2
Study Index test Thresholds/definitions of positive test
Cheng 2012
16
15 pure tone audiometry protocols
Single-frequency comparison
DOH- ≥20 dB at any single frequency between 0.5–4 kHz.
Nashville ≥15 dB at any single frequency between 0.5–4 kHz.
AMCLASS-B-Urben ≥15 dB at any single frequency.

MR
I
Hearin
g loss
© N
ICE 2
01
7. A
ll rights reserved
. Sub
ject to N
otice o
f rights.
68
Study Index test Thresholds/definitions of positive test
Rule 3000 ≥15 dB asymmetry at 3 kHz.
Rule 4000 ≥20 dB asymmetry at 4 kHz.
Two adjacent-frequency comparison
Sunderland ≥20 dB at 2 adjacent frequencies.
AMCLASS-A-Urben ≥10 dB at 2 adjacent frequencies.
Cueva ≥15 dB at 2 or more adjacent frequencies.
Averaged multiple-frequency comparison
AAO-HNS ≥ 15 dB between ears averaging 0.5–3 kHz.
Oxford ≥ 15 dB between ears averaging 0.5–8 kHz.
Seattle ≥ 15 dB between ears averaging 1–8 kHz.
Mangham ≥ 10 dB between ears averaging 1–8 kHz.
Schlauch and Levine ≥ 20 dB between ears averaging 1–8 kHz.
Sheppard ≥ 15 dB between ears averaging 0.25–8 kHz.
Obholzer ≥ 15 dB if better ear is ≤ 30 dB hearing loss average at frequencies 0.25–8 kHz; or
≥ 20 dB if better ear is >30 dB hearing loss average at frequencies 0.25–8 kHz.
Cueva 2004
23
Auditory brainstem response
Auditory brainstem response abnormal if:
IT5 inter-peak latency > 0.2 ms,
absolute wave V latency abnormal, or
absent/distorted waveform morphology.
Kumar 2016
56
4 pure tone audiometry protocols
≥20 dB at 2 adjacent frequencies; or ≤ 20dB with neurological signs.
≥15 dB between average of 0.5–8 kHz.
≥20 dB at any single frequency between 0.5–4 kHz.
≥15 dB at any single frequency between 0.5–4 kHz.
Mandala 2013
64
Hyperventilation test
Caloric irrigation
Hyperventilation test: Hyperventilation-induced nystagmus (positive)
Caloric irrigation deficit: paralysis or paresis
Rupa 2003
89
Auditory brainstem response
Auditory brainstem response suggestive of retrocochlear pathology if:
increased inter-peak latencies (I–III of ≥2.5 ms, III–V of ≥2.3 ms, I–V of ≥4.4 ms),
interaural latency difference of ≥0.3 ms,

MR
I
Hearin
g loss
© N
ICE 2
01
7. A
ll rights reserved
. Sub
ject to N
otice o
f rights.
69
Study Index test Thresholds/definitions of positive test
poor waveform morphology and replicability, or
absent response despite normal/mildly elevated audiometric thresholds
Saliba 2011
91
9 pure tone audiometry protocols
Single-frequency comparison
DOH ≥20 dB asymmetry at any single frequency between 0.5–4 kHz.
Nashville ≥15 dB asymmetry at any single frequency between 0.5–4 kHz.
AMCLASS-B ≥15 dB asymmetry at any single frequency.
Rule 3000 ≥15 dB asymmetry at 3 kHz.
Two adjacent-frequency comparison
Sunderland ≥20 dB asymmetry at 2 adjacent frequencies.
AMCLASS-A ≥10 dB asymmetry at 2 adjacent frequencies.
Cueva ≥15 dB asymmetry at 2 or more adjacent frequencies; or 15% difference in speech discrimination.
Averaged multiple-frequency comparison
AAO-HNS ≥ 15 dB asymmetry averaging 0.5–3 kHz.
Oxford ≥ 15 dB asymmetry averaging 0.5–8 kHz.
Seattle ≥ 15 dB asymmetry averaging 1–8 kHz.
Suzuki 2010
98
Pure tone audiogram shapes
High frequency sloping loss: normal threshold between 0.125 kHz and 2 kHz with a downward curve into the high frequencies (4, 6 and 8 kHz) and a 10 dB difference between 2 consecutive frequencies
High frequency steep loss: normal threshold between 0.125 kHz and 2 kHz with a loss of hearing of at least 40 dB at each measured high frequency (4, 6 and 8 kHz).
Flat loss: no difference of >20 dB between all frequencies
Total deafness: hearing loss of at least 90 dB at every frequency from 0.25 kHz to 8 kHz.
Low frequency loss: threshold reduced by at least 25 dB at the low frequencies (0.125 kHz and 0.25 kHz) with a rising curve into the speech range
Basin-shaped loss: good hearing at 0.125, 0.25, 0.5 and 8 kHz with elevated thresholds throughout the middle frequencies and >15dB difference between lowest and highest hearing thresholds.
Mountain-shaped loss: at least 2 consecutive frequencies between 0.25 kHz and 4 kHz that were better than 0.125 kHz and 8 kHz
1

MR
I
Hearin
g loss
© N
ICE 2
01
7. A
ll rights reserved
. Sub
ject to N
otice o
f rights.
70
Table 15: Clinical evidence summary: diagnostic test accuracy for non-imaging tests 1
Index Test (Pure tone hearing thresholds) No
of
stu
die
s
n Quality Sensitivity % (95% CI) Specificity % (95% CI)
Hearing thresholds
Hearing thresholds (DOH) 1
3 2719 LOW2,3
due to serious risk of bias, serious indirectness
Cheng: 83 (76–89)
Kumar: 100 (63–100)
Saliba: 87 (78–93)
Cheng: 63 (60–65)
Kumar: 63 (60–67)
Saliba: 59 (50–67)
Hearing thresholds (Nashville)1 3 2719 LOW
2,3
due to serious risk of bias, serious indirectness
Cheng: 88 (81–93)
Kumar: 100 (63–100)
Saliba: 93 (85–97)
Cheng: 52 (50–55)
Kumar: 53 (49–56)
Saliba: 44 (35–53)
Hearing thresholds (AMCLASS-B-Urben) 1 1751 LOW2,3
due to serious risk of bias, serious indirectness
88 (81–93) 45 (42–47)
Hearing thresholds (Rule 3000) 2 1963 VERY LOW2,3,4
due to serious risk of bias, serious indirectness, serious inconsistency
Cheng: 88 (81–93)
Saliba: 73 (62–82)
Cheng: 57 (55–60)
Saliba: 76 (67–83)
Hearing thresholds (Rule 4000) 1 1751 LOW2,3
due to serious risk of bias, serious indirectness
82 (75–89) 63 (60–65)
Hearing thresholds (Sunderland)1 3 2719 LOW
2,3
due to serious risk of bias, serious indirectness
Cheng: 82 (75–89)
Kumar: 88 (47–100)
Saliba: 74 (63–83)
Cheng: 61 (59–63)
Kumar: 79 (76–82)
Saliba: 70 (62–78)
Hearing thresholds (AMCLASS-A-Urben) 1 1751 LOW2,3
due to serious risk of bias, serious indirectness
93 (87–97) 32 (29–34)
Hearing thresholds (AMCLASS) 1 212 LOW2,3
due to serious risk of bias, serious indirectness
93 (85–97) 25 (18–33)
Hearing thresholds (Cueva) 2 1963 LOW2,3
due to serious risk of bias, serious indirectness
Cheng: 85 (78–91)
Saliba: 81 (71–89)
Cheng: 49 (46–51)
Saliba: 60 (51–69)
Hearing thresholds (AAO-HNS) 2 1963 LOW2,3
Cheng: 87 (80–92) Cheng: 65 (63–68)

MR
I
Hearin
g loss
© N
ICE 2
01
7. A
ll rights reserved
. Sub
ject to N
otice o
f rights.
71
Index Test (Pure tone hearing thresholds) No
of
stu
die
s
n Quality Sensitivity % (95% CI) Specificity % (95% CI)
due to serious risk of bias, serious indirectness
Saliba: 90 (82–96) Saliba: 55 (46–64)
Hearing thresholds (Oxford)1 3 2719 LOW
2,3
due to serious risk of bias, serious indirectness
Cheng: 85 (78–91)
Kumar: 88 (47–100)
Saliba: 93 (85–97)
Cheng: 61 (59–63)
Kumar: 78 (75–81)
Saliba: 44 (35–53)
Hearing thresholds (Seattle) 2 1963 LOW2,3
due to serious risk of bias, serious indirectness
Cheng: 86 (79–92)
Saliba: 92 (84–97)
Cheng: 60 (58–62)
Saliba: 44 (35–53)
Hearing thresholds (Mangham) 1 1751 LOW2,3
due to serious risk of bias, serious indirectness
0.92 (85–96) 44 (42–47)
Hearing thresholds (Schlauch and Levine) 1 1751 LOW2,3
due to serious risk of bias, serious indirectness
81 (73–87) 66 (64–69)
Hearing thresholds (Sheppard) 1 1751 LOW2,3
due to serious risk of bias, serious indirectness
87 (80–92) 60 (58–63)
Hearing thresholds (Obholzer) 1 1751 LOW2,3
due to serious risk of bias, serious indirectness
84 (77–90) 66 (64–69)
Audiometric shape
High frequency sloping loss 1 500 LOW2,5
due to serious risk of bias, and serious imprecision
8 (0–36) 93 (91–95)
High frequency steep loss 1 500 VERY LOW2,5
due to serious risk of bias, and very serious imprecision
15 (2–45) 84 (80–87)
Flat loss 1 500 VERY LOW2,5
due to serious risk of bias, and very serious imprecision
38 (14–68) 79 (75–83)

MR
I
Hearin
g loss
© N
ICE 2
01
7. A
ll rights reserved
. Sub
ject to N
otice o
f rights.
72
Index Test (Pure tone hearing thresholds) No
of
stu
die
s
n Quality Sensitivity % (95% CI) Specificity % (95% CI)
Total deafness 1 500 VERY LOW2,5
due to serious risk of bias, and very serious imprecision
15 (2–45) 89 (85–91)
Low frequency loss 1 500 LOW2,5
due to serious risk of bias, and serious imprecision
0 (0–25) 81 (77–84)
Basin-shaped loss 1 500 VERY LOW1,5
due to serious risk of bias, and very serious imprecision
23 (5–54) 92 (89–94)
Mountain-shaped loss 1 500 LOW2,5
due to serious risk of bias, and serious imprecision
0 (0–25) 88 (85–91)
Auditory brainstem response (accuracy for all pathology)
IT5 inter-peak latency > 0.2 ms; absolute wave V latency abnormal; or absent/distorted waveform morphology.
1 316 LOW2,5
due to serious risk of bias, and serious imprecision
71 (52–86) 74 (68–79)
Auditory brainstem response (accuracy for VS + CPA meningioma)
Increased interpeak intervals (I–III of ≥2.5 ms, III–V of ≥2.3 ms, I–V of ≥4.4 ms); interaural latency difference of ≥0.3 ms; poor waveform morphology and replicability, or absent response despite normal/mildly elevated audiometric thresholds [excluding the ‘no responses’ due to severe to profound sensorineural hearing loss]
1 72 VERY LOW2,3,5
due to serious risk of bias, very serious imprecision, and serious indirectness
100 (54–100) 64 (51–75)
Caloric irrigation

MR
I
Hearin
g loss
© N
ICE 2
01
7. A
ll rights reserved
. Sub
ject to N
otice o
f rights.
73
Index Test (Pure tone hearing thresholds) No
of
stu
die
s
n Quality Sensitivity % (95% CI) Specificity % (95% CI)
Canal paralysis or paresis 1 102 VERY LOW2,3,5
due to very serious risk of bias, serious indirectness, and serious imprecision
43 (29–58) 91 (79–97)
Hyperventilation test
Hyperventilation-induced nystagmus (positive)
1 102 VERY LOW2,3,5
due to very serious risk of bias, serious indirectness, and serious imprecision
65 (50–78) 98 (90–100)
The assessment was conducted with an emphasis on test sensitivity as this was identified by the committee as the primary measure in guiding 1 decision making. The committee used the sensitivity threshold of 90% as an acceptable level to recommend a test. 2
1. Diagnostic meta-analysis has not been performed owing to differences between the three studies in the target condition definition, the population and 3 the definition of the reference standard 4
2. Risk of bias was assessed using the QUADAS-2 checklist. The evidence was downgraded by 1 increment if the majority of studies were rated at high risk 5 of bias, and downgraded by 2 increments if the majority of studies were rated at very high risk of bias 6
3. Indirectness was assessed using the QUADAS-2 checklist items referring to applicability. The evidence was downgraded by 1 increment if the majority of 7 studies are seriously indirect, and downgraded by 2 increments if the majority of studies are very seriously indirect 8
4. Inconsistency was assessed by inspection of the sensitivity/specificity plots. Particular attention was placed on the sensitivity threshold set as an 9 acceptable level to recommend a test. In this case 90%. The evidence was: 10
downgraded by 1 increment if the individual study values varied across 2 areas, above/below the acceptable threshold of 90% [0–50% and 50–90%, 11 or 50–90% and 90–100%] 12
downgraded by 2 increments if the individual study values varied across 3 areas, above/below the acceptable threshold of 90% [0–50%, 50–90% 13 and 90–100%] 14
5. Imprecision was assessed according to the range of confidence intervals in the individual study. The evidence was downgraded by 1 increment when 15 there was a 20-40% range of the confidence interval around the point estimate, and downgraded by 2 increments when there was a range of >40% 16
17

Hearing loss MRI
© NICE 2017. All rights reserved. Subject to Notice of rights. 74
6.2.2 Economic evidence 1
No relevant economic evaluations were identified. 2
See also the economic article selection flow diagram in appendix F. 3
6.2.3 Evidence statements 4
Clinical 5
Pure tone hearing thresholds 6
Low to very low quality evidence from up to 3 studies with up to 2719 participants sensorineural 7 with hearing loss showed that pure tone threshold protocols have sensitivities that range from 8 81% to 100% but this could be as low as 63%. The specificities ranged from 25% to 93% but this 9 could be as low as 18%. The Nashville protocol had the highest sensitivity with an average of 94% 10 across the 3 studies. However, this protocol had a very low specificity of only 50% average across 11 the 3 studies. The Rule 300 and the Sunderland protocols had the lowest sensitivities. (. 12
13
Audiometric shape 14
Low to very low quality evidence from 1 study with 500 participants with asymmetric 15 sensorineural hearing losses showed that different audiometric shapes have sensitivities that 16 range from 0% to 38% and specificities that range from 79% to 93%. The flat loss shape had the 17 highest sensitivity of 38% which was well below the threshold set by the committee. The low-18 frequency loss and mountain-shaped loss protocols were not sensitive at all at identifying 19 vestibular schwannomas or other lesions. The highest specificity was seen when the high 20 frequency sloping loss was used and the lowest with when the flat loss protocol was used. 21
22
Auditory brainstem response (accuracy for all pathology) 23
Low quality evidence from 1 study with 316 asymmetric sensorineural hearing losses showed that 24 ABR for all causative pathologies has a sensitivity of 71% (52, 86) and a specificity of 74% (68, 79). 25
26
Auditory brainstem response (accuracy for VS + CPA meningioma) 27
Very low quality evidence from 1 study (72 participants with asymmetric sensorineural hearing 28 loss and tinnitus) showed that ABR for VS + CPA meningioma has a sensitivity of 100% (54, 100) 29 and a specificity of 64% (51, 75). 30
31
Caloric irrigation 32
Very low quality evidence from 1 study with 102 participants with confirmed VS cases or controls 33 with unilateral sensorineural hearing loss showed that caloric irrigation has a sensitivity of 43% 34 (29, 58) and a specificity of 91% (79, 97). 35
36
Hyperventilation test 37
Very low quality evidence from 1 study with 102 participants with confirmed VS cases or controls 38 with unilateral sensorineural hearing loss showed that hyperventilation tests have a sensitivity of 39 65% (50, 78) and a specificity of 98% (90, 100). 40
Economic 41
No relevant economic evaluations were identified. 42

Hearing loss MRI
© NICE 2017. All rights reserved. Subject to Notice of rights. 75
6.2.4 Recommendations and link to evidence 1
Recommendations 8. Offer MRI of the internal auditory meati to adults with hearing loss and localising symptoms or signs (such as facial nerve weakness) that might indicate a vestibular schwannoma or CPA (cerebellopontine angle) lesion, irrespective of pure tone thresholds.
9. Consider MRI of the internal auditory meati for adults with sensorineural hearing loss and no localising signs if there is an asymmetry of 20 dB or more at any single frequency between 0.5 kHz and 4.0 kHz on pure tone audiometry.
Relative values of different diagnostic measures
The outcome prioritised for this review was diagnostic accuracy for vestibular schwannoma. Sensitivity was considered the most important measure of diagnostic accuracy by the guideline committee for this review question because a clinical decision rule should correctly identify all patients with suspected vestibular schwannoma for MRI scanning. The consequences of missing a patient with vestibular schwannoma could result in increased morbidity. The guideline committee used a sensitivity threshold of 90% as an acceptable level to recommend a test; this was considered to be close to the sensitivity of MRI, which is the best available reference standard.
Quality of the clinical evidence
The committee acknowledged the limited quality of studies for pure tone hearing thresholds and the limited quality and number of studies for other tests. It noted that a number of factors vary between the included studies, such as the populations, which had varying proportions presenting with hearing loss and other audiovestibular symptoms. The target condition was also defined differently amongst the studies, including any cerebellopontine angle (CPA) lesion or causative lesion and specifically vestibular schwannoma (VA), with the prevalence of these ranging from 1% to 40%. The MRI method varied and detail was commonly lacking regarding the scanner type and slice thickness. Therefore, the data were not meta-analysed.
Pure tone hearing thresholds:
Of the pure tone hearing thresholds investigated, the Nashville protocol had the highest sensitivity with an average of 94% across 3 papers, one of which had reported a sensitivity of 100%. However, the specificity for this protocol was very low and averaged only 50% across the 3 included papers. The least sensitive protocols were the Rule 3000 and the Sunderland protocols.
Audiometric shapes:
In general, audiometric shapes had very low sensitivities, well below the 90% threshold set by the committee with the highest only reaching 38% (flat loss shape). Some were not sensitive at all at identifying vestibular schwannomas or other lesions (low-frequency loss and mountain-shaped loss protocols).
Auditory brainstem response:
This test had a sensitivity of 71% for all cause pathology and this increased to 100% when looking at accuracy for VS+CPA meningioma.
Caloric irrigation and hyperventilation tests:
Caloric irrigation and hyperventilation tests had very low sensitivities of 43% and 65% respectively.
Despite the methodological differences in the studies and the uncertainty in the findings, these broadly aligned with clinical experience and so the uncertainty in the evidence did not preclude making a recommendation.

Hearing loss MRI
© NICE 2017. All rights reserved. Subject to Notice of rights. 76
Trade-off between clinical benefits and harms
The committee considered the trade-off between using a test with a high sensitivity to select patients for MRI, while also not causing over-referral to imaging services, with the associated financial costs, patient waiting times and the inevitable risk of incidental findings that could cause unnecessary anxiety and follow-up for patients.
Of the included tests, pure tone audiometric shapes, the hyperventilation test and caloric irrigation were agreed to have too low sensitivity to be useful. Of the many different protocols for pure tone hearing thresholds included in the studies, it was noted that a number of them achieved a sensitivity of at least 90% in 1 or more studies with varying specificities. The committee discussed the trade-off between sensitivity and specificity, being mindful that if the specificity was too low services could be overwhelmed. Therefore, it was agreed that the Department of Health criteria of ≥20 dB asymmetry of sensorineural (bone conduction) hearing thresholds at any single frequency between 0.5–4 kHz may be the most appropriate protocol for referral for imaging.
The evidence for auditory brainstem response (ABR) was from 2 studies, 1 of which reported on all causative lesions identifying a 71% sensitivity based on low quality evidence (a difference of 0.2 ms for the I to V interval). It was noted that this study used the term inter-peak latency instead of inter-peak interval. The other study gave a 100% sensitivity, based on very low quality evidence. The committee noted that this test is not often used and is additional to pure tone audiometry, with relative high cost and time demands. Therefore, there was insufficient evidence to change current practice from using pure tone thresholds as a criterion for requesting MRI scan, and ABR remains a useful test only in limited cases where scanning, either by MRI or CT, is impractical, and more evidence is required before making a decision about further investigation.
The committee also discussed the importance of always referring for an MRI scan of the internal auditory meatus (IAM) when there are clinically apparent localising symptoms or signs indicating possible vestibular schwannoma or CPA lesions. Although this was not based on the evidence, the committee noted that this must be a strong recommendation based on the potential harms of not referring in these cases. Specific mention was made of unilateral tinnitus, which should prompt referral even if the hearing loss is symmetrical. Localising signs could include ipsilateral facial weakness, ipsilateral loss of corneal reflex, ipsilateral canal paresis or nystagmus, either lateral or vertical. Vestibular schwannoma can occur with normal hearing but this is outside the scope of this guideline.
Trade-off between net clinical effects and costs
No health economic evidence was identified for this question.
The difficulties in balancing sensitivity and specificity, and hence the risks of over-referral or under-referral to MRI, are discussed above. Over-referral could lead to unnecessary overspending on MRI tests, whilst under-referral could lead to missing people with conditions that need treatment, leading to increased morbidity and more complicated procedures to treat conditions that could have been treated more easily, more effectively and more cheaply if identified earlier.
In the absence of economic evidence and the limited nature of the clinical evidence the committee could not be certain of the optimal referral criteria, as discussed above. However, the committee noted that practice currently varies widely across the country and there are concerns about over-referral in some areas, with, consequently, stretched radiology resources. The committee was also aware of some referrals coming directly from primary care. Therefore, the systematic use of any defined protocol, such as that recommended by the committee, is likely to reduce referrals significantly in some areas, and is unlikely to increase referrals more than a small amount in other areas. Where referrals are increased, it may be the case that these areas are currently under-referring and so an increase in referrals may be clinically beneficial.
Regarding England as a whole, the committee expect these recommendations to lead to the number of referrals remaining the same or decreasing, but being better

Hearing loss MRI
© NICE 2017. All rights reserved. Subject to Notice of rights. 77
focussed on those who need assessment. Therefore the recommendations are likely to be either cost saving or cost effective at a threshold of £20,000 per QALY gained compared to current practice.
Other considerations People with red flag symptoms and signs, such as sudden-onset hearing loss, will be picked up earlier in the pathway. This question is looking purely at index tests that can be used as criteria for MRI scan to exclude a vestibular schwannoma.
The committee noted that although the sensitivity of the Department of Health criteria was not 100%, it is possible that some of the false negatives have other symptoms and would be identified and appropriately referred anyway. It was unclear from the studies whether this would have been the case in their samples. Current practice around MRI referral in this population is variable, with different PTA protocols or no protocols at all being used, and the extent of change in practice to implement this recommendation will also vary.
The committee noted that caloric irrigation and hyperventilation tests are not used as part of routine practice. Caloric irrigation is time consuming and costly to do. Hyperventilation tests are not commonly done but may be a useful adjunct to audiometry. They are thought to be relatively quick and cheaper to perform and when used in conjunction with PTA, they may provide a more accurate way of determining who needs MRI as they had a relatively high sensitivity.
The shape of an audiogram has long been acknowledged as an unreliable criterion for further investigation for vestibular schwannoma.
It was noted that although the review question specified people already referred to ‘secondary care’, currently patients are being referred for MRI in relevant clinical pathways from primary care. The committee was informed that the literature search and sifting process did not exclude studies based on the pathway of referral and so no studies should have been missed. However there is concern that this direct route of referral may lead to over-referral of cases. The committee emphasised the importance of careful clinical examination and robust audiological assessment prior to referral for MRI scan.
1

Hearing loss Subgroups
© NICE 2017. All rights reserved. Subject to Notice of rights. 78
7 Subgroups 1
Introduction 7.12
This chapter explores which people are at risk of having or developing hearing loss and in whom this 3 might be missed because they have limited ability to seek help. Amongst this group we consider 4 those with mild cognitive impairment, dementia and learning disability. 5
The link between hearing loss and learning disability is well recognised. One of the commonest 6 causes of learning disability in adults is Down’s Syndrome and it is known that individuals with 7 Down’s Syndrome are at risk of developing a high frequency hearing loss from the second or third 8 decade even if hearing has been good when younger. While monitoring of hearing is currently 9 routine in childhood it is not clear what happens after transition to adult services. The Down’s 10 Syndrome Medical Interest Group drafted guidelines in 2000 recommending that hearing assessment 11 should be carried out every 2 years for adults with Down’s Syndrome. NHS England recommends that 12 every adult with learning disabilities has an annual check which includes a check of hearing. 13 However, it is not clear how that assessment should be conducted. 14
A recent Action on Hearing Loss report29 has highlighted the association between dementia and 15 hearing loss reporting a 2-fold increased incidence of dementia in those with a mild hearing loss and 16 a nearly 5-fold increase in those with severe hearing loss. There are also reports of hearing loss 17 affecting the performance of people being tested for dementia leading to misdiagnosis. 18
Those with mild cognitive impairment, dementia or learning disabilities may not be aware of their 19 hearing loss or may not have the capacity to ask for help, and their families and carers may not 20 consider that hearing loss is a compounding factor given their other health needs. However, hearing 21 loss that is not addressed will significantly affect understanding and will exacerbate underlying 22 cognitive difficulties. It will contribute to increasing confusion and withdrawal. This can be 23 misinterpreted as increasing cognitive decline which is untreatable, rather than hearing difficulty 24 which can be helped by proper management. 25
The purpose of this chapter is to ensure that the needs of those who are unable to present the 26 problem for themselves are considered. The review concentrates on 3 specific groups of individuals. 27 The guideline committee is aware of other groups for whom presentation of hearing difficulties is 28 difficult and hearing loss often missed, including those with depression and other mental health 29 issues as well as those who are homeless or significantly disadvantaged and those who have a poor 30 grasp of English. We hope that by raising awareness of the high prevalence of hearing loss generally 31 and the need to consider this in every individual these groups will also benefit. However, we have 32 not focused on these groups in this guideline. 33
Review question: Which groups of people are more likely than the 7.234
general population to miss having hearing loss identified? 35
For full details see review protocol in appendix C. 36
Table 16: PICO characteristics of review question 37
Population Adults 18 years or older
Presence or absence of indicators
Mild cognitive impairment
Dementia
Learning disabilities
Outcomes Missed identification (diagnosis) of hearing loss (no diagnosis prior to assessment and

Hearing loss Subgroups
© NICE 2017. All rights reserved. Subject to Notice of rights. 79
new diagnosis after assessment)
Identification (diagnosis) rates of hearing loss
Study design Studies in which participants are divided into 2 groups by the presence or absence of 1 of the indicators listed above and all participants are formally assessed for the presence of hearing loss.
Prevalence, incidence and epidemiology studies.
7.2.1 Clinical evidence 1
No relevant clinical studies reporting missed identification or identification rates in people with mild 2 cognitive impairment, dementia and learning difficulties compared to people without the presence 3 of those indicators were identified. See study selection flow chart in appendix E and the excluded 4 studies list in appendix L. 5
7.2.2 Economic evidence 6
No relevant health economic studies were identified. 7
See also the health economic study selection flow chart in appendix F. 8
7.2.3 Evidence statements 9
Clinical 10
No relevant clinical evidence was identified. 11
Economic 12
No relevant economic evaluations were identified. 13
7.2.4 Recommendations and link to evidence 14
Recommendations 10. Consider referring adults with diagnosed or suspected dementia or mild cognitive impairment to an audiology service for a hearing assessment, because hearing loss is a comorbid condition.
11. Consider referring adults with diagnosed dementia or mild cognitive impairment, without hearing loss, to an audiology service for a hearing assessment every 2 years.
12. Consider referring people with a diagnosed learning (intellectual) disability to an audiology service for a hearing assessment when they transfer from child to adult services, and then every 2 years.
Research recommendation
1. In adults with hearing loss, does the use of hearing aids reduce the incidence of dementia?
2. What is the prevalence of hearing loss among populations who under-present for possible hearing loss?
Relative values of different outcomes
The guideline committee agreed that the outcomes critical for decision-making were missed identification or identification rate in people who have hearing loss and dementia or cognitive impairment or learning difficulties.

Hearing loss Subgroups
© NICE 2017. All rights reserved. Subject to Notice of rights. 80
Quality of the clinical evidence
No relevant clinical evidence was identified.
Trade-off between clinical benefits and harms
As no evidence was found the recommendations were based on consensus of the committee.
The committee is aware that there is a higher prevalence of hearing loss in people with mild cognitive impairment, dementia, and learning disabilities. People in these subgroups also might not be able to report hearing loss themselves, therefore the committee agreed that it was important to conduct hearing assessment and review on a regular basis for these groups. The aim of the committee was to encourage inclusion of hearing assessment as part of the regular health check for these subgroups.
The committee noted the importance of dementia and learning disability services being alert to hearing loss having an impact on communication needs of these groups of people. The committee discussed the particular vulnerability of people in residential settings whose hearing loss can remain unidentified or inadequately managed because of a lack of awareness and understanding of hearing loss amongst staff. This can result in poorer and less frequent social interaction for residents and impacts on their quality of life.
The committee was aware that checking hearing is part of the baseline assessment in the GP’s annual check for people aged 14 and over who have been assessed as having moderate, severe or profound learning disabilities, or people with a mild learning disability who have other complex health needs.
76 The document outlining
this check makes it clear that the person should also see an audiologist for a full hearing assessment but does not recommend the frequency with which audiological review should occur. Hearing is commonly checked during childhood, but in this population the committee was not aware if hearing is currently routinely assessed on transition to adult services. Establishing hearing ability is an important part of assessment of this group at this stage because hearing can deteriorate early in adult life and it is important to establish a baseline and then retest regularly.
The committee considered that for those with learning disabilities and those with dementia and mild cognitive impairment repeating the referral to audiology every 2 years would be good practice because of the high risk of developing hearing loss in these groups. It was agreed that there was no harm associated with repeated referrals and that the clinical benefits of early identification and management of hearing loss in these patients far outweigh the additional time involved in their assessment.
The committee noted that in addition to dementia masking hearing loss, hearing loss can also mask dementia. Misinterpreting symptoms of hearing loss as dementia and vice versa does occur.
Trade-off between net clinical effects and costs
No health economic evidence was identified for this question.
The committee, however, noted that people with learning difficulties or cognitive impairment should already receive an annual general primary care health check as discussed above. This includes a hearing check with the GP, and also states that people should be seen by an audiologist, but does not suggest at what frequency. People with dementia also have frequent health checks but there are no national recommendations relating to assessing their hearing. Current practice is hence unclear, but it is unlikely all people with dementia are receiving a frequent full hearing assessment. People with dementia have a high prevalence of hearing loss, while people with mild cognitive impairment also have an increased risk of hearing loss, with deterioration in early adult life more common than in the general population.

Hearing loss Subgroups
© NICE 2017. All rights reserved. Subject to Notice of rights. 81
To assess the likely cost effectiveness of referring all people with dementia or mild cognitive impairment for a hearing assessment with an audiologist every 2 years an additional sensitivity analysis was conducted as part of the original economic modelling comparing hearing aids with no hearing aids (see appendix N). This looked at a population of men aged 75 over a horizon of 10 years, and showed that if the proportion of the people referred for hearing assessment who in fact have an aidable hearing loss is decreased to 2% then this would still be cost effective at a threshold of £20,000 per QALY gained (ICER: £18,214 per QALY gained). Since annual incidence of hearing loss in people in these groups is at least 2–4% in younger age groups (rising with age) this indicates that referring all these groups for audiological assessment every 2 years would be cost effective.
Other considerations The committee noted that for people who are unable to communicate by themselves that they have hearing difficulties, proactive provision of a hearing assessment will be the only way to identify hearing loss. This is an equality issue, meaning that such provision is necessary.
The committee is aware of other subgroups with higher than average prevalence of hearing loss, who are less likely to report it themselves, or for whom the presence of hearing loss is less likely to be identified by clinicians. The committee agreed that the list of subgroups in the NHS Action Plan on Hearing Loss (2015)
29 was quite
comprehensive and also included: older people, those with mental health conditions, including depression, care home residents and potential residents, those in other care and support settings, those with impaired vision, veterans and other exposed to noise in the workplace or socially, those having ototoxic drugs and those with brain tumours.
The committee agreed that good awareness and surveillance of hearing problems is required to enable both people and health professionals to identify and raise concerns about hearing and communication problems on an individual and population basis.
It is important that hearing assessment is carried out by a trained audiologist in an appropriately sound-treated room. The hearing assessment of choice is pure tone audiometry, but the committee wished to emphasise that alternative methods of assessment should be used if clinical circumstances rule out standard methods, for example, if the person is not able to participate in the test. Testing using play techniques or visual reinforcement may be needed; this may require referral to a specialist service.
The use of outdated clinical tests like a whisper test is inappropriate because these tests do not have the accuracy essential to identify hearing loss.
1

Hearing loss Early versus delayed management of hearing loss
© NICE 2017. All rights reserved. Subject to Notice of rights. 82
8 Early versus delayed management of hearing loss 1
Introduction 8.12
Hearing loss is usually insidious in onset with slow progression over a number of years. Early 3 symptoms can be subtle but can have a significant impact on the individual, affecting their social 4 functioning and quality of life. 5
There appears to be considerable variation across the country in the time taken between a patient 6 presenting with hearing loss and receiving treatment, with no national guidance or standards 7 available. Data suggest that most people with hearing loss have lived with their symptoms for 10 8 years before being referred for the most appropriate intervention.24 There is uncertainty around 9 whether receiving audiological care earlier would result in improved outcomes for patients as well as 10 financial savings for the NHS. This chapter examines the clinical and cost effectiveness of early versus 11 delayed management of hearing loss. 12
Review question: What is the clinical and cost effectiveness of early 8.213
versus delayed management of hearing loss on patient outcomes? 14
The focus of this question was to investigate the effectiveness of managing patients with early or 15 mild hearing loss rather than waiting until their hearing loss is more severe in later-presenting 16 patients, which is a common scenario in clinical practice. Therefore, studies of patients with sudden 17 sensorineural hearing loss were excluded. For full details see review protocol in appendix C. 18
Table 17: PICO characteristics of review question 19
Population Adults aged 18 and over presenting with hearing loss
Intervention Early management – at first presentation or short history and mild/minimal symptoms
Comparison Delayed identification – long history prior to management (as defined by the studies)
Outcomes Critical
Hearing-specific health-related quality of life
Health-related quality of life
Listening ability
Important
Usage of hearing aids (including data logging and self-report
Change in cognitive function (Mini-Mental State Examination, MMSE; Modified Mini-Mental State Examination (3MS)
Social functioning or employment
Sound localisation as measured by laboratory test
Speech in noise detection as measured by laboratory tests
Study design RCTs or non-randomised comparative studies if no RCTS are identified
8.2.1 Clinical evidence 20
One study was included in the review;24 this is summarised in Table 18 below. Evidence from this 21 study is summarised in the clinical evidence summary below (Table 19). No randomised trials were 22 identified and the available data were from a case–control study design, which starts at low quality in 23 the GRADE rating system. See also the study selection flow chart in appendix E, forest plots in 24 appendix K, study evidence tables in appendix H, GRADE tables in appendix J and excluded studies list 25 in appendix L. 26

Hearing loss Early versus delayed management of hearing loss
© NICE 2017. All rights reserved. Subject to Notice of rights. 83
This study was part of a Health Technology Assessment and addressed the question of early versus 1 delayed management of hearing loss with hearing aids using a case–control study design. The aim 2 was to evaluate the benefit of fitting hearing aids in those found to be eligible after early adult 3 screening for hearing loss among 50–65 year olds. This was compared with people who were fitted 4 after standard referral to a hearing aid clinic, who are generally older and have a longer history of 5 hearing loss. Two control groups were selected to reduce the chance that any identified advantage 6 was due to unpredictable bias, assuming that any benefit of early management via a screening 7 programme was consistently present in comparison with both control groups. Note that the duration 8 of hearing loss and the hearing level at hearing aid fitting is not reported for the control groups. 9

Early versus d
elayed m
anage
men
t of h
earing lo
ss
Hearin
g loss
© N
ICE 2
01
7. A
ll rights reserved
. Sub
ject to N
otice o
f rights.
84
Table 18: Summary of studies included in the review 1
Study
Intervention and comparison
Early management population
Control group 1; delayed management population
Control group 2; delayed management population
Outcomes Comments
Davis 2007
24
See also Davis 1992; 25
Stephens 1990
96
Hearing aids fitted after early adult screening (50-65 year olds) versus after standard referral to a hearing aid clinic
Median age at follow-up (IQR): 70 (66-74)
Median age at fitting (IQR): 58 (54-62)
Median duration of aid ownership: 12 years
n=50 identified from screening studies in Wales based on GP registers (original sample n=176; 43% of those traced still using their hearing aids). Those who reported hearing problems on a questionnaire had audiometric testing (others had home audiometric testing) and those with a hearing level >30 dB in the worse hearing ear were offered hearing aid fitting. The mean hearing level in the better ear at fitting was 30 dB
Median age at follow-up (IQR): 72.5 (68-77)
Median age at fitting (IQR): 69 (64-72)
Median duration of aid ownership: 4 years
n=50 drawn from MRC IHR database of people referred to an NHS hearing aid clinic in Glasgow through standard NHS channels, but participating in other research studies and many being fitted with behind-the-ear digital hearing aids.
Each subject matched to a subject in early management group for:
Gender
Socioeconomic group
Hearing threshold in better and worse ear at follow-up
Age at follow-up
Median age at follow-up (IQR): 69 (66-75)
Median age at fitting (IQR): 69 (66-75)
Median duration of aid ownership: approximately 3 months
n=50 drawn from another MRC IHR database of people referred by GP to an NHS hearing aid clinic in Glasgow or Manchester and fitted with standard NHS analogue hearing aids (BE series).
Each subject matched to a subject in early management group for:
Gender
Hearing level in aided ear
Age at follow-up
And matching was attempted for:
Socio-economic group
Hearing levels in better and worse ear
SHHI: questionnaire on difficulties understanding speech in life situations (0-42; high worst)
ERS: questionnaire on emotional effects of hearing loss (0-10; high worst)
Glasgow Health Status Inventory (GHSI): adapted to address hearing difficulties including participation restrictions, emotional effects, social support, and physical health (0-100; high best)
GHABP: outcome of hearing aid fitting assessed for specific listening circumstances across 6 subscales, 4 of which are relevant – ‘use’ (0-100; high best), ‘benefit’(0-100; high best), residual disability (activity limitation) (0-100; high worst); satisfaction with aid performance (0-100; high best)
EuroQol thermometer:
Only those still using the hearing aid at follow-up were included; 43% of original screening group
Controls fitted at an older age, which represents the delay in management (assuming their hearing loss began earlier)
Many fitted after early screening had subsequently stopped using the hearing aids (no ongoing post-fitting counselling or support was provided)
Control group 1 statistically significantly different from screening group for age at follow-up. But median difference of 2.5 years is unlikely to be clinically important

Early versus d
elayed m
anage
men
t of h
earing lo
ss
Hearin
g loss
© N
ICE 2
01
7. A
ll rights reserved
. Sub
ject to N
otice o
f rights.
85
Study
Intervention and comparison
Early management population
Control group 1; delayed management population
Control group 2; delayed management population
Outcomes Comments
Pure tone hearing levels were measured, by air
conduction, averaged over 0.5, 1, 2 and 4 kHz.
VAS of general health (0-100; high best)
High proportion were male (74%); this was matched across all groups.
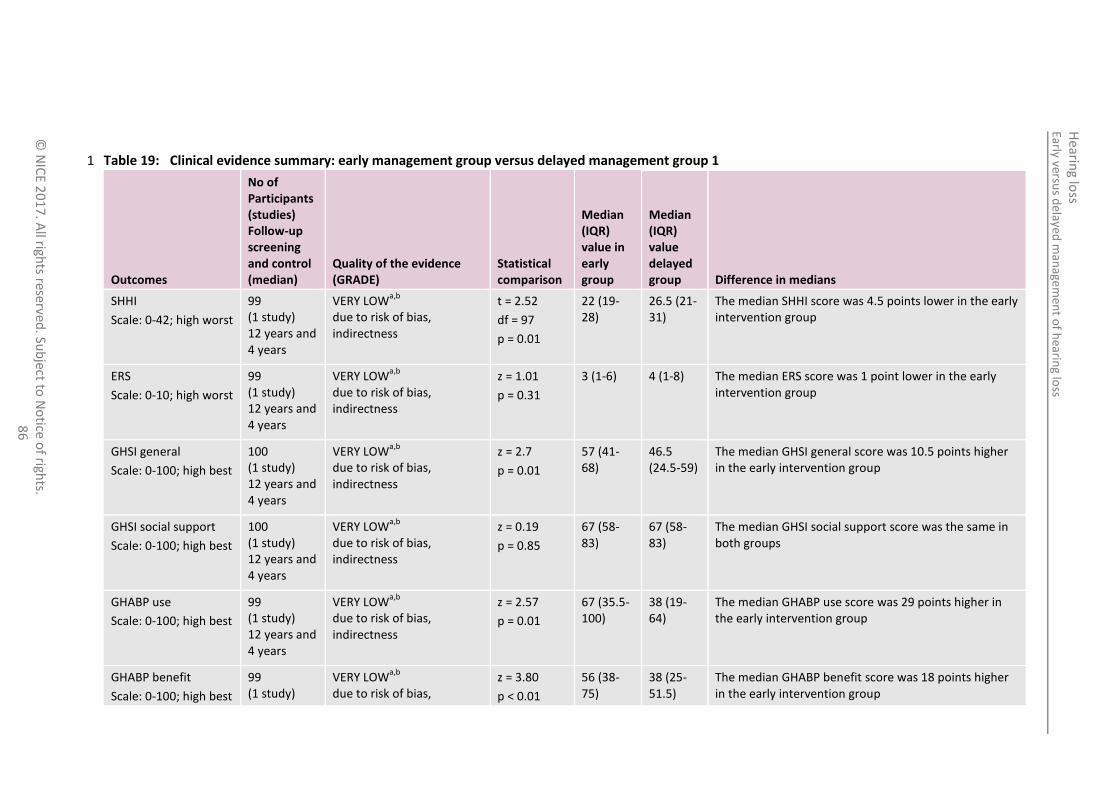
Early versus d
elayed m
anage
men
t of h
earing lo
ss
Hearin
g loss
© N
ICE 2
01
7. A
ll rights reserved
. Sub
ject to N
otice o
f rights.
86
Table 19: Clinical evidence summary: early management group versus delayed management group 1 1
Outcomes
No of Participants (studies) Follow-up screening and control (median)
Quality of the evidence (GRADE)
Statistical comparison
Median (IQR) value in early group
Median (IQR) value delayed group Difference in medians
SHHI
Scale: 0-42; high worst
99 (1 study) 12 years and 4 years
VERY LOWa,b
due to risk of bias, indirectness
t = 2.52
df = 97
p = 0.01
22 (19-28)
26.5 (21-31)
The median SHHI score was 4.5 points lower in the early intervention group
ERS
Scale: 0-10; high worst
99 (1 study) 12 years and 4 years
VERY LOWa,b
due to risk of bias, indirectness
z = 1.01
p = 0.31
3 (1-6) 4 (1-8) The median ERS score was 1 point lower in the early intervention group
GHSI general
Scale: 0-100; high best
100 (1 study) 12 years and 4 years
VERY LOWa,b
due to risk of bias, indirectness
z = 2.7
p = 0.01
57 (41-68)
46.5 (24.5-59)
The median GHSI general score was 10.5 points higher in the early intervention group
GHSI social support
Scale: 0-100; high best
100 (1 study) 12 years and 4 years
VERY LOWa,b
due to risk of bias, indirectness
z = 0.19
p = 0.85
67 (58-83)
67 (58-83)
The median GHSI social support score was the same in both groups
GHABP use
Scale: 0-100; high best
99 (1 study) 12 years and 4 years
VERY LOWa,b
due to risk of bias, indirectness
z = 2.57
p = 0.01
67 (35.5-100)
38 (19-64)
The median GHABP use score was 29 points higher in the early intervention group
GHABP benefit
Scale: 0-100; high best
99 (1 study)
VERY LOWa,b
due to risk of bias,
z = 3.80
p < 0.01
56 (38-75)
38 (25-51.5)
The median GHABP benefit score was 18 points higher in the early intervention group

Early versus d
elayed m
anage
men
t of h
earing lo
ss
Hearin
g loss
© N
ICE 2
01
7. A
ll rights reserved
. Sub
ject to N
otice o
f rights.
87
Outcomes
No of Participants (studies) Follow-up screening and control (median)
Quality of the evidence (GRADE)
Statistical comparison
Median (IQR) value in early group
Median (IQR) value delayed group Difference in medians
12 years and 4 years
indirectness
GHABP residual disability
Scale: 0-100; high worst
99 (1 study) 12 years and 4 years
VERY LOWa,b
due to risk of bias, indirectness
t = 0.842
df = 97
p = 0.40
25 (13-38)
28 (13-39.5)
The median GHABP residual disability
score was 3 points lower in the early intervention group
GHABP satisfaction
Scale: 0-100; high best
99 (1 study) 12 years and 4 years
VERY LOWa,b
due to risk of bias, indirectness
z = 4.69
p < 0.01
63 (44-75)
40 (25-50)
The median GHABP satisfaction score was 23 points higher in the early intervention group
EuroQol thermometer
Scale: 0-100; high best
100 (1 study) 12 years and 4 years
VERY LOWa,b
due to risk of bias, indirectness
z = 0.10
p = 0.92
67.5 (50-80)
70 (50-80)
The median EuroQol thermometer score was 2.5 points lower in the early intervention group
a Downgraded by 1 increment if the majority of the evidence was at high risk of bias, and downgraded by 2 increments if the majority of the evidence was at very high risk of bias b Downgraded by 1 increments because the majority of evidence was from an indirect population/intervention (early versus delayed defined by mode of referral for hearing aid use – early screening or standard referral to hearing aid clinic at older age)
1
Table 20: Clinical evidence summary: early management group versus delayed management group 2 2

Early versus d
elayed m
anage
men
t of h
earing lo
ss
Hearin
g loss
© N
ICE 2
01
7. A
ll rights reserved
. Sub
ject to N
otice o
f rights.
88
Participants (studies) Follow-up screening and control (median)
(GRADE) l comparison
(IQR) value in early group
Median (IQR) value delayed group Difference in medians
GHSI general
Scale: 0-100; high best
100 (1 study) 12 years and 3 months
VERY LOWa,b
due to risk of bias, indirectness
Z = 3.61
p ≤ 0.001
57 (41-68)
42 (30.5-52.5)
The median GHSI general score was 15 points higher in the early intervention group
GHSI social support
Scale: 0-100; high best
100 (1 study) 12 years and 3 months
VERY LOWa,b
due to risk of bias, indirectness
Z = 6.39
P < 0.01
67 (58-83)
44 (31-51.5)
The median GHSI social support score was 23 points higher in the early intervention group
GHABP use
Scale: 0-100; high best
99 (1 study) 12 years and 3 months
VERY LOWa,b
due to risk of bias, indirectness
z = 2.78
p = 0.01
67 (35.5-100)
48.5 (34-61.5)
The median GHABP use score was 18.5 points higher in the early intervention group
GHABP benefit
Scale: 0-100; high best
99 (1 study) 12 years and 3 months
VERY LOWa,b
due to risk of bias, indirectness
z = 4.15
p < 0.01
56 (38-75)
42.5 (24-47)
The median GHABP benefit score was 13.5 points higher in the early intervention group
GHABP residual disability
Scale: 0-100; high worst
99 (1 study) 12 years and 3 months
VERY LOWa,b
due to risk of bias, indirectness
t = 2.34
df = 97
p = 0.02
25 (13-38)
34.5 (21-45)
The median GHABP residual disability
score was 9.5 points lower in the early intervention group
GHABP satisfaction
Scale: 0-100; high best
99 (1 study) 12 years and 3 months
VERY LOWa,b
due to risk of bias, indirectness
z = 4.88
p < 0.01
63 (44-75)
39 (28-50)
The median GHABP satisfaction score was 24 points higher in the early intervention group

Early versus d
elayed m
anage
men
t of h
earing lo
ss
Hearin
g loss
© N
ICE 2
01
7. A
ll rights reserved
. Sub
ject to N
otice o
f rights.
89
Outcomes
No of Participants (studies) Follow-up screening and control (median)
Quality of the evidence (GRADE)
Statistical comparison
Median (IQR) value in early group
Median (IQR) value delayed group Difference in medians
EuroQol thermometer
Scale: 0-100; high best
100 (1 study) 12 years and 3 months
VERY LOWa,b
due to risk of bias, indirectness
z = 1.49
p = 0.14
67.5 (50-80)
60 (50-70)
The median EuroQol thermometer score was 7.5 points lower in the early intervention group
a Downgraded by 1 increment if the majority of the evidence was at high risk of bias, and downgraded by 2 increments if the majority of the evidence was at very high risk of bias b Downgraded by 1 increments because the majority of evidence was from an indirect population/intervention (early versus delayed defined by mode of referral for hearing aid use – early screening or standard referral to hearing aid clinic at older age)
.1

Hearing loss Early versus delayed management of hearing loss
© NICE 2017. All rights reserved. Subject to Notice of rights. 90
8.2.2 Economic evidence 1
8.2.2.1 Published literature 2
No relevant health economic studies were identified. 3
See also the health economic study selection flow chart in appendix F. 4
8.2.2.2 Original cost-effectiveness analysis – summary 5
An original health economic model was constructed in order to conduct cost–utility analysis for this 6 question and the review question regarding hearing aid use versus no hearing aids (see section 15.2). 7 These questions were agreed by the guideline committee to be the highest priorities for original 8 economic analysis in this guideline due to the very large number of people using or potentially 9 eligible for hearing aids, and the lack of existing health economic research in this area. 10
Full details of the analysis can be found in appendix N. It includes a comparison between a cohort of 11 people given a hearing assessment and offered hearing aids, if eligible, immediately after first 12 presenting with hearing difficulties (early treatment) and a cohort who were not assessed or offered 13 hearing aids until 10 years after they first reported hearing difficulties (delayed treatment). 14
The base case probabilistic results, reflecting the costs and outcomes for men aged 65 at the start of 15 the analysis over a lifetime horizon, are in Table 21. 16
Table 21: Results of early versus delayed use of hearing aids, base case 17
Comparator Cost Incremental cost QALYs Incremental QALYs ICER (£/QALY)
Delayed treatment £853 - 7.75 -
Early treatment £1,845 £992 7.96 0.21 £4,716
Sensitivity analysis found these results to be robust to variations in all the parameters investigated in 18 the analysis, including the age of the participants at the start of the analysis, their sex, the 19 proportions not suitable for hearing aids or who decline to use hearing aids, rates at which 20 participants stop using hearing aids, and the magnitude of improvement in quality of life caused by 21 hearing aid use: the ICER was below £10,000 per QALY gained in every case. 22
The original health economic modelling is summarised in the health economic evidence profile below 23 (Table 22). 24
25

Early versus d
elayed m
anage
men
t of h
earing lo
ss
Hearin
g loss
© N
ICE 2
01
7. A
ll rights reserved
. Sub
ject to N
otice o
f rights.
91
Table 22: Health economic evidence profile: early management versus delayed management using hearing aids
Study Applicability Limitations Other comments Incremental cost
Incremental effects
Cost effectiveness Uncertainty
NGC 2017 (UK)
(see appendix N)
Directly applicable
(a)
Minor limitations
(b)
Lifetime Markov model
Population: people reporting hearing problems.
Patients offered hearing aids at first report of hearing problems compared to those offered hearing aids after 10-year delay
Effectiveness: HRQoL benefit of hearing aids based on UK study using HUI3 (Barton 2004
10)
£992 0.21 ICER: £4,716 per QALY gained
The results were most sensitive to the quality of life benefit of hearing aids. When this was halved the ICER doubled to £9,445 per QALY gained, still well below £20,000 per QALY gained. Changing all other parameters had only very small effects on the ICER (below £6,300 per QALY gained in each case).
Abbreviations: HUI3: health utilities index mark 3; ICER: incremental cost-effectiveness ratio; QALYs: quality-adjusted life years (a) Designed for this guideline using a UK NHS setting (b) Some parameters estimated by expert consensus – conservative estimates were used. Model simplifies reality by reducing number of transitions between hearing aid use and non-use, but
this has no significant effect on the results.

Hearing loss Early versus delayed management of hearing loss
© NICE 2017. All rights reserved. Subject to Notice of rights. 92
8.2.3 Evidence statements 1
Clinical 2
Early management group versus delayed management group 1 3
There was a clinically important benefit of early management for SHHI, GHSI (general) and for 4 GHABP use, benefit, and satisfaction (very low quality evidence, 1 study). 5
There was no clinically important difference in ERS, GHSI (social support), GHABP residual 6 disability and EuroQuol thermometer (very low quality evidence, 1 study). 7
Early management group versus delayed management group 2 8
There was a clinically important benefit of early management for GSHI (general and social 9 support), GHABP use, benefit and satisfaction (very low quality evidence, 1 study). 10
There was no clinically important difference in GHABP residual disability and EuroQuol 11 thermometer (very low quality evidence, 1 study). 12
Economic 13
One original cost–utility analysis found that early provision of hearing aids was cost effective 14 compared to delayed provision of hearing aids for managing hearing loss (ICER: £4,716 per QALY 15 gained). This analysis was assessed as directly applicable with minor limitations. 16
8.2.4 Recommendations and link to evidence 17
Recommendations 13. Refer all adults, regardless of their age, who present for the first time with hearing difficulties, or in whom you suspect hearing difficulties, to audiology services for an assessment, unless they have:
sudden or rapid onset of hearing loss (see recommendation 1)
hearing loss with specific additional symptoms or signs (see recommendations 2 to 7).
Relative values of different outcomes
The following critical outcomes were included in this review: hearing-specific health-related quality of life, health-related quality of life, listening ability and outcomes reported by carer or ’communications partner’.
The following important outcomes were also included: usage of hearing aids (including data logging and self-report), change in cognitive function, social functioning or employment, sound localisation as measured by laboratory tests and speech in noise detection as measured by laboratory tests.
Quality of the clinical evidence
One study assessing the benefits of early fitting of hearing aids was included and all outcomes were of very low quality due to the study design (case–control), the fact that not all of the potential confounders noted in advance by the guideline committee were controlled for and only those people still using their hearing aids at follow-up were included (<50% in the early management group). In addition, the definition of early versus delayed was based on the mode of referral or identification (proactive screening versus standard presentation through GP visits) with no data available about the time from onset to GP visit. Therefore, there was serious indirectness.
No studies were available for other interventions, such as assistive listening devices, pharmacological or behavioural management.
Trade-off between Overall, the study showed evidence across a range of self-report questionnaires for a

Hearing loss Early versus delayed management of hearing loss
© NICE 2017. All rights reserved. Subject to Notice of rights. 93
clinical benefits and harms
benefit of fitting hearing aids at an earlier age, compared with fitting at an older age. This was after controlling for age, hearing level, gender and socio-economic group using 2 control groups that differed on some important variables to minimise the chance of any findings being influenced by unidentified biases.
Specifically, clinical benefits were found in comparison with both control groups related to:
fewer adverse effects of hearing loss in the person’s life (general subscale of GHSI)
greater use of hearing aids (GHABP)
more self-perceived acoustical benefit (GHABP)
greater satisfaction (GHABP).
Benefits were found in comparison with only 1 of the control groups related to:
better ability to understand speech (SHHI; not administered in control group 2)
support from family and friends (social support subscale of GHSI versus control group 2).
No clinically important differences between early and delayed groups were seen for:
ERS (measures emotional effects of hearing loss)
EuroQol thermometer scale (general health-related quality of life)
GHABP residual disability subscale (difficulty hearing in situations where people wore a hearing aid). However, there was a statistically significant benefit on this outcome compared with control group 2 although the absolute values did not cross the committee’s threshold for clinical importance.
The majority of the outcomes provided corroborative support for a benefit of early fitting of hearing aids. The EuroQol thermometer is part of a quality of life instrument (EQ-5D) thought to be insensitive to hearing loss and so the committee was not surprised that this outcome did not show a benefit of early fitting. It was also noted that it appears inconsistent for the residual disability subscale of the GHABP not to show a clinical difference when there is more hearing benefit and hearing aid satisfaction. However, there are a number of points that led the committee to believe that this apparent inconsistency does not discredit the other findings:
Across both comparisons the residual disability was less in the early group, although not reaching clinical significance.
The committee commented that there is a known phenomenon to explain this difference across the outcomes. Hearing aid users can be found to have an increased awareness of hearing disability once they have acclimatised to using an aid; however, they also have a better ability to cope with the difficulties of their condition.
The HTA study used analogue hearing aids but the additional flexibility and features on current digital hearing aids are likely to result in greater benefit.
In summary, the evidence suggests a range of benefits for hearing ability, hearing aid use and quality of life, without any known harms.
The committee noted that the clinical study identified focused on early screening for hearing loss and the committee discussed the risks and benefits of fitting a hearing aid for mild hearing loss when other management strategies such as listening tactics or communication training might be preferable to the person.
The committee noted that current best practice is to offer active management, such as information and education, hearing aids, assistive listening devices or auditory training at presentation with hearing difficulties. However, there is variability across the country.
The committee agreed that it is not good practice for a GP to delay referral for hearing difficulties until the problem is more severe. The committee agreed that all people with hearing difficulties presenting to a GP should be referred to an

Hearing loss Early versus delayed management of hearing loss
© NICE 2017. All rights reserved. Subject to Notice of rights. 94
audiology department for hearing assessment and advice in the first instance unless their need is for immediate or urgent medical care for hearing problems.
Trade-off between net clinical effects and costs
No published health economic evaluations were identified for this question.
Original health economic modelling was conducted for this question. It found that at a cost-effectiveness threshold of £20,000 per QALY gained, early treatment with hearing aids is highly cost effective compared to delayed treatment, with an ICER of £4,716 per QALY for lifetime treatment, or £5,190 per QALY for the first 10 years of treatment (based on men aged 65 at the start of the analysis). Sensitivity analysis found these results to be robust to all uncertainties investigated in the data used, including the age of the participants at the start of the analysis.
The committee noted that assumptions and estimated data used in the model were chosen conservatively, that is, on balance they were likely to overestimate incremental costs and underestimate incremental effectiveness, favouring delayed treatment over early treatment. Notably, the model did not seek to include any advantages that the use of hearing aids might lead to in respect of improvements in any aspects of health other than hearing, or reduction in NHS costs as a result.
The committee was hence satisfied that referring people who present with hearing difficulties for a hearing assessment at the earliest opportunity is cost effective, and so agreed that such people should be referred.
The committee also noted that conducting a hearing assessment continued to be cost effective in the analysis even when the proportion of people without aidable hearing loss was increased very substantially. Given this, and the benefits of identifying people with hearing loss early, the committee agreed that proactively identifying people who appear to be showing signs of hearing loss and encouraging them to have a hearing assessment, even if they have not presented reporting hearing loss, would also be both clinically beneficial and cost effective.
Other considerations The definition of ‘early intervention’ was discussed and it was suggested ‘early’ could be defined as ‘at the time of first presentation to the GP’ with an awareness of hearing problems.
The committee highlighted the importance of education and training of health and social care professionals across all sectors in improving referral of people for hearing difficulties. It was felt that hearing loss is not always considered a priority in a GP’s appointment. While that may be as a consequence of short appointments and a lot to cover, it is acknowledged that there is a tendency to overlook sensory health in clinical practice. There was concern at reports of GPs being reluctant to refer .The committee also recognised that many people do not report hearing loss to their GP (or any other medical professional) until it has been present for a long time (around 10 years
24). Given the advantages and cost effectiveness of managing hearing loss at
an earlier stage, the committee agreed that in addition to referring people for assessment when they directly report hearing problems, GPs, other healthcare professionals and carers should actively consider the possibility of hearing problems in the course of routine consultations or care for other conditions. For example, if a patient appears to be having problems hearing the healthcare or social care professional when he or she is talking to them, they should specifically ask about hearing difficulties and recommend referral for audiological assessment.
1

Hearing loss Communication needs
© NICE 2017. All rights reserved. Subject to Notice of rights. 95
9 Communication needs 1
Introduction 9.12
Communication difficulties experienced by a person with hearing loss cannot be judged just by a 3 measurement of hearing thresholds on a pure tone audiogram. Those with hearing loss depend on 4 other cues such as lip-reading, facial expression and context to follow a conversation. Their listening 5 environment can be challenging and other disabilities, such as visual loss or cognitive decline, can 6 compound the effects of their hearing difficulties. It is important therefore to explore an individual’s 7 hearing and communication needs, rather than just measuring their loss, in order to devise a 8 meaningful individual management plan. 9
People with hearing difficulties are referred to audiology services for assessment. This assessment 10 will almost always include measurement of hearing sensitivity or threshold (the quietest sounds that 11 can just be heard) using pure-tone audiometry (PTA); tests that have well established procedure and 12 practice guidance. However, assessment of hearing and communication needs, although just as 13 important, is undertaken inconsistently across England. 14
Examples of recommended, good clinical practice exist, such as those within the service model 15 outlined within NHS England’s ‘Commissioning Services for People with Hearing Loss: A framework 16 for clinical commissioning groups’. However there are no recommended procedures or practice 17 guidance as to which methods of assessment of communication needs are most suitable, neither is 18 there advice as to which tools to use. 19
The intention of this question is to examine the benefits of assessing communication needs, and to 20 identify which are the most appropriate tools and approaches. The chapter will also consider how 21 identified communication needs should be used to direct discussion of management options 22 between patients and audiologists. 23
Review question: What is the clinical and cost effectiveness of 9.224
communication needs assessment in adults with hearing loss? 25
For full details see review protocol in appendix C. 26
Table 23: PICO characteristics of review question 27
Population Adults aged 18 and over presenting with hearing loss
Intervention Fully comprehensive assessment of communication needs:
Measures of activity limitations (disability) for example GHABP (initial disability or disability pre-intervention)
Measures of participation restriction (handicap) HHIE (pre- intervention)
Measures of individual needs for example COSI
Individual managements plans
Comparison Pure tone audiogram before an intervention of hearing aids or auditory training
Speech and hearing in noise tests before an intervention of hearing aids or auditory training
Whisper voice test before an intervention of hearing aids or auditory training
Outcomes Critical outcomes
Hearing-specific health-related quality of life
- Hearing Handicap Inventory for the Elderly (HHIE) or HHI for Adults (HHIA)
- Quantified Denver Scale of Communication (QDS)

Hearing loss Communication needs
© NICE 2017. All rights reserved. Subject to Notice of rights. 96
- Auditory Disability Preference – Visual Analog Scale (ADPI-VAS)
- GHABP
- CPHI
- COSI
- Device Orientated Subjective Outcome Scale
- Any questionnaire not specified above that is relevant
Listening ability
- Abbreviated Profile of Hearing Aid Benefit (APHAB)
- Speech, Spatial and Qualities of Hearing (SSQ)
- Glasgow Hearing Aid Benefit Profile (GHABP) residual disability subscale
Important outcomes
Social functioning or employment
Usage of hearing aids (including data logging and self-report (if applicable)
Study design RCTs and systematic reviews of RCTs
9.2.1 Clinical evidence 1
No relevant clinical studies were identified that look at the effectiveness of conducting a fully 2 comprehensive assessment compared to hearing tests to determine communication needs in people 3 with hearing loss. See study selection flow chart in appendix E and the excluded studies list in 4 appendix L. 5
6
9.2.2 Economic evidence 7
No relevant health economic studies were identified. 8
See also the health economic study selection flow chart in appendix F. 9
9.2.3 Evidence statements 10
Clinical 11
No relevant clinical evidence was identified. 12
Economic 13
No relevant economic evaluations were identified. 14
9.2.4 Recommendations and link to evidence 15
Recommendations 14. Include and record the following as part of the audiological assessment for adults:
a full history including relevant symptoms, comorbidities, cognitive ability, physical mobility and dexterity
the person’s hearing and communication needs at home, at work or in education, and in social situations
any psychosocial difficulties related to hearing
the person’s expectations and motivations with respect to their hearing loss and the listening and communication strategies available

Hearing loss Communication needs
© NICE 2017. All rights reserved. Subject to Notice of rights. 97
to them
any restrictions on activity, assessed using a validated self-report instrument such as the Glasgow Hearing Aid Benefit Profile or the Client-Orientated Scale of Improvement
otoscopy
pure tone audiometry
tympanometry.
15. After the audiological assessment:
discuss with the person:
i. the pure tone audiogram and the impact their hearing loss might have on communication
ii. hearing deficits (such as speech in noise) that are not obvious from the audiogram
iii. the options for managing their hearing needs, such as hearing aids, assistive listening devices and communication strategies, and the potential benefits and limitations of each option.
agree and record a personalised management plan, taking into account the person’s preferences, including goals, and give the person a copy.
Relative values of different outcomes
The following critical outcomes were included in this review: hearing-specific health-related quality of life (for example HHIE, QDS and GHABP scales) and listening ability (for example APHAB SSQ GHABP residual disability scales).
The following outcomes were identified as important for this review: social functioning or employment and usage of hearing aids (including data logging and self-report).
Quality of the clinical evidence
No clinical evidence was identified for this review.
Trade-off between clinical benefits and harms
As no evidence was found these recommendations were made by consensus of the committee.
The committee agreed that an example of what comprises an audiological assessment is provided in the assessment guidance set out in the NHS standard contract for adult hearing services. The committee agreed that the components of the assessment listed in that document should be included as part of the initial assessment and reflect good practice, but noted that there is wide variation in the comprehensiveness of assessments undertaken in current practice and in the application of the NHS contracts across the UK. The components of a typical audiological assessment would include a clinical interview to assess the hearing and communication needs of the person. The audiologist would establish any relevant symptoms, cognitive ability, comorbidities, dexterity, lifestyle and the person’s goals and expectations in order to work with the person in deciding which interventions would be appropriate to meet their needs, such as hearing aids, communication support or strategies or information about other communication devices available. Examination (e.g. otoscopy) and measurements such as pure tone audiometry and tympanometry, and assessment of activity restrictions and limitations to participation using a validated self-report instrument would also be carried out.
The committee agreed that the most commonly used validated self-report instruments to quantify a person’s needs are the Glasgow Hearing Aid Benefit (GHABP) and the Client-Orientated Scale of Improvement. These were considered to be the most appropriate to quantify a person’s activity restrictions and participatory

Hearing loss Communication needs
© NICE 2017. All rights reserved. Subject to Notice of rights. 98
limitations.
The committee discussed people with complex needs, such as those with dementia, learning, or communication disabilities or who may need a different approach when carrying out an assessment and the committee noted an intermediary may be needed. The history may need to be simplified or obtained from the carer or intermediary. Most people with complex needs will be able to perform pure tone audiometry but for those who cannot, play techniques or visual reinforcement may be required and that may need referral to a specialist centre. Feedback and discussion will need to be tailored to the ability of the person to understand and contribute, with the carer or intermediary helping with hearing aid management and insertion depending on need.
The committee members were in agreement that in their experience, a comprehensive assessment of the person’s needs, and opportunity to discuss the management options available to address their hearing loss, achieves better health outcomes for the patient in the long term. It is important that the patient has the information with which to make informed decisions on what management options best suit their individual needs. An inadequate assessment may result in an inappropriate management strategy being selected and as a consequence poor compliance and reduced quality of life. A personal management plan is important as a record of the conclusions reached between the audiologist and the person and helpful at a future follow-up appointment to review the decisions reached and consider any changes that may be required.
Trade-off between net clinical effects and costs
No health economic evidence was identified for this question.
The committee considered that an assessment of communication needs is principally a matter of both patients’ rights and of necessity, as it will be impossible for a person’s doctor(s) and other clinicians whom they may subsequently need to see to be able to interact with them successfully – and hence to be able to treat them effectively – if they cannot communicate well with the person with hearing loss. It is hence not primarily an economic issue.
However, the committee also observed that there is currently often a waste of resources through people with hearing loss requiring additional appointments to resolve a health issue (often unrelated to hearing), because they did not fully hear and understand what was said in the first appointment. Therefore, the committee agreed that a modest amount of time (and hence money) invested in assessing a person’s communication needs at an early stage would be very likely to save as much or more time by reducing future unnecessary use of health services. Thus the committee expects these recommendations as a whole to be neutral or cost saving for the NHS, whilst leading to improvements in quality of life and in experience of using NHS services. They will therefore be cost effective, and potentially cost saving.
Other considerations See also the review of patient-centred decision tools in chapter 13, where the committee refers to recommendations made in NICE’s guidance on patient experience. The committee believes it will only be possible to fulfil those recommendations if a comprehensive assessment of communication needs has first been conducted.
1
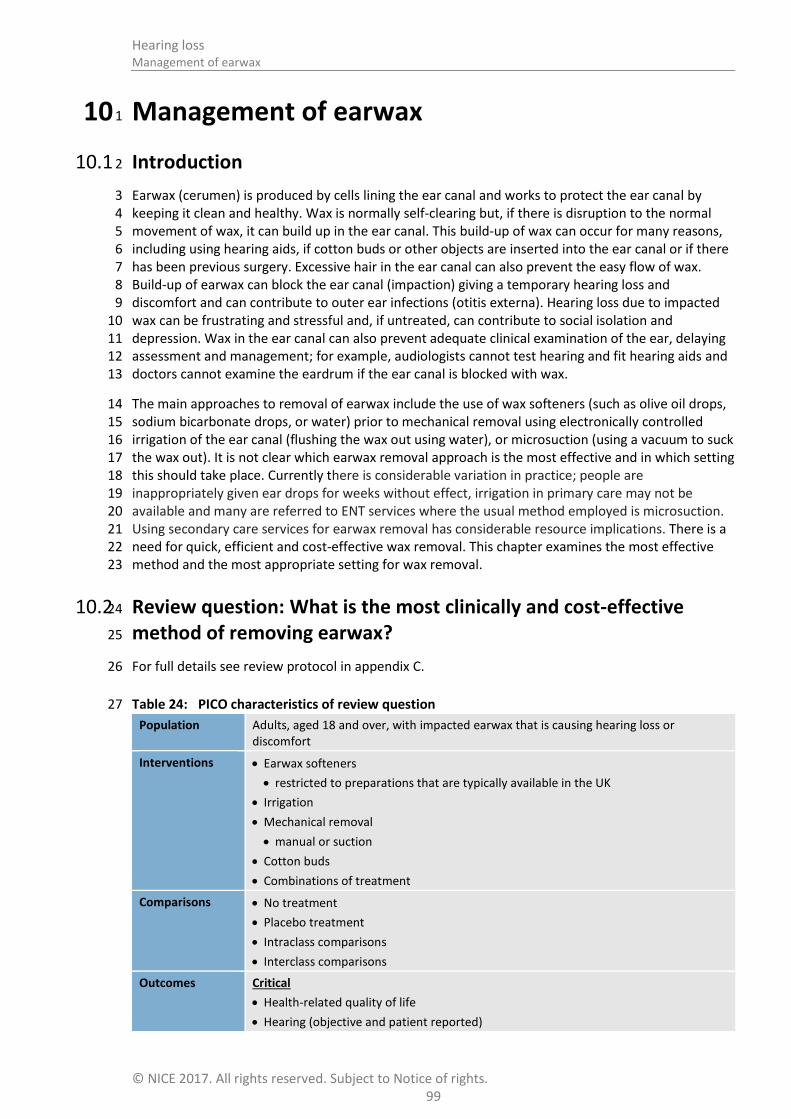
Hearing loss Management of earwax
© NICE 2017. All rights reserved. Subject to Notice of rights. 99
10 Management of earwax 1
Introduction 10.1 2
Earwax (cerumen) is produced by cells lining the ear canal and works to protect the ear canal by 3 keeping it clean and healthy. Wax is normally self-clearing but, if there is disruption to the normal 4 movement of wax, it can build up in the ear canal. This build-up of wax can occur for many reasons, 5 including using hearing aids, if cotton buds or other objects are inserted into the ear canal or if there 6 has been previous surgery. Excessive hair in the ear canal can also prevent the easy flow of wax. 7 Build-up of earwax can block the ear canal (impaction) giving a temporary hearing loss and 8 discomfort and can contribute to outer ear infections (otitis externa). Hearing loss due to impacted 9 wax can be frustrating and stressful and, if untreated, can contribute to social isolation and 10 depression. Wax in the ear canal can also prevent adequate clinical examination of the ear, delaying 11 assessment and management; for example, audiologists cannot test hearing and fit hearing aids and 12 doctors cannot examine the eardrum if the ear canal is blocked with wax. 13
The main approaches to removal of earwax include the use of wax softeners (such as olive oil drops, 14 sodium bicarbonate drops, or water) prior to mechanical removal using electronically controlled 15 irrigation of the ear canal (flushing the wax out using water), or microsuction (using a vacuum to suck 16 the wax out). It is not clear which earwax removal approach is the most effective and in which setting 17 this should take place. Currently there is considerable variation in practice; people are 18 inappropriately given ear drops for weeks without effect, irrigation in primary care may not be 19 available and many are referred to ENT services where the usual method employed is microsuction. 20 Using secondary care services for earwax removal has considerable resource implications. There is a 21 need for quick, efficient and cost-effective wax removal. This chapter examines the most effective 22 method and the most appropriate setting for wax removal. 23
Review question: What is the most clinically and cost-effective 10.224
method of removing earwax? 25
For full details see review protocol in appendix C. 26
Table 24: PICO characteristics of review question 27
Population Adults, aged 18 and over, with impacted earwax that is causing hearing loss or discomfort
Interventions Earwax softeners
restricted to preparations that are typically available in the UK
Irrigation
Mechanical removal
manual or suction
Cotton buds
Combinations of treatment
Comparisons No treatment
Placebo treatment
Intraclass comparisons
Interclass comparisons
Outcomes Critical
Health-related quality of life
Hearing (objective and patient reported)

Hearing loss Management of earwax
© NICE 2017. All rights reserved. Subject to Notice of rights. 100
Wax-related outcomes
- amount and occlusion
- ability / ease of removal
- global impression of treatment efficacy (patient or clinician)
Adverse effects: perforation, infection, vertigo, bleeding, discomfort
Time to recurrence of wax
Important:
Pure tone audiometry
Study design Randomised control trials (RCT)
Systematic reviews of RCTs
Where there is no evidence from RCTs, quasi-RCT designs will be considered
Crossover studies where data reported prior to crossover
10.2.1 Clinical evidence 1
One Cochrane systematic review was identified 14. References from this review, and other identified 2 systematic reviews and meta-analyses, were checked and studies included in these reviews were 3 only included if they matched our protocol. The systematic reviews and meta-analyses were not 4 included. 5
Eleven trials reported in 12 papers were included in the review; 15 ,20 ,21 ,32 ,38 ,48 ,53 ,69 ,81 ,82 ,88 ,105 these 6 are summarised in Table 25 below. Coppin 200820 reported short-term results and Coppin 201121 7 reported long-term results of the same trial. Seven studies compared earwax softeners alone, 11 8 compared earwax softeners followed by irrigation, and 2 primarily studied irrigation. No studies 9 explicitly looked at hearing aid users as a special group, and we were therefore unable to use 10 subgroup analysis. 11
The term ‘irrigation’ can be used to refer to irrigation of the external ear canal either using a syringe 12 or using an electronic irrigator. Both methods adopt the principle of using water to flush out earwax 13 and therefore, in this section on clinical evidence, the term ‘irrigation’ is used to refer to both or 14 either method of wax removal. Most of the papers referred to were written at a time when manual 15 syringing was the only method of irrigation available and the principles they outline, in discussion of 16 the attributes of cerumenolytics or wax-softening agents, are relevant to irrigation by both 17 techniques. 18
No studies on mechanical removal were identified. 19
Evidence from these studies is summarised in the clinical evidence summary below (Table 26). See 20 also the study selection flow chart in appendix E, forest plots in appendix K, study evidence tables in 21 appendix H, GRADE tables in appendix J and excluded studies list in appendix L. 22
Table 25: Summary of studies included in the review 23
Study Intervention and comparison Population Outcomes Comments
Caballero 2009
15
Chlorobutanol solution as wax softener applied 15 minutes prior to irrigation using a syringe (n=32)
Saline (sodium chloride) as wax
Adults who had been referred to ENT clinic due to symptoms of cerumen in whom the tympanic membrane could not be visualised in clinic due to
Wax-based: Complete visualisation of tympanic membrane after immediate irrigation
Adverse events:
A further potassium carbonate arm was not extracted as atypical for UK
Intervention administered by healthcare professional.
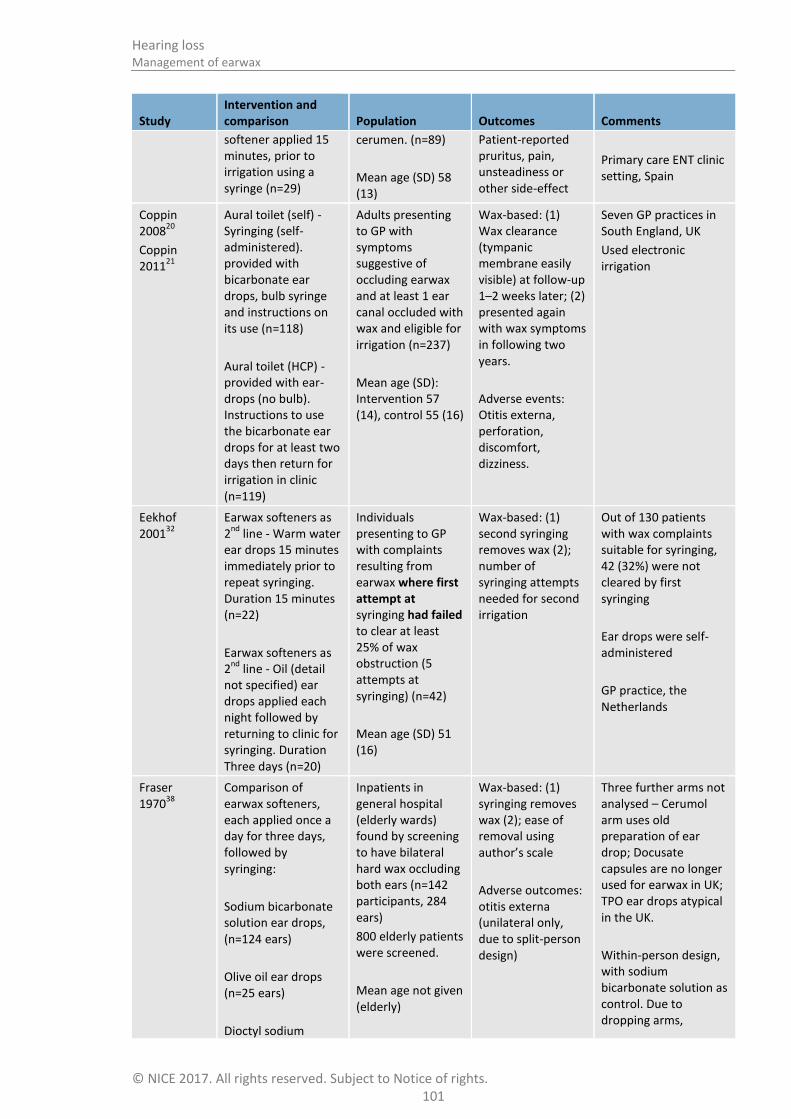
Hearing loss Management of earwax
© NICE 2017. All rights reserved. Subject to Notice of rights. 101
Study Intervention and comparison Population Outcomes Comments
softener applied 15 minutes, prior to irrigation using a syringe (n=29)
cerumen. (n=89)
Mean age (SD) 58 (13)
Patient-reported pruritus, pain, unsteadiness or other side-effect
Primary care ENT clinic setting, Spain
Coppin 2008
20
Coppin 2011
21
Aural toilet (self) - Syringing (self- administered). provided with bicarbonate ear drops, bulb syringe and instructions on its use (n=118)
Aural toilet (HCP) - provided with ear-drops (no bulb). Instructions to use the bicarbonate ear drops for at least two days then return for irrigation in clinic (n=119)
Adults presenting to GP with symptoms suggestive of occluding earwax and at least 1 ear canal occluded with wax and eligible for irrigation (n=237)
Mean age (SD): Intervention 57 (14), control 55 (16)
Wax-based: (1) Wax clearance (tympanic membrane easily visible) at follow-up 1–2 weeks later; (2) presented again with wax symptoms in following two years.
Adverse events: Otitis externa, perforation, discomfort, dizziness.
Seven GP practices in South England, UK
Used electronic irrigation
Eekhof 2001
32 Earwax softeners as 2
nd line - Warm water
ear drops 15 minutes immediately prior to repeat syringing. Duration 15 minutes (n=22)
Earwax softeners as 2
nd line - Oil (detail
not specified) ear drops applied each night followed by returning to clinic for syringing. Duration Three days (n=20)
Individuals presenting to GP with complaints resulting from earwax where first attempt at syringing had failed to clear at least 25% of wax obstruction (5 attempts at syringing) (n=42)
Mean age (SD) 51 (16)
Wax-based: (1) second syringing removes wax (2); number of syringing attempts needed for second irrigation
Out of 130 patients with wax complaints suitable for syringing, 42 (32%) were not cleared by first syringing
Ear drops were self-administered
GP practice, the Netherlands
Fraser 1970
38 Comparison of earwax softeners, each applied once a day for three days, followed by syringing:
Sodium bicarbonate solution ear drops, (n=124 ears)
Olive oil ear drops (n=25 ears)
Dioctyl sodium
Inpatients in general hospital (elderly wards) found by screening to have bilateral hard wax occluding both ears (n=142 participants, 284 ears)
800 elderly patients were screened.
Mean age not given (elderly)
Wax-based: (1) syringing removes wax (2); ease of removal using author’s scale
Adverse outcomes: otitis externa (unilateral only, due to split-person design)
Three further arms not analysed – Cerumol arm uses old preparation of ear drop; Docusate capsules are no longer used for earwax in UK; TPO ear drops atypical in the UK.
Within-person design, with sodium bicarbonate solution as control. Due to dropping arms,

Hearing loss Management of earwax
© NICE 2017. All rights reserved. Subject to Notice of rights. 102
Study Intervention and comparison Population Outcomes Comments
sulphosuccinate (Docusate) ear drops (brand: Waxsol) (n=26 ears)
analysed here as between-person design.
General hospital, UK
Ear drops administered by HCP
Hinchcliffe 1955
48 Comparison of earwax softeners, each applied into each ear 30 minutes prior to syringing
Sodium bicarbonate solution ear drops, five drops (n=37)
Hydrogen peroxide urea solution ear drops, five drops (n=37)
Olive oil ear drops, five drops (n=37)
No earwax softener. Syringing immediately (n=37)
Entrants to RAF training screened for wax occlusion
Mean age not given (adult)
Wax-based: wax cleared by up to five minutes of syringing
Adverse events: discomfort from ear drops (prior to syringing)
Further arms not analysed – Cerumol arm uses old preparation of ear drop no longer available
Armed forces medical clinic, UK
Keane 1995
53 Comparison of earwax softeners, each applied 4 drops twice daily for 5 day:
Sterile water (n=38)
Sodium bicarbonate solution ear drops (n=39)
Chlorobutanol solution ear drops (brand Cerumol)(n=40)
No earwax softener (n=38)
Impacted ears (n=97 people, 155 ears)
Age not specified
Wax-related: No longer impacted at five days.
Seriously indirect population, as no detail about age, therefore may include children.
Republic of Ireland, setting not given
Memel 2002
69 Syringing of ear according to practice guidelines, following 3 days of unspecified ‘oily’ ear drops
Patients referred to syringing clinic with ear drum completely obscured by wax
Hearing: PTA improved by at least 10 dB HL (PTA averaged over four frequencies – 0.5 kHz, 1 kHz,
Further outcomes, including subjective hearing, were measured before-and-after for all participants (not
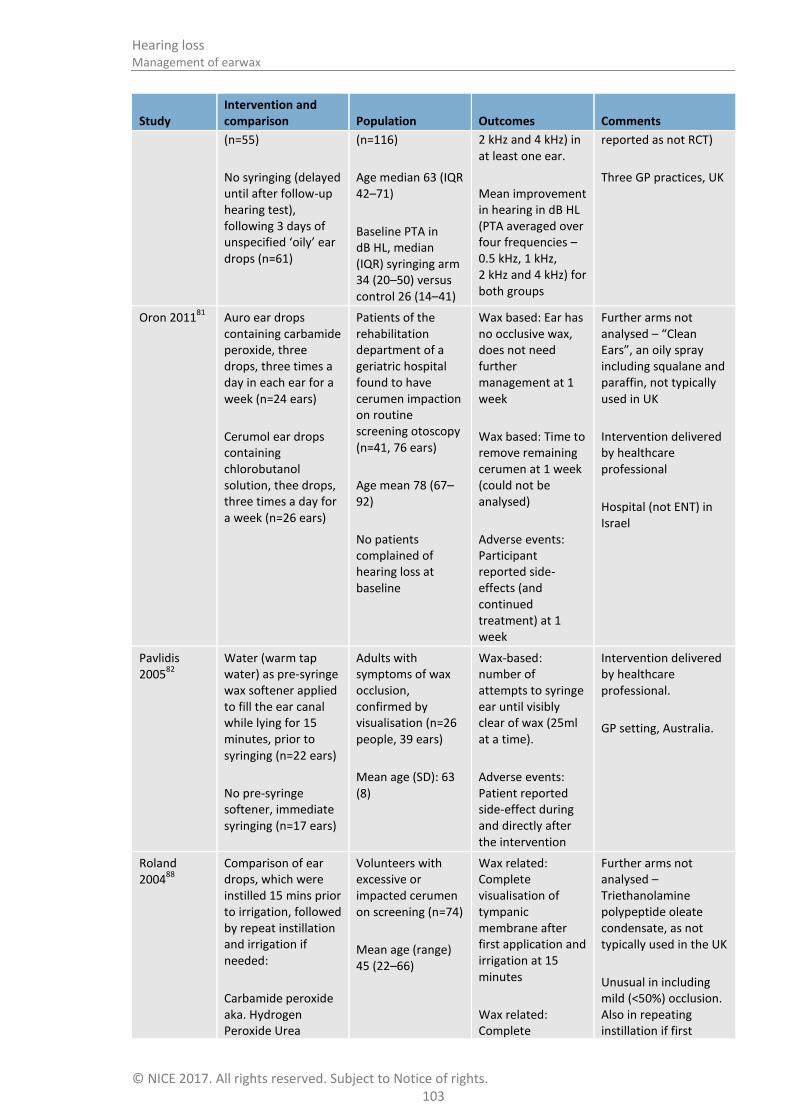
Hearing loss Management of earwax
© NICE 2017. All rights reserved. Subject to Notice of rights. 103
Study Intervention and comparison Population Outcomes Comments
(n=55)
No syringing (delayed until after follow-up hearing test), following 3 days of unspecified ‘oily’ ear drops (n=61)
(n=116)
Age median 63 (IQR 42–71)
Baseline PTA in dB HL, median (IQR) syringing arm 34 (20–50) versus control 26 (14–41)
2 kHz and 4 kHz) in at least one ear.
Mean improvement in hearing in dB HL (PTA averaged over four frequencies – 0.5 kHz, 1 kHz, 2 kHz and 4 kHz) for both groups
reported as not RCT)
Three GP practices, UK
Oron 201181
Auro ear drops containing carbamide peroxide, three drops, three times a day in each ear for a week (n=24 ears)
Cerumol ear drops containing chlorobutanol solution, thee drops, three times a day for a week (n=26 ears)
Patients of the rehabilitation department of a geriatric hospital found to have cerumen impaction on routine screening otoscopy (n=41, 76 ears)
Age mean 78 (67–92)
No patients complained of hearing loss at baseline
Wax based: Ear has no occlusive wax, does not need further management at 1 week
Wax based: Time to remove remaining cerumen at 1 week (could not be analysed)
Adverse events: Participant reported side-effects (and continued treatment) at 1 week
Further arms not analysed – “Clean Ears”, an oily spray including squalane and paraffin, not typically used in UK
Intervention delivered by healthcare professional
Hospital (not ENT) in Israel
Pavlidis 2005
82
Water (warm tap water) as pre-syringe wax softener applied to fill the ear canal while lying for 15 minutes, prior to syringing (n=22 ears)
No pre-syringe softener, immediate syringing (n=17 ears)
Adults with symptoms of wax occlusion, confirmed by visualisation (n=26 people, 39 ears)
Mean age (SD): 63 (8)
Wax-based: number of attempts to syringe ear until visibly clear of wax (25ml at a time).
Adverse events: Patient reported side-effect during and directly after the intervention
Intervention delivered by healthcare professional.
GP setting, Australia.
Roland 2004
88
Comparison of ear drops, which were instilled 15 mins prior to irrigation, followed by repeat instillation and irrigation if needed:
Carbamide peroxide aka. Hydrogen Peroxide Urea
Volunteers with excessive or impacted cerumen on screening (n=74)
Mean age (range) 45 (22–66)
Wax related: Complete visualisation of tympanic membrane after first application and irrigation at 15 minutes
Wax related: Complete
Further arms not analysed – Triethanolamine polypeptide oleate condensate, as not typically used in the UK
Unusual in including mild (<50%) occlusion. Also in repeating instillation if first

Hearing loss Management of earwax
© NICE 2017. All rights reserved. Subject to Notice of rights. 104
Study Intervention and comparison Population Outcomes Comments
solution (Brand: Murine ear drops 6.5%) (n=26 people)
Saline (sterile saline solution with sodium chloride 0.64% and physiologic concentrations of multiple electrolytes) (n=24)
visualisation of tympanic membrane after up to two applications and irrigation at 30 minutes
Adverse events: Subject reported adverse events
irrigation unsuccessful
Used electronic irrigation
Industry funded research clinic
Vanlierde 1991
105
Earwax softeners - Cerumol ear drops five drops twice a day for five days (n=35)
Earwax softeners - Almond oil (generic), five drops twice a day for five days (n=34)
Stable patients in elderly ward with wax graded as excessive or occluding (n=41)
132 inpatients were screened (31%).
Mean age not stated (elderly)
Wax significantly improved – no longer excessive or occlusive
Adverse events: discontinued due to adverse effects
General hospital, South Africa
Cerumol contains both chlorobutanol and arachis oil
1

Man
agemen
t of earw
ax
Hearin
g loss
© N
ICE 2
01
7. A
ll rights reserved
. Sub
ject to N
otice o
f rights.
10
5
10.2.1.1 Ear drops alone compared to no treatment 1
Table 26: Clinical evidence summary: water ear drops (repeated application) versus no treatment for earwax 2
Outcomes
No of Participants (studies) Follow-up
Quality of the evidence (GRADE)
Relative effect (95% CI)
Anticipated absolute effects
Risk with Control
Risk difference with Water ear drops (repeated application) versus no treatment (95% CI)
No longer impacted wax 76 (1 study) 5 days
VERY LOW a,b,c
due to risk of bias, indirectness, imprecision
RR 1.67 (0.96 to 2.91)
316 per 1000
212 more per 1000 (from 13 fewer to 604 more)
a Downgraded by 1 increment if the majority of the evidence was at high risk of bias, and downgraded by 2 increments if the majority of the evidence was at very high risk of bias b Downgraded by 1 or 2 increments because the majority of evidence was from an indirect population (age and other factors not defined, may include children) c Downgraded by 1 increment if the confidence interval crossed one MID or by 2 increments if the confidence interval crossed both MIDs
Table 27: Clinical evidence summary: sodium bicarbonate ear drops (repeated applications) versus no treatment for earwax 3
Outcomes
No of Participants (studies) Follow-up
Quality of the evidence (GRADE)
Relative effect (95% CI)
Anticipated absolute effects
Risk with Control
Risk difference with Sodium Bicarbonate ear drops (repeated applications) versus no treatment (95% CI)
No longer impacted wax
77 (1 study) 5 days
VERY LOW a,b,c
due to risk of bias, indirectness, imprecision
RR 1.46 (0.82 to 2.6)
316 per 1000
145 more per 1000 (from 57 fewer to 506 more)
a Downgraded by 1 increment if the majority of the evidence was at high risk of bias, and downgraded by 2 increments if the majority of the evidence was at very high risk of bias b Downgraded by 1 or 2 increments because the majority of evidence was from an indirect population (age and other factors not defined, may include children) c Downgraded by 1 increment if the confidence interval crossed one MID or by 2 increments if the confidence interval crossed both MIDs
Table 28: Clinical evidence summary: chlorobutanol ear drops (repeated applications) versus no treatment for earwax 4
Outcomes No of Quality of the evidence Relative Anticipated absolute effects
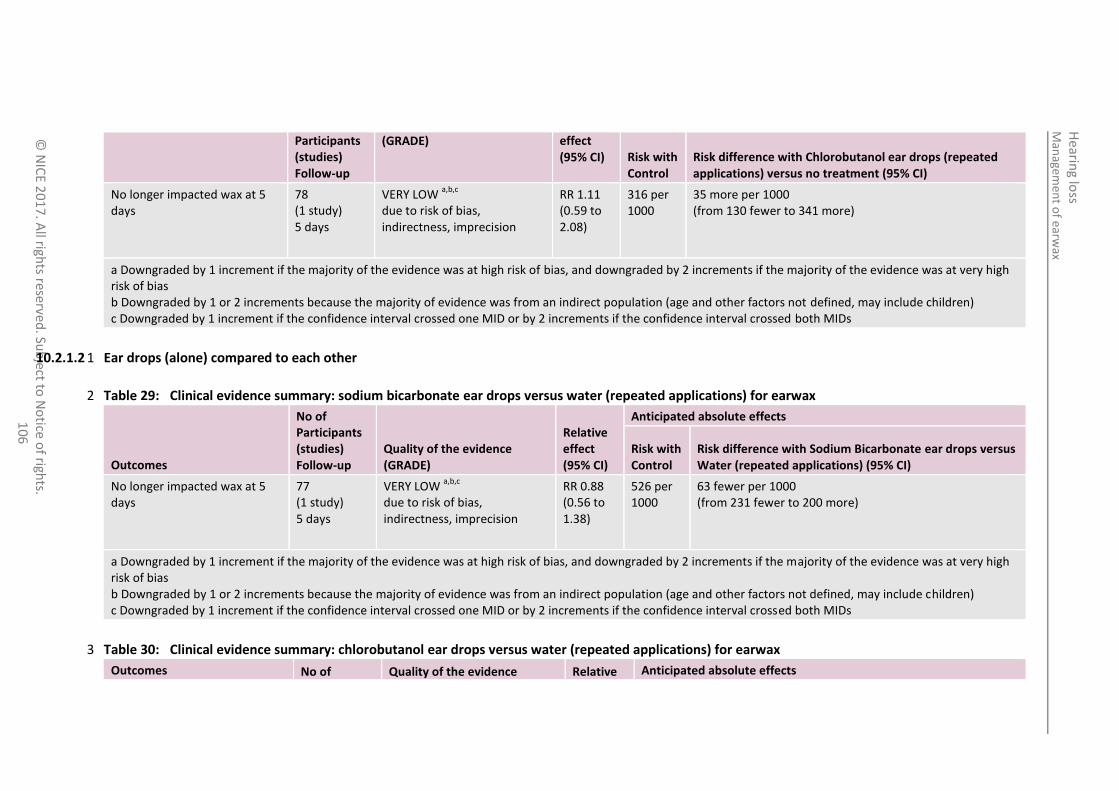
Man
agemen
t of earw
ax
Hearin
g loss
© N
ICE 2
01
7. A
ll rights reserved
. Sub
ject to N
otice o
f rights.
10
6
Participants (studies) Follow-up
(GRADE) effect (95% CI) Risk with
Control Risk difference with Chlorobutanol ear drops (repeated applications) versus no treatment (95% CI)
No longer impacted wax at 5 days
78 (1 study) 5 days
VERY LOW a,b,c
due to risk of bias, indirectness, imprecision
RR 1.11 (0.59 to 2.08)
316 per 1000
35 more per 1000 (from 130 fewer to 341 more)
a Downgraded by 1 increment if the majority of the evidence was at high risk of bias, and downgraded by 2 increments if the majority of the evidence was at very high risk of bias b Downgraded by 1 or 2 increments because the majority of evidence was from an indirect population (age and other factors not defined, may include children) c Downgraded by 1 increment if the confidence interval crossed one MID or by 2 increments if the confidence interval crossed both MIDs
10.2.1.2 Ear drops (alone) compared to each other 1
Table 29: Clinical evidence summary: sodium bicarbonate ear drops versus water (repeated applications) for earwax 2
Outcomes
No of Participants (studies) Follow-up
Quality of the evidence (GRADE)
Relative effect (95% CI)
Anticipated absolute effects
Risk with Control
Risk difference with Sodium Bicarbonate ear drops versus Water (repeated applications) (95% CI)
No longer impacted wax at 5 days
77 (1 study) 5 days
VERY LOW a,b,c
due to risk of bias, indirectness, imprecision
RR 0.88 (0.56 to 1.38)
526 per 1000
63 fewer per 1000 (from 231 fewer to 200 more)
a Downgraded by 1 increment if the majority of the evidence was at high risk of bias, and downgraded by 2 increments if the majority of the evidence was at very high risk of bias b Downgraded by 1 or 2 increments because the majority of evidence was from an indirect population (age and other factors not defined, may include children) c Downgraded by 1 increment if the confidence interval crossed one MID or by 2 increments if the confidence interval crossed both MIDs
Table 30: Clinical evidence summary: chlorobutanol ear drops versus water (repeated applications) for earwax 3
Outcomes No of Quality of the evidence Relative Anticipated absolute effects

Man
agemen
t of earw
ax
Hearin
g loss
© N
ICE 2
01
7. A
ll rights reserved
. Sub
ject to N
otice o
f rights.
10
7
Participants (studies) Follow-up
(GRADE) effect (95% CI) Risk with
Control Risk difference with Chlorobutanol ear drops versus Water (repeated applications) (95% CI)
No longer impacted wax at 5 days
78 (1 study) 5 days
VERY LOW a,b,c
due to risk of bias, indirectness, imprecision
RR 1.14 (0.77 to 1.69)
526 per 1000
74 more per 1000 (from 121 fewer to 363 more)
a Downgraded by 1 increment if the majority of the evidence was at high risk of bias, and downgraded by 2 increments if the majority of the evidence was at very high risk of bias b Downgraded by 1 or 2 increments because the majority of evidence was from an indirect population (age and other factors not defined, may include children) c Downgraded by 1 increment if the confidence interval crossed one MID or by 2 increments if the confidence interval crossed both MIDs
Table 31: Clinical evidence summary: chlorobutanol ear drops versus sodium bicarbonate ear drops (repeated applications) for earwax 1
Outcomes
No of Participants (studies) Follow-up
Quality of the evidence (GRADE)
Relative effect (95% CI)
Anticipated absolute effects
Risk with Control
Risk difference with Chlorobutanol ear drops versus Sodium Bicarbonate ear drops (repeated applications) (95% CI)
No longer impacted wax at 5 days
79 (1 study) 5 days
VERY LOW a,b,c
due to risk of bias, indirectness, imprecision
RR 1.3 (0.85 to 1.98)
462 per 1000
139 more per 1000 (from 69 fewer to 453 more)
a Downgraded by 1 increment if the majority of the evidence was at high risk of bias, and downgraded by 2 increments if the majority of the evidence was at very high risk of bias b Downgraded by 1 or 2 increments because the majority of evidence was from an indirect population (age and other factors not defined, may include children) c Downgraded by 1 increment if the confidence interval crossed one MID or by 2 increments if the confidence interval crossed both MIDs
Table 32: Clinical evidence summary: chlorobutanol (Cerumol) ear drops versus almond oil (repeated applications) for earwax 2
Outcomes
No of Participants (studies) Follow-up
Quality of the evidence (GRADE)
Relative effect (95% CI)
Anticipated absolute effects
Risk with Control
Risk difference with Chlorobutanol (Cerumol) ear drops versus almond Oil (repeated applications) (95% CI)
No longer impacted wax at 5 days 69 VERY LOW a,b,c
RR 1.8 206 per 165 more per 1000

Man
agemen
t of earw
ax
Hearin
g loss
© N
ICE 2
01
7. A
ll rights reserved
. Sub
ject to N
otice o
f rights.
10
8
Outcomes
No of Participants (studies) Follow-up
Quality of the evidence (GRADE)
Relative effect (95% CI)
Anticipated absolute effects
Risk with Control
Risk difference with Chlorobutanol (Cerumol) ear drops versus almond Oil (repeated applications) (95% CI)
(1 study) 5 days
due to risk of bias, indirectness, imprecision
(0.82 to 3.97)
1000 (from 37 fewer to 612 more)
Adverse event: discontinued due to adverse effects
69 (1 study) 5 days
VERY LOW a,b,c
due to risk of bias, indirectness, imprecision
Peto OR 7.18 (0.14 to 362.04)
0 per 1000
29 more per 1000 (from 48 fewer to 105 more)
d
a Downgraded by 1 increment if the majority of the evidence was at high risk of bias, and downgraded by 2 increments if the majority of the evidence was at very high risk of bias b Downgraded by 1 or 2 increments because the majority of evidence used intervention (Cerumol ear drops) that wasn't defined in terms of active ingredients c Downgraded by 1 increment if the confidence interval crossed one MID or by 2 increments if the confidence interval crossed both MIDs d Approximation taken from Cochrane RevMan calculator
Table 33: Hydrogen Peroxide Urea solution ear drops compared to Chlorobutanol ear drops (repeated applications) for earwax 1
Outcomes
No of Participants (studies) Follow-up
Quality of the evidence (GRADE)
Relative effect (95% CI)
Anticipated absolute effects
Risk with Chlorobutanol ear drops used repeatedly
Risk difference with Hydrogen Peroxide Urea solution ear drops used repeatedly (95% CI)
No further management of wax needed
50 (1 study) 1 weeks
VERY LOWa,b
due to risk of bias, imprecision
RR 1.08 (0.55 to 2.14)
385 per 1000 31 more per 1000 (from 173 fewer to 438 more)
Adverse event: report side-effect 50 (1 study) 1 weeks
VERY LOWa,b,d
due to risk of bias, imprecision
OR 0.14 (0.01 to 2.32)
c
77 per 1000 65 fewer per 1000 (from 76 fewer to 85 more)
a Downgraded by 1 increment if the majority of the evidence was at high risk of bias, and downgraded by 2 increments if the majority of the evidence was at very high risk of bias
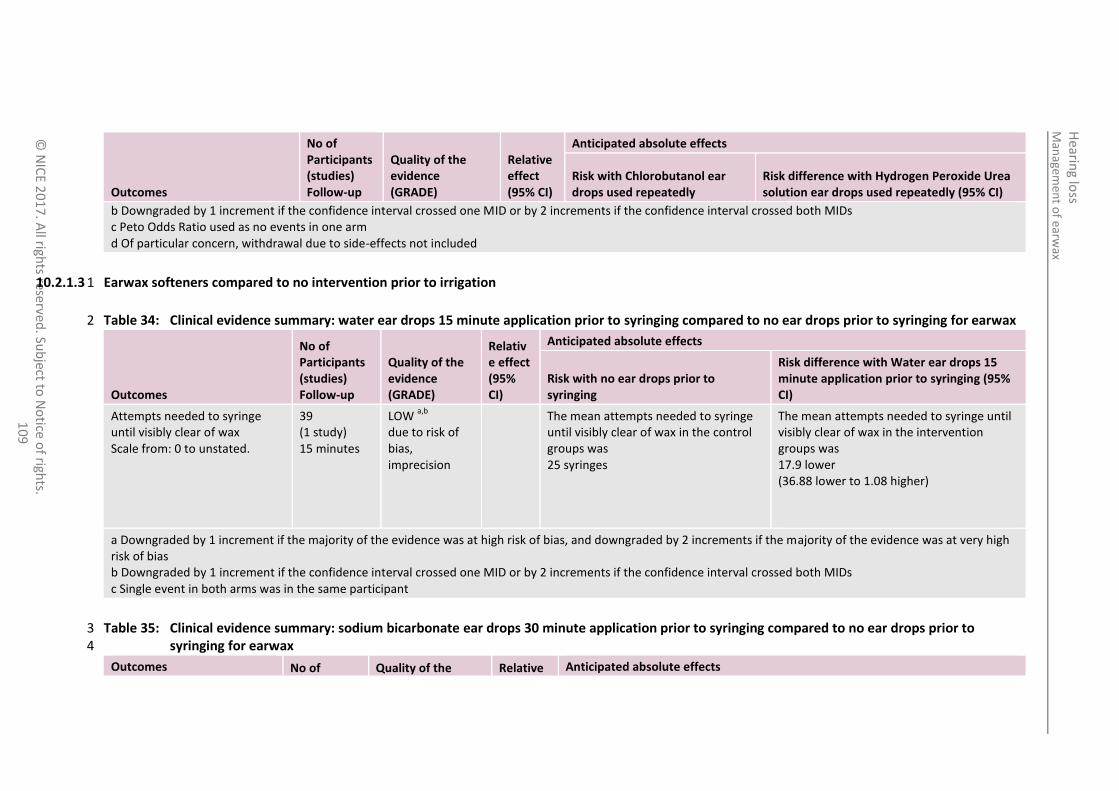
Man
agemen
t of earw
ax
Hearin
g loss
© N
ICE 2
01
7. A
ll rights reserved
. Sub
ject to N
otice o
f rights.
10
9
Outcomes
No of Participants (studies) Follow-up
Quality of the evidence (GRADE)
Relative effect (95% CI)
Anticipated absolute effects
Risk with Chlorobutanol ear drops used repeatedly
Risk difference with Hydrogen Peroxide Urea solution ear drops used repeatedly (95% CI)
b Downgraded by 1 increment if the confidence interval crossed one MID or by 2 increments if the confidence interval crossed both MIDs c Peto Odds Ratio used as no events in one arm d Of particular concern, withdrawal due to side-effects not included
10.2.1.3 Earwax softeners compared to no intervention prior to irrigation 1
Table 34: Clinical evidence summary: water ear drops 15 minute application prior to syringing compared to no ear drops prior to syringing for earwax 2
Outcomes
No of Participants (studies) Follow-up
Quality of the evidence (GRADE)
Relative effect (95% CI)
Anticipated absolute effects
Risk with no ear drops prior to syringing
Risk difference with Water ear drops 15 minute application prior to syringing (95% CI)
Attempts needed to syringe until visibly clear of wax Scale from: 0 to unstated.
39 (1 study) 15 minutes
LOW a,b
due to risk of bias, imprecision
The mean attempts needed to syringe until visibly clear of wax in the control groups was 25 syringes
The mean attempts needed to syringe until visibly clear of wax in the intervention groups was 17.9 lower (36.88 lower to 1.08 higher)
a Downgraded by 1 increment if the majority of the evidence was at high risk of bias, and downgraded by 2 increments if the majority of the evidence was at very high risk of bias b Downgraded by 1 increment if the confidence interval crossed one MID or by 2 increments if the confidence interval crossed both MIDs c Single event in both arms was in the same participant
Table 35: Clinical evidence summary: sodium bicarbonate ear drops 30 minute application prior to syringing compared to no ear drops prior to 3 syringing for earwax 4
Outcomes No of Quality of the Relative Anticipated absolute effects
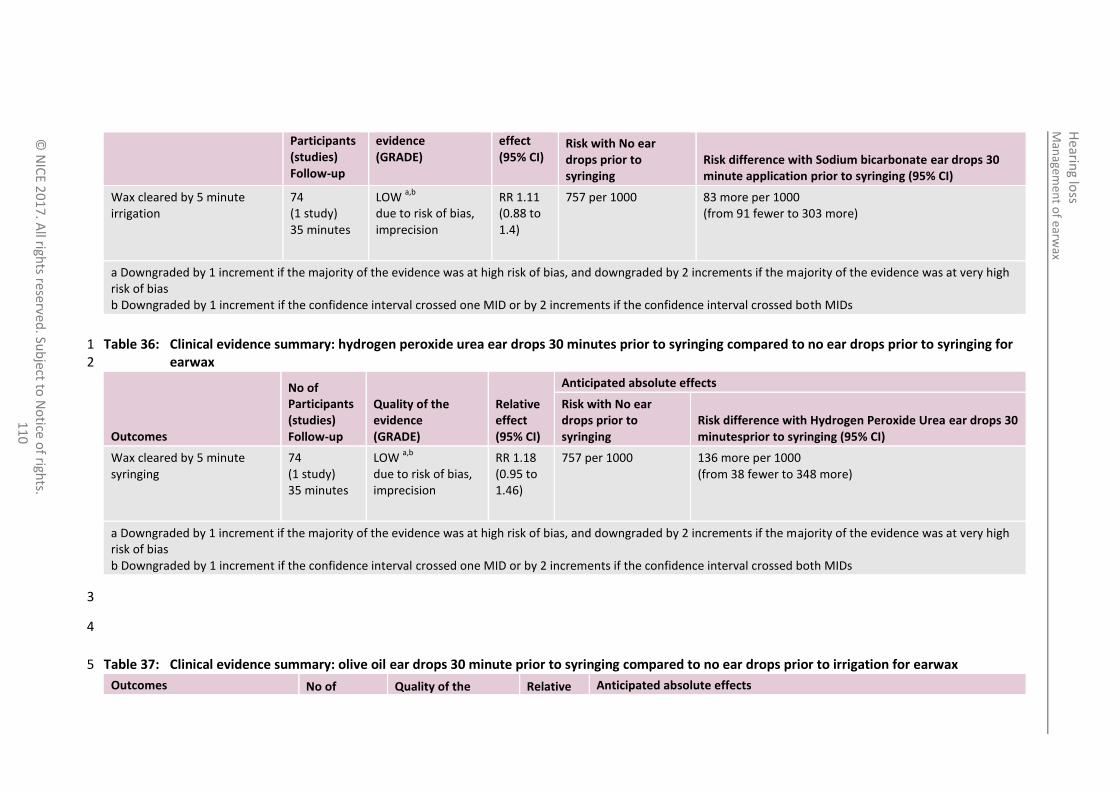
Man
agemen
t of earw
ax
Hearin
g loss
© N
ICE 2
01
7. A
ll rights reserved
. Sub
ject to N
otice o
f rights.
11
0
Participants (studies) Follow-up
evidence (GRADE)
effect (95% CI)
Risk with No ear drops prior to syringing
Risk difference with Sodium bicarbonate ear drops 30 minute application prior to syringing (95% CI)
Wax cleared by 5 minute irrigation
74 (1 study) 35 minutes
LOW a,b
due to risk of bias, imprecision
RR 1.11 (0.88 to 1.4)
757 per 1000 83 more per 1000 (from 91 fewer to 303 more)
a Downgraded by 1 increment if the majority of the evidence was at high risk of bias, and downgraded by 2 increments if the majority of the evidence was at very high risk of bias b Downgraded by 1 increment if the confidence interval crossed one MID or by 2 increments if the confidence interval crossed both MIDs
Table 36: Clinical evidence summary: hydrogen peroxide urea ear drops 30 minutes prior to syringing compared to no ear drops prior to syringing for 1 earwax 2
Outcomes
No of Participants (studies) Follow-up
Quality of the evidence (GRADE)
Relative effect (95% CI)
Anticipated absolute effects
Risk with No ear drops prior to syringing
Risk difference with Hydrogen Peroxide Urea ear drops 30 minutesprior to syringing (95% CI)
Wax cleared by 5 minute syringing
74 (1 study) 35 minutes
LOW a,b
due to risk of bias, imprecision
RR 1.18 (0.95 to 1.46)
757 per 1000 136 more per 1000 (from 38 fewer to 348 more)
a Downgraded by 1 increment if the majority of the evidence was at high risk of bias, and downgraded by 2 increments if the majority of the evidence was at very high risk of bias b Downgraded by 1 increment if the confidence interval crossed one MID or by 2 increments if the confidence interval crossed both MIDs
3
4
Table 37: Clinical evidence summary: olive oil ear drops 30 minute prior to syringing compared to no ear drops prior to irrigation for earwax 5
Outcomes No of Quality of the Relative Anticipated absolute effects

Man
agemen
t of earw
ax
Hearin
g loss
© N
ICE 2
01
7. A
ll rights reserved
. Sub
ject to N
otice o
f rights.
11
1
Participants (studies) Follow-up
evidence (GRADE)
effect (95% CI) Risk with No ear drops
prior to syringing Risk difference with Olive oil ear drops 30 minutes prior to syringing (95% CI)
Wax cleared by 5 minute syringing
74 (1 study) 35 minutes
LOW a,b
due to risk of bias, imprecision
RR 1.25 (1.03 to 1.52)
757 per 1000 189 more per 1000 (from 23 more to 394 more)
a Downgraded by 1 increment if the majority of the evidence was at high risk of bias, and downgraded by 2 increments if the majority of the evidence was at very high risk of bias b Downgraded by 1 increment if the confidence interval crossed one MID or by 2 increments if the confidence interval crossed both MIDs
10.2.1.4 Earwax softeners to facilitate immediate irrigation: comparing ear drops against each other 1
Table 38: Clinical evidence summary: chlorobutanol solution ear drops 15 minutes prior to syringing compared to saline ear drops (30 minute 2 application) prior to syringing for earwax 3
Outcomes
No of Participants (studies) Follow-up
Quality of the evidence (GRADE)
Relative effect (95% CI)
Anticipated absolute effects
Risk with Saline ear drops 15 minute prior to syringing
Risk difference with Chlorobutanol solution ear drops 15 minutes prior to syringing (95% CI)
Complete visualisation of TM after syringing
60 (1 study) 15 minutes
LOW a,b
due to risk of bias, imprecision
RR 1.53 (0.93 to 2.51)
429 per 1000 227 more per 1000 (from 30 fewer to 648 more)
Adverse events prior to syringing
64 (1 study) 15 minutes
VERY LOW a,c
due to risk of bias, imprecision
Not estimable 0 per 1000 0 fewer per 1000 (from 59 fewer to 59 more)
d
a Downgraded by 1 increment if the majority of the evidence was at high risk of bias, and downgraded by 2 increments if the majority of the evidence was at very high risk of bias b Downgraded by 1 increment if the confidence interval crossed one MID or by 2 increments if the confidence interval crossed both MIDs c No events in either arms, therefore assumed to cross both MIDs d Estimated using Cochrane RevMan calculator

Man
agemen
t of earw
ax
Hearin
g loss
© N
ICE 2
01
7. A
ll rights reserved
. Sub
ject to N
otice o
f rights.
11
2
Table 39: Clinical evidence summary: hydrogen peroxide urea solution ear drops 30 minutes prior to syringing compared to sodium bicarbonate 30 1 minutes prior to syringing for earwax 2
Outcomes
No of Participants (studies) Follow-up
Quality of the evidence (GRADE)
Relative effect (95% CI)
Anticipated absolute effects
Risk with Sodium Bicarbonate 30 minutes prior to syringing
Risk difference with Hydrogen Peroxide Urea solution ear drops 30 minutes prior to syringing (95% CI)
Wax cleared by 5 minute syringing
74 (1 study) 35 minutes
LOW a,b
due to risk of bias, imprecision
RR 1.06 (0.89 to 1.28)
838 per 1000 50 more per 1000 (from 92 fewer to 235 more)
Adverse events prior to syringing: discomfort
74 (1 study) 30 minutes
VERY LOW a,b
due to risk of bias, imprecision
RR 1.5 (0.46 to 4.88)
108 per 1000 54 more per 1000 (from 58 fewer to 419 more)
a Downgraded by 1 increment if the majority of the evidence was at high risk of bias, and downgraded by 2 increments if the majority of the evidence was at very high risk of bias b Downgraded by 1 increment if the confidence interval crossed one MID or by 2 increments if the confidence interval crossed both MIDs
Table 40: Clinical evidence summary: hydrogen peroxide urea eardrops 30 minutes prior to syringing compared to olive oil (ear drops 30 minutes prior 3 to syringing for earwax 4
Outcomes
No of Participants (studies) Follow-up
Quality of the evidence (GRADE)
Relative effect (95% CI)
Anticipated absolute effects
Risk with Olive Oil ear drops 30 minutes prior to syringing
Risk difference with Hydrogen Peroxide Urea solution ear drops 30 minutes prior to syringing (95% CI)
Wax cleared by 5 minute syringing
74 (1 study) 35 minutes
MODERATEa
due to risk of bias RR 0.94 (0.82 to 1.08)
946 per 1000 57 fewer per 1000 (from 170 fewer to 76 more)
Adverse events prior to syringing: discomfort
74 (1 study) 30 minutes
VERY LOW a,b
due to risk of bias, imprecision
RR 1.5 (0.46 to 4.88)
108 per 1000 54 more per 1000 (from 58 fewer to 419 more)

Man
agemen
t of earw
ax
Hearin
g loss
© N
ICE 2
01
7. A
ll rights reserved
. Sub
ject to N
otice o
f rights.
11
3
Outcomes
No of Participants (studies) Follow-up
Quality of the evidence (GRADE)
Relative effect (95% CI)
Anticipated absolute effects
Risk with Olive Oil ear drops 30 minutes prior to syringing
Risk difference with Hydrogen Peroxide Urea solution ear drops 30 minutes prior to syringing (95% CI)
a Downgraded by 1 increment if the majority of the evidence was at high risk of bias, and downgraded by 2 increments if the majority of the evidence was at very high risk of bias b Downgraded by 1 increment if the confidence interval crossed one MID or by 2 increments if the confidence interval crossed both MIDs
Table 41: Clinical evidence summary: Hydrogen Peroxide Urea solution ear drops up to 2 applications with 15 minutes waits compared to Sodium 1 Chloride (Saline) ear drops up to 2 applications with 15 minute waits for earwax immediately prior to irrigation 2
Outcomes
No of Participants (studies) Follow-up
Quality of the evidence (GRADE)
Relative effect (95% CI)
Anticipated absolute effects
Risk with Sodium Chloride (Saline) ear drops up to 2x15 minute applications
Risk difference with Hydrogen Peroxide Urea solution ear drops up to 2x15 minute applications (95% CI)
Complete visualisation of TM after irrigation (1st attempt)
50 (1 study) 30 minutes
LOWa
due to imprecision
RR 1.38 (0.25 to 7.59)
83 per 1000 32 more per 1000 (from 62 fewer to 549 more)
Complete visualisation of TM after irrigation (2nd attempt)
50 (1 study) 30 minutes
LOWa,b
due to risk of bias, imprecision
RR 0.37 (0.13 to 1.02)
417 per 1000 263 fewer per 1000 (from 363 fewer to 8 more)
Adverse events: reported side-effects from ear drops
50 (1 study) 30 minutes
VERY LOWa,b
due to risk of bias, imprecision
RR 1.85 (0.18 to 19.08)
42 per 1000 35 more per 1000 (from 34 fewer to 753 more)
a Downgraded by 1 increment if the confidence interval crossed one MID or by 2 increments if the confidence interval crossed both MIDs b Downgraded by 1 increment if the majority of the evidence was at high risk of bias, and downgraded by 2 increments if the majority of the evidence was at very high risk of bias

Man
agemen
t of earw
ax
Hearin
g loss
© N
ICE 2
01
7. A
ll rights reserved
. Sub
ject to N
otice o
f rights.
11
4
10.2.1.5 Earwax softeners to facilitate delayed irrigation: comparing ear drops against each other 1
Table 42: Clinical evidence summary: docusate solution ear drops (repeated applications) prior to delayed syringing compared to sodium bicarbonate 2 solution ear drops (repeated applications) prior to delayed syringing for earwax 3
Outcomes
No of Participants (studies) Follow-up
Quality of the evidence (GRADE)
Relative effect (95% CI)
Anticipated absolute effects
Risk with Sodium Bicarbonate solution ear drops (repeated applications) prior to delayed syringing
Risk difference with Docusate solution ear drops (repeated applications) prior to delayed syringing (95% CI)
Successful syringing at 3 days
149 (1 study) 3 days
HIGH RR 0.99 (0.82 to 1.2)
847 per 1000 8 fewer per 1000 (from 152 fewer to 169 more)
Adverse event: otitis externa
150 (1 study) 3 days
LOW a,b
due to risk of bias, imprecision
RR 3.18 (0.56 to 18.09)
24 per 1000 52 more per 1000 (from 11 fewer to 410 more)
a Downgraded by 1 increment if the majority of the evidence was at high risk of bias, and downgraded by 2 increments if the majority of the evidence was at very high risk of bias b Downgraded by 1 increment if the confidence interval crossed one MID or by 2 increments if the confidence interval crossed both MIDs
Table 43: Clinical evidence summary: olive oil ear drops (repeated applications) prior to delayed syringing compared to sodium bicarbonate solution 4 ear drops (repeated applications) prior to delayed syringing for earwax 5
Outcomes
No of Participants (studies) Follow-up
Quality of the evidence (GRADE)
Relative effect (95% CI)
Anticipated absolute effects
Risk with Sodium Bicarbonate solution ear drops (repeated applications) prior to delayed syringing
Risk difference with Olive oil ear drops (repeated applications) prior to delayed syringing (95% CI)
Successful syringing at 3 days
149 (1 study) 3 days
MODERATE a
due to imprecision
RR 1.09 (0.95 to 1.25)
847 per 1000 76 more per 1000 (from 42 fewer to 212 more)
Adverse event: otitis 149 VERY LOW a,b
Peto OR 24 per 1000 17 fewer per 1000

Man
agemen
t of earw
ax
Hearin
g loss
© N
ICE 2
01
7. A
ll rights reserved
. Sub
ject to N
otice o
f rights.
11
5
Outcomes
No of Participants (studies) Follow-up
Quality of the evidence (GRADE)
Relative effect (95% CI)
Anticipated absolute effects
Risk with Sodium Bicarbonate solution ear drops (repeated applications) prior to delayed syringing
Risk difference with Olive oil ear drops (repeated applications) prior to delayed syringing (95% CI)
externa (1 study) 3 days
due to risk of bias, imprecision
0.3 (0.01 to 6.24)
(from 24 fewer to 109 more)
a Downgraded by 1 increment if the confidence interval crossed one MID or by 2 increments if the confidence interval crossed both MIDs b Downgraded by 1 increment if the majority of the evidence was at high risk of bias, and downgraded by 2 increments if the majority of the evidence was at very high risk of bias
Table 44: Clinical evidence summary: docusate solution ear drops (repeated application) prior to delayed syringing versus oil ear drops (repeated 1 applications) prior to delayed syringing for earwax 2
Outcomes
No of Participants (studies) Follow-up
Quality of the evidence (GRADE)
Relative effect (95% CI)
Anticipated absolute effects
Risk with Control
Risk difference with Docusate solution ear drops (repeated application) prior to delayed syringing versus Oil ear drops (repeated applications) prior to delayed irrigation (95% CI)
Successful syringing at 3 days
50 (1 study) 3 days
MODERATE a
due to risk of bias
RR 1 (0.85 to 1.18)
920 per 1000
0 fewer per 1000 (from 138 fewer to 166 more)
Adverse event: otitis externa
50 (1 study) 3 days
VERY LOW a,c
due to risk of bias
No events in either arm
0 per 1000
0 fewer per 1000 (from 75 fewer to 75 more)
b
a Downgraded by 1 increment if the majority of the evidence was at high risk of bias, and downgraded by 2 increments if the majority of the evidence was at very high risk of bias b Estimated using Cochrane RevMan calculator
c No events in either arm, therefore confidence interval assumed to cross both MIDs, Downgraded by 2 increments as the confidence interval crossed both MIDs

Man
agemen
t of earw
ax
Hearin
g loss
© N
ICE 2
01
7. A
ll rights reserved
. Sub
ject to N
otice o
f rights.
11
6
Table 45: Clinical evidence summary: water 15 minutes prior to syringing compared to oil ear drops (repeated applications for 3 days) prior to delayed 1 syringing for earwax 2
Outcomes
No of Participants (studies) Follow-up
Quality of the evidence (GRADE)
Relative effect (95% CI)
Anticipated absolute effects
Risk with Oil ear drops (repeated applications) prior to delayed syringing
Risk difference with Water (single application) 15 minutes prior to syringing (95% CI)
Wax cleared at up to five syringes 42 (1 study) 0-3 days
a
LOW b
due to risk of bias
RR 1.04 (0.92 to 1.19)
955 per 1000 38 more per 1000 (from 76 fewer to 181 more)
Ease of syringing - number of syringes needed to clear Scale from: 1 to 6.
42 (1 study) 0-3 days
a
VERY LOW b,c
due to risk of bias, imprecision
The mean ease of syringing - number of syringes needed to clear in the control groups was 2.4 syringes
The mean ease of syringing - number of syringes needed to clear in the intervention groups was 0.6 higher (0.32 lower to 1.52 higher)
a One arm had immediate irrigation, the other had after three days b Downgraded by 1 increment if the majority of the evidence was at high risk of bias, and downgraded by 2 increments if the majority of the evidence was at very high risk of bias c Downgraded by 1 increment if the confidence interval crossed one MID or by 2 increments if the confidence interval crossed both MIDs
10.2.1.6 Clinic irrigation versus other strategies 3
Table 46: Clinical evidence summary: ear drops plus home syringing kit versus ear drops plus irrigation in GP clinic for earwax 4
Outcomes
No of Participants (studies) Follow-up
Quality of the evidence (GRADE)
Relative effect (95% CI)
Anticipated absolute effects
Risk with Control
Risk difference with ear drops plus Home syringing kit versus ear drops plus electronic irrigation in GP clinic (95% CI)
No impacted wax at follow-up (one to two weeks)
206 (1 study)
LOW a,b
due to risk of bias,
RR 0.77 (0.6 to
628 per 1000 144 fewer per 1000 (from 13 fewer to 251 fewer)

Man
agemen
t of earw
ax
Hearin
g loss
© N
ICE 2
01
7. A
ll rights reserved
. Sub
ject to N
otice o
f rights.
11
7
Outcomes
No of Participants (studies) Follow-up
Quality of the evidence (GRADE)
Relative effect (95% CI)
Anticipated absolute effects
Risk with Control
Risk difference with ear drops plus Home syringing kit versus ear drops plus electronic irrigation in GP clinic (95% CI)
1-2 weeks imprecision 0.98)
Change in symptom score (scale 0-6, 6 worst)
218 (1 study) 1-2 weeks
VERY LOW a,b,c
due to risk of bias, indirectness, imprecision
The mean change in symptom score (scale 0-6, 6 high) in the control groups was 1.26 points
The mean change in symptom score (scale 0-6, 6 high) in the intervention groups was 0.45 lower (0.8 to 0.1 lower)
Consulted again with wax-related symptoms in next two years
234 (1 study) 2 years
VERY LOW a,b
due to risk of bias, imprecision
RR 0.82 (0.68 to 0.99)
727 per 1000 131 fewer per 1000 (from 7 fewer to 233 fewer)
Adverse event: otitis externa at follow-up
191 (1 study) 1-2 weeks
VERY LOW a,b
due to risk of bias, imprecision
RR 0.97 (0.06 to 15.27)
11 per 1000 0 fewer per 1000 (from 10 fewer to 157 more)
Adverse event: perforation at follow-up
191 (1 study) 1-2 weeks
VERY LOW a,b,d
due to risk of bias, indirectness, imprecision
RR 0.97 (0.06 to 15.27)
11 per 1000 0 fewer per 1000 (from 10 fewer to 157 more)
Adverse event: discomfort during treatment
218 (1 study) 1-2 weeks
LOW a,b
due to risk of bias, imprecision
RR 1.21 (0.84 to 1.73)
324 per 1000 68 more per 1000 (from 52 fewer to 237 more)
Adverse event: dizziness during treatment
218 (1 study)
VERY LOW a,b
due to risk of bias,
RR 0.98 (0.49 to
130 per 1000 3 fewer per 1000 (from 66 fewer to 125 more)

Man
agemen
t of earw
ax
Hearin
g loss
© N
ICE 2
01
7. A
ll rights reserved
. Sub
ject to N
otice o
f rights.
11
8
Outcomes
No of Participants (studies) Follow-up
Quality of the evidence (GRADE)
Relative effect (95% CI)
Anticipated absolute effects
Risk with Control
Risk difference with ear drops plus Home syringing kit versus ear drops plus electronic irrigation in GP clinic (95% CI)
1-2 weeks imprecision 1.96)
a Downgraded by 1 increment if the majority of the evidence was at high risk of bias, and downgraded by 2 increments if the majority of the evidence was at very high risk of bias b Downgraded by 1 increment if the confidence interval crossed one MID or by 2 increments if the confidence interval crossed both MIDs c Downgraded by 1 or 2 increments because the majority of evidence was based on a scale that had not been externally validated d Downgraded by 1 or 2 increments because the outcome was shown to be unreliable (inability to ascertain lack of ear drum perforation prior to intervention)
Table 47: Clinical evidence summary: clinic irrigation following oily ear drops compared to oily ear drops alone for earwax 1
Outcomes
No of Participants (studies) Follow-up
Quality of the evidence (GRADE)
Relative effect (95% CI)
Anticipated absolute effects
Risk with Ear drops alone
Risk difference with Clinic irrigation following ear drops (95% CI)
Hearing improved by at least 10 dB HL PTA (0.5, 1, 2 and 4 kHz)
114 (1 study)
MODERATE a
due to risk of bias RR 20.72 (2.86 to 150.01)
16 per 1000 316 more per 1000 (from 30 more to 1000 more)
Improvement in hearing 114 (1 study)
LOW a
due to risk of bias Not given The mean improvement in hearing in the
intervention groups was 6.9 higher (3.8 to 10 higher)
a Downgraded by 1 increment if the majority of the evidence was at high risk of bias, and downgraded by 2 increments if the majority of the evidence was at very high risk of bias
2

Man
agemen
t of earw
ax
Hearin
g loss
© N
ICE 2
01
7. A
ll rights reserved
. Sub
ject to N
otice o
f rights.
11
9
10.2.1.7 Summary of the clinical evidence: 1
Table 48: Summary of evidence for ear drops for treating earwax (i) alone 2
Superior to (benefit ≥100 per 1,000): No difference against (benefit between −100 and 100):
Water No treatment (Very Low quality evidence) Sodium bicarbonate (Very Low quality evidence)
Chlorobutanol (Very Low quality evidence)
Sodium bicarbonate solution
No treatment (Low quality evidence) Water (Very Low quality evidence)
Hydrogen peroxide urea solution
Chlorobutanol (Very Low quality evidence) – AEs favour peroxide
Chlorobutanol solution Sodium bicarbonate (Very Low quality evidence)
Almond oil (Very Low quality evidence) – AEs favour Oil
No treatment (Very Low quality evidence)
Water (Very Low quality evidence)
Hydrogen peroxide urea (Very Low quality evidence) – AEs favour peroxide
Note: AEs: Adverse events or side effects, where reported. Favourable defined as absolute benefit of more than 19 fewer events per 1,000. All evidence on adverse events was rated Low or 3 Very Low quality 4
Table 49: Evidence for ear drops for treating earwax (ii) directly before irrigation 5
Superior to (benefit ≥100 per 1,000): No difference against (benefit between −100 and 100):
Water No treatment (Low quality evidence)
Sodium Chloride (Saline) Hydrogen peroxide urea when repeated (Low quality evidence) – AEs favour saline
Sodium bicarbonate solution
Nil No treatment (Low quality evidence)
Peroxide (Low quality evidence) – AEs favour sodium bicarbonate
Hydrogen peroxide urea solution
No treatment (Low quality evidence) Sodium bicarbonate (Low quality evidence), AEs favour sodium bicarbonate
Oil (Moderate quality evidence) – AEs favour oil
Chlorobutanol solution Saline (Low quality evidence)
Oil No treatment (Low quality evidence) Peroxide (Moderate quality evidence) – AEs favour oil
Note: AEs: Adverse events or side effects, where reported. Favourable defined as absolute benefit of more than 1 fewer event per 1,000. All evidence on adverse events was rated Low or 6 Very Low quality 7

Man
agemen
t of earw
ax
Hearin
g loss
© N
ICE 2
01
7. A
ll rights reserved
. Sub
ject to N
otice o
f rights.
12
0
Table 50: Evidence for ear drops for treating earwax (iii) for a number of days before irrigation 1
Superior to (benefit ≥100 per 1,000): No difference against (benefit between −100 and 100):
Sodium bicarbonate solution
Nil Docusate (High quality evidence) – AEs favour sodium bicarbonate
Oil (High quality evidence) – AEs no difference
Docusate solution Nil Sodium bicarbonate (High quality evidence) – AEs favour sodium bicarbonate
Oil (Moderate quality evidence) – AEs no difference
Oil Nil Sodium bicarbonate (High quality evidence) – AEs no difference
Docusate (Moderate quality evidence) – AEs no difference
Note: AEs: Adverse events or side effects, where reported. Favourable defined as absolute benefit of more than 1 fewer event per 1,000. All evidence on adverse events was rated Low or 2 Very Low quality 3
4
10.2.2 Economic evidence 5
10.2.2.1 Published literature 6
One health economic study was identified that compared self-irrigation, irrigation at primary care and no treatment and has been included in this review.19 7 This is summarised in the health economic evidence profile below (Table 51) and the health economic evidence table in appendix I. 8
See also the health economic study selection flow chart in appendix F. 9
Table 51: Health economic evidence profile: softeners followed by self-irrigation versus softeners followed by clinical irrigation versus no treatment 10
Study Applicability Limitations Other comments Incremental cost
Incremental effects
Cost effectiveness Uncertainty
Clegg 2010 19
(UK)
Partially applicable
(a)
Minor limitations
(b)
Population: adults 35–44 with earwax, not necessarily with hearing loss
Comparators:
o 1. no treatment
o 2. use softeners for a week, self-irrigating (bulb irrigator) if wax does not clear
2 versus 1:
£115.99
3 versus 1:
£156.32
2 versus 1:
0.00474 QALYs
3 versus 1:
0.00486 QALYs
2 versus 1:
£24,450 per QALY gained
3 versus 1:
£32,136 per QALY gained
Using the base case results at a cost-effectiveness threshold of £20,000 per QALY gained neither treatment is cost effective compared to no treatment, however self-irrigation is cost effective compared to no treatment at a threshold of

Man
agemen
t of earw
ax
Hearin
g loss
© N
ICE 2
01
7. A
ll rights reserved
. Sub
ject to N
otice o
f rights.
12
1
Study Applicability Limitations Other comments Incremental cost
Incremental effects
Cost effectiveness Uncertainty
o 3. use softeners (olive oil) for a week, returning to GP for irrigation if wax does not clear
Clinical effectiveness: from Keane 1995
53 and Coppin 2008
20
Costs included out-of-pocket expenditure on softeners and irrigators as well as NHS expenditure
Utility: no data from earwax studies. −0.006 used (mild to severe hearing loss measured using EQ-5D), though −0.06 used in a sensitivity analysis (improvement resulting from hearing aid use, measured by HUI3)
The study describes its results as ‘exploratory and should not be used as a basis for changing policy and practice’
3 versus 2:
£40.33
3 versus 2:
0.00012 QALYs
3 versus 2:
£336,000 per QALY gained
£30,000 per QALY gained.
Under sensitivity analysis self-treatment became cost effective if the treatment effectiveness was increased; both treatments became highly cost effective (£2,444 or £3,211 per QALY gained) if the disutility caused by earwax was taken to be 0.06 rather than 0.006.
Abbreviations: ICER: incremental cost-effectiveness ratio; QALY: quality-adjusted life years 1 (a) Target population was not specifically people with hearing loss and earwax. The analysis perspective was wider than NHS and PSS. The utility values were not obtained from people with 2
earwax but were indirect. 3 (b) Resource use is based on assumptions and not actual study data. Measurement of effectiveness was indirect (mild to severe hearing loss) not a direct measure of the effect of hearing 4
loss; the value used in the base case was measured used EQ-5D which is known to be insensitive to the effect of hearing loss, rather than HUI3, which was used in a sensitivity analysis. 5

Hearing loss Management of earwax
© NICE 2017. All rights reserved. Subject to Notice of rights. 122
10.2.2.2 Unit costs 1
See appendix P. 2
10.2.3 Evidence statements 3
Clinical 4
Ear drops alone compared to no treatment 5
There was a clinically important benefit for absence of impacted wax at 5 days when using water 6 or sodium bicarbonate compared to no treatment (very low quality evidence, 1 study). 7
There was no clinically important benefit when using chlorobutanol compared to no treatment 8 (very low quality evidence, 1 study). 9
10
Ear drops (alone) compared to each other: 11
There was a clinically important benefit for absence of impacted wax at 5 days when using 12 chlorobutanol compared to almond oil but a clinically important benefit for discontinuation due 13 to adverse events when using almond oil (very low quality evidence, 1 study). 14
There was a clinically important benefit of chlorobutanol compared to sodium bicarbonate for 15 absence of impacted wax at 5 days (very low quality evidence, 1 study). 16
There was no clinically important difference for absence of impacted wax at 5 days when using 17 sodium bicarbonate or chlorobutanol compared to water (very low quality evidence, 1 study). 18
There was no clinically important difference in the need for further management of wax when 19 using hydrogen peroxide urea solution compared to chlorobutanol but there was a clinically 20 important benefit of hydrogen peroxide urea in reported side effects (very low quality evidence, 1 21 study). 22
23
Earwax softeners compared to no intervention 15 to 30 minutes prior to irrigation: 24
There was a clinically important benefit of water before irrigation for number of attempts needed 25 to syringe until visibly clear of wax (low quality evidence, 1 study). 26
There was a clinically important benefit of hydrogen peroxide urea and olive oil compared to no 27 intervention for wax clearance by 5 minute syringing (low quality evidence, 1 study). 28
There was no clinically important difference in wax clearance by 5 minute syringing when using 29 sodium bicarbonate (low quality evidence, 1 study). 30
31
Earwax softeners to facilitate immediate irrigation: comparing ear drops against each other 32
There was a clinically important benefit of chlorobutanol compared to saline drops for complete 33 visualisation of tympanic membrane after syringing and there were no reported adverse events 34 prior to syringing (low quality evidence, 1 study). 35
There was no clinically important difference in wax clearance by 5 minute syringing when using 36 hydrogen peroxide urea compared to sodium bicarbonate (low quality evidence, 1 study) but 37 there was a clinically important benefit of sodium bicarbonate for discomfort prior to syringing 38 (very low quality evidence, 1 study). 39

Hearing loss Management of earwax
© NICE 2017. All rights reserved. Subject to Notice of rights. 123
There was no clinically important difference in wax clearance by 5 minute syringing when using 1 hydrogen peroxide urea compared to olive oil (moderate quality evidence, 1 study) but there was 2 a clinically important benefit of oil for discomfort prior to syringing. 3
4
Earwax softeners to facilitate delayed irrigation: comparing ear drops against each other 5
There was no clinically important difference in complete visualisation of the tympanic membrane 6 after the first syringing attempt when using hydrogen peroxide urea compared to saline solution 7 but there was a clinically important benefit of saline for complete visualisation of the tympanic 8 membrane after the second syringing attempt and for reported adverse events from ear drops 9 (low quality evidence, 1 study). 10
There was no clinically important difference in successful syringing attempts at 3 days when using 11 docusate compared to sodium bicarbonate (high quality evidence, 1 study) but there was a 12 clinically important benefit of sodium bicarbonate for less adverse events (otitis externa; low 13 quality evidence, 1 study). 14
There was no clinically important difference in successful syringing at 3 days (moderate quality 15 evidence, 1 study) and in adverse events (otitis externa) when using olive oil compared to sodium 16 bicarbonate (very low quality evidence, 1 study) 17
There was no clinically important difference in successful syringing at 3 days (moderate quality 18 evidence, 1 study) and adverse events (otitis externa; very low quality evidence, 1 study) when 19 using docusate solution compared to oil. 20
There was no clinically important difference in wax clearance at up to 5 syringes (low quality 21 evidence, 1 study) and ease of syringing (very low quality evidence, 1 study) when comparing 22 water to oil. 23
24
Clinic irrigation compared to other strategies: 25
Ear drops plus home syringing kit versus ear drops plus irrigation in GP clinic for earwax 26
There was a clinically important benefit of clinic irrigation compared to home syringing for 27 absence of impacted wax at 1-2 week follow-up (low quality evidence, 1 study) and for adverse 28 events (discomfort during treatment; low quality evidence, 1 study). 29
There was a clinically important benefit of home syringing for repeated consultation for wax 30 related symptoms within 2 years (very low quality evidence, 1 study). 31
There was no clinically important difference in change in symptom score (very low quality 32 evidence, 1 study), otitis externa and perforation at follow-up (very low quality evidence, 1 study), 33 discomfort and dizziness during treatment (very low quality evidence, 1 study). 34
Clinic irrigation following ear drops compared to ear drops alone 35
There was a clinically important benefit of clinic irrigation for hearing improvement by at least 10 36 dB HL PTA (0.5, 1, 2 and 4 kHz) (moderate quality evidence, 1 study) and for improvement in 37 hearing (low quality evidence (low quality evidence, 1 study). 38
39
Economic 40
One cost–utility analysis found that neither self-irrigation after using softeners nor attending a GP 41 for wax removal after using softeners were cost effective compared to no treatment for treating 42 earwax (ICERs: £24,450 per QALY and £32,136 per QALY gained respectively compared to no 43 treatment). This analysis was assessed as partially applicable with minor limitations. 44

Hearing loss Management of earwax
© NICE 2017. All rights reserved. Subject to Notice of rights. 124
10.2.4 Recommendations and link to evidence 1
Recommendations 16. Offer to remove earwax in primary or community care for adults if it is contributing to hearing loss or other symptoms, or prevents examination of the ear.
17. Consider ear irrigation using an electronic irrigator to remove earwax in adults, provided there are no contraindications such as eardrum perforation, ear infection or ear surgery.
18. When carrying out ear irrigation in adults:
use pre-treatment wax softeners, either immediately before ear irrigation or for up to 5 days beforehand
if irrigation is unsuccessful:
i. repeat use of wax softeners or
ii. instil water into the ear canal 15 minutes before repeating ear irrigation with an electronic irrigator
If irrigation is unsuccessful after the second attempt, refer the person to a specialist ear care service or an ear, nose and throat service for removal of earwax.
19. Consider microsuction or other methods of earwax removal (such as manual removal using a probe) for adults in primary or community care only if:
the practitioner (such as a community nurse or audiologist) has training and expertise in using these methods to remove earwax and
the correct equipment is available.
20. Do not offer adults manual ear syringing to remove earwax.
21. Advise adults not to remove earwax or clean their ears by inserting small objects, such as cotton buds, into the ear canal. Explain that this could damage the ear canal and eardrum, and push the wax further down into the ear.
Research recommendation
3. What is the clinical and cost effectiveness of microsuction compared with irrigation to remove earwax?
Relative values of different outcomes
The outcomes identified as critical outcomes for this review were health-related and hearing-related quality of life, any outcomes related to wax removal, for example ability or ease of removal, and adverse events such as perforations or infections.
Pure tone audiometry was identified as an important outcome.
Quality of the clinical evidence
The evidence found was very limited with mainly single studies made up of small numbers comparing interventions. The majority of the evidence ranged from low to very low quality. This was mainly due to risk of bias in patient selection and allocation where adequate descriptions were not provided and to indirectness as several papers do not include enough detail to determine whether children were included.
The guideline committee noted the majority of the studies compared 2 alternative interventions or investigated the timing or combinations of interventions rather than comparing treatment with no treatment. Only 1 study compared the use of earwax

Hearing loss Management of earwax
© NICE 2017. All rights reserved. Subject to Notice of rights. 125
softeners to no treatment.
Ear drops alone:
The evidence showed that there was a clinically important benefit in using ear drops, specifically water or sodium bicarbonate, compared to no treatment to remove impacted wax. Chlorobutanol did not show a clinically important benefit.
When different ear drops were compared to each other, chlorobutanol was found to have a clinically important benefit compared to almond oil and to sodium bicarbonate. Both chrolobutanol and sodium bicarbonate showed clinically important benefits compared to water and hydrogen peroxide urea was more clinically beneficial than chlorobutanol.
Ear drops prior to facilitate irrigation:
When compared to no treatment, water, hydrogen peroxide and olive oil had a clinically beneficial effect but there was no clinically important benefit of sodium bicarbonate in facilitating immediate irrigation.
When comparing ear drops against each other, the only clinically important benefit observed was when cholobutabol was compared to saline drops prior to immediate syringing.
No clinically important differences were observed when ear drops were compared to each other prior to delayed irrigation.
Clinical irrigation compared to other strategies:
There was a clinically important benefit for successful removal of wax when this was performed by syringing in a clinic compared to removal using home kits.
Adverse events were generally not well reported but there was mostly a small or no clinically important difference between the different ear was softeners used and when comparing removal by syringing in a clinic to home kits.
On the whole, the evidence does suggest that there is a clinical benefit in using an earwax softener such as water or sodium bicarbonate either as the sole treatment, or to facilitate irrigation (for example oil or hydrogen peroxide). However, due to the limitations of the evidence, it was difficult to conclude that there is clear advantage of using one particular softener over another.
The committee noted the absence of evidence regarding mechanical removal.
Trade-off between clinical benefits and harms
The committee discussed the importance of managing earwax in people with hearing loss. The presence of impacted wax prevents examination of the ear, and makes it impossible to perform accurate audiometry or take an ear mould impression. People who wear hearing aids are more likely to have impacted wax due to the hearing aid preventing wax from being excreted naturally. Although the committee agreed that the evidence was weak when considering one treatment over another, it was accepted that it is standard practice to treat earwax because it is not possible to manage a person’s hearing loss clinically without removing earwax when present, nor is it safe to manage hearing loss without excluding conditions like chronic infection by examination of the eardrum. The committee considered it important to stress that the removal of earwax should be provided as part of basic management of patients, and made a consensus recommendation for the circumstances in which earwax should be removed.
The committee agreed that wax can be removed under direct vision or a microscope using a probe in certain situations when wax build up is minimal and sited near the meatus rather than impacted earwax, but research and discussion should be focused
Hearing loss Management of earwax
© NICE 2017. All rights reserved. Subject to Notice of rights. 126
towards situations where this would not be the case.
The committee noted the clinical benefit of ear irrigation as opposed to ear drops alone. In current practice, wax softeners are the standard intervention in primary care, followed by irrigation if unsuccessful.
Irrigation of the ear canal should be undertaken using warm water and an electronic ear irrigation machine with a variable pressure control. A jet tip is used to angle the flow of water along the top of the posterior wall. Historically ear syringing was used and this is evident in the papers reviewed. The effect is the same but irrigation is a much safer method and syringing is now contraindicated because of adverse effects, namely trauma.
Ear irrigation may be unsafe for some patients. The committee noted that the NICE clinical knowledge summary on ear irrigation includes contraindications for ear irrigation, and considered it important to signpost clinicians to this resource. Contraindications include perforation of the tympanic membrane, previous ear surgery, ear infection, previous problem with irrigation, and presence of a foreign body in the ear.
The evidence demonstrated the benefit of using earwax softeners before ear irrigation, however the evidence was not strong enough to recommend a specific type of softener between oil, sodium bicarbonate or water. The committee recognised that it is currently common practice to use sodium bicarbonate or olive oil, although there is wide variation in practice amongst clinicians and personal preference plays a strong role, as does the type of the earwax. The evidence indicated that water is as clinically effective as other types of softeners and could be used as an alternative. The committee considered that clinical judgement should be used to determine which softener is most appropriate for the patient. Clinicians should also consider cost as a factor in their decision-making.
Adverse events (such as irritation, otitis externa and perforation of ear drum) were reported in the evidence for hydrogen peroxide before irrigation, but the committee noted that the majority of studies did not report adverse events, so no conclusions could be drawn about adverse events of other treatments. The committee noted that sodium bicarbonate can also cause irritation. In contrast, there is some evidence that favours hydrogen peroxide alone (without irrigation). The committee noted the risk of potential confounding, for example if patients have used a cotton bud at the same time as the softener. The committee confirmed that hydrogen peroxide is no longer used in most clinical settings; however, it is available in pharmacies and is commonly used by the public in self-management. There is no evidence that hydrogen peroxide is more effective than other softeners before irrigation and there is evidence of a risk of adverse events, however overall the committee did not feel that there was sufficient evidence to justify making a negative recommendation about hydrogen peroxide.
There was no high quality evidence in favour of a specified time interval for administering a softener before ear irrigation, however the committee considered that this was a clinically significant issue. In the absence of evidence favouring longer periods of administration, and the impact on patients’ quality of life caused by waiting, the committee agreed by consensus to recommend a timescale of either immediately before irrigation or up to 5 days prior to irrigation. The committee noted that GPs may not be aware that administering ear drops on the same day as irrigation is an option, and wanted to highlight this for consideration. The impact on resources was noted as additional primary care appointments would not be required, but in some cases this would have to be balanced against appointments taking longer if the wax is difficult to remove. There may also be implications for clinic planning, particularly in remote rural areas where patients have limited travel options and may appreciate same day treatment.
Giving the patient advice or a leaflet on the correct method to instil ear drops is

Hearing loss Management of earwax
© NICE 2017. All rights reserved. Subject to Notice of rights. 127
valuable to ensure they have effect.
The committee also noted issues around compliance and whether some patients with cognitive decline or physical limitations are able to administer earwax softeners effectively themselves. The committee suspected that some older patients in this category would not be able to self-administer this treatment, but would instead require instillation of drops by a healthcare professional in the clinic shortly before irrigation.
The committee noted that no evidence was found comparing the clinical or cost effectiveness of irrigation with other mechanical methods, such as microsuction or physical removal with a probe. Microsuction is the method usually employed by ENT services because it is quick and efficient and allows the clinician a good view of the ear canal. It is the method of choice if irrigation has failed or if the person has external or middle ear pathology. The technique, however, is gaining in popularity and is available in some ear care clinics. The committee wished to highlight that microsuction may be considered where available, and where appropriately trained staff can use this technique .
The committee considered that ear syringing with a large metal syringe or similar obsolete equipment is potentially harmful. The design of the syringe and the inability to control the water pressure increases the risk of damage to the ear canal and tympanic membrane. This treatment should no longer be used in current practice. Irrigation using an electronic ear irrigation machine which pumps water into the ear at a controlled pressure is safer.
The committee noted the lack of evidence on the harms associated with the use of cotton buds. The committee agreed cotton buds can present a potential hazard when used by patients or their carers to remove wax themselves, and the importance of highlighting this with a consensus recommendation to warn of the increased risk of infections and causing wax to become impacted by pushing it further into the ear canal. The general advice given is not to insert anything into the ear canal as it is self-cleaning and the only cleaning needed is to gently wipe the conch of the external ear with a damp flannel over a finger in order to clean earwax away from the meatus (entrance to the ear canal).
Trade-off between net clinical effects and costs
One UK health economic evaluation was identified, which was carried out as part of an NIHR health technology assessment. This compared 3 options: no treatment; treatment using softeners for a week and self-irrigating (using a bulb irrigator) if the wax does not clear; using softeners for a week and returning to a GP if the wax does not clear. The study described its results as “exploratory and should not be used as a basis for changing policy and practice”.
The evaluation showed that GP-administered irrigation was not cost effective compared to self-irrigation due to very little additional benefit to quality of life from increased effectiveness. However, the committee noted that self-irrigation is not commonly recommended in the UK, and this would raise concerns regarding possible adverse events from misuse.
The committee noted the significant difference in the ICERs for earwax removal compared to no removal depending on which quality of life measure is used: this was highly cost effective at a threshold of £20,000 per QALY gained when quality of life was measured using HUI3 but not cost effective when EQ-5D was used. The committee agreed that HUI3 is a more appropriate measure of quality of life for people with hearing loss than EQ-5D (see appendix N for more discussion on this issue), and that it appears to be more appropriate in this context, however the committee noted that this study had not found any measurement for a change in utility directly equivalent to the impact of having earwax, and so the results of this study could not be relied upon.
In addition to the low quality evidence that earwax removal could be cost effective, the committee also noted that current practice is to remove wax, and did not consider no treatment to be an option for consideration as this would not be

Hearing loss Management of earwax
© NICE 2017. All rights reserved. Subject to Notice of rights. 128
acceptable to patients.
Regarding the most cost-effective method of removing earwax, the committee was constrained by the lack of clinical evidence regarding methods other than irrigation (such as microsuction). Irrigation has been shown to be effective. The cost of the initial purchase of the machine (around £159) will be split over many hundreds of uses, and so is not significant. Consumables cost only £0.54 per use. Irrigation machines are currently found in some GP surgeries. The major cost involved is the healthcare professional’s time, which is dependent on the number of appointments required to remove the earwax. Microsuction machines are considerably more expensive than irrigation machines. If purchased with a microscope the combined equipment can cost from £7,500 to as much as £14,000 if a high end microscope is used. However, if a loupe (a portable microscope with lower magnification) is used instead of a microscope then the combined cost would instead be between £1,350 and £3,350. The cost of consumables is however still low, expected to be slightly under £3 per use.
In some areas there are alternative local clinics providing irrigation to which people can be referred. It is not necessary and would not be appropriate to refer people with earwax, without complications, to a hospital service for earwax removal, as this would be unnecessarily more expensive than a primary care appointment.
Consequently the committee recommended that earwax removal should be offered as it is likely to be cost effective, and that irrigation should be considered as the method of removal.
Where irrigation is used softeners should be used before irrigation to increase the rate of success of irrigation. The committee noted that various possible softeners are available that are cheap and similarly priced (all below £3 per bottle, with the cheapest below £1 per bottle). The committee therefore agreed that softeners that can be obtained at a low price and do not carry a risk of adverse effect should be preferred, such as water, sodium chloride or olive oil. Softeners such as water or sodium bicarbonate can be effective if instilled a few minutes before irrigation, or part-way through the irrigation appointment, thus reducing the need for further additional visits and also decreasing delays in care.
The committee noted that no clinical or economic evidence was identified regarding microsuction compared to ear irrigation in either this review or the review of settings for earwax management, despite a common belief among clinicians that microsuction is more effective. The committee also noted that, whereas ear irrigation is widely available, microsuction is less widely available and the equipment is more expensive. The committee therefore recommended that microsuction could be considered where it is already available, but that it cannot recommend that microsuction equipment be routinely purchased.
Other considerations The committee also noted that there is a range of treatments available for treating earwax that are inappropriate and should not be used, for example ear candles.
The committee discussed how great the impact of earwax on audibility would be. It was agreed that the measurable difference was probably not more than 10dB in most cases; a level which would give a perceived reduction in volume of 50%. The committee however recognised that earwax can have a huge impact on quality of life, especially for certain occupations where safety is important. It is likely to have a much greater impact on those who wear hearing aids and find themselves unable to use their aids because of earwax.
Review question: What is the most clinically and cost-effective 10.3 1
setting for the identification and treatment of earwax? 2
For full details see review protocol in appendix C. 3

Hearing loss Management of earwax
© NICE 2017. All rights reserved. Subject to Notice of rights. 129
Table 52: PICO characteristics of review question 1
Population Adults aged 18 years and over who have difficulties hearing and earwax
Intervention and comparator
Treatment in a primary care setting, for example a GP’s surgery
Secondary care
Outcomes Critical
Success of earwax removal
Improvement in hearing
Adverse events
o Earwax related
- perforation
- Infection
- vertigo
- bleeding
- Discomfort
Hearing-specific health-related quality of life
o Any patient-reported scale that has been validated to provide health utility measure, for example:
- WHO DAS II
- HUI2/HUI3
- Cambridge Otology QOL Questionnaire
- Speech, Spatial and Qualities of Hearing Scale (SSQ)
Patient-reported disability or benefit
Measures validated to demonstrate changes with audiology care in the population under study, for example:
o Device Orientated Subjective Outcome Scale
o Glasgow Hearing Aid Benefit Profile
o Hearing Handicap Inventory for the Elderly
Study design RCT
Systematic review of RCTs
If not enough RCT evidence is identified, cohort studies will be considered
10.3.1 Clinical evidence 2
No relevant clinical studies were identified that compared the identification or treatment of earwax 3 in primary or secondary care in adults who have difficulties hearing and earwax. See study selection 4 flow chart in appendix E and the excluded studies list in appendix L. 5
6
10.3.2 Economic evidence 7
10.3.2.1 Published literature 8
No relevant health economic studies were identified. 9
See also the health economic study selection flow chart in appendix F. 10
10.3.2.2 Unit costs 11
See appendix P. 12

Hearing loss Management of earwax
© NICE 2017. All rights reserved. Subject to Notice of rights. 130
10.3.3 Evidence statements 1
Clinical 2
No relevant clinical studies were identified for this review. 3
Economic 4
No relevant economic evaluations were identified. 5
10.3.4 Recommendations and link to evidence 6
Recommendations Please refer to recommendations in section 10.2.4 on earwax removal methods
Relative values of different outcomes
The committee agreed that the critical outcomes for decision-making were successful earwax removal; improvement in hearing; adverse events related to earwax including perforation, infection, vertigo, bleeding and discomfort; hearing-specific health-related quality of life as reported by validated scales including WHO DAS II, HUI2/HUI3, Cambridge Otology QoL Questionnaire and the SSQ. Further critical outcomes included patient reported disability or benefit; measures validated to demonstrate changes with audiology care in the population under study for example, the Device Orientated Subjective Outcome Scale, Glasgow Hearing Aid Benefit Profile and Hearing Handicap Inventory for the Elderly.
Quality of the clinical evidence
No relevant clinical studies were identified for this review.
Trade-off between clinical benefits and harms
As no evidence was found the recommendations were based on consensus of the committee.
The committee discussed the most appropriate setting for routine earwax removal and acknowledged that there was delay in management of earwax and over-referral to secondary ENT services. The committee recognise the build-up of earwax is common, particularly in people who wear hearing aids, and removal of wax is necessary as part of managing the person’s hearing loss.
Management of earwax is usually carried out within primary care but there is variation in how and where physical removal by irrigation or microsuction takes place. In the absence of any evidence the committee made a consensus recommendation for management of earwax, including removal by irrigation or microsuction, to be carried out in a primary or community care setting, unless there are contraindications. Contraindications would include cases where wax impaction accompanies the following conditions:
The person has (or is suspected to have) a perforation of the tympanic membrane, including grommets.
There is a past history of ear surgery.
There is a foreign body, including vegetable matter, in the ear canal.
• There is obvious otitis externa
Or if:
• Ear drops have been unsuccessful and irrigation is contraindicated
• Wax removal in primary or community care has been unsuccessful.
In these situations referral should be made to an ENT service.
The committee discussed the use of microsuction for earwax removal in a number of

Hearing loss Management of earwax
© NICE 2017. All rights reserved. Subject to Notice of rights. 131
different environments including GP practices, audiology and community health services. It was noted that the availability of this service is variable, and in some areas people would be referred to ENT for this procedure. The committee agreed that as long as the correct equipment was available and there were health professionals trained to carry out this procedure, it would be appropriate to offer this service within primary or community care settings, and this should be encouraged. The committee noted that dedicated ear care clinic facilities are being set up in some areas.
Ear care clinics provide ear irrigation and microsuction facilities for people with wax. They are usually staffed by audiologists or community nurses and have the additional function of providing hearing aid repairs, batteries and new moulds or tubing. Many offer a drop-in facility. They can offer a convenient one-stop facility for people with hearing aids.
Referring people to ENT services for simple cases of wax removal would not be an appropriate use of ENT resources.
Trade-off between net clinical effects and costs
No health economic evidence was identified for this question.
The committee noted that, in its experience, there is an increasing trend for GP surgeries not to treat patients with uncomplicated earwax in the surgery but to routinely refer them elsewhere or give them long courses of ear drops which, used on their own, are ineffective. This may be because of a misunderstanding of the difference between ear syringing (no longer advised) and ear irrigation (now the method of choice). If onward referral is to a community setting where a trained healthcare professional performs ear irrigation this can be a very efficient use of resources as the high volume of cases increases efficiency and expertise. However, in some cases people with uncomplicated earwax are being referred to secondary care ENT services. This is not a cost-effective pathway and is an inappropriate use of specialist services that have limited capacity. The committee hence recommended that, unless contraindicated, earwax removal should be conducted in primary care or community care – either GP surgeries or community settings specialising in this service, such as ear care clinics.
Other considerations The committee noted the NICE clinical knowledge summary on earwax. .
1

Hearing loss Sudden sensorineural hearing loss (SSNHL)
© NICE 2017. All rights reserved. Subject to Notice of rights. 132
11 Sudden sensorineural hearing loss (SSNHL) 1
Introduction 11.1 2
Sudden sensorineural hearing loss (SSNHL) is an ENT emergency and is defined as a loss of hearing of 3 30 dB HL or more, over at least 3 contiguous frequencies, that develops within 3 days. Most cases are 4 unilateral and the commonest age group affected are adults in their 40s and 50s. In 90% of cases no 5 underlying cause is identified and it is considered idiopathic. Idiopathic SSNHL affects approximately 6 5–20 per 100,000 people per year with an equal gender distribution. The hearing loss can range from 7 mild to profound and can be temporary or permanent. Idiopathic SSNHL significantly impacts on 8 individuals’ lives, causing considerable disability, especially if there is a pre-existing hearing deficit in 9 the other ear. 10
Hearing loss is confirmed by pure tone audiometry, and serious underlying causes are excluded by 11 history, examination, MRI and blood tests. Additional investigations may be indicated depending on 12 the presentation. 13
The mainstay of treatment currently consists of early initiation of steroids with antivirals as a possible 14 adjunct. The effectiveness of these treatments is poorly understood and there is no national 15 standard or guidance for the management of idiopathic SSNHL, with considerable variation in 16 practices in terms of treatment regimen employed and routes of administration. This chapter 17 examines the most clinically and cost-effective medical treatments for idiopathic sudden 18 sensorineural hearing loss, including routes of administration. 19
Review question: What is the most clinically and cost-effective 11.220
treatment for idiopathic sudden sensorineural hearing loss 21
(SSNHL)? 22
For full details see the review protocol in appendix C. 23
Table 53: PICO characteristics of review question 24
Population Adults aged 18 and over with idiopathic SSNHL
Interventions and comparators
Interventions:
Steroids
Prednisolone
Dexamethasone (also known as betamethasone)
Hydrocortisone
Antivirals
Acyclovir
Amantadine
Valacyclovir
Famciclovir
Ganciclovir
Comparisons:
Compared to each other or to placebo / no treatment (if applicable)
Combination (steroids and antivirals only) and different dosages will also be included

Hearing loss Sudden sensorineural hearing loss (SSNHL)
© NICE 2017. All rights reserved. Subject to Notice of rights. 133
Outcomes Critical:
Pure-tone audiometry
Speech discrimination
Health-related quality of life
Hearing-specific health-related quality of life
Important:
Adverse events for example, gastrointestinal bleeding, mood alteration or psychosis
Study design RCTs
Systematic review of RCTs
11.2.1 Clinical evidence 1
Thirteen studies were included in the review: 8 first-line treatment comparisons 4 ,11 ,37 ,78 ,97 ,102 ,103 ,110; 2 and 5 second-line treatment regimens 59 ,60 ,83 ,114 ,115, these are summarised in Table 55 below. 3 Evidence from these studies is summarised in the clinical evidence summaries below (Table 56, Table 4 57, Table 58, Table 59 and Table 60). See also the study selection flow chart in appendix E, forest 5 plots in appendix K, study evidence tables in appendix H, GRADE tables in appendix J and excluded 6 studies list in appendix L. 7
Two Cochrane systematic reviews were identified: Antivirals for idiopathic sudden-onset 8 sensorineural hearing loss 7 and Steroids for idiopathic sudden sensorineural hearing loss.108 9 References from these, and other identified systematic reviews and meta-analyses, were checked 10 and studies were included in this review if they matched our protocol. 11
Some papers that were excluded by the Cochrane review on Steroids for idiopathic sudden 12 sensorineural hearing loss108 have been included in our review. The reasons for exclusion from the 13 Cochrane review were as follows: 14
Battaglia 200811 – “impossible to determine the true effects of steroid when there was no 15 double placebo control (placebo intratympanic injections with placebo taper)” 16
Lee 201159 – not randomised, double blind, or placebo controlled 17
Li 201160 – not double blind or placebo controlled. “impossible to determine the true effects 18 of steroid when there was no placebo control” 19
Plontke 200983 – “Impossible to determine the true effects of steroid when there was no 20 placebo control (participants without any systemic and local steroid treatment)” 21
Wu 2011114 – “Impossible to determine the true effects of steroid when there was no double 22 placebo control of patients who received neither systemic nor intratympanic steroid” 23
Our protocol included studies that lacked a placebo comparison whereas the Cochrane review didn’t. 24 In addition, we believe that the Lee 201159 study which was excluded from the Cochrane review, is in 25 fact, randomised and has therefore been included in our review. 26
Two papers that were included in the Cochrane review on steroids108 have been excluded from this 27 review (Cinamon 200117 and Wilson 1980112) due to being quasi-randomised and having unclear 28 methodology with mixed treatment doses, respectively. 29
One paper included in the Cochrane review on antivirals,7 did not have any analysable data and was 30 excluded (Westerlaken 2003) 111. 31
Of the included studies, all had a population with unilateral hearing loss. The methods for excluding 32 underlying causes of hearing loss vary, with some studies excluding patients post randomisation 33
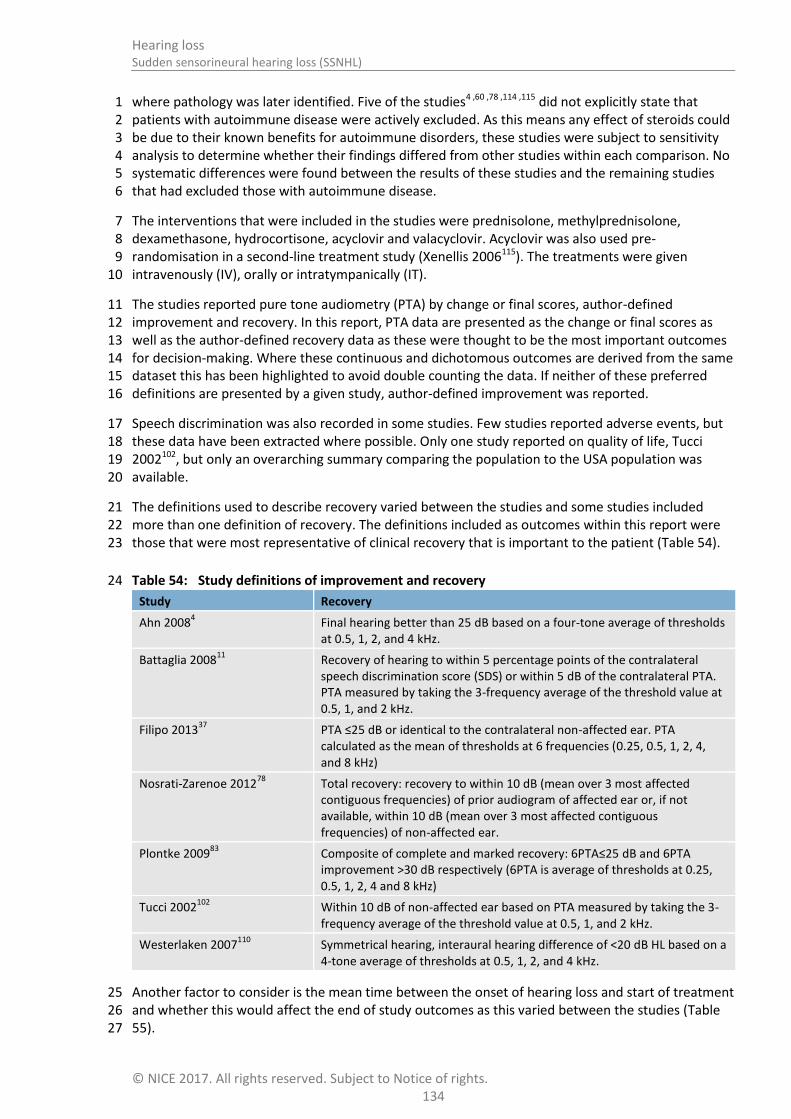
Hearing loss Sudden sensorineural hearing loss (SSNHL)
© NICE 2017. All rights reserved. Subject to Notice of rights. 134
where pathology was later identified. Five of the studies4 ,60 ,78 ,114 ,115 did not explicitly state that 1 patients with autoimmune disease were actively excluded. As this means any effect of steroids could 2 be due to their known benefits for autoimmune disorders, these studies were subject to sensitivity 3 analysis to determine whether their findings differed from other studies within each comparison. No 4 systematic differences were found between the results of these studies and the remaining studies 5 that had excluded those with autoimmune disease. 6
The interventions that were included in the studies were prednisolone, methylprednisolone, 7 dexamethasone, hydrocortisone, acyclovir and valacyclovir. Acyclovir was also used pre-8 randomisation in a second-line treatment study (Xenellis 2006115). The treatments were given 9 intravenously (IV), orally or intratympanically (IT). 10
The studies reported pure tone audiometry (PTA) by change or final scores, author-defined 11 improvement and recovery. In this report, PTA data are presented as the change or final scores as 12 well as the author-defined recovery data as these were thought to be the most important outcomes 13 for decision-making. Where these continuous and dichotomous outcomes are derived from the same 14 dataset this has been highlighted to avoid double counting the data. If neither of these preferred 15 definitions are presented by a given study, author-defined improvement was reported. 16
Speech discrimination was also recorded in some studies. Few studies reported adverse events, but 17 these data have been extracted where possible. Only one study reported on quality of life, Tucci 18 2002102, but only an overarching summary comparing the population to the USA population was 19 available. 20
The definitions used to describe recovery varied between the studies and some studies included 21 more than one definition of recovery. The definitions included as outcomes within this report were 22 those that were most representative of clinical recovery that is important to the patient (Table 54). 23
Table 54: Study definitions of improvement and recovery 24
Study Recovery
Ahn 20084 Final hearing better than 25 dB based on a four-tone average of thresholds
at 0.5, 1, 2, and 4 kHz.
Battaglia 200811
Recovery of hearing to within 5 percentage points of the contralateral speech discrimination score (SDS) or within 5 dB of the contralateral PTA. PTA measured by taking the 3-frequency average of the threshold value at 0.5, 1, and 2 kHz.
Filipo 201337
PTA ≤25 dB or identical to the contralateral non-affected ear. PTA calculated as the mean of thresholds at 6 frequencies (0.25, 0.5, 1, 2, 4, and 8 kHz)
Nosrati-Zarenoe 201278
Total recovery: recovery to within 10 dB (mean over 3 most affected contiguous frequencies) of prior audiogram of affected ear or, if not available, within 10 dB (mean over 3 most affected contiguous frequencies) of non-affected ear.
Plontke 200983
Composite of complete and marked recovery: 6PTA≤25 dB and 6PTA improvement >30 dB respectively (6PTA is average of thresholds at 0.25, 0.5, 1, 2, 4 and 8 kHz)
Tucci 2002102
Within 10 dB of non-affected ear based on PTA measured by taking the 3-frequency average of the threshold value at 0.5, 1, and 2 kHz.
Westerlaken 2007110
Symmetrical hearing, interaural hearing difference of <20 dB HL based on a 4-tone average of thresholds at 0.5, 1, 2, and 4 kHz.
Another factor to consider is the mean time between the onset of hearing loss and start of treatment 25 and whether this would affect the end of study outcomes as this varied between the studies (Table 26 55). 27

Hearing loss Sudden sensorineural hearing loss (SSNHL)
© NICE 2017. All rights reserved. Subject to Notice of rights. 135
1
Table 55: Summary of studies included in the review 2
Study
Mean time from onset of HL to start of treatment Intervention and comparison Population Outcomes Comments
First-line treatment
Ahn 2008
4
South Korea
6.5 (3.9) and 7.1 (4.1) days
Methylprednisolone (oral, 48mg per day for 9 days, 5 day tapering) versus methylprednisolone (oral, as above) plus dexamethasone (IT, 0.3-0.4ml of 5mg/ml 1
st,
3rd
and 5th
day) 14 days of treatment, 3 months follow-up
n=120
No age restriction given in inclusion criteria. ITD group 48.6 (15.4) years, Control 45.9 (14.7) years.
PTA: complete recovery, slight hearing improvement
Risk that children were included as it was not stated that they were excluded.
Battaglia 2008
11
USA
11 (14), 7 (6), 4 (3) days (had to be within 6 weeks)
Prednisolone (oral) plus dexamethasone (IT) versus Prednisolone (oral) plus placebo (IT) versus Placebo (oral) plus dexamethasone (IT) Oral steroid dosing: 60mg/day for 7 days, 50mg for 2 days, 40mg for 2 days 30mg 1 day, 20mg 1 day, 10mg 1 day.
Dexamethasone (IT) dosing: 0.5-0.7ml of 12mg/ml once a week for 3 weeks (unclear when first dose given).
Stated to be a 2 year study. Capsules taken for 2 weeks, transtympanic injections over 3 weeks, audiogram stated to have been taken 4 weeks after the final injection. Also describes a 3 month follow-up after the last patient enrolled.
n=51
No standard deviations were reported. Placebo taper plus IT-Dex 60 years, HDPT plus IT saline 54 years, HDPT plus IT Dex 57 years.
PTA: scores, improvement, recovery
Speech discrimination score
No age inclusion or ranges given. Risk of the inclusion of children.
Filipo 2013
37
Italy
Diagnosed within 3 days of onset. No data given.
Prednisolone (IT, 0.3ml at a dose of 62.5mg/ml/day for 3 days) versus placebo (IT)
3 days of intervention, follow-up at 1 month.
n=50
For the IT prednisolone group 49.9 (12.6) and IT saline group 50.8 (14.7) years
Adverse events
PTA: improvement, recovery
Inclusion criteria was 15-85 years. Unclear how many children were included in the study.
Nosrati-zarenoe 2012
78
Sweden
Seeking care within 1 week after onset of HL. Range 0-7 days. Mean 3 (1.9) and 3.2 (2.3) days.
Prednisolone (oral, 60mg/day for 3 days, reduced by 10mg/day, total treatment time 8 days. If recovery was complete, treatment stopped, otherwise medication was continued at one capsule daily to a total of 30 days from beginning.) versus Placebo
n=103
Prednisolone 56.8 (12.7) range 26-80 years, Placebo 53.8 (13.5), range 26-79 years.
Adverse events
PTA: mean change and recovery
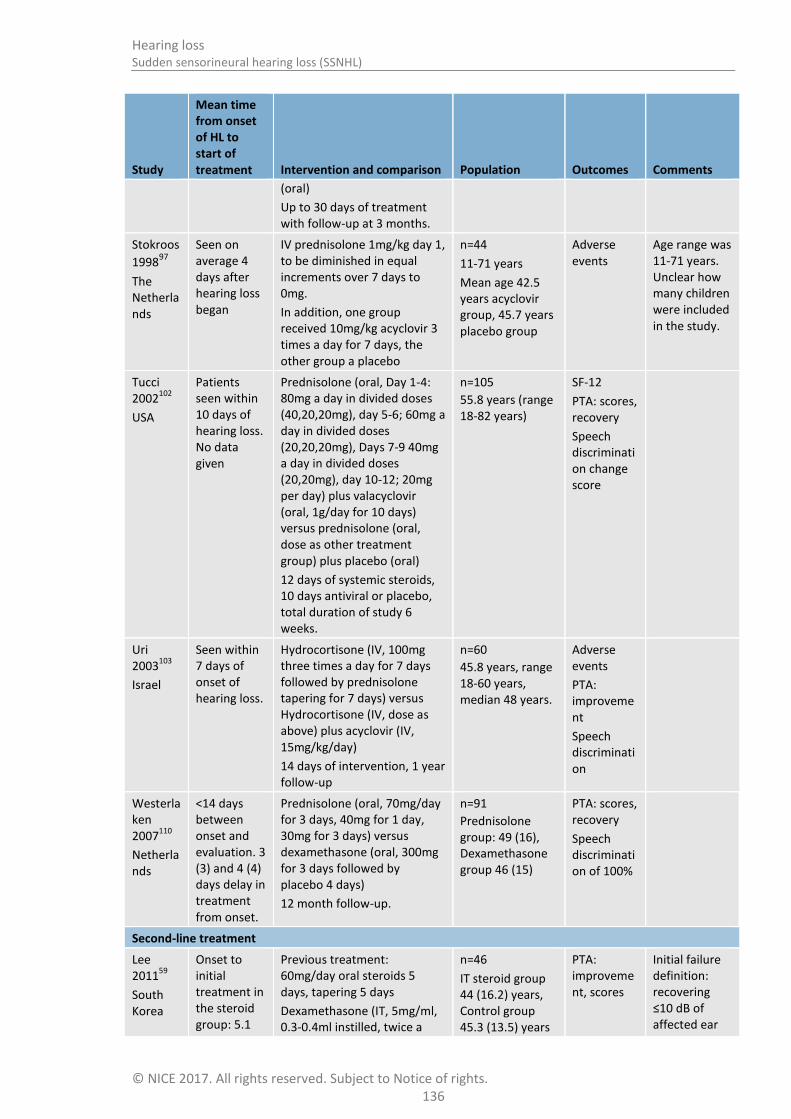
Hearing loss Sudden sensorineural hearing loss (SSNHL)
© NICE 2017. All rights reserved. Subject to Notice of rights. 136
Study
Mean time from onset of HL to start of treatment Intervention and comparison Population Outcomes Comments
(oral)
Up to 30 days of treatment with follow-up at 3 months.
Stokroos
199897
The Netherlands
Seen on average 4 days after hearing loss began
IV prednisolone 1mg/kg day 1, to be diminished in equal increments over 7 days to 0mg.
In addition, one group received 10mg/kg acyclovir 3 times a day for 7 days, the other group a placebo
n=44
11-71 years
Mean age 42.5 years acyclovir group, 45.7 years placebo group
Adverse events
Age range was 11-71 years. Unclear how many children were included in the study.
Tucci 2002
102
USA
Patients seen within 10 days of hearing loss. No data given
Prednisolone (oral, Day 1-4: 80mg a day in divided doses (40,20,20mg), day 5-6; 60mg a day in divided doses (20,20,20mg), Days 7-9 40mg a day in divided doses (20,20mg), day 10-12; 20mg per day) plus valacyclovir (oral, 1g/day for 10 days) versus prednisolone (oral, dose as other treatment group) plus placebo (oral)
12 days of systemic steroids, 10 days antiviral or placebo, total duration of study 6 weeks.
n=105
55.8 years (range 18-82 years)
SF-12
PTA: scores, recovery
Speech discrimination change score
Uri 2003
103
Israel
Seen within 7 days of onset of hearing loss.
Hydrocortisone (IV, 100mg three times a day for 7 days followed by prednisolone tapering for 7 days) versus Hydrocortisone (IV, dose as above) plus acyclovir (IV, 15mg/kg/day)
14 days of intervention, 1 year follow-up
n=60
45.8 years, range 18-60 years, median 48 years.
Adverse events
PTA: improvement
Speech discrimination
Westerlaken 2007
110
Netherlands
<14 days between onset and evaluation. 3 (3) and 4 (4) days delay in treatment from onset.
Prednisolone (oral, 70mg/day for 3 days, 40mg for 1 day, 30mg for 3 days) versus dexamethasone (oral, 300mg for 3 days followed by placebo 4 days)
12 month follow-up.
n=91
Prednisolone group: 49 (16), Dexamethasone group 46 (15)
PTA: scores, recovery
Speech discrimination of 100%
Second-line treatment
Lee 2011
59
South Korea
Onset to initial treatment in the steroid group: 5.1
Previous treatment: 60mg/day oral steroids 5 days, tapering 5 days
Dexamethasone (IT, 5mg/ml, 0.3-0.4ml instilled, twice a
n=46
IT steroid group 44 (16.2) years, Control group 45.3 (13.5) years
PTA: improvement, scores
Initial failure definition: recovering ≤10 dB of affected ear

Hearing loss Sudden sensorineural hearing loss (SSNHL)
© NICE 2017. All rights reserved. Subject to Notice of rights. 137
Study
Mean time from onset of HL to start of treatment Intervention and comparison Population Outcomes Comments
(5.6) and placebo group: 5.6 (5.3) days.
Salvage therapy started within 2 days of initial steroid therapy
week for 2 weeks) versus no treatment.
2 week intervention followed by 4 weeks follow-up.
PTA
Li 201160
China
Onset to treatment ≤14 days. Initial treatment elicited no response after 2 weeks.
Previous treatment: IV steroids 1mg/kg for 5 days, division into 4 doses and tapered over the course of 9 days
Prednisolone (IT, 1ml of 40mg/ml methylprednisolone in 1ml sodium bicarbonate, once every 3 days for 15 days) versus prednisolone (ear drops, 1ml of methylprednisolone, one every 3 days over 15 days) versus no treatment
15 days intervention, 2 month follow-up
n=65
IT methylprednisolone 53.5 years (18-72), ear drop methylprednisolone 50 years (21-69), blank control group 55.1 years (22-73)
PTA: improvement, scores
Adverse events
Initial failure definition:
Pure tone average of 4 frequencies (0.5, 1, 2 and 4 kHz) >30 dB for affected ear or >10 dB from affected ear
Ear drops group not reported here as not a relevant treatment for this review
Plontke 2009
83
Germany
12–21 days from hearing loss to randomisation (during which time standard systemic therapy was received)
Previous treatment High dose prednisolone (IV, 250mg/day) for 3 days followed by a dose reduction of 50% every 2 days together with systemic rheological medication (pentoxifylline, 3 x 400mg/day) and an antioxidant drug (alphasliponic acid, 1 x 600mg/day).
Dexamethasone (IT, 4mg/ml, daily dose 0.58mg, rate 6µL/h) versus placebo (IT, sodium chloride 0.9%, rate 6µL/h) delivered via a round window catheter.
Intervention time: 2 weeks
n=23
IT dexamethasone 53 (21) years, Placebo 56 (15 years)
PTA: scores, improvement, recovery
Speech discrimination (max. change)
Initial failure definition: hearing threshold in the contralateral ear of ≥20 dB worse in affected ear than contralateral ear in at least 3 frequencies between 0.5 and 4 kHz
Wu 2011
114
Initial systemic
Previous treatment: IV steroid 5 days, tapered with oral
n=60
IT steroid: 49.1
Adverse events
Initial failure definition:

Hearing loss Sudden sensorineural hearing loss (SSNHL)
© NICE 2017. All rights reserved. Subject to Notice of rights. 138
Study
Mean time from onset of HL to start of treatment Intervention and comparison Population Outcomes Comments
Taiwan
1 week post systemic treatment
therapy started within 7 days of hearing loss onset. Steroid group: 4.4 (1.6) and placebo group: 4.7 (1.9) days.
Intervention began approximately 1 week after initial treatment ended
prednisolone for 5 days.
Dexamethasone (IT, 0.5ml of 8mg/2ml every 4 days for 2 weeks) versus placebo (0.5mls normal saline every 4 days for 2 weeks)
2 week intervention plus 1 month follow-up (post treatment), total 6 week study
(14.2), IT saline 47.4 (15.7)
PTA: scores, improvement
PTA difference between ears of >20 dB
Xenellis 2006
115
Greece
Mean delay to initial IV treatment - steroid group : 11.8 (no SD) and placebo group: 8.1 (no SD) days.
Interventions started after 10 days of IV treatment failed
Previous treatment: prednisolone IV, 1mg/kg per day for 10 days divided in 3 doses, gradually tapered for 5 days and acyclovir 4mg/day for 5 days divided in 5 doses, buflomedil hydrochloride 300mg, divided in 3 doses for 10 days and ranitidine during steroid treatment
Methylprednisolone (IT, 1.5-2mls, 80mg/2ml, done 4 times in 15 days) versus no treatment
Intervention 15 days, follow-up 1.5 months (total time 2 months)
n=37
Intratympanic treatment group 50.9 years, control group 50.3 years (no SD reported)
Adverse events
PTA: scores, improvement
Initial failure definition: pure tone 4 frequency average (0.5, 1, 2 and 4 kHz) worse than 30 dB or ≥10 dB worse than the contralateral ear
PTA; pure tone average, IT; intra-tympanic, kg; kilograms, SD; standard deviation, mg; milligrams Transtympanic = 1 intratympanic2

Sud
den
senso
rineu
ral hearin
g loss (SSN
HL)
Hearin
g loss
© N
ICE 2
01
7. A
ll rights reserved
. Sub
ject to N
otice o
f rights.
13
9
11.2.1.1 First-line treatment for idiopathic sudden sensorineural hearing loss 1
Table 56: Clinical evidence summary: Steroid (oral/IT) versus placebo [Prednisolone versus placebo] 2
Outcomes
No of Participants (studies) Follow-up
Quality of the evidence (GRADE)
Relative effect (95% CI)
Anticipated absolute effects
Risk with First-line treatment: placebo
Risk difference with First-line treatment: steroid (95% CI)
Change in PTA - Day 8 93 (1 study) 8 days
LOWa
due to risk of bias The mean change in PTA in the
control group was
26.4 dB
The mean change in PTA in the intervention group was 0.9 lower (11.73 lower to 9.93 higher)
Change in PTA - Day 90 93 (1 study) 90 days
LOWa
due to risk of bias The mean change in PTA in the
control group was
35.1 dB
The mean change in PTA in the intervention group was 3.9 higher (8.57 lower to 16.37 higher)
Recovery - Day 8 (oral)b 103
(1 study) 8 days
VERY LOWa,c
due to risk of bias, imprecision
RR 1.25 (0.56 to 2.75)
173 per 1000 43 more per 1000 (from 76 fewer to 303 more)
Recovery – 1 month (IT) 50 (1 study) 1 year
MODERATE,
due to risk of bias RR 3.8 (1.68 to 8.58)
200 per 1000 560 more per 1000 (from 136 more to 1000 more)
Recovery - Day 90 (oral)
b
103 (1 study) 90 days
VERY LOWa,c
due to risk of bias, imprecision
RR 1.02 (0.6 to 1.73)
346 per 1000 7 more per 1000 (from 138 fewer to 253 more)
Adverse eventsd 103
(1 study) 90 days VERY LOW
a,c
due to risk of bias, imprecision
RR 1.39 (0.71 to 2.73)
212 per 1000 83 more per 1000 (from 61 fewer to 366 more)
a Downgraded by 1 increment if the majority of the evidence was at high risk of bias, and downgraded by 2 increments if the majority of the evidence was at very high risk of bias.

Sud
den
senso
rineu
ral hearin
g loss (SSN
HL)
Hearin
g loss
© N
ICE 2
01
7. A
ll rights reserved
. Sub
ject to N
otice o
f rights.
14
0
Outcomes
No of Participants (studies) Follow-up
Quality of the evidence (GRADE)
Relative effect (95% CI)
Anticipated absolute effects
Risk with First-line treatment: placebo
Risk difference with First-line treatment: steroid (95% CI)
b The recovery data are based on the same dataset as the change in PTA, but presented as a dichotomous outcome
c Downgraded by 1 increment if the confidence interval crossed one MID or by 2 increments if the confidence interval crossed both MIDs.
d Gastrointestinal complaints were the most common adverse event reported. There were no severe adverse events.
1
2
Table 57: Clinical evidence summary: Steroid (oral/IT) versus steroid (oral) [Dexamethasone versus Prednisolone] 3
Outcomes
No of Participants (studies) Follow-up
Quality of the evidence (GRADE)
Relative effect (95% CI)
Anticipated absolute effects
Risk with Prednisolone Risk difference with Dexamethasone (95% CI)
PTA Final score 106 (2 studies)
12 months and 7 weeks (4 weeks after last injection)
LOWa,b
due to risk of bias, imprecision
The mean PTA final score in the control groups ranged from
59-42 dB
The mean PTA final score in the intervention groups was 6.64 lower (17.58 lower to 4.3 higher)
Recovery - symmetrical hearing, interaural hearing difference of <20
dB HL
71 (1 study) 12 months
VERY LOWa,b
due to risk of bias, imprecision
RR 1.13 (0.75 to 1.68)
543 per 1000 71 more per 1000 (from 136 fewer to 369 more)
Recovery - Recovery of hearing to within 5% points of the contralateral SDS or within 5 dB of the contralateral PTA
35 (1 study) 7 weeks (4 weeks after last injection)
VERY LOWa,b
due to risk of bias, imprecision
RR 1.76 (0.5 to 6.28)
167 per 1000 127 more per 1000 (from 84 fewer to 882 more)

Sud
den
senso
rineu
ral hearin
g loss (SSN
HL)
Hearin
g loss
© N
ICE 2
01
7. A
ll rights reserved
. Sub
ject to N
otice o
f rights.
14
1
Outcomes
No of Participants (studies) Follow-up
Quality of the evidence (GRADE)
Relative effect (95% CI)
Anticipated absolute effects
Risk with Prednisolone Risk difference with Dexamethasone (95% CI)
Speech discrimination of 100% (recognised all words at their optimum sound level)
71 (1 study) 12 months
VERY LOWa,b
due to risk of bias, imprecision
RR 1.12 (0.77 to 1.63)
571 per 1000 69 more per 1000 (from 131 fewer to 360 more)
Mean speech discrimination (% words successfully discriminated)
35 (1 study) 7 weeks (4 weeks after last injection)
VERY LOWa,b
due to risk of bias, imprecision
The mean speech discrimination in the control groups was
54%
The mean speech discrimination (% words successfully discriminated) in the intervention groups was 6 higher (20.88 lower to 32.88 higher)
a Downgraded by 1 increment if the majority of the evidence was at high risk of bias, and downgraded by 2 increments if the majority of the evidence was at very high risk of bias. b Downgraded by 1 increment if the confidence interval crossed one MID or by 2 increments if the confidence interval crossed both MIDs.
1
2
Table 58: Clinical evidence summary: steroid (oral) plus steroid (IT) versus steroid (oral/IT) [prednisolone plus dexamethasone versus prednisolone or 3 dexamethasone plus placebo] 4
Outcomes
No of Participants (studies) Follow-up
Quality of the evidence (GRADE)
Relative effect (95% CI)
Anticipated absolute effects
Risk with Single steroid (oral/IT) Risk difference with Dual steroids (oral plus IT) (95% CI)
PTA Final score – oral plus IT versus oral
34 (1 study)
7 weeks (4 weeks after last injection)
LOWa,b
due to risk of bias, imprecision
The mean PTA final score in the control groups was
59 dB
The mean PTA final score - oral versus oral plus IT in the intervention groups was 24 lower (42.39 to 5.61 lower)
PTA Final score - oral plus 33 LOWa,b
The mean PTA The mean PTA final score - IT versus oral plus IT in the

Sud
den
senso
rineu
ral hearin
g loss (SSN
HL)
Hearin
g loss
© N
ICE 2
01
7. A
ll rights reserved
. Sub
ject to N
otice o
f rights.
14
2
Outcomes
No of Participants (studies) Follow-up
Quality of the evidence (GRADE)
Relative effect (95% CI)
Anticipated absolute effects
Risk with Single steroid (oral/IT) Risk difference with Dual steroids (oral plus IT) (95% CI)
IT versus IT (1 study) 7 weeks (4 weeks after last injection)
due to risk of bias, imprecision
final score in the control groups was
59 dB
intervention groups was 16 lower (31.72 to 0.28 lower)
Recoveryc 171
(2 studies) 7-12 weeks
VERY LOWa,b,c,d
due to risk of bias, inconsistency, imprecision
RR 1.37 (0.87 to 2.15)
248 per 1000 92 more per 1000 (from 32 fewer to 285 more)
Mean speech discrimination (% words successfully discriminated) - oral plus IT versus oral
34 (1 study) 7 weeks (4 weeks after last injection)
LOWa,b
due to risk of bias, imprecision
The mean speech discrimination score in the control groups was
54%
The mean speech discrimination (% words successfully discriminated) - oral versus oral plus IT in the intervention groups was 31 higher (7.76 to 54.24 higher)
Mean speech discrimination (% words successfully discriminated) - oral plus IT versus IT
33 (1 study) 7 weeks (4 weeks after last injection)
LOWa,b
due to risk of bias, imprecision
The mean speech discrimination score in the control groups was
54%
The mean speech discrimination (% words successfully discriminated) - IT versus oral plus IT in the intervention groups was 25 higher (4.11 to 45.89 higher)
a Downgraded by 1 increment if the majority of the evidence was at high risk of bias, and downgraded by 2 increments if the majority of the evidence was at very high risk of bias. b Downgraded by 1 increment if the confidence interval crossed one MID or by 2 increments if the confidence interval crossed both MIDs.
c The recovery data are based on the same dataset as the final PTA, but presented as a dichotomous outcome d Downgraded by 1 or 2 increments because of heterogeneity unexplained by subgroup analysis.
1
2

Sud
den
senso
rineu
ral hearin
g loss (SSN
HL)
Hearin
g loss
© N
ICE 2
01
7. A
ll rights reserved
. Sub
ject to N
otice o
f rights.
14
3
Table 59: Clinical evidence summary: Steroid (IV or oral) plus antiviral (IV or oral) versus steroid (IV or oral) [prednisolone or hydrocortisone plus 1 acyclovir or valacyclovir versus prednisolone or hydrocortisone] 2
Outcomes
No of Participants (studies) Follow-up
Quality of the evidence (GRADE)
Relative effect (95% CI)
Anticipated absolute effects
Risk with Steroid Risk difference with Steroid plus antiviral (95% CI)
PTA Final score 68 (1 study) 6 weeks
VERY LOWa,b
due to risk of bias, imprecision
The mean PTA final score in the control groups was
38 dB
The mean PTA final score in the intervention groups was 6.4 dB higher (9 lower to 21.8 higher)
Recovery - within 10 dB of non-affected ear
c
68 (1 study) 6 weeks
VERY LOWa,b
due to risk of bias, imprecision
RR 0.8 (0.46 to 1.38)
483 per 1000 97 fewer per 1000 (from 261 fewer to 184 more)
Improvement 60 (1 study) 6 weeks
VERY LOWa,b
due to risk of bias, imprecision
RR 1.02 (0.79 to 1.34)
774 per 1000 15 more per 1000 (from 163 fewer to 263 more)
Mean speech discrimination (% words successfully discriminated)
68 (1 study) 6 weeks
VERY LOWa,b
due to risk of bias, imprecision
The mean speech discrimination- final score in the control groups was
59.4%
The mean speech discrimination (% words successfully discriminated) in the intervention groups was 4.6% higher (15.51 lower to 24.71 higher)
Adverse events 43 (1 study) 7 days
VERY LOWa,b
due to risk of bias, imprecision
RR 0.35 (0.08 to 1.54)
273 per 1000 177 fewer per 1000 (from 251 fewer to 147 more)
a Downgraded by 1 increment if the majority of the evidence was at high risk of bias, and downgraded by 2 increments if the majority of the evidence was at very high risk of bias. b Downgraded by 1 increment if the confidence interval crossed one MID or by 2 increments if the confidence interval crossed both MIDs.
c The recovery data are based on the same dataset as the final PTA, but presented as a dichotomous outcome
3
4

Sud
den
senso
rineu
ral hearin
g loss (SSN
HL)
Hearin
g loss
© N
ICE 2
01
7. A
ll rights reserved
. Sub
ject to N
otice o
f rights.
14
4
11.2.1.2 Second-line treatment for idiopathic sudden sensorineural hearing loss 1
Table 60: Clinical evidence summary: Steroid (IT) versus placebo (IT) /no treatment [Dexamethasone/prednisolone versus placebo/no treatment] 2
Outcomes
No of Participants (studies) Follow-up
Quality of the evidence (GRADE)
Relative effect (95% CI)
Anticipated absolute effects
Risk with Second-line treatment: placebo /no treatment Risk difference with Second-line treatment: steroid (95% CI)
PTA Final score 148 (4 studies) 8 weeks
VERY LOWa,b
due to risk of bias, imprecision
The mean PTA final score in the control groups ranged from 59.9 to 90.5
The mean PTA final score in the intervention groups was 11.44 lower (19.47 to 3.41 lower)
Recoveryc- Successful
treatment according to Ho et al, complete and marked recovery: 6 PTA≤25 dB and 6PTA improvement >30 dB
20 (1 study) 2 weeks
VERY LOWa,b
due to risk of bias, imprecision
OR 8.26 (0.48 to 142.43)
0 per 1000 200 more per 1000
(from 80 fewer to 480 more)
Improvement 55 (1 study) 6 weeks
HIGH RR 4.15 (1.31 to 13.09)
107 per 1000 337 more per 1000 (from 33 more to 1000 more)
Speech discrimination (change in maximum % speech discrimination for monosyllables)
21 (1 study) 2 weeks
LOWa,b
due to risk of bias, imprecision
The mean speech discrimination (max change) in the control groups was 4.5
The mean speech discrimination (change in maximum % speech discrimination for monosyllables) in the intervention groups was 19.9 higher (0.41 to 39.39 higher)
Adverse events: perforation of tympanic membrane
55 (1 study) 6 weeks
LOWb
due to imprecision
POR 7.67 (0.15 to 386.69)
0 per 1000 40 more per 1000 (from 60 fewer to 130 more)

Sud
den
senso
rineu
ral hearin
g loss (SSN
HL)
Hearin
g loss
© N
ICE 2
01
7. A
ll rights reserved
. Sub
ject to N
otice o
f rights.
14
5
Outcomes
No of Participants (studies) Follow-up
Quality of the evidence (GRADE)
Relative effect (95% CI)
Anticipated absolute effects
Risk with Second-line treatment: placebo /no treatment Risk difference with Second-line treatment: steroid (95% CI)
1 Downgraded by 1 increment if the majority of the evidence was at high risk of bias, and downgraded by 2 increments if the majority of the evidence was at very high risk of bias. 2 Downgraded by 1 increment if the confidence interval crossed one MID or by 2 increments if the confidence interval crossed both MIDs.
3 The recovery data are based on the same dataset as the final PTA from this study, but presented as a dichotomous outcome
1
2
3

Hearing loss Sudden sensorineural hearing loss (SSNHL)
© NICE 2017. All rights reserved. Subject to Notice of rights. 146
11.2.2 Economic evidence 1
11.2.2.1 Published literature 2
No relevant health economic studies were identified. 3
See also the health economic study selection flow chart in appendix F. 4
11.2.2.2 Unit costs 5
See appendix P. 6
11.2.3 Evidence statements 7
Clinical 8
First line 9
Steroid (oral/IT) versus placebo [Prednisolone versus placebo] 10
There was a clinically important benefit of prednisolone for recovery at 1 month (moderate 11 quality evidence, 1 study). 12
There was no clinically important difference in change in PTA at day 8 and day 90 (low quality 13 evidence, 1 study), for recovery at day 8 and day 90 and for adverse events (very low quality 14 evidence, 1 study). 15
Steroid (oral/IT) versus steroid (oral) [Dexamethasone versus Prednisolone] 16
There was a clinically important benefit of dexamethasone for recovery of hearing to within 5% 17 points of the contralateral SDS or within 5 dB of the contralateral PTA (very low quality evidence, 1 18 study). 19
There was no clinically important difference in PTA final score (low quality evidence, 2 studies) 20 and in symmetrical hearing recovery (interaural hearing difference of <20 dB HL) and speech 21 discrimination of 100% (very low quality evidence, 1 study) and in mean speech discrimination 22 (very low quality evidence, 1 study). 23
Steroid (oral) plus steroid (IT) versus steroid (oral/IT) [prednisolone plus dexamethasone versus 24 prednisolone or dexamethasone plus placebo] 25
There was a clinically important benefit of dual steroids (oral + IT vs oral and vs IT) for PTA final 26 score and mean speech discrimination (low quality evidence, 1 study). 27
There was no clinically important difference in recovery (very low quality evidence, 2 studies). 28
Steroid (IV or oral) plus antiviral (IV or oral) versus steroid (IV or oral) [prednisolone or 29 hydrocortisone plus acyclovir or valacyclovir versus prednisolone or hydrocortisone] 30
There was a clinically important harm of prednisolone plus placebo (very low quality evidence, 1 31 study). 32
There was no clinically important difference in PTA final score, recovery within 10 dB of non-33 affected, mean speech discrimination (very low quality evidence, 1 study) and improvement (very 34 low quality evidence, 1 study). 35
Second line 36

Hearing loss Sudden sensorineural hearing loss (SSNHL)
© NICE 2017. All rights reserved. Subject to Notice of rights. 147
Steroid (IT) versus placebo (IT) /no treatment [Dexamethasone/prednisolone versus placebo/no 1 treatment] 2
There was a clinically important benefit of steroids compared to placebo or no treatment for PTA 3 final score (very low quality evidence, 4 studies), recovery and speech discrimination (low to very 4 low quality evidence, 1 study) and for improvement (high quality evidence, 1 study). 5
There was no clinically important difference in adverse events (perforation of tympanic 6 membrane; low quality evidence, 1 study). 7
There were no data on amantadine, famciclovir and ganciclovir. 8
Economic 9
No relevant economic evaluations were identified. 10
11.2.4 Recommendations and link to evidence 11
Recommendations 22. Consider a steroid to treat idiopathic sudden sensorineural hearing loss in adults.
Relative values of different outcomes
The following critical outcomes were included in this review: pure tone average, speech discrimination or recognition, health-related quality of life and hearing-specific health-related quality of life.
Adverse events were included as an important outcome.
Quality of the clinical evidence
The studies reported pure tone average (PTA) by change or final scores, author-defined improvement and recovery. We analysed the change or final scores as well as the author-defined recovery data as these were thought to be the most important outcomes for decision-making. If neither of these preferred definitions was presented by a given study, author-defined improvement was reported.
The majority of the evidence was of low or very low quality and based on few studies with small sample sizes.
There were no data on amantadine, famciclovir and ganciclovir.
There were a range of limitations of the included evidence, most notably:
A lack of detail regarding how the diagnosis of ‘idiopathic’ SSNHL was determined. Some studies identified patients with causes of the SSNHL after randomisation and consequently excluded them from the study.
Many studies did not describe how the patients were randomised and how allocation was concealed.
Other reasons for downgrading related to blinding, attrition bias, and not specifying outcomes in the methods (post-hoc analysis).
Outcomes were also downgraded due to imprecision; many studies had relatively small numbers in each treatment group.
One study that provided the majority of the data about dual steroid (oral plus IT) treatments had significant baseline differences in time-to-treatment, speech discrimination score and PTA between the 3 treatment groups making the evidence difficult to interpret.
Some studies did not consider high frequency losses (above 2 kHz) within their analysis.
Some studies either included children but it was unclear how many, or gave no age inclusion criteria or age range to clarify whether any children had been included. However, given the mean ages and standard deviations it seems unlikely that any children were included in the later cases.
Trade-off between clinical benefits and
The guideline committee noted evidence for a lack of efficacy of oral steroids over placebo in first-line treatment of SSNHL, with associated adverse events. However,

Hearing loss Sudden sensorineural hearing loss (SSNHL)
© NICE 2017. All rights reserved. Subject to Notice of rights. 148
harms the adverse events were not clearly specified so it was not possible to determine the clinical importance of these. Oral steroids are currently the mainstay of treatment for this condition in clinical practice, but no evidence to support this practice was found. However, there was also insufficient evidence to change current practice. Conversely, 1 study gave moderate quality evidence that intratympanic steroids are clinically beneficial for recovery, but no other outcomes were available.
When comparing dexamethasone and prednisolone for the first-line treatment of SSNHL, low and very low quality evidence showed no clinical difference for PTA final score, recovery or speech discrimination when both were given orally. However, IT dexamethasone was clinically beneficial compared with oral prednisolone for recovery and change in speech discrimination score (taking into account baseline differences).
The committee noted that although there was some evidence that dual steroids (oral plus IT) were better than either alone, the majority of these data were from a study at very high risk of bias owing to baseline differences. Therefore, the committee did not have high confidence in these findings. However, they provided further evidence to support the emerging theme that IT steroids may be the most effective course of treatment in this patient group.
When comparing treatment with steroid plus antiviral versus steroid alone there was no evidence of a clinical benefit of adding in the antiviral for any recorded positive outcome. There were fewer adverse events in the group given an antiviral in addition to the steroid; however, from looking at the specific adverse events reported, the committee did not believe there was a clinical explanation and it is likely to be a chance finding owing to the small sample size.
There were 5 studies reporting the comparison of IT steroids versus placebo or no treatment for the second-line treatment of patients initially refractory to IV or oral steroid treatment. These all showed a clinical benefit of IT steroid in this group for PTA final score, recovery, improvement (1 study; high quality) and speech discrimination. The committee noted that it was interesting to see that second-line treatment with IT steroids is effective at a time in the natural course of the condition when spontaneous recovery would be less likely. Some studies reported individual cases of tympanic membrane perforation, but all either resolved spontaneously or were successfully repaired.
As usual practice is to prescribe oral steroids, recommending IT would be a significant change in practice and would have an impact on service delivery due to the requirement of hospital-based treatment follow-up appointments and staff with expertise in this treatment.
The committee discussed the possibility of a recommendation for IT steroids for second-line treatment, where there is evidence of benefit. However, it is not possible to determine whether IT steroids have a benefit by themselves or in combination with previous oral steroid treatment. Additionally, without sufficient evidence to be confident in the best route of administration for first-line treatment the committee could not specify the route of administration for second-line treatment. Therefore, it was unable to either fully support or change current treatment and the committee agreed to recommend steroid treatment without specifying the route of administration (see recommendation in following table).
Trade-off between net clinical effects and costs
No health economic evidence was identified for this question.
The committee considered the clinical evidence and unit costs for the alternative treatment options. The committee noted that the costs of the most likely steroids were low, being between £3 and £13 for a course lasting up to 2 weeks. Therefore the most important resource use and cost would be the cost of administering these drugs. If oral drugs are prescribed these can be taken at home and the patient may require only 2 outpatient appointments for investigation and review. Giving drugs intratympanically would give rise to greater costs as each time drugs are administered the patient would need to come into hospital for an outpatient
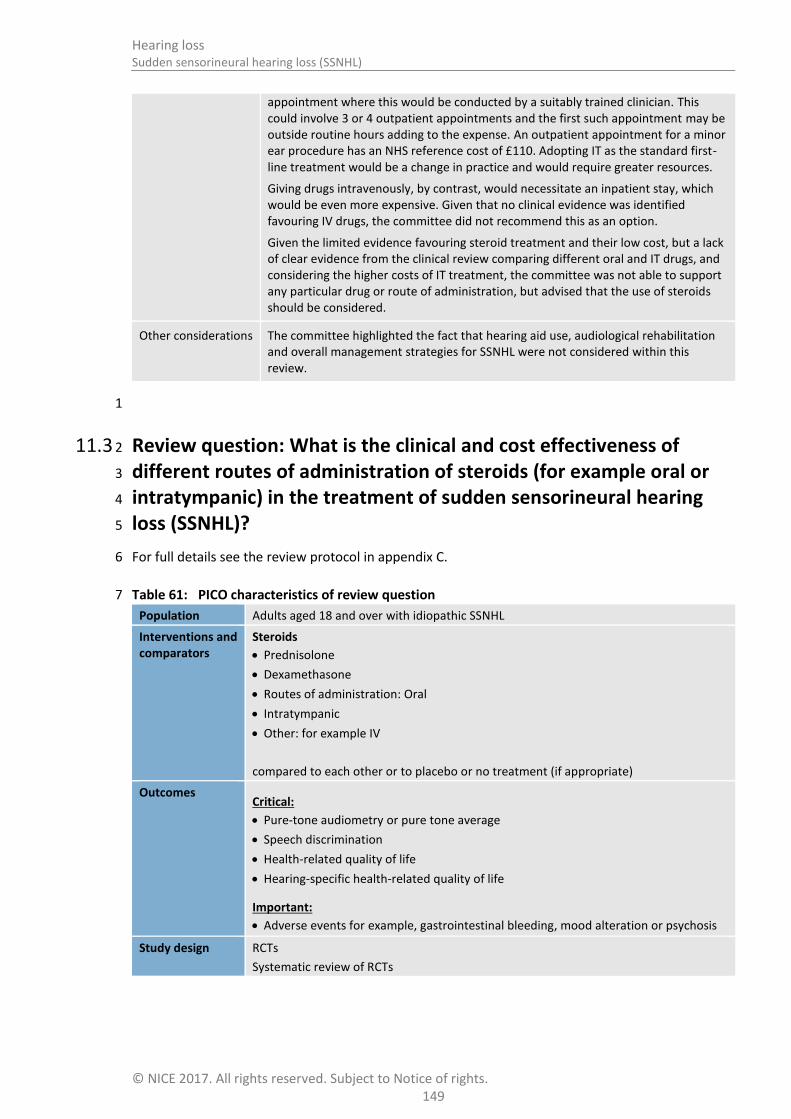
Hearing loss Sudden sensorineural hearing loss (SSNHL)
© NICE 2017. All rights reserved. Subject to Notice of rights. 149
appointment where this would be conducted by a suitably trained clinician. This could involve 3 or 4 outpatient appointments and the first such appointment may be outside routine hours adding to the expense. An outpatient appointment for a minor ear procedure has an NHS reference cost of £110. Adopting IT as the standard first-line treatment would be a change in practice and would require greater resources.
Giving drugs intravenously, by contrast, would necessitate an inpatient stay, which would be even more expensive. Given that no clinical evidence was identified favouring IV drugs, the committee did not recommend this as an option.
Given the limited evidence favouring steroid treatment and their low cost, but a lack of clear evidence from the clinical review comparing different oral and IT drugs, and considering the higher costs of IT treatment, the committee was not able to support any particular drug or route of administration, but advised that the use of steroids should be considered.
Other considerations The committee highlighted the fact that hearing aid use, audiological rehabilitation and overall management strategies for SSNHL were not considered within this review.
1
Review question: What is the clinical and cost effectiveness of 11.3 2
different routes of administration of steroids (for example oral or 3
intratympanic) in the treatment of sudden sensorineural hearing 4
loss (SSNHL)? 5
For full details see the review protocol in appendix C. 6
Table 61: PICO characteristics of review question 7
Population Adults aged 18 and over with idiopathic SSNHL
Interventions and comparators
Steroids
Prednisolone
Dexamethasone
Routes of administration: Oral
Intratympanic
Other: for example IV
compared to each other or to placebo or no treatment (if appropriate)
Outcomes Critical:
Pure-tone audiometry or pure tone average
Speech discrimination
Health-related quality of life
Hearing-specific health-related quality of life
Important:
Adverse events for example, gastrointestinal bleeding, mood alteration or psychosis
Study design RCTs
Systematic review of RCTs

Hearing loss Sudden sensorineural hearing loss (SSNHL)
© NICE 2017. All rights reserved. Subject to Notice of rights. 150
11.3.1 Clinical evidence 1
For the sub-question addressing the route of steroid administration, 11 studies, reported in 13 2 papers were included in the review.4-6 ,11 ,31 ,33 ,43 ,44 ,55 ,61 ,62 ,86 ,99 These are summarised in Table 63 3 below. Two of these studies were also included in the primary review.4 ,11 Evidence from these 4 studies is summarised in the clinical evidence summary tables below (Table 63). 5
See also the study selection flow chart in appendix E, forest plots in appendix K, study evidence 6 tables in appendix H, GRADE tables in appendix J and excluded studies list in appendix L. 7
Of the included studies, all but 199 had a population exclusively with unilateral hearing loss; in this 8 study the majority had unilateral losses. The methods for excluding underlying causes of hearing loss 9 vary; 2 of the studies11 ,86 explicitly stated that patients with autoimmune disease were actively 10 excluded. 11
The interventions that were included in the studies were prednisolone, methylprednisolone, 12 dexamethasone, and acyclovir. The treatments were given intravenously (IV), orally or 13 intratympanically (IT). 14
The studies reported pure tone averages (PTA) by change or final scores, author-defined 15 improvement and recovery. In this report, PTA data are presented as the change or final scores as 16 well as the author-defined recovery data as these were thought to be the most important outcomes 17 for decision-making. Where these continuous and dichotomous outcomes are derived from the same 18 dataset this has been highlighted to avoid double counting the data. If neither of these preferred 19 definitions are presented by a given study, author-defined improvement will be reported. 20
Speech discrimination or word recognition and adverse events were also recorded in some studies. 21 None of the studies reported on quality of life. 22
The definitions used to describe recovery varied between the studies. The definitions included as 23 outcomes within this report were those that were most representative of clinical recovery that is 24 important to the patient (Table 54). 25
Table 62: Study definitions of improvement and recovery 26
Study Recovery
Ahn 20084 Final hearing better than 25 dB based on a four-tone average of thresholds
at 0.5, 1, 2, and 4 kHz at 3 months
Battaglia 200811
Recovery of hearing to within 5 percentage points of the contralateral speech discrimination score (SDS) or within 5 dB of the contralateral PTA. PTA measured by taking the 3-frequency average of the threshold value at 0.5, 1, and 2 kHz at 7 weeks.
Eftekharian 201633
Complete recovery: return to within 10 dB HL of the unaffected ear and recovery of word recognition scores (WRS) to within 5%-10% of the unaffected ear at 3 months after treatment
Gundogan 201343
Complete recovery: final hearing threshold better than 25 dB PTA at 4 weeks
Lim 201362
Complete recovery: return to within 10 dB HL of the unaffected ear and WRS to within 5-10% of unaffected ear. PTA calculated across 4 frequencies: 0.5, 1, 2 and 3 kHz at 21 days
Swachia 201699
Complete recovery or marked improvement: final 4-frequency PTA of ≤25 dB or PTA improvement >30 dB at 60 days
Another factor to consider is the mean time between the onset of hearing loss and start of treatment 27 and whether this would affect the end of study outcomes as this varied between the studies (Table 28 63). 29

Hearing loss Sudden sensorineural hearing loss (SSNHL)
© NICE 2017. All rights reserved. Subject to Notice of rights. 151
1
Table 63: Summary of studies included in the review 2
Study
Mean time from onset of HL to start of treatment
Intervention and comparison Population Outcomes Comments
Ahn 2008
4
South Korea
Intervention group: 6.5 (3.9) and control group: 7.1 (4.1) days
Methylprednisolone (oral, 48 mg per day for 9 days, 5 day tapering) plus dexamethasone (IT, 0.3–0.4 ml of 5 mg/ml on first, third and fifth days), versus methylprednisolone (oral, as above)
3 months follow-up
n=120
Mean age ITD group 48.6 (15.4) years, control group 45.9 (14.7) years.
PTA: complete recovery, slight hearing improvement
Children not explicitly excluded.
Does not state that underlying medical reasons for the sudden hearing loss were ruled out prior to inclusion.
Al-Shehri, 2016
5
Unclear, must have been <2 weeks
Methylprednisolone (IT; four 1-ml doses of 40 mg/ml over 2 weeks with a dose given every 3–4 days) versus prednisolone (oral; 60 mg/day tapering over 14 days)
n=39
Mean age
Experimental group: 49.8±5.9; control group: 49.7±7.3 years
PTA: change score (based on the mean of hearing thresholds at 4 frequencies: 0.5, 1, 2 and 4 kHz)
Adverse events
Arastou, 2013
6
Intervention group: 18.97 (23.6); control group: 15.5 (22.6) days
Dexamethasone (IT; 0.4 ml of 4 mg/ml twice a week for 2 consecutive weeks) plus prednisolone (oral; 1 mg/kg/day for 10 days) plus acyclovir (oral; 2 g/day for 10 days, divided in 4 doses) plus triamterene H (oral; daily) plus omeprazole (oral; daily, during steroid treatment)
versus
Prednisolone (oral; 1 mg/kg/day for 10 days) plus acyclovir (oral; 2 g/day for 10 days, divided in 4 doses) plus triamterene H (oral; daily) plus omeprazole (oral; daily, during steroid treatment)
n=77 Mean age Intervention group: 45.4(14.8); control group: 49.2(14.4) years
PTA: change score (based on the mean of hearing thresholds at 4 frequencies: 0.5, 1, 2 and 4 kHz), improvement
Adverse events
Battaglia 2008
11
USA
IT: 11 (14), oral: 7 (6), oral plus IT: 4 (3) days (had to
Prednisolone (oral) plus dexamethasone (IT) versus Prednisolone (oral) plus placebo (IT)
n=51
Mean age Placebo taper plus IT-Dex 60
PTA: scores, improvement, recovery (based on the mean of
Children not explicitly excluded.
Baseline
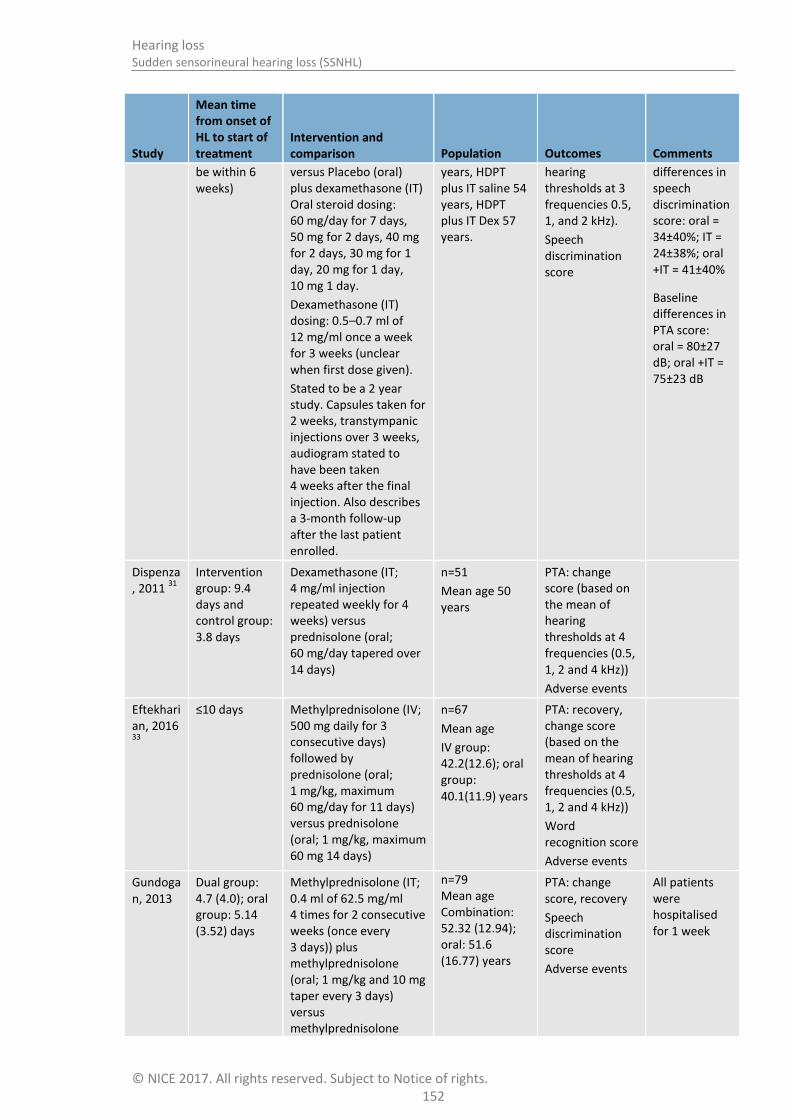
Hearing loss Sudden sensorineural hearing loss (SSNHL)
© NICE 2017. All rights reserved. Subject to Notice of rights. 152
Study
Mean time from onset of HL to start of treatment
Intervention and comparison Population Outcomes Comments
be within 6 weeks)
versus Placebo (oral) plus dexamethasone (IT) Oral steroid dosing: 60 mg/day for 7 days, 50 mg for 2 days, 40 mg for 2 days, 30 mg for 1 day, 20 mg for 1 day, 10 mg 1 day.
Dexamethasone (IT) dosing: 0.5–0.7 ml of 12 mg/ml once a week for 3 weeks (unclear when first dose given).
Stated to be a 2 year study. Capsules taken for 2 weeks, transtympanic injections over 3 weeks, audiogram stated to have been taken 4 weeks after the final injection. Also describes a 3-month follow-up after the last patient enrolled.
years, HDPT plus IT saline 54 years, HDPT plus IT Dex 57 years.
hearing thresholds at 3 frequencies 0.5, 1, and 2 kHz).
Speech discrimination score
differences in speech discrimination score: oral = 34±40%; IT = 24±38%; oral +IT = 41±40%
Baseline differences in PTA score: oral = 80±27 dB; oral +IT = 75±23 dB
Dispenza, 2011
31
Intervention group: 9.4 days and control group: 3.8 days
Dexamethasone (IT; 4 mg/ml injection repeated weekly for 4 weeks) versus prednisolone (oral; 60 mg/day tapered over 14 days)
n=51
Mean age 50 years
PTA: change score (based on the mean of hearing thresholds at 4 frequencies (0.5, 1, 2 and 4 kHz))
Adverse events
Eftekharian, 2016 33
≤10 days Methylprednisolone (IV; 500 mg daily for 3 consecutive days) followed by prednisolone (oral; 1 mg/kg, maximum 60 mg/day for 11 days) versus prednisolone (oral; 1 mg/kg, maximum 60 mg 14 days)
n=67
Mean age
IV group: 42.2(12.6); oral group: 40.1(11.9) years
PTA: recovery, change score (based on the mean of hearing thresholds at 4 frequencies (0.5, 1, 2 and 4 kHz))
Word recognition score
Adverse events
Gundogan, 2013
Dual group: 4.7 (4.0); oral group: 5.14 (3.52) days
Methylprednisolone (IT; 0.4 ml of 62.5 mg/ml 4 times for 2 consecutive weeks (once every 3 days)) plus methylprednisolone (oral; 1 mg/kg and 10 mg taper every 3 days) versus methylprednisolone
n=79 Mean age Combination: 52.32 (12.94); oral: 51.6 (16.77) years
PTA: change score, recovery
Speech discrimination score
Adverse events
All patients were hospitalised for 1 week

Hearing loss Sudden sensorineural hearing loss (SSNHL)
© NICE 2017. All rights reserved. Subject to Notice of rights. 153
Study
Mean time from onset of HL to start of treatment
Intervention and comparison Population Outcomes Comments
(oral; 1 mg/kg and 10 mg taper every 3 days)
Khorsandi Ashtiani, 2012
55
≤10 days Prednisolone (oral; 1 mg/kg every day for 10 days) plus dexamethasone (IT; 2 mg for the first 3 days) versus prednisolone (oral; 1 mg/kg every other day for 10 days; no dose taper reported) plus dexamethasone (IT; 2 mg for the first 3 treatments) versus prednisolone (oral; 1 mg/kg every day for 10 days; no dose taper reported)
n=63 Mean age 50 (range: 20-70) years
PTA: change score (frequencies not stated)
Speech discrimination score
Lim, 2013
61
,62
Oral: 5.4 (3.1); IT: 10.1 (8.1), oral plus IT: 9.6 (7.5) days
Dexamethasone (IT; 0.3–0.4 ml of 5 mg/ml twice a week for 2 weeks, for a total of 4 times on days 0, 3, 7 and 10) versus prednisolone (oral: 60 mg/day for 5 days, 40 mg/day for 2 days, 20 mg/day for 2 days, and 10 mg/day for 1 day) versus prednisolone (oral – dosing as above) plus dexamethasone (IT – dosing as above)
n=60 Mean age Oral: 51.3 (14.4); IT: 53.3 (15.3), oral plus IT: 47.8 (14.2)
PTA: change score, recovery (based on the mean of hearing thresholds at 4 frequencies: 0.5, 1, 2 and 3 kHz)
Rauch, 2011; Halpin, 2012
44
,86
Intervention group: 7.0 (6.4-7.6) and control group: 6.7 (6.1-7.4)
Methylprednisolone (IT; 4 doses every 3–4 days; 1 ml of 40 mg/ml) versus prednisolone (oral; 60 mg/day for 14 days, followed by a 5-day taper to 10 mg)
n=250
Mean age: 50 years
PTA: change score (based on the mean of hearing thresholds at 4 frequencies: 0.5, 1, 2 and 4 kHz)
Word recognition score
Adverse events
Pre-enrolment steroid usage of less than 10 days was acceptable as long as audiometric criteria were met on the day of enrolment.
Swachia, 2016
99
<14 days Methylprednisolone (IT; 1 ml of 40 mg/ml solution injected into the middle ear cavity twice a week for 2 consecutive weeks) versus prednisolone (oral; 1 mg/kg body weight per
n=42
Mean age: 44.3 years
PTA: change score, recovery (based on the mean of hearing thresholds at 4 frequencies: 0.5, 1, 2 and 4 kHz)
Adverse events
83% unilateral

Hearing loss Sudden sensorineural hearing loss (SSNHL)
© NICE 2017. All rights reserved. Subject to Notice of rights. 154
Study
Mean time from onset of HL to start of treatment
Intervention and comparison Population Outcomes Comments
day for first 10 days; 0.5 mg/kg per day on days 11–12; 0.25 mg/kg per day on days 13–14)

Sud
den
senso
rineu
ral hearin
g loss (SSN
HL)
Hearin
g loss
© N
ICE 2
01
7. A
ll rights reserved
. Sub
ject to N
otice o
f rights.
15
5
11.3.1.1 First-line treatment for idiopathic sudden sensorineural hearing loss 1
Table 64: Clinical evidence summary: Steroid (IT) versus steroid (oral) [IT prednisolone, methylprednisolone or dexamethasone versus oral 2 prednisolone] 3
Outcomes
No of Participants (studies) Follow-up
Quality of the evidence (GRADE)
Relative effect (95% CI)
Anticipated absolute effects
Risk with Oral steroid Risk difference with IT (95% CI)
Pure Tone Average (PTA) improvement
417 (5 studies) 3 weeks - 6 months
VERY LOWa,b
due to risk of bias, inconsistency
The mean PTA improvement in the control groups ranged from 18.2 to 30.2 dB
The mean PTA improvement in the intervention groups was 1.19 higher (3.41 lower to 5.78 higher)
Recoveryc 82
(2 studies) 17-60 days
VERY LOWa,d
due to risk of bias, imprecision
RR 0.84 (0.37 to 1.91)
241 per 1000 39 fewer per 1000 (from 152 fewer to 219 more)
Word recognition score change from baseline - 2 months
250 (1 study) 2 months
MODERATEa
due to risk of bias The mean word recognition
score improvement at 2 months in the control groups was 34.2%
The mean word recognition score improvement at 2 months in the intervention groups was 0.4 lower (8.8 lower to 8 higher)
Word recognition score change from baseline - 6 months
250 (1 study) 6 months
LOWa
due to risk of bias The mean word recognition
score improvement at 6 months in the control groups was 35.6%
The mean word recognition score improvement at 6 months in the intervention groups was 0.6 lower (9.29 lower to 8.09 higher)
Patients with adverse events
292 (2 studies) 2-6 months
HIGH RR 1.03 (0.94 to 1.12)
876 per 1000 26 more per 1000 (from 53 fewer to 105 more)

Sud
den
senso
rineu
ral hearin
g loss (SSN
HL)
Hearin
g loss
© N
ICE 2
01
7. A
ll rights reserved
. Sub
ject to N
otice o
f rights.
15
6
Outcomes
No of Participants (studies) Follow-up
Quality of the evidence (GRADE)
Relative effect (95% CI)
Anticipated absolute effects
Risk with Oral steroid Risk difference with IT (95% CI)
Treatment-related serious adverse events
250 (1 study) 2 months
VERY LOWa,d
due to risk of bias, imprecision
RR 0.31 (0.01 to 7.61)
8 per 1000 6 fewer per 1000 (from 8 fewer to 53 more)
Adverse events - Mood change
289 (2 studies) 2-6 months
MODERATEa
due to risk of bias RR 0.22 (0.13 to 0.37)
423 per 1000 330 fewer per 1000 (from 266 fewer to 368 fewer)
Adverse events - Blood glucose problem
289 (2 studies) 2-6 months
MODERATEd
due to imprecision RR 0.54 (0.35 to 0.85)
299 per 1000 138 fewer per 1000 (from 45 fewer to 194 fewer)
Adverse events - Sleep change
289 (2 studies) 2-6 months
MODERATEa
due to risk of bias RR 0.19 (0.1 to 0.36)
332 per 1000 269 fewer per 1000 (from 212 fewer to 299 fewer)
Adverse events - Increased appetite
289 (2 studies) 2-6 months
MODERATEa
due to risk of bias RR 0.2 (0.09 to 0.44)
241 per 1000 193 fewer per 1000 (from 135 fewer to 219 fewer)
Adverse events - Earache 289 (2 studies) 2-6 months
MODERATEa
due to risk of bias RR 15.68 (6.22 to 39.49)
17 per 1000 250 more per 1000 (from 89 more to 654 more)
Adverse events - Injection site pain
289 (2 studies) 2-6 months
MODERATEa
due to risk of bias RR 36.8 (4.99 to 271.62)
0 per 1000 250 more per 1000
(from 180 more to 320 more)
Adverse events - Mouth dryness/thirst
289 (2 studies) 2-6 months
MODERATEa
due to risk of bias RR 0.15 (0.06 to 0.35)
249 per 1000 212 fewer per 1000 (from 162 fewer to 234 fewer)
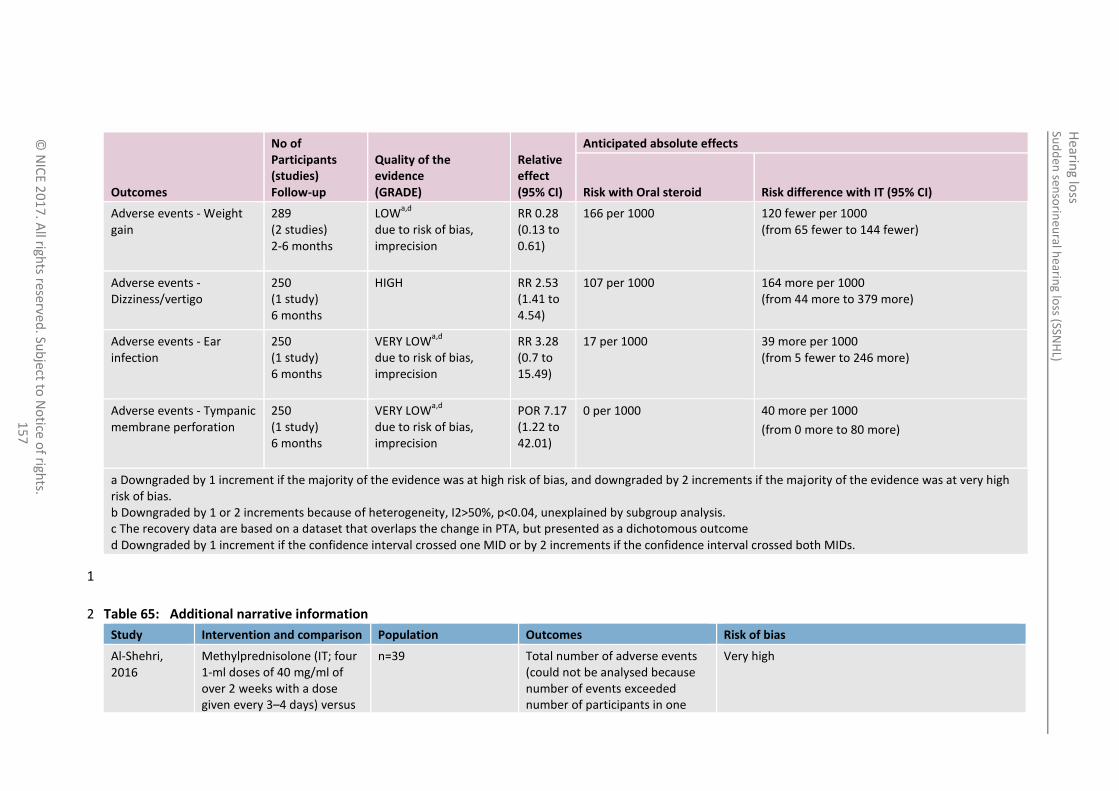
Sud
den
senso
rineu
ral hearin
g loss (SSN
HL)
Hearin
g loss
© N
ICE 2
01
7. A
ll rights reserved
. Sub
ject to N
otice o
f rights.
15
7
Outcomes
No of Participants (studies) Follow-up
Quality of the evidence (GRADE)
Relative effect (95% CI)
Anticipated absolute effects
Risk with Oral steroid Risk difference with IT (95% CI)
Adverse events - Weight gain
289 (2 studies) 2-6 months
LOWa,d
due to risk of bias, imprecision
RR 0.28 (0.13 to 0.61)
166 per 1000 120 fewer per 1000 (from 65 fewer to 144 fewer)
Adverse events - Dizziness/vertigo
250 (1 study) 6 months
HIGH RR 2.53 (1.41 to 4.54)
107 per 1000 164 more per 1000 (from 44 more to 379 more)
Adverse events - Ear infection
250 (1 study) 6 months
VERY LOWa,d
due to risk of bias, imprecision
RR 3.28 (0.7 to 15.49)
17 per 1000 39 more per 1000 (from 5 fewer to 246 more)
Adverse events - Tympanic membrane perforation
250 (1 study) 6 months
VERY LOWa,d
due to risk of bias, imprecision
POR 7.17 (1.22 to 42.01)
0 per 1000 40 more per 1000
(from 0 more to 80 more)
a Downgraded by 1 increment if the majority of the evidence was at high risk of bias, and downgraded by 2 increments if the majority of the evidence was at very high risk of bias. b Downgraded by 1 or 2 increments because of heterogeneity, I2>50%, p<0.04, unexplained by subgroup analysis. c The recovery data are based on a dataset that overlaps the change in PTA, but presented as a dichotomous outcome d Downgraded by 1 increment if the confidence interval crossed one MID or by 2 increments if the confidence interval crossed both MIDs.
1
Table 65: Additional narrative information 2
Study Intervention and comparison Population Outcomes Risk of bias
Al-Shehri, 2016
Methylprednisolone (IT; four 1-ml doses of 40 mg/ml of over 2 weeks with a dose given every 3–4 days) versus
n=39 Total number of adverse events (could not be analysed because number of events exceeded number of participants in one
Very high

Sud
den
senso
rineu
ral hearin
g loss (SSN
HL)
Hearin
g loss
© N
ICE 2
01
7. A
ll rights reserved
. Sub
ject to N
otice o
f rights.
15
8
Study Intervention and comparison Population Outcomes Risk of bias
prednisolone (oral; 60 mg/day tapering over 14 days)
group).
IT steroid: 13 in 20 participants; oral steroid: 33 events in 20 participants.
Dispenza, 2011
Dexamethasone (IT; 4 mg/ml injection repeated weekly for 4 weeks) versus prednisolone (oral; 60 mg tapered over 14 days)
n=51 No treatment-related complications
Very high
1
Table 66: Clinical evidence summary: Steroid (IV) versus steroid (oral) [IV methylprednisolone followed by oral prednisolone versus oral prednisolone] 2
Outcomes
No of Participants (studies) Follow-up
Quality of the evidence (GRADE)
Relative effect (95% CI)
Anticipated absolute effects
Risk with Oral steroid Risk difference with IV (95% CI)
PTA improvement 60 (1 study) 3 months
VERY LOWa,b
due to risk of bias, imprecision
The mean PTA improvement in the control group was
54.6 dB
The mean PTA improvement in the intervention group was 5.4 higher (12.35 lower to 23.15 higher)
Recovery - Complete recovery: return to within 10 dB HL of the unaffected ear and recovery of WRS to within 5%-10% of the unaffected ear
3
60 (1 study) 3 months
VERY LOWa,b
due to risk of bias, imprecision
RR 1.25 (0.47 to 3.28)
194 per 1000 48 more per 1000 (from 103 fewer to 442 more)
Word recognition score improvement (%)
60 (1 study) 3 months
VERY LOWa,b
due to risk of bias, imprecision
The mean word recognition score in the control group was
63.1%
The mean word recognition score in the intervention group was 4.52 lower (25.69 lower to 16.65 higher)

Sud
den
senso
rineu
ral hearin
g loss (SSN
HL)
Hearin
g loss
© N
ICE 2
01
7. A
ll rights reserved
. Sub
ject to N
otice o
f rights.
15
9
Outcomes
No of Participants (studies) Follow-up
Quality of the evidence (GRADE)
Relative effect (95% CI)
Anticipated absolute effects
Risk with Oral steroid Risk difference with IV (95% CI)
Adverse events or complications 60 (1 study) 3 months
MODERATEa
due to risk of bias Not estimable No events No events
a Downgraded by 1 increment if the majority of the evidence was at high risk of bias, and downgraded by 2 increments if the majority of the evidence was at very high risk of bias. b Downgraded by 1 increment if the confidence interval crossed one MID or by 2 increments if the confidence interval crossed both MIDs. c The recovery data are based on the same dataset as the change in PTA, but presented as a dichotomous outcome
1
Table 67: Clinical evidence summary: Dual steroid (IT plus oral) versus steroid (oral) [IT dexamethasone plus oral prednisolone versus oral 2 prednisolone] 3
Outcomes
No of Participants (studies) Follow-up
Quality of the evidence (GRADE)
Relative effect (95% CI)
Anticipated absolute effects
Risk with Oral steroids Risk difference with Dual (95% CI)
PTA change or final score - Oral every day
177 (4 studies) 10 days - 7 weeks
VERY LOWa,b
due to risk of bias, imprecision
The mean PTA final score in the control group was 59 dB from 1 study; the mean change score ranged from -18.7 to -25.9 dB
The mean PTA change or final score in the intervention groups was 15.39 lower (18.3 to 12.48 lower)
PTA change score - Oral every other day
31 (1 study) 10 days
VERY LOWa,b
due to risk of bias, imprecision
The mean PTA change score in the control group was
-25.9 dB
The mean PTA change score in the intervention groups was 2.45 dB lower (5.00 lower to 0.10 higher)

Sud
den
senso
rineu
ral hearin
g loss (SSN
HL)
Hearin
g loss
© N
ICE 2
01
7. A
ll rights reserved
. Sub
ject to N
otice o
f rights.
16
0
Outcomes
No of Participants (studies) Follow-up
Quality of the evidence (GRADE)
Relative effect (95% CI)
Anticipated absolute effects
Risk with Oral steroids Risk difference with Dual (95% CI)
Complete recoveryc 267
(4 studies) 3-12 weeks
VERY LOWa,b
due to risk of bias, imprecision
RR 1.4 (0.86 to 2.27)
272 per 1000 109 more per 1000 (from 38 fewer to 345 more)
Speech discrimination improvement or final score - Oral every day
137 (3 studies) 10 days - 7 weeks
VERY LOWa,d
due to risk of bias, inconsistency
The mean final speech discrimination score in the control was 54% from one study; the mean change score ranged from 18.3 to 20.1%
The mean speech discrimination score improvement or final score in the intervention groups was 6.50 higher (1.78 to 11.23 higher)
Speech discrimination improvement score - Oral every other day
31 (1 study) 10 days
LOWa
due to risk of bias The mean speech
discrimination change score in the control group was 18.3%
The mean speech discrimination score improvement score in the intervention groups was 7.29 lower (9.08 lower to 5.50 lower)
a Downgraded by 1 increment if the majority of the evidence was at high risk of bias, and downgraded by 2 increments if the majority of the evidence was at very high risk of bias. b Downgraded by 1 increment if the confidence interval crossed one MID or by 2 increments if the confidence interval crossed both MIDs. c The recovery data are based on a dataset that overlaps the change in PTA, but presented as a dichotomous outcome d Significant heterogeneity unexplained by pre-defined subgroups
1
Table 68: Additional narrative information: baseline, final and change scores 2
Outcome measure
Study Mean baseline score (SD)
Mean final score (SD) Mean change score (SD) Comments

Sud
den
senso
rineu
ral hearin
g loss (SSN
HL)
Hearin
g loss
© N
ICE 2
01
7. A
ll rights reserved
. Sub
ject to N
otice o
f rights.
16
1
Outcome measure
Study Mean baseline score (SD)
Mean final score (SD) Mean change score (SD) Comments
PTA score Battaglia, 2008
Dual: 75 (23) dB
Oral: 80 (27) dB
Dual: 35 (21) dB
Oral: 59 (33) dB
Dual: 40 dB
Oral: 21 dB
Baseline differences
Gundogan, 2013
Dual: 80.7 (22.81) dB
Oral: 76.3 (27.18) dB
Not available Dual: 44.05 (21.53) dB
Oral: 25.72 (19.77) dB
Khorsandi Ashtiani, 2012
Dual (with oral every day): 55.00 (8.38) dB
Dual (with oral every other day): 60.33 (9.43) dB
Oral: 60.47 (7.26) dB
Dual (with oral every day): 13.57 (4.37) dB
Dual (with oral every other day): 34.70 (10.45) dB
Oral: 34.58 (13.18) dB
Dual (with oral every day): 41.42 (4.01) dB
Dual (with oral every other day): 28.33 (1.02) dB
Oral: 25.88 (5.09) dB
Lim, 2013 Dual: 56.8 (28.3) dB
Oral: 57.8 (28.5) dB
Dual: 34.9 (25.3) dB
Oral: 39.1 (26.1) dB
Dual: 21.9 (26.2) dB
Oral: 18.7 (19.1) dB
Speech discrimination score
Battaglia, 2008
Dual: 41 (40)%
Oral: 34 (40)%
Dual: 85 (23)%
Oral: 54 (44)%
Dual: 44%
Oral: 20%
Baseline differences
Gundogan, 2013
Dual: 29.7 (20.96) %
Oral: 43.3 (30.71) %
Not available Dual: 41.08 (21.98) %
Oral: 20.06 (22.69) %
Baseline differences
Khorsandi Ashtiani, 2012
Dual (with oral every day): 79.33 (18.77)%
Dual (with oral every other day): 80.64 (10.42)% Oral: 72.76 (8.50)%
Dual (with oral every day): 98.85 (8.86)%
Dual (with oral every other day): 92.72 (9.85)%
Oral: 90.58 (5.23)%
Dual (with oral every day): 19.33 (9.91)%
Dual (with oral every other day): 11.01 (0.98)% Oral: 18.30 (3.50)%
1
Table 69: Additional narrative information: adverse events 2
Study Intervention and comparison Population Outcomes Risk of bias
Battaglia, 2008
Prednisolone (oral) plus dexamethasone (IT) versus prednisolone (oral) plus placebo (IT) versus placebo
n = 56 No long-term complications occurred
High

Sud
den
senso
rineu
ral hearin
g loss (SSN
HL)
Hearin
g loss
© N
ICE 2
01
7. A
ll rights reserved
. Sub
ject to N
otice o
f rights.
16
2
Study Intervention and comparison Population Outcomes Risk of bias
(oral) plus dexamethasone (IT) Oral steroid dosing: 60 mg/day for 7 days, 50 mg for 2 days, 40 mg for 2 days, 30 mg for 1 day, 20 mg for 1 day, 10 mg for 1 day.
Dexamethasone (IT) dosing: 0.5–0.7ml of 12 mg/ml once a week for 3 weeks (unclear when first dose given).
Gundogan, 2013
Methylprednisolone (IT; 4 times for 2 consecutive weeks (once every 3 days)) plus methylprednisolone (oral; 1 mg/kg and 10 mg taper every 3 days) versus methylprednisolone (oral; 1 mg/kg and 10 mg taper every 3 days)
n=79 Total number of adverse events (could not be analysed because number per group not given).
3 cases of vertigo, 5 cases of otalgia after injection, no residual tympanic membrane perforation or otitis media.
Very high
1
Table 70: Clinical evidence summary: Dual steroid (IT plus oral) versus steroid (IT) [IT dexamethasone plus oral prednisolone versus IT dexamethasone] 2
Outcomes
No of Participants (studies) Follow-up
Quality of the evidence (GRADE)
Relative effect (95% CI)
Anticipated absolute effects
Risk with IT steroids Risk difference with Dual (95% CI)
PTA improvement or final score 73 (2 studies) 3-7 weeks
VERY LOWa,b
due to risk of bias, imprecision
The mean PTA improvement score in the control group in 1 study was 12.1% and the mean final score in 1 study was 51 dB
The mean PTA improvement or final score in the intervention groups was 12.35 lower (22.44 to 2.27 lower)
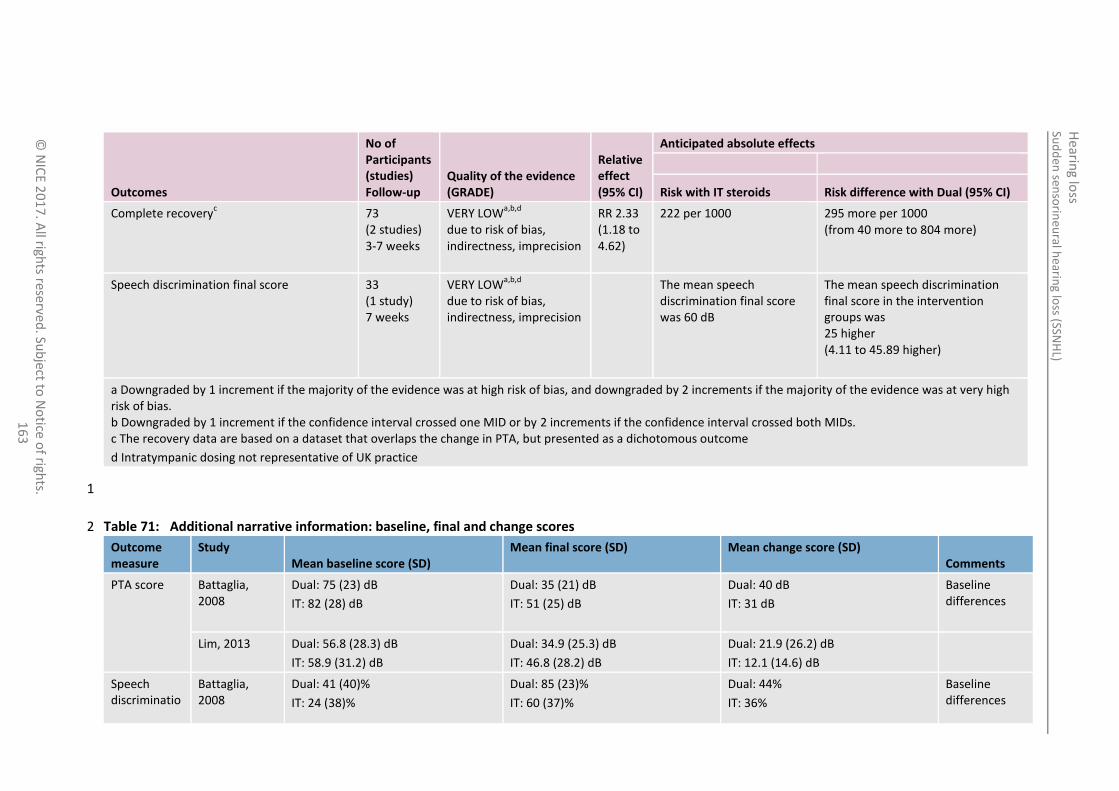
Sud
den
senso
rineu
ral hearin
g loss (SSN
HL)
Hearin
g loss
© N
ICE 2
01
7. A
ll rights reserved
. Sub
ject to N
otice o
f rights.
16
3
Outcomes
No of Participants (studies) Follow-up
Quality of the evidence (GRADE)
Relative effect (95% CI)
Anticipated absolute effects
Risk with IT steroids Risk difference with Dual (95% CI)
Complete recoveryc 73
(2 studies) 3-7 weeks
VERY LOWa,b,d
due to risk of bias, indirectness, imprecision
RR 2.33 (1.18 to 4.62)
222 per 1000 295 more per 1000 (from 40 more to 804 more)
Speech discrimination final score 33 (1 study) 7 weeks
VERY LOWa,b,d
due to risk of bias, indirectness, imprecision
The mean speech discrimination final score was 60 dB
The mean speech discrimination final score in the intervention groups was 25 higher (4.11 to 45.89 higher)
a Downgraded by 1 increment if the majority of the evidence was at high risk of bias, and downgraded by 2 increments if the majority of the evidence was at very high risk of bias. b Downgraded by 1 increment if the confidence interval crossed one MID or by 2 increments if the confidence interval crossed both MIDs. c The recovery data are based on a dataset that overlaps the change in PTA, but presented as a dichotomous outcome
d Intratympanic dosing not representative of UK practice
1
Table 71: Additional narrative information: baseline, final and change scores 2
Outcome measure
Study Mean baseline score (SD)
Mean final score (SD) Mean change score (SD) Comments
PTA score Battaglia, 2008
Dual: 75 (23) dB
IT: 82 (28) dB
Dual: 35 (21) dB
IT: 51 (25) dB
Dual: 40 dB
IT: 31 dB
Baseline differences
Lim, 2013 Dual: 56.8 (28.3) dB
IT: 58.9 (31.2) dB
Dual: 34.9 (25.3) dB
IT: 46.8 (28.2) dB
Dual: 21.9 (26.2) dB
IT: 12.1 (14.6) dB
Speech discriminatio
Battaglia, 2008
Dual: 41 (40)%
IT: 24 (38)%
Dual: 85 (23)%
IT: 60 (37)%
Dual: 44%
IT: 36%
Baseline differences

Sud
den
senso
rineu
ral hearin
g loss (SSN
HL)
Hearin
g loss
© N
ICE 2
01
7. A
ll rights reserved
. Sub
ject to N
otice o
f rights.
16
4
Outcome measure
Study Mean baseline score (SD)
Mean final score (SD) Mean change score (SD) Comments
n score
1
Table 72: Clinical evidence summary: Dual steroid (IT plus oral) plus antiviral versus single steroid (oral) plus antiviral [IT dexamethasone plus oral 2 prednisolone plus oral acyclovir versus oral prednisolone plus oral acyclovir] for poor prognosis cases 3
Outcomes
No of Participants (studies) Follow-up
Quality of the evidence (GRADE)
Relative effect (95% CI)
Anticipated absolute effects
Risk with Single steroid plus antiviral
Risk difference with Dual steroid plus antiviral (95% CI)
Improvement in PTA 77 (1 study) 1 month
LOWa,b
due to risk of bias, imprecision
The mean improvement in PTA in the control group was
13.8 dB
The mean improvement in PTA in the intervention groups was 8.8 higher (0.91 lower to 18.51 higher)
a Downgraded by 1 increment if the majority of the evidence was at high risk of bias, and downgraded by 2 increments if the majority of the evidence was at very high risk of bias. b Downgraded by 1 increment if the confidence interval crossed one MID or by 2 increments if the confidence interval crossed both MIDs.
4
Table 73: Additional narrative information 5
Study Intervention and comparison Population Outcomes Risk of bias
Arastou, 2013 Dexamethasone (IT; 0.4 ml of 4 mg/ml twice a week for 2 consecutive weeks) plus prednisolone (oral; 1 mg/kg/day for 10 days) plus acyclovir (oral; 2 g/day for 10 days, divided in 4 doses) plus triamterene H (oral; daily) plus omeprazole (oral; daily, during steroid treatment)
versus
n=77 Two cases of tympanic membrane perforation and two cases of sarcoidosis.
Very high
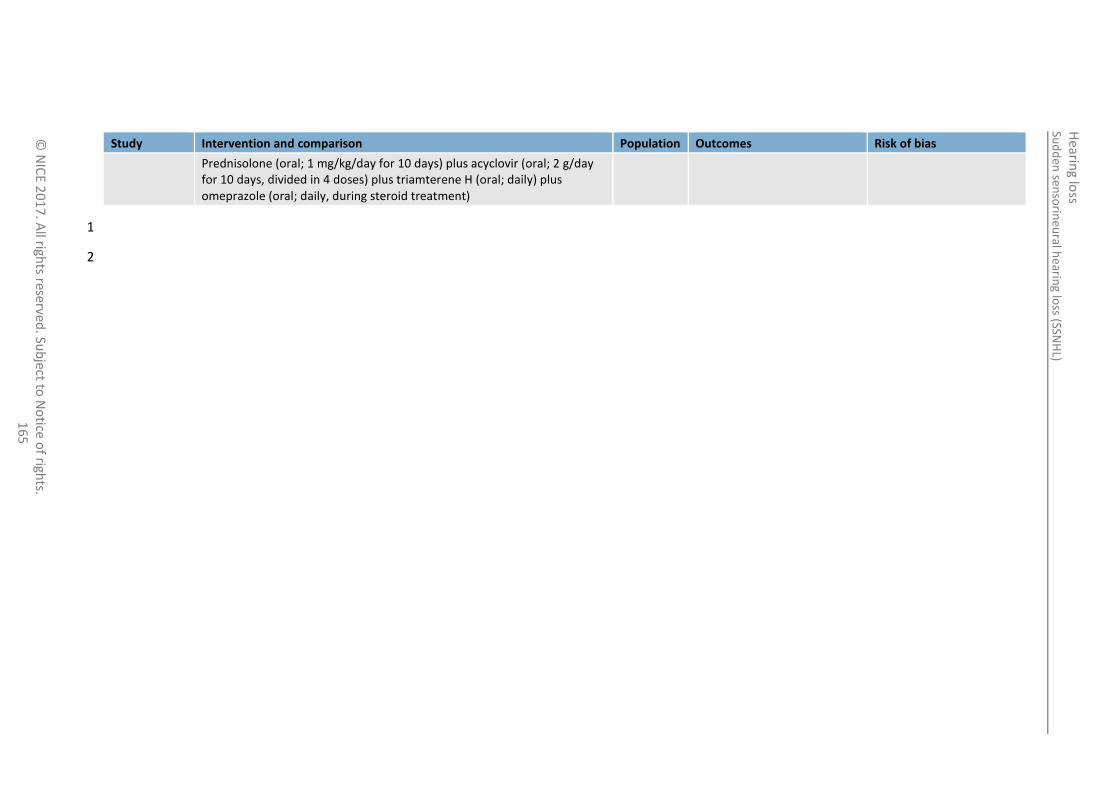
Sud
den
senso
rineu
ral hearin
g loss (SSN
HL)
Hearin
g loss
© N
ICE 2
01
7. A
ll rights reserved
. Sub
ject to N
otice o
f rights.
16
5
Study Intervention and comparison Population Outcomes Risk of bias
Prednisolone (oral; 1 mg/kg/day for 10 days) plus acyclovir (oral; 2 g/day for 10 days, divided in 4 doses) plus triamterene H (oral; daily) plus omeprazole (oral; daily, during steroid treatment)
1
2

Hearing loss Sudden sensorineural hearing loss (SSNHL)
© NICE 2017. All rights reserved. Subject to Notice of rights. 166
11.3.2 Economic evidence 1
11.3.2.1 Published literature 2
No relevant health economic studies were identified. 3
See also the health economic study selection flow chart in appendix F. 4
11.3.2.2 Unit costs 5
See appendix P. 6
11.3.3 Evidence statements 7
Clinical 8
First line: 9
Steroid (IT) versus steroid (oral) [IT prednisolone, methylprednisolone or dexamethasone versus 10 oral prednisolone] 11
There was a clinically important benefit of oral steroids for ear ache and pain at injection site 12 (moderate quality evidence, 2 studies) and for dizziness/vertigo (high quality evidence, 1 study). 13
There was a clinically important benefit of IT steroids for mouth dryness/thirst (moderate quality 14 evidence, 2 studies),weight gain (low quality evidence, 2 studies) and other adverse events (mood 15 change, blood glucose problems, sleep change, and increased appetite; moderate quality 16 evidence, 2 studies) and. 17
There was no clinically important difference for PTA improvement (very low quality evidence, 5 18 studies), recovery (very low quality evidence, 2 studies), word recognition score at 2 months 19 (moderate quality evidence, 1 study) and word recognition score at 6 months (low quality 20 evidence, 1 study). 21
There was no clinically important difference in the number of people with adverse events (high 22 quality evidence, 2 studies), treatment-related serious adverse events (very low quality evidence, 23 1 study), and other adverse events (ear infection and tympanic membrane perforation; very low 24 quality evidence, 1 study). 25
Steroid (IV) versus steroid (oral) [IV methylprednisolone followed by oral prednisolone versus oral 26 prednisolone] 27
There was no clinically important difference in PTA improvement, complete recovery, word 28 recognition score improvement (very low quality evidence, 1 study) complications (moderate 29 quality evidence, 1 study). There were no reported adverse events. 30
Dual steroid (IT plus oral) versus steroid (oral) [IT dexamethasone plus oral prednisolone versus 31 oral prednisolone] 32
There was a clinically important benefit of dual steroid (oral plus IT) for PTA change or final score 33 when oral was used every day (very low quality evidence, 4 studies), for speech discrimination 34 (low quality evidence, 1 study) when oral was given every other day and for complete recovery 35 (very low quality evidence, 3 studies). 36
There was no clinically important difference in PTA change score (very low quality evidence, 1 37 study) and no difference in speech discrimination when oral was given every day (very low quality 38 evidence, 3 studies). 39

Hearing loss Sudden sensorineural hearing loss (SSNHL)
© NICE 2017. All rights reserved. Subject to Notice of rights. 167
Dual steroid (IT plus oral) versus steroid (IT) [IT dexamethasone plus oral prednisolone versus IT 1 dexamethasone] 2
There was a clinically important benefit of dual steroids (oral plus IT) for PTA score and complete 3 recovery (very low quality evidence, 2 studies) and for speech discrimination (very low quality 4 evidence, 1 study). 5
Dual steroid (IT plus oral) plus antiviral versus single steroid (oral) plus antiviral 6
There was no clinically important difference in improvement in PTA (low quality evidence, 1 7 study). 8
Economic 9
No relevant economic evaluations were identified. 10
11.3.4 Recommendations and link to evidence 11
Recommendations Please see the recommendations in section 11.2.4.
Research recommendation
4. What is the most effective first-line treatment for idiopathic sudden sensorineural hearing loss?
Relative values of different outcomes
The following critical outcomes were included in this review: pure tone average, speech discrimination or recognition, health-related quality of life and hearing-specific health-related quality of life.
Adverse events were included as an important outcome.
Quality of the clinical evidence
The studies reported pure tone average (PTA) by change or final scores, author-defined improvement and recovery. We analysed the change or final scores as well as the author-defined recovery data as these were thought to be the most important outcomes for decision-making. If neither of these preferred definitions were presented by a given study, author-defined improvement was reported.
The majority of the evidence was of low or very low quality and based on few studies with small sample sizes. There were some outcomes of moderate and high quality evidence, mostly relating to adverse events of IT steroids versus oral steroids.
The studies were mainly downgraded were the following reasons:
A lack of detail regarding how the diagnosis of ‘idiopathic’ SSNHL was determined. Some studies identified patients with causes of the SSNHL after randomisation and consequently excluded them from the study.
Many studies did not describe how the patients were randomised and how allocation was concealed.
Other reasons for downgrading related to blinding, attrition bias, and not specifying outcomes in the methods (post-hoc analysis).
Outcomes were also downgraded due to imprecision; many studies had relatively small numbers in each treatment group.
Some studies did not consider high frequency losses (above 2 kHz) within their analysis.
Trade-off between clinical benefits and harms
The guideline committee noted that there was evidence of no clinical difference between IT and oral administration of steroids in the first-line treatment of idiopathic SSNHL, both for the positive outcomes and for the overall rates of adverse events. However, specific adverse events showed clinical differences between these routes of administration in line with clinical experience, with mood change and blood glucose problems being more frequent with oral steroids and injection site

Hearing loss Sudden sensorineural hearing loss (SSNHL)
© NICE 2017. All rights reserved. Subject to Notice of rights. 168
pain or dizziness and vertigo more common with IT administration. The committee highlighted the importance of avoiding residual or persisting tympanic membrane perforation during the IT procedure, as this should be a ‘never event’, and noted that finer needles could prevent this occurring.
The committee saw no clinical difference between IV and oral steroids for any reported outcomes, and noted that IV steroids are not currently used owing to the requirement to be treated in a hospital setting and the more invasive nature of this route of administration.
When administration of both oral and IT steroids was compared with either route alone the committee commented on the clinical benefit of dual administration for recovery, PTA scores and speech discrimination scores (after excluding 1 study with high baseline speech discrimination scores). However, 1 of the included studies used a much higher dose of IT dexamethasone than would be standard for UK practice and also had baseline differences that could bias the outcomes.
The committee noted that when an antiviral was used in combination with either dual steroid routes or oral steroid alone no clinical difference was seen for the mean improvement in PTA.
Overall, there was some evidence of benefit for steroid treatment. However, there was uncertainty about the optimal route and timing (first or second line) owing to the limited number and quality of the studies. This was particularly related to baseline differences and non-standard dosing of IT steroids.
Trade-off between net clinical effects and costs
No health economic evidence was identified for this question.
The committee considered the clinical evidence and unit costs for the alternative treatment options. The committee noted that the costs of the most likely steroids were low, being between £3 and £13 for a course lasting up to 2 weeks. Therefore the most important resource use and cost would be the cost of administering these drugs. If oral drugs are prescribed these can be taken at home and the patient may require only 2 outpatient appointments for investigation and review. Giving drugs intratympanically would give rise to greater costs as each time drugs are administered the patient would need to come into hospital for an outpatient appointment where this would be conducted by a suitably trained clinician. This could involve 3 or 4 outpatient appointments and the first such appointment may be outside routine hours adding to the expense. An outpatient appointment for a minor ear procedure has an NHS reference cost of £110. Adopting IT as the standard first-line treatment would be a change in practice and would require greater resources.
Giving drugs intravenously, by contrast, would necessitate an inpatient stay, which would be even more expensive. Given that no clinical evidence was identified favouring IV drugs, the committee did not recommend this as an option.
Given the limited evidence favouring steroid treatment and their low cost, but a lack of clear evidence from the clinical review comparing different oral and IT drugs, and considering the higher costs of IT treatment, the committee was not able to support any particular drug or route of administration, but advised that the use of steroids should be considered.
Other considerations The committee noted that the evidence was scarce, especially for oral steroids, which makes it difficult to draft a recommendation for routes of administration.
The committee discussed current practice and pointed out this is varied; however, the committee agreed that the most common approach is using oral steroids, with IT steroids as a second-line treatment.
The importance of full investigation (history, examination, MRI scan, blood tests for chronic infection and auto-immune disease) before offering treatment was discussed. However, there is an issue about delaying the treatment while waiting for the results. The committee discussed offering treatment while waiting for results for lack of a better option.

Hearing loss Sudden sensorineural hearing loss (SSNHL)
© NICE 2017. All rights reserved. Subject to Notice of rights. 169
The resource impact of IT steroids was discussed. Additionally, the regimens used in the studies were intensive, with 3 or 4 doses of IT steroid, which is more than the 1 or 2 doses currently used in UK practice.
For all the other areas the committee agreed to draft a research recommendation.
1

Hearing loss Information and advice
© NICE 2017. All rights reserved. Subject to Notice of rights. 170
12 Information and advice 1
Introduction 12.1 2
It is recognised that many people with hearing loss delay seeking professional help for up to 10 years 3 after the hearing difficulty first becomes apparent,24 leading to increasing difficulties for themselves, 4 their families, carers and work colleagues. There are many possible reasons for this delay including 5 denial of their difficulties and embarrassment at the thought of having to wear hearing aids, being 6 unaware of the full impact of their hearing difficulties, and a lack of knowledge of the support and 7 help available. Information and advice on the range of interventions to successfully manage hearing 8 difficulties may not be readily available or easy to access. On the whole the general public has a poor 9 knowledge of hearing-related issues, and in particular hearing aid users and their families and carers 10 have a need for more information to help them cope with hearing loss. 11
Those who eventually seek support may not have the information they need in order to make 12 informed choices about possible interventions including, but not restricted to, hearing aids. Also, 13 once a management plan has been agreed, the person with hearing difficulties and their family or 14 carers may not be able to access the advice required to ensure successful adherence to that plan. 15
Although clear, well-written and accessible information through a range of media is recommended 16 (for example, Welsh Quality Standards for audiology services 77, Commissioning services for people 17 with hearing loss75), provision of such information, support and advice is inconsistent throughout 18 England. Charities and GP surgeries may provide pre-assessment information and advice but this is 19 not universally available. NHS audiology information provision is also inconsistent. In some locations 20 people with hearing difficulties, when referred to an audiologist, get at least 2 appointments with 21 time for discussion of options, dissemination of information, answering questions and signposting to 22 other sources of support. In other locations only 1 appointment is offered with limited scope for 23 information dissemination. 24
This review was carried out to inform recommendations about the information, support and advice 25 needs of adults with hearing loss, and their families and carers, that enables them to adapt to, and 26 successfully address hearing difficulties. 27
Review question: What are the information, support and advice 12.228
needs of people with hearing difficulty and their families and 29
carers? 30
For full details see review protocol in appendix C. 31
Table 74: Characteristics of review question 32
Objective To assess the information, support and advice needs of patients with hearing loss (adult presentation), their families, and carers.
Population and setting
Adults aged 18 and over with hearing loss
Families, carers and ‘communication partners’ of people with hearing loss
Context Any type of information, support and advice described by studies. For example,
Content of information, support and advice required
How and by whom information, support and advice is delivered
Information for carers and family members as well as information for patients
Timing of information and support
Review strategy Synthesis of qualitative research. Results presented in narrative format. Quality of the

Hearing loss Information and advice
© NICE 2017. All rights reserved. Subject to Notice of rights. 171
evidence will be assessed by a GRADE CerQual approach for each review finding.
Only studies that were based in the UK or OECD countries were included to ensure applicability and relevance of issues relating to the UK healthcare system.
12.2.1 Qualitative evidence 1
12.2.1.1 Methods 2
Eleven qualitative studies were included in the review;3 ,9 ,12 ,18 ,30 ,42 ,54 ,57 ,58 ,84 ,85 these are summarised 3 in Table 75 below. Key findings from these studies are summarised in Section 12.2.1.2 below. See 4 also the study selection flow chart in appendix E, study evidence tables in appendix H, and excluded 5 studies lists in appendix L. 6
12.2.1.2 Summary of included studies 7
The main findings for each included study were identified and synthesised to gain an insight into 8 themes present across the body of evidence as a whole. Each review finding had its methodological 9 limitations assessed within each study first using a risk of bias checklist. Based on the degree of 10 methodological limitations studies were evaluated as having minor, moderate or severe limitations. 11
The overall assessment of the methodological limitations of the evidence was based on the studies 12 contributing to the review finding. The relative contribution of each study to the overall review 13 finding and the type of methodological limitations were taken into account when giving an overall 14 rating. An explanation of the reasons for each overall quality rating is provided for each review 15 finding (see section 12.2.1.4). Further information on appraising and synthesising qualitative studies 16 is detailed in section 4 of the guideline). 17
Six of the included studies were based in the UK (Barlow 2007,9 Bennion 2011,12 Claesen 2012,18 Kelly 18 2013,54 Pryce 2012,84 Pryce 201385). All of these studies were based on the patient perspective apart 19 from 1, Pryce 2013,85 that looked at the carer’s perspective; the staff looking after those with hearing 20 impairment in residential care homes. 21
Two studies (Laplante 2012,58 Laplante 201357) included UK participants as well asparticipants from 22 other countries (Norway: Laplante 201258 & 201357; Australia: Laplante 2012;58 USA: Laplante 23 201258). Three additional studies were based outside the UK (Aguayo 2001,3 Detaille 2003,30 24 Grenness 201442). 25
There were no studies that reported the information, support and advice needs of families or carers 26 of patients with hearing loss. 27
The majority of the studies used in-depth interviews or focus groups with the exception of 2 studies 28 using ethnographic observation Pryce 2012
84 Pryce 2013
85. The majority of included studies focused on 29 the use of hearing aids in older people. 30
Table 75: Summary of studies included in the review 31
Study Design Population Research aim Comments
Aguayo 2011
3
Canada
In-depth individual interviews with semi-structured questions
Qualitative analysis (type
People with acquired deafness
Mean age 49 years (range 31–68 years)
To explore the psychological and social effects of becoming deaf as an adolescent or adult and the adequacy of rehabilitation services
Includes some patients with child onset (unclear n value) and surgical causes of deafness (n=3)
No description of ethics approval

Hearing loss Information and advice
© NICE 2017. All rights reserved. Subject to Notice of rights. 172
Study Design Population Research aim Comments
not stated)
n=8
Context not clearly described
Author carries out all parts of the study (bias not discussed)
Data analysis does not appear to be rigorous
Severe limitations
Barlow 2007
9
UK
In depth semi structured interviews with framework analysis (5 topics)
n=8
People with experience of late deafness living in the UK
(33–60 years old)
To examine the views of people with experience of late deafness (severe to profound hearing loss acquired during adult life) living in the UK.
Particular interest in participants’ in depth experiences of attending the LINK Intensive Rehabilitation programme and the experience of late deafness on emotions, family relationships, and employment given the prominence of these themes in the established literature.
Applicability issues as convenience sample used (tutors of LINK course)
Specific focus on 5 aspects of living with deafness
Minor limitations
Bennion 2011
12
UK
Semi structured interviews with thematic qualitative analysis
n=9
Older people with hearing impairment (61–93 years old)
Explore and develop a greater understanding of the experience of living with age related hearing impairment from the perspectives of older people themselves to highlight possible recommendations for the improvement of hearing aid (HA) services and rehabilitations
Unclear setting, interviewer and data analyser background
Recommendations restricted to older hearing impaired population
Moderate limitations
Claesen 2012
18
UK
Interviews: ‘conversation with purpose’
Thematic analysis
n=6
Adults referred to audiology by their GPs for hearing difficulties
(65–77 years old)
Pilot study using qualitative methods to learn about the psycho-social needs of people who seek help with hearing loss
No description of researcher/experience and their relationship to study design
Unclear interview content and structure ‘conversational’
No description of how the themes emerged
Severe limitations
Detaille 2003
30
Netherlands
Focus group
Concept mapping
n=25 with
Moderate or severe hearing loss, lack of any other chronic illness that might affect work, paid job, age between 21-60 years
To determine factors that help currently employed people with rheumatoid arthritis, diabetes mellitus or hearing loss to continue working
Unclear context
Unclear role of facilitator
Unclear data richness
Severe limitations

Hearing loss Information and advice
© NICE 2017. All rights reserved. Subject to Notice of rights. 173
Study Design Population Research aim Comments
hearing loss
Mean 49 (range 36-58 years)
Grenness 2014
42
Australia
Semi-structured interviews
Content analysis
n=10
Adults (aged 60+) who had owned hearing aids for at least one year; participants did not need to be current hearing aid users
To define patient-centred care specific to audiological rehabilitation from the perspective of older adults who have owned hearing aids for at least one year
Applicability to the UK
Role of researcher/risk of bias
No data saturation described
Moderate limitations
Kelly 2013
54
UK
Mixed methods, 4 phases including semi-structured interviews, survey and focus groups
Framework analysis
n=31
At least 60 years old, any type of hearing loss, having no cognitive impairment, not having a terminal or life threatening illness and speaking English.
(60–87 years old)
To explore older adults’ perceptions of and experiences with new hearing aid use and to identify what they believed would enable them to successfully adjust to wearing a hearing aid
Mixed methods approach
Minor limitations
Laplante 2012
58
Australia
Denmark
UK
USA
In-depth interviews (n=34)
Content analysis
At least 18 years old with hearing impairment (defined as at least one air-conduction threshold at 0.5, 1, 2, or 4 kHz greater than 25 dB HL in at least one ear.
No age range given
Explore and describe hearing help-seeking and rehabilitation perspective of adults with hearing impairment
Applicability: 4 countries (includes UK 24%), mixed funding (68% eligible for funding)
Authors conclusions not explicit/ clear
Minor limitations
Laplante 2013
57
Norway, UK
Focus groups
Inductive qualitative content analysis
n=17 hearing aid users
at least 18 years of age
Hearing aid user population and audiologists
(23–90 years old, median 67)
To explore the meaning and determinants of optimal hearing aid use from the perspectives of hearing aid clients and audiologists
To contrast the perspectives of the clients and audiologists
Minor limitations
Pryce 2012
84
UK
Ethnographic observation and in-depth interviews
n=18
Residents from 2 residential care homes
(76-99 years old)
To explore the factors affecting communicating with a hearing loss in residential care
Data collection and analysis not rigorous
11% of residents consider their hearing to be ‘good’
Moderate limitations
Pryce 2013
85
UK
Mixed method,
4 phases including ethnographic observation, interviews, qualitative survey,
Staff and residents at 3 residential care homes
(Staff age range 22–58 years old)
To identify staff perspectives on hearing loss and their views about potential hearing service improvements
Mixed methods
No description of researcher/experience
No description about data saturation
Moderate limitations

Hearing loss Information and advice
© NICE 2017. All rights reserved. Subject to Notice of rights. 174
Study Design Population Research aim Comments
stakeholder group discussions
Constant comparative approach derived from grounded theory
n=19
12.2.1.3 Qualitative evidence synthesis 1
Table 76: Review findings 2
Main findings Statement of finding
Poor verbal communication Poor communication between healthcare providers, family, friends and individuals with hearing loss. Need for further education on improving communication techniques to support those with hearing impairment, prevent misunderstandings, confusion and potential adverse events.
Need for tailored, clear written information from healthcare providers
Patient desire for information varies and needs to be individualised and unbiased. Often felt to have insufficient information on management options.
Lack of support networks and rehabilitation services
Insufficient or lack of provision of social and emotional wellbeing support. Patients have limited knowledge and access to support groups for example; online, peer groups, community programmes.
Importance of follow-up Patients acknowledged a lack of follow-up in which they had the opportunity for their questions/ issues to be addressed
Lack of hearing aid advice and support Many patients felt there was a lack of advice and support relating to the use and maintenance of hearing aids and support with the stigma and cosmetic issues associated with their use.
Lack of awareness of practical and physical supportive interventions
Many patients were not aware of interventions that can be used to support their hearing in everyday activities.
12.2.1.4 Narrative summary of review findings: 3
Review finding 1: Poor communication. 4
In some cases there was a lack of sensitivity and knowledge on how to communicate with people 5 with difficulty hearing by some healthcare professionals and residential home carers. Issues included 6 shouting at the patient, speaking too quickly, not clearly, or in a rush, not listening to the patient, not 7 conversing directly in front of the patient and poor understanding of how hearing aids work and 8 function. The impact of background noise on the participants’ ability to hear was poorly understood. 9 This also had an impact in the workplace, where there was difficultly understanding the content of 10 meetings and a lack of acknowledgment and understanding of the implications of having hearing loss 11 by colleagues. Some of the consequences experienced due to miscommunication resulted in the 12 misunderstanding of medical information they had been told about their diagnoses. Good knowledge 13

Hearing loss Information and advice
© NICE 2017. All rights reserved. Subject to Notice of rights. 175
of the patient and their needs, friendly approach and use of interpreters allowed for better 1 communication. 2
Explanation of quality assessment: 3
There were moderate methodological limitations in the contributing studies due to unclear roles of 4 researchers, context and their potential bias, data collection and analysis not being rigorous. There 5 were no concerns about relevance. There were minor concerns about inadequacy and minor 6 concerns about coherence. There was a judgement of moderate confidence in this finding which was 7 due to the concerns with moderate methodological limitations. 8
Review finding 2: Need for tailored, clear information from healthcare professionals 9
Some patients found that the information that health professionals gave them was overwhelming 10 and some did not remember it once they had got home. The amount of information required varies 11 from patient to patient and this should be managed appropriately. It was important for patients to 12 know that an audiologist’s recommendations were not influenced by financial gain (private sector). 13 Patients also often relied on peers or family members for information. 14
Explanation of quality assessment: 15
There were moderate methodological limitations in the contributing studies due to unclear roles of 16 researchers, their potential bias and the data analysis not being rigorous. There were no concerns 17 about relevance. There were moderate concerns about inadequacy as the evidence provides 18 different aspects of information needed by those with hearing loss (quantity of information, delivery 19 of information) and did not have a depth to each contributing theme. There were minor concerns 20 about coherence. There was a judgement of low confidence in this finding due to the concerns with 21 moderate methodological limitations and moderate adequacy. 22
Review finding 3: Lack of support networks and rehabilitation services 23
There are limited emotional, mental and social support networks reported within the studies. Many 24 people suffer from a variety of emotional reactions to the hearing loss including anxiety, frustration 25 and depression, as well as feelings of isolation and lack of social acceptance which results in non-26 participation in hobbies or activities they previously enjoyed. There were mixed levels of family and 27 friends support and in some cases people felt ignored, or abused by family members. In 1 study 28 consensus proposed that family members should be given the chance to attend an audiology 29 appointment with the patient and given written information and that family members should be 30 involved in the decision making process. 31
There are a variety of medical professionals involved with the care of people who encounter hearing 32 loss. However, there was no description of mental health professionals associated with the care 33 pathway to address the patient’s psychosocial needs. There were experiences, both positive and 34 negative, in accessing rehabilitation support. Linking in with the poor communication, some patients 35 found that healthcare professionals did not have the appropriate knowledge of rehabilitation 36 services and resources that were available. There were other patients who did have a more positive 37 experience. 38
Explanation of quality assessment: 39
There were moderate methodological limitations in the contributing studies due to unclear settings 40 and roles of researchers and their potential bias, data analysis not being rigorous. There were no 41 concerns about relevance. There were moderate concerns about inadequacy as the evidence 42 describes limited depth to each contributing theme (social and psychological services, support 43 networks). There were minor concerns about coherence. There was a judgement of low confidence 44

Hearing loss Information and advice
© NICE 2017. All rights reserved. Subject to Notice of rights. 176
in this finding due to the concerns, with moderate methodological limitations and moderate 1 adequacy. 2
Review finding 4: Importance of follow-up 3
Many patients thought that a follow-up audiology appointment would be beneficial and it was 4 noticed if it was not available. This would enable any questions they later thought of, or information 5 forgotten, to be addressed. 6
Explanation of quality assessment: 7
There were minor methodological limitations in the contributing studies. There were no concerns 8 about relevance. There were moderate concerns about inadequacy as there was evidence for the 9 need for follow-up. There were minor concerns about coherence. There was a judgement of 10 moderate confidence in this finding due to the concerns, with moderate concerns about adequacy. 11
Review finding 5: Lack of hearing aid advice and support 12
Some patients found that there was a lack of information available on hearing aid options and NHS 13 versus private dispensers. This may also influence patients’ expectations to what a hearing aid can 14 offer leading to unrealistic expectations and contributing to disappointment with the use of a hearing 15 aid. Patients often experienced difficulties with their hearing aids and did not realise how they could 16 be fixed or altered and how to use the controls. Issues consisted of day to day encounters (how long 17 or when to wear it, whistling noises, interference with other electronic devices) and maintenance 18 issues (changing the battery, cleaning). This was also found with staff caring for those who used 19 hearing aids, who lacked knowledge on the use of hearing aids and did not have specific training. 20 One study proposed the use of onsite audiological services to reduce logistical issues with the fitting 21 and follow-up of hearing aids. The ability to trial the hearing aids to see if the patient was happy with 22 it and how it worked, was proposed by 2 studies. Major findings which limited hearing aid use was 23 the stigma and cosmetic appearance of hearing aids. Some patients also felt pressurised to wear one. 24
Explanation of quality assessment: 25
There were severe methodological limitations in the contributing studies due to unclear settings and 26 roles of researchers and their potential bias, data collection and analysis not being rigorous. There 27 were no concerns about relevance. There were minor concerns about inadequacy. There were minor 28 concerns about coherence. There was a judgement of low confidence in this finding due to the 29 concerns with severe methodological limitations. 30
Review finding 6: Lack of awareness of practical and physical supportive interventions 31
Some patients had not experienced the loop system and lacked knowledge of other environmental 32 aids, such as assistive devices, adapted telephones, doorbells, and safety devices such as vibrating 33 smoke alarms. Participants in residential care found that they did not have access to some of the 34 supportive interventions, for example, telephone or television aids. Those currently in employment 35 found that if they were determined and persistent enough to ask for the necessary adaptations at 36 work, these adaptations would enable them to continue with work. The role of occupational 37 physicians (rehabilitation services) and their knowledge about hearing loss and ability to make the 38 needed adaptations at work quickly was highlighted. This input allows those with hearing loss to 39 continue at work. 40
Explanation of quality assessment: 41
There were moderate methodological limitations due to unclear context and roles of researchers and 42 potential bias, and data collection and analysis not being rigorous. There were no concerns about 43 relevance. There were moderate concerns about inadequacy as there was insufficient data richness 44 for environmental aids in individual settings. There were minor concerns about coherence. There was 45

Hearing loss Information and advice
© NICE 2017. All rights reserved. Subject to Notice of rights. 177
a judgement of low confidence in this finding due to the concerns with moderate methodological 1 and adequacy concerns. 2
3
4

Info
rmatio
n an
d ad
vice
Hearin
g loss
© N
ICE 2
01
7. A
ll rights reserved
. Sub
ject to N
otice o
f rights.
17
8
12.2.1.5 Qualitative evidence summary 1
Table 77: Summary of evidence 2
Study design and sample size
Finding
Quality assessment
No of studies contributing to the finding Design Criteria Rating
Overall assessment of confidence
Poor communication
6 studies 9 ,12
,30 ,42 ,84 ,85
(n=80, 10 of which were carers)
Interviews n=3
Focus groups n=1
Ethnographic observation and focus groups n=1
Mixed methods n=1
Poor communication between healthcare providers, family, friends and individuals with hearing loss. Need for further education on improving communication techniques to support those with hearing impairment, prevent misunderstandings, confusion and potential adverse events.
Limitations Moderate concerns MODERATE
Coherence Minor concerns
Relevance Minor concerns
Adequacy Minor concerns
Need for tailored information from healthcare providers
2 studies42 ,54
(n=41)
Interviews n=1
Combination of interviews and focus groups n=1
Patient desire for information varies and needs to be individualised and unbiased. Often felt to have insufficient information on management options.
Limitations Moderate concerns LOW
Coherence Minor concerns
Relevance Minor concerns
Adequacy Moderate concerns
Lack of support networks and services
6 studies3 ,9 ,12
,42 ,54 ,58
(n=100)
Interviews n=5Combination of interviews and focus groups n=1
Insufficient or lack of provision of social and emotional wellbeing support. Patients have limited knowledge and access to support groups for example; online, peer groups, community programmes.
Limitations Moderate concerns LOW
Coherence Minor concerns
Relevance Minor concerns
Adequacy Moderate concerns
Importance of follow-up

Info
rmatio
n an
d ad
vice
Hearin
g loss
© N
ICE 2
01
7. A
ll rights reserved
. Sub
ject to N
otice o
f rights.
17
9
Study design and sample size
Finding
Quality assessment
No of studies contributing to the finding Design Criteria Rating
Overall assessment of confidence
3 studies54 ,57
,58
(n=82)
Interviews n=1
Focus groups n=1
Combination of interviews and focus groups n=1
Patients acknowledged a lack of follow-up in which they had the opportunity for their questions/ issues to be addressed
Limitations Minor concerns MODERATE
Coherence Minor concerns
Relevance Minor concerns
Adequacy Moderate concerns
Lack of hearing aid advice and support
9 studies12 ,18
,30 ,54 ,57 ,58 ,84 ,85
(n=160, 10 of which were carers)
Interviews n=4
Focus groups n=2
Combination of interviews and focus groups n=1 Ethnographic observation and focus groups n=1
Mixed methods n=1
Many patients felt there was a lack of advice and support relating to the use and maintenance of hearing aids and support with the stigma and cosmetic issues associated with their use.
Limitations Severe concerns LOW
Coherence Minor concerns
Relevance Minor concerns
Adequacy Minor concerns
Lack of awareness of practical and physical supportive interventions
5 studies9 ,12 ,30
,54 ,84
(n=91)
Interviews n=2 Focus groups n=1
Interviews and focus groups n=1
Ethnographic
Many patients were not aware of interventions that can be used to support their hearing in everyday activities.
Limitations Moderate concerns LOW

Info
rmatio
n an
d ad
vice
Hearin
g loss
© N
ICE 2
01
7. A
ll rights rese
rved. Su
bject to
No
tice of righ
ts. 1
80
Study design and sample size
Finding
Quality assessment
No of studies contributing to the finding Design Criteria Rating
Overall assessment of confidence
observation and focus groups n=1
1
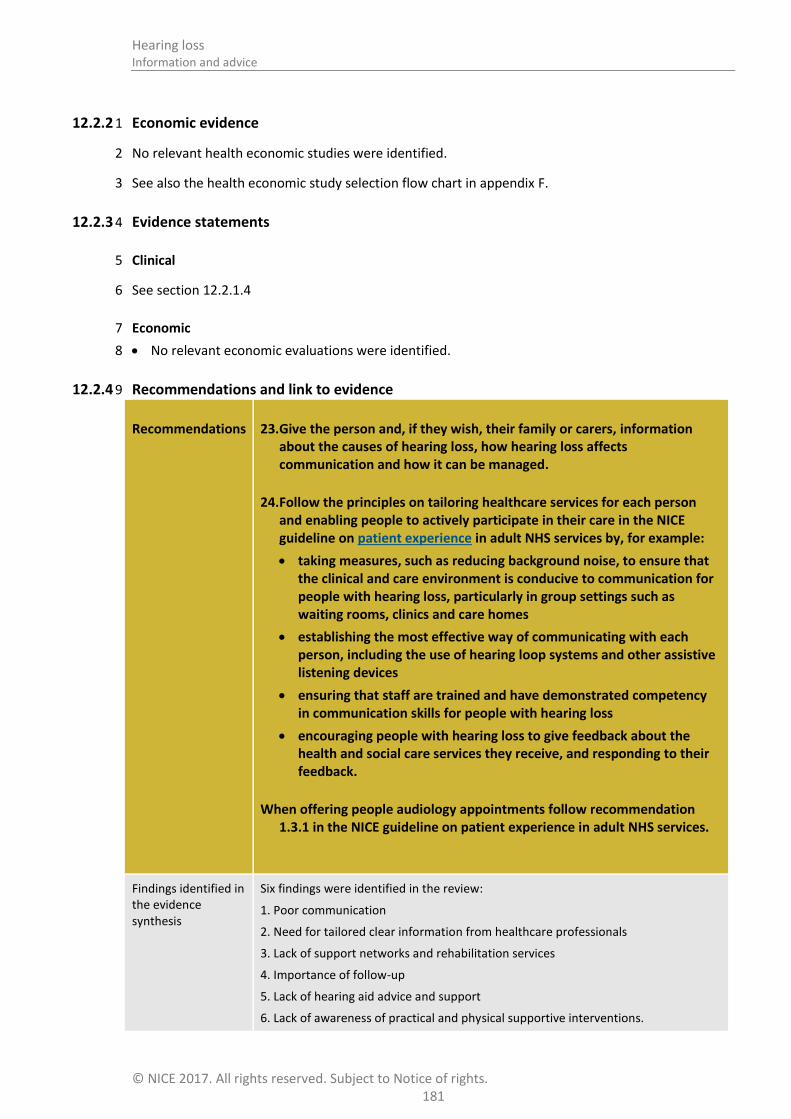
Hearing loss Information and advice
© NICE 2017. All rights reserved. Subject to Notice of rights. 181
12.2.2 Economic evidence 1
No relevant health economic studies were identified. 2
See also the health economic study selection flow chart in appendix F. 3
12.2.3 Evidence statements 4
Clinical 5
See section 12.2.1.4 6
Economic 7
No relevant economic evaluations were identified. 8
12.2.4 Recommendations and link to evidence 9
Recommendations 23. Give the person and, if they wish, their family or carers, information about the causes of hearing loss, how hearing loss affects communication and how it can be managed.
24. Follow the principles on tailoring healthcare services for each person and enabling people to actively participate in their care in the NICE guideline on patient experience in adult NHS services by, for example:
taking measures, such as reducing background noise, to ensure that the clinical and care environment is conducive to communication for people with hearing loss, particularly in group settings such as waiting rooms, clinics and care homes
establishing the most effective way of communicating with each person, including the use of hearing loop systems and other assistive listening devices
ensuring that staff are trained and have demonstrated competency in communication skills for people with hearing loss
encouraging people with hearing loss to give feedback about the health and social care services they receive, and responding to their feedback.
When offering people audiology appointments follow recommendation 1.3.1 in the NICE guideline on patient experience in adult NHS services.
Findings identified in the evidence synthesis
Six findings were identified in the review:
1. Poor communication
2. Need for tailored clear information from healthcare professionals
3. Lack of support networks and rehabilitation services
4. Importance of follow-up
5. Lack of hearing aid advice and support
6. Lack of awareness of practical and physical supportive interventions.
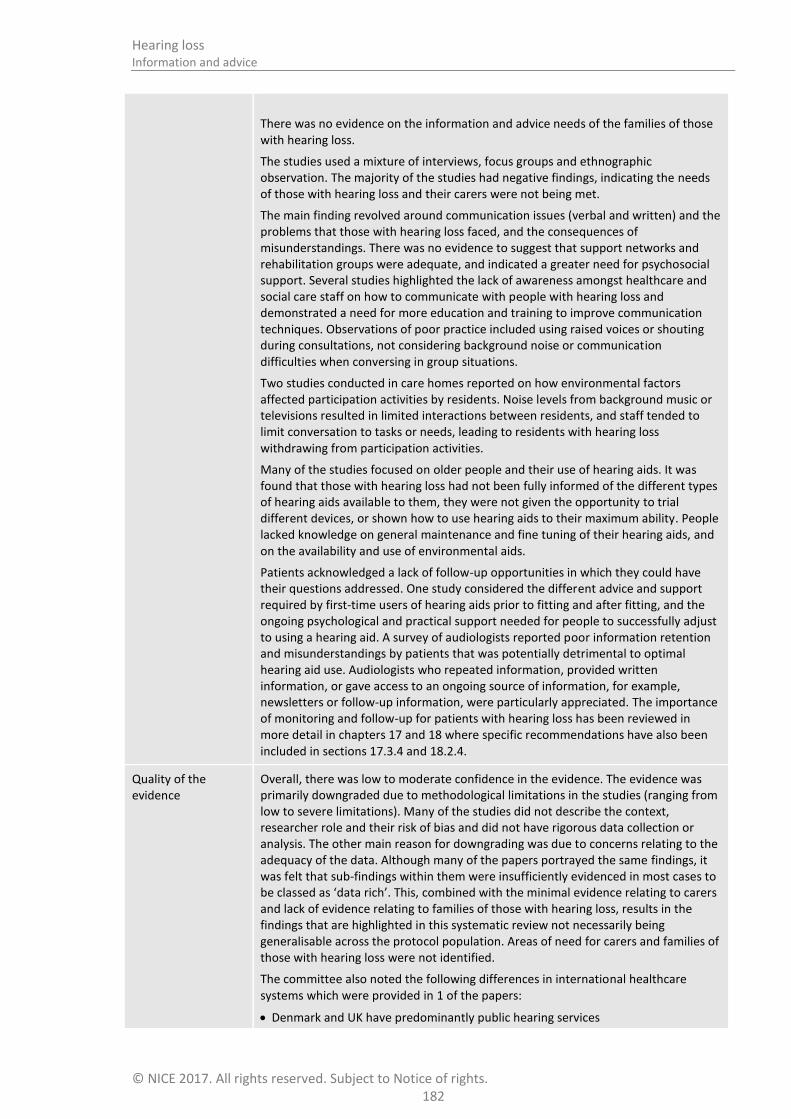
Hearing loss Information and advice
© NICE 2017. All rights reserved. Subject to Notice of rights. 182
There was no evidence on the information and advice needs of the families of those with hearing loss.
The studies used a mixture of interviews, focus groups and ethnographic observation. The majority of the studies had negative findings, indicating the needs of those with hearing loss and their carers were not being met.
The main finding revolved around communication issues (verbal and written) and the problems that those with hearing loss faced, and the consequences of misunderstandings. There was no evidence to suggest that support networks and rehabilitation groups were adequate, and indicated a greater need for psychosocial support. Several studies highlighted the lack of awareness amongst healthcare and social care staff on how to communicate with people with hearing loss and demonstrated a need for more education and training to improve communication techniques. Observations of poor practice included using raised voices or shouting during consultations, not considering background noise or communication difficulties when conversing in group situations.
Two studies conducted in care homes reported on how environmental factors affected participation activities by residents. Noise levels from background music or televisions resulted in limited interactions between residents, and staff tended to limit conversation to tasks or needs, leading to residents with hearing loss withdrawing from participation activities.
Many of the studies focused on older people and their use of hearing aids. It was found that those with hearing loss had not been fully informed of the different types of hearing aids available to them, they were not given the opportunity to trial different devices, or shown how to use hearing aids to their maximum ability. People lacked knowledge on general maintenance and fine tuning of their hearing aids, and on the availability and use of environmental aids.
Patients acknowledged a lack of follow-up opportunities in which they could have their questions addressed. One study considered the different advice and support required by first-time users of hearing aids prior to fitting and after fitting, and the ongoing psychological and practical support needed for people to successfully adjust to using a hearing aid. A survey of audiologists reported poor information retention and misunderstandings by patients that was potentially detrimental to optimal hearing aid use. Audiologists who repeated information, provided written information, or gave access to an ongoing source of information, for example, newsletters or follow-up information, were particularly appreciated. The importance of monitoring and follow-up for patients with hearing loss has been reviewed in more detail in chapters 17 and 18 where specific recommendations have also been included in sections 17.3.4 and 18.2.4.
Quality of the evidence
Overall, there was low to moderate confidence in the evidence. The evidence was primarily downgraded due to methodological limitations in the studies (ranging from low to severe limitations). Many of the studies did not describe the context, researcher role and their risk of bias and did not have rigorous data collection or analysis. The other main reason for downgrading was due to concerns relating to the adequacy of the data. Although many of the papers portrayed the same findings, it was felt that sub-findings within them were insufficiently evidenced in most cases to be classed as ‘data rich’. This, combined with the minimal evidence relating to carers and lack of evidence relating to families of those with hearing loss, results in the findings that are highlighted in this systematic review not necessarily being generalisable across the protocol population. Areas of need for carers and families of those with hearing loss were not identified.
The committee also noted the following differences in international healthcare systems which were provided in 1 of the papers:
Denmark and UK have predominantly public hearing services

Hearing loss Information and advice
© NICE 2017. All rights reserved. Subject to Notice of rights. 183
Australia: only some people are eligible for public hearing services
USA: main public hearing service provider is the Department of Veterans Affairs, but the vast majority of the population is ineligible for public hearing services
Trade-off between net effects and costs
No health economic evidence was identified for this question.
The committee agreed that staff training and suitable environments are necessary to enable staff to be able to communicate with and hence provide healthcare for people with hearing loss in an equivalent manner to people without hearing loss, and thus such training and environment are necessities on the basis of the principle of equality – disability being a protected characteristic under the Equalities Act 2010. Thus such provision is required regardless of costs and so the recommendations regarding training and the clinical environment are not primarily economic questions.
However, in light of the qualitative evidence that poor communication with patients leads to misunderstanding, confusion and potential adverse events, the committee noted that this may lead to additional downstream costs later both in dealing with adverse events and in providing increased care for (non-hearing-related) conditions that have worsened due to not being dealt with properly at an earlier stage due to miscommunication. At a more modest level, the committee reported from experience that people with hearing loss commonly present for an additional appointment in primary care because they did not hear or understand what they were told at their previous appointment – giving rise to unnecessary costs. As such, better training of staff may lead to consequential later cost savings, though these cannot be quantified in the absence of objective evidence.
In considering the organisation of staff training the committee recommended that for new staff members training should be incorporated into their basic medical or role-specific training. For existing staff members who have not previously been trained one-off additional training would be required. This cannot be accurately costed, as it would be provided in different ways depending on the local organisation of training. This could be along the lines of other mandatory training, either face-to-face or online according to local preference, and could be combined with other training as part of routine in service training or continuing professional development, for which all members of staff should have some time available each year. As such there would either be no cost above the time and resources already allocated to training each year, or there would be a small additional cost per staff member, which may be offset by subsequent savings as discussed above.
Therefore, the committee agreed that staff training is very likely to be cost saving or cost effective at a threshold of £20,000 per QALY gained in the medium to long term.
The NICE guideline on patient experience in adult NHS services considered the cost effectiveness of providing information and support to patients and agreed that the provision of low-cost information materials is a cost effective intervention.
Other considerations The committee highlighted some ways of communicating which are particularly helpful to people with hearing loss:
Choosing an appropriate room which has good lighting and is as quiet and private as possible (so that louder than average voices would not be overheard).
Not shouting at the person when speaking to them.
Not speaking too quickly, and avoiding exaggerated lip patterns. 79
Not covering your mouth when speaking and making sure you are facing the person when speaking. Making sure your face is visible, for example, by avoiding a light source behind you.
This list does not cover all strategies which can be helpful and stressed the need for training so that the person with hearing loss is empowered and not patronised.
Healthcare and social care staff includes all staff members who communicate with

Hearing loss Information and advice
© NICE 2017. All rights reserved. Subject to Notice of rights. 184
patients, for example reception staff and care assistants. Training should include general principles of good communication given in the NICE Patient experience in adult NHS services guidance (CG138), as well as simple and often overlooked strategies specific to people with hearing loss, for example lip reading and clarifying that what has been said has been heard and understood.
The committee noted that the evidence does not include explicit discussion of the communication needs of people with hearing loss who are also blind, have dementia, special educational needs, or English as a second language.
The committee stated that in its experience, residential and care homes are settings where training and education of staff about how to communicate with people with hearing loss is often inadequate. Care staff members also need training in how hearing aids work and how to fix common problems with them. Improvements in this area are therefore a priority, and good communication is required between healthcare services to ensure that good practice is disseminated.
It is important that monitoring staff communication training and education is undertaken to ensure that it is effective and tailored to meet the needs of patients, carers and family members. The committee noted that auditing patient perspectives is the most effective way to do this.
The committee also considered that specialised equipment (for example personal communication devices and loop systems) should be available in healthcare settings to enable staff to communicate more effectively with people with hearing loss. Personal communication devices involve a hand-held microphone, amplifier and earphones; they can be used to talk directly with a person with hearing loss ensuring that the speaker’s voice is amplified and background noise reduced. They are invaluable in situations where hearing is compromised because the person does not have their aids (such as accident and emergency departments), aids have not been provided or cannot be used (out-patient appointments, care homes). Loop systems are useful in the presence of background noise and are often used at reception desks, waiting rooms, for telephones and for watching television or theatre performances. They require that the individual is wearing hearing aids. For further information see chapter 14 on assistive listening devices.
See also chapter 17 on monitoring and follow-up and chapter 18 interventions to support the use of hearing aids
1

Hearing loss Decision tools
© NICE 2017. All rights reserved. Subject to Notice of rights. 185
13 Decision tools 1
Introduction 13.1 2
People who become aware of hearing-related difficulties often delay seeking help for many years -3 often until the problem becomes unmanageable and impacts greatly on the person or those around 4 them. The reasons for this delay are described in other sections. Many people referred to audiology 5 have little idea of what to expect and can be anxious. They may not be in an optimal state to make 6 decisions and may acquiesce to whatever is advised or offered by an audiologist in deference to 7 professional expertise. 8
An audiologist’s main aim with new referrals is to assess the type of hearing loss and extent of 9 hearing difficulties and prescribe the appropriate intervention to address those difficulties – usually 1 10 or 2 hearing aids (NHS England Commissioning Framework75). However research studies indicate that 11 some people issued with hearing aids fail to use them as prescribed. The Health Survey for England 12 2014 47 found that 28.6% of those who had tried a hearing aid no longer used one but did not 13 address suboptimal use.66 This survey demonstrates equivalent or better adherence than is found for 14 other forms of medical treatment; nevertheless the question of improving adherence does need 15 addressing. Whilst there are a range of practical reasons for discontinued or suboptimal use this non-16 adherence may also reflect that audiologists do not always take full account of the individual’s 17 motivation, drivers, fears and priorities as part of the decision -making process – often because of 18 time constraints. There is an increasing volume of evidence that demonstrates a clear association 19 between increased involvement in decision-making by the individual and better outcomes, better 20 health status, and greater self-reliance; and this association is independent of social class or 21 economic status. Equally, a better understanding of individuals’ motivation for seeking help enables 22 the audiologist to deliver person-centred care in a way that suits the client. 23
Engaging the patient in decisions about hearing interventions, that is, ‘no decision about me without 24 me’, is a key component of contemporary health policy and critical in matching the intervention to 25 the client in order to maximise effective use of healthcare interventions. This NICE guideline reviews 26 the evidence about the effectiveness of motivational interviewing and decision tools in improving the 27 uptake and optimal use of hearing aids. 28
Review question: What is the clinical and cost effectiveness of using 13.229
patient-centred tools to help patients with hearing loss decide 30
between different management strategies? 31
For full details see review protocol in appendix C. 32
Table 78: PICO characteristics of review question 33
Population Adults aged 18 and over presenting with hearing loss
Interventions/ Comparisons
Interventions:
Tools specific to hearing for example Ida Institute motivational tools
Option grids, shared decision-making, decision aids
Comparators:
No decision aid, no patient choice, professional decision
Outcomes Critical outcomes
Hearing-specific health-related quality of life
o Hearing Handicap Inventory for the Elderly (HHIE) or HHI for Adults (HHIA)

Hearing loss Decision tools
© NICE 2017. All rights reserved. Subject to Notice of rights. 186
o Quantified Denver Scale of Communication (QDS)
o Auditory Disability Preference – Visual Analog Scale (ADPI-VAS)
o Device Orientated Subjective Outcome Scale
o Abbreviated Profile of Hearing Aid Benefit (APHAB)
o Speech, Spatial and Qualities of Hearing (SSQ)
o Glasgow Hearing Aid Benefit Profile (GHABP) residual disability subscale
o Any questionnaire not specified above that is relevant
Adherence to chosen strategy for example usage of hearing aids (including data logging and self-report (if applicable)
Important outcomes
Any outcomes reporting:
o Restricted participation or activity limitation
o Social interactions, employment and education
Health-related quality of life
o Health Utilities Index Mark 3 (HUI-3)
o EQ-5D
o SF-36
o Glasgow Benefit Inventory (GBI)
o WHO Disability Assessment Schedule (WHODAS)
o Self-Evaluation of Life Function (SELF)
o HRQoL
o Any questionnaire not specified above that is relevant
Study design RCTs and systematic reviews of RCTs
13.2.1 Clinical evidence 1
No relevant clinical studies were identified investigating the clinical effectiveness of using patient-2 centred tools to help patients with hearing loss decide between different management strategies in 3 adults presenting with hearing loss. See study selection flow chart in appendix E and the excluded 4 studies list in appendix L. 5
6
13.2.2 Economic evidence 7
No relevant health economic studies were identified. 8
See also the health economic study selection flow chart in appendix F. 9
13.2.3 Evidence statements 10
Clinical 11
No relevant clinical evidence was identified. 12
Economic 13
No relevant economic evaluations were identified. 14

Hearing loss Decision tools
© NICE 2017. All rights reserved. Subject to Notice of rights. 187
13.2.4 Recommendations and link to evidence 1
Recommendations See recommendation 15 in communication needs chapter 9.
Research recommendation
What is the clinical and cost effectiveness of person-centred, decision-making tools when agreeing the preferred management strategy for hearing loss in adults?
Relative values of different outcomes
The following outcomes were identified as critical outcomes for this review: hearing-specific health-related quality of life and adherence to chosen strategy.
Outcomes reporting health-related quality of life were identified as important for this review.
Quality of the clinical evidence
No clinical evidence was identified for this review.
Trade-off between clinical benefits and harms
The committee discussed the importance of having validated tools to support the decision-making process. The committee was aware of decision aids being marketed for use in the field of hearing loss but noted that these tools have not been validated for this particular use and for this specific patient group and therefore may not be fit for purpose.
The committee was aware of a research study currently being carried out looking at the Ida Institute motivational tools, but further research is needed for other types of tool such as option grids.
The committee agreed that decision aids could be helpful in supporting people when they are considering their goals and the range of management options available to them. A decision tool could be used in addition to information and advice provided by the practitioner at the time of the audiological assessment.
Trade-off between net clinical effects and costs
No health economic evidence was identified for this question.
The committee agreed that the recommendations made for the NICE guideline on patient experience are appropriate for people with hearing loss. These were found to be cost effective for a general population in the patient experience guideline, and the committee agrees that this will be equally so in people with hearing loss.
In particular, taking the time to offer appropriate support to a person with hearing loss and their carers or family members at an early stage can frequently save time in future. In the committee’s experience, people with hearing loss frequently require additional appointments due to not being able to hear the clinician or to participate fully in decision-making at the first appointment. There could therefore be a cost saving from ensuring that clinicians engage fully with people with hearing loss on all occasions.
Other considerations The committee considered the recommendations for shared decision-making in the NICE guideline on patient experience to be relevant and applicable to people with hearing loss. This outlines supporting the person when considering different options which is directly applicable when discussing the different interventions available for hearing difficulties and making decisions on the most appropriate strategy. The committee noted the emphasis placed there on supporting decisions around treatment options, however the principles outlined remain relevant to hearing loss.
2

Hearing loss Assistive listening devices
© NICE 2017. All rights reserved. Subject to Notice of rights. 188
14 Assistive listening devices 1
Introduction 14.1 2
The main management for permanent hearing loss is hearing aids. However, there are other devices, 3 known as assistive listening devices (ALDs) that can help an individual detect sounds or understand 4 speech. ALDs can be used in conjunction with hearing aids, or instead of hearing aids. 5
Assistive listening devices such as loop systems, FM/RM radio aids, personal communicators and 6 newer devices such as streamers and apps, are designed to improve access to speech and help 7 individuals to communicate. Some facilitate access to music and enhance recreational pursuits such 8 as streamers or TV amplifiers. These ALDs function by improving the signal to noise ratio, thus 9 enhancing speech. 10
Other ALDs alert the person with hearing loss to environmental sounds and these include alarm 11 clocks, doorbell sensors, baby alarms and smoke detectors, which use flashing lights, vibrators or 12 loud sounds. 13
ALDs are sometimes provided by the NHS, social care services or the fire service, and amongst these 14 devices are those that are important for safety such as smoke alarms. Provision will vary across 15 England and the individual needs to approach the local services for advice. Those in work may be 16 able to get necessary equipment through Access to Work while students are frequently supported by 17 the Disabled Student’s Allowance. Other ALDs, such as streamers or apps, are purchased by the 18 hearing aid user as required. 19
There is uncertainty about the effectiveness of ALDs, when they should be recommended and how 20 individuals should access them as part of management of their hearing difficulties. This chapter 21 examines the clinical and cost effectiveness of assistive listening devices to support communication. 22
Review question: What is the clinical and cost effectiveness of 14.223
assistive listening devices (such as loops) to support 24
communication? 25
For full details see review protocol in appendix C. 26
Table 79: PICO characteristics of review question 27
Population Adults aged 18 and over with hearing loss
Interventions Assistive listening devices FM / RF radio frequency modulators
telephone/television amplifiers
amplifiers for telephone/doorbell/smoke detector
loop system (personal or in-built)
telecoils
hearing aid apps
Bluetooth devices
PSAPs (personal sound amplification products)
Comparisons ALDs compared to each other
ALDs compared to hearing aids
Conventional hearing aids compared to hearing aids in conjunction with amplification devices such as FM and smartphone apps
Outcomes Critical:

Hearing loss Assistive listening devices
© NICE 2017. All rights reserved. Subject to Notice of rights. 189
Hearing-specific health-related quality of life
Hearing Handicap Inventory for the Elderly (HHIE) or HHI for Adults (HHIA)
Quantified Denver Scale of Communication (QDS)
Auditory Disability Preference – Visual Analog Scale (ADPI-VAS)
Device Orientated Subjective Outcome Scale
Any questionnaire not specified above that is relevant
Health-related quality of life
Health Utilities Index Mark 3 (HUI-3)
EQ-5D
SF-36
Glasgow Benefit Inventory (GBI)
WHO Disability Assessment Schedule (WHODAS)
Self-Evaluation of Life Function (SELF)
Any questionnaire not specified above that is relevant
Listening ability
Abbreviated Profile of Hearing Aid Benefit (APHAB)
Speech, Spatial and Qualities of Hearing (SSQ)
Glasgow Hearing Aid Benefit Profile (GHABP) residual disability subscale
Speech intelligibility (BKB, HINT, QuickSIN)
Ease of listening/listening effort
Important:
Any outcomes reporting:
Restricted participation or activity limitation
Social interactions, employment (including voluntary work) and education
Study design Systematic review of RCTs and RCTs
14.2.1 Clinical evidence 1
A systematic review of RCTs was conducted to search for evidence on the effectiveness of assistive 2 listening devices that can help support communication of patients with hearing loss. The 3 interventions of interest included standalone devices as well as add-on devices that provide 4 additional features to conventional hearing aids. 5
One study was included in the review: McInerney 2013.67 This is summarised in Table 80 below. 6 Evidence from this study is summarised in the clinical evidence summary below (Table 81). See also 7 the study selection flow chart in appendix E, forest plots in appendix K, study evidence tables in 8 appendix H, GRADE tables in appendix J and excluded studies list in appendix L. 9
Table 80: Summary of studies included in the review 10
Study Intervention and comparison Population Outcomes Comments
McInerney 2013
67
Assistive listening device (Sonic Ear: a wired assistive listening system composed of headphones, an amplifier and a
Elderly patients recruited from retirement homes. Patients with hearing impairment were randomised and allocated into one of
Communication efficiency measured as the number of observed communication breakdowns
USA study
Funding not stated

Hearing loss Assistive listening devices
© NICE 2017. All rights reserved. Subject to Notice of rights. 190
Study Intervention and comparison Population Outcomes Comments
microphone wired to each other)
Compared to no assistive listening device
two groups (with and without ALD) and those without hearing impairment were randomised into one of two groups (with and without ALD). Groups consisted of: HL with ALD = 7 HL without ALD = 5 No HL with ALD = 5 No HL without ALD = 5
n=27 (1 excluded due to MMSE score <24, 4 excluded due to impacted cerumen)
Overall: Age - Mean (range): 82.45 years (70-93). Gender (M:F): 86.4% Female
In the hearing loss with/without ALD-Age (SD), %female:
HL/ALD: n=7
82 (9.3), 58 % F
HL/no ALD n=5
85 (7.8), 100% F
1

Assistive listen
ing d
evices
Hearin
g loss
© N
ICE 2
01
7. A
ll rights reserved
. Sub
ject to N
otice o
f rights.
19
1
Table 81: Clinical evidence summary: assistive listening devices compared to no assistive listening devices 1
Outcomes
No of Participants (studies) Follow-up
Quality of the evidence (GRADE)
Relative effect (95% CI)
Anticipated absolute effects
Risk with No assistive listening devices Risk difference with Assistive listening devices (95% CI)
Number of communication breakdowns
12 (1 study)
LOWa
due to risk of bias
The mean number of communication breakdowns in the control groups was 12.6
The mean number of communication breakdowns in the intervention groups was 11.03 lower (16.77 to 5.29 lower)
a Downgraded 2 increments because the evidence was at very high risk of bias
2
3

Hearing loss Assistive listening devices
© NICE 2017. All rights reserved. Subject to Notice of rights. 192
14.2.2 Economic evidence 1
No relevant health economic studies were identified. 2
See also the health economic study selection flow chart in appendix F. 3
14.2.3 Evidence statements 4
Clinical 5
There was a clinically important benefit of ALDs for reducing the number of communication 6 breakdowns (low quality evidence, 1 study). 7
Economic 8
No relevant economic evaluations were identified. 9
14.2.4 Recommendations and link to evidence 10
Recommendations 25. Give adults with hearing loss information about assistive listening devices such as personal loops, personal communicators, TV amplifiers, telephone devices, smoke alarms, doorbell sensors, and technologies such as streamers and apps.
26. Tell adults with hearing loss about organisations that can demonstrate and provide advice on how to obtain assistive listening devices, such as social services, the fire service, or the government through its Access to Work or Disabled Student Allowance programmes.
Research recommendation
What is the clinical and cost effectiveness of assistive listening devices (ALDs) compared to other devices, combination of devices or no intervention to support adults with hearing loss?
Relative values of different outcomes
The guideline committee considered the following outcomes as critical: hearing-specific health-related quality of life including the Hearing Handicap Inventory for the Elderly (HHIE), Health-related quality of life including the Health Utilities Index Mark 3 (HUI-3), and listening ability including the Abbreviated Profile of Hearing Aid Benefit (APHAB) and the Glasgow Hearing Aid Benefit Profile (GHABP) residual disability subscale.
Outcomes reporting restricted participation or activity limitation and social interactions, employment (including voluntary work) and education were considered important outcomes.
Quality of the clinical evidence
One study was included in this review. This study compared the use of Sonic Super Ear (an ALD composed of headphones, an amplifier and a microphone wired to each other) to no ALD in a US care home population, with mild or moderate hearing loss.
The outcome reported in this study was communication efficiency as indicated by the number of communication breakdowns. This was considered an outcome that informs the participation or activity limitation outcome prioritised by the committee.
The quality of the evidence for this outcome was at very high risk of bias mainly due to the small sample size and to the selection of participants.
The committee understood that while there are significant differences between UK and US care homes in that in the US people enter retirement homes at an earlier age and are generally more active and in better health than those entering care homes in

Hearing loss Assistive listening devices
© NICE 2017. All rights reserved. Subject to Notice of rights. 193
the UK, nevertheless the results of this research has relevance to older people in the UK who find communication difficult because of hearing difficulties and do not wear hearing aids.
Provision of ALDs as described in this paper would be most useful for older people in care homes, GP or out-patient consultations or emergency settings, to improve communication between the patient and the healthcare provider.
Trade-off between clinical benefits and harms
The only evidence available was from 1 small study. Although this showed that there was a clinical benefit to using an assistive device, it was in a US retirement home setting looking at one specific device. There was no evidence on any of the other potentially useful devices that the committee was interested in. Therefore, the committee also used their clinical experience and knowledge and co-opted a Social Worker in order to make more generalisable recommendations.
The committee noted that it is a legal requirement for provision to be made such that those with a disability have equality of access to medical services, where possible, and consequently loop systems are generally provided in hospital reception areas. However there is not always suitable provision in the clinical areas where loops would be impractical. This is of particular concern in emergency situations, but is also an issue on wards and in clinics when patients are unable to hear what is said to them. Personal listening devices are invaluable in these situations but it is not clear if they are widely provided and, if provided, used when needed.
Where the person’s safety is assessed as being at risk, audiology services can refer the person to social services for further assessment for assistive listening devices to be provided in the person’s home. The committee agreed that currently liaison between health and social services does not happen routinely and, as a consequence, services are not joined up.
The committee noted the lack of evidence for ALDs in the workplace. However, based on professional experience, the committee highlighted the value of schemes such as Access to Work and the Disabled Student Allowance that fund assistive listening devices to enable equality of access in work and educational settings.
The committee agreed it would not be usual to prescribe a device like the Sonic Ear (described in the evidence review) for an individual with hearing loss, although such devices could be purchased by an NHS organisation and used by healthcare and social care professionals in a variety of settings. However technology is developing rapidly and personal amplification systems are becoming more accessible, for example, apps on mobile phones and it is important that people are given information on what is available. Most audiology departments would demonstrate and explain what assistive listening devices are available and how to access them. The committee noted that an appropriate time to explore continuing communication or listening difficulties would be at follow-up appointments following hearing aid provision and ALDs may a suitable topic to cover then.
Trade-off between net clinical effects and costs
No health economic evidence was identified for this question.
The recommendations made for this review concern giving advice to people with hearing loss regarding the benefits of ALDs, their availability and how to access them. Difference in the content of the advice will not have any economic impact but should improve quality of life for some people. It is assumed that such advice can be given relatively briefly during the course of routine appointments that a person with hearing loss will be having with healthcare professionals, and so this will not require additional appointments.
Apart from some safety devices (see below), ALDs are not given to patients by the NHS, and so these recommendations do not have any direct economic impact on the NHS. If people with hearing loss wish to follow up this advice and obtain relevant ALDs then these would need to be paid for either by social care services, or the user, or shared between the user and social care services. This guideline does not make any recommendations on what devices social care services should provide, and

Hearing loss Assistive listening devices
© NICE 2017. All rights reserved. Subject to Notice of rights. 194
whether these should be provided free or for a fee. The guideline does not recommend that people with hearing loss should self-purchase devices, although the committee recognise that some may wish to do so and this would impose direct costs upon them. The committee cannot comment on the value that users would receive from such purchases due to the lack of clinical and economic evidence for this review.
The committee is hence content that the recommendations made in this review to advise people with hearing loss regarding ALDs will be cost effective compared to not giving such advice.
Other considerations It was noted that there is a limit to the equipment that can be provided by the NHS. Social services or the fire service provide equipment as safety measures in people’s own homes such as flashing or vibrating smoke detectors or provide information and advice on other useful ALDs, for example personal loops, doorbell and telephone amplifiers and baby monitors. Charging for devices varies.
1

Hearing loss Hearing aids
© NICE 2017. All rights reserved. Subject to Notice of rights. 195
15 Hearing aids 1
Introduction 15.1 2
Hearing loss affects a large portion of the general population. In the majority of cases, hearing loss in 3 adults affects both ears and is permanent. The primary management option for permanent hearing 4 loss is hearing aids. All hearing aids consist of a microphone, an amplifier powered by a battery, a 5 receiver, and a means to route the amplified sound into the ear canal. 6
The general goal of prescribing and fitting hearing aids is to improve functional auditory capacity and 7 restore good communication skills. Hearing aids partially overcome the deficits associated with 8 hearing loss by restoring the audibility of sound and improving the intelligibility of speech. Because 9 hearing aids cannot improve deficits in frequency, temporal and spatial resolution that may 10 accompany the most common causes of permanent hearing loss, an adult with hearing loss may 11 continue to experience some difficulties, even when wearing hearing aids. 12
Prescribing and fitting hearing aids to both ears (bilateral fitting) has the potential to provide binaural 13 stimulation. The benefits of binaural stimulation include improved: (i) intelligibility of speech in 14 background noise, (ii) sound localisation, and (iii) sound quality. It also has the potential to avoid 15 deficits that may develop over time if only 1 hearing aid is fitted and the unaided ear is deprived of 16 stimulation. On the other hand, potential disadvantages of bilateral fitting include additional cost (to 17 the NHS), 2 devices being potentially too complex for some people to use, and binaural interference 18 (reduced speech intelligibility compared to performance with a single device). Quantifying the 19 advantages and disadvantages of fitting 2 hearing aids is not straightforward. For this reason, it is not 20 always clear who will benefit (and accept) 2 hearings aids. Although the provision and fitting of 21 bilateral hearing aids is considered the norm, this is based largely on the theoretical benefits. The 22 intention of this chapter is to review the evidence on the clinical and cost effectiveness of providing 23 hearing aids and to develop recommendations for their use in adults with hearing loss. 24
Review question: What is the clinical and cost effectiveness of 15.225
hearing aids for mild to moderate hearing loss in adults who have 26
been prescribed at least 1 hearing aid? 27
For full details see review protocol in appendix C. 28
Table 82: PICO characteristics of review question 29
Population Adults age 18 years and over who have mild to moderate hearing loss
Hearing loss defined either:
Qualitatively as ‘mild’ or ‘moderate’, OR
Quantitatively following WHO definitions of mild and moderate hearing loss (mild: 26–40 dB HL inclusive; moderate: 41–70 dB HL inclusive)
Intervention Acoustic hearing aids, irrespective of the type of technology (analogue or digital)
Comparisons Passive control (placebo; no intervention; or waiting list) OR
Active control (information or education only, listening tactics and communication training; assistive listening devices; or auditory training)
Outcomes Critical outcomes:
1. Hearing-specific health-related quality of life (key domain: participation)
2. Adverse effects: Pain

Hearing loss Hearing aids
© NICE 2017. All rights reserved. Subject to Notice of rights. 196
Important outcomes:
3. Health-related quality of life
4. Listening ability
5. Adverse effects: Noise-induced hearing loss
Study design RCT
Systematic review of RCTs
15.2.1 Clinical evidence 1
A recent Cochrane review 36 was identified that addressed our clinical question. The Cochrane review 2 aimed to identify the clinical effectiveness of hearing aids versus no hearing aids for mild to 3 moderate hearing loss. Five studies were included in the review.2 ,49 ,65 ,68 ,70 Two of these studies were 4 deemed to be inappropriate for inclusion within the meta-analysis but otherwise met the review 5 protocol and are summarised narratively below. It was not possible to include the Scaling 6 Assessment reported by Melin 198768 in the meta-analysis as no usable data were reported for either 7 the intervention or the comparator groups. However, the study reported a significant improvement 8 for the hearing aid versus unaided comparator for the Scaling Assessment for easy to difficult hearing 9 situations. In addition to this, the data on health-related quality of life reported by Adrait 20172 was 10 not included in the meta-analysis due to the indirectness of the population, which was exclusively 11 adults with Alzheimer’s disease. The committee agreed that this population was a distinctly different 12 clinical population from typical first-time hearing aid users. However, this study was the only study 13 that measured adverse effects and therefore was reported in the clinical evidence table. 14
The studies with data suitable for meta-analysis are summarised in Table 83 below. Evidence from 15 these studies is summarised in the clinical evidence summary (Table 84). See also the study selection 16 flow chart in appendix E, forest plots in appendix K, study evidence tables in appendix H, GRADE 17 tables in appendix J and excluded studies list in appendix L. 18
The Cochrane review 36 was incorporated into this guideline in the following ways: 19
Article selection and risk of bias assessment per study were directly adopted without further 20 checking. 21
GRADE assessments for risk of bias, imprecision and inconsistency per outcome were 22 checked. If differences with the standard methodology used within this guideline were 23 found, GRADE ratings and subgroup analyses were amended accordingly to ensure 24 consistency across the reviews within this guideline. 25
682 26
Table 83: Summary of studies included in the review 27
Study Intervention and comparison Population Outcomes Comments
Humes 2017
49
Intervention (n=108): Active hearing aids, behind-the-ear, fully digital. Bilateral fits. Two service delivery models combined.
Control (n=51): placebo hearing aids, behind-the-ear,
. Bilateral fits.
n=164 randomised
n=154 completed
People aged 55 to 79 years with no prior hearing aid experience with pure-tone audiometry consistent with age-related bilaterally
Hearing-specific health-related quality of life
Listening ability
Multiple outcomes reported but only hearing-specific HRQoL and listening ability relevant.

Hearing loss Hearing aids
© NICE 2017. All rights reserved. Subject to Notice of rights. 197
Study Intervention and comparison Population Outcomes Comments
symmetrical hearing loss
Age (mean (SD): 69.1 (6.1)
Gender (m/f): 92/72
Country: USA
McArdle 2005
65
Intervention (n=189): hearing aids, in-the ear, analogue or fully digital.
Control (n=191): waiting list controls, no hearing aids up to 10 weeks post baseline
n=380 randomised
n=362 completed
People with PTA≥30 dB HL in better ear.
No prior HA experience.
Eligible for HAs through VA
Age (mean (SD)): 69.4 (9.0)
Gender (m/f): 374/16
Country: USA
Hearing-specific and general health-related quality of life
Listening ability
Setting was Veterans Administration (VA) medical centres in the USA.
Overwhelmingly male sample.
Mulrow 1990
70
Intervention (n=95): hearing aids, in-the-ear, unilateral fits, typically to the worst hearing ear
Control (n=99): waiting list controls, no hearing aids
n=194 randomised
n= 188 completed
People with PTA at 2 kHz, ≥40 dB in better hearing ear
Aged>64 years
Gender (% m): intervention: 100%; control: 99%
Country: USA
Hearing-specific and general health-related quality of life
Setting was Veterans Administration medical centres in the USA. Overwhelmingly male sample.
1

Hearin
g aids
Hearin
g loss
© N
ICE 2
01
7. A
ll rights reserved
. Sub
ject to N
otice o
f rights.
19
8
Table 84: Clinical evidence summary: Hearing aids versus no hearing aids 1
Outcomes
No of Participants (studies) Follow-up
Quality of the evidence (GRADE)
Relative effect (95% CI)
Anticipated absolute effects
Risk with Control Risk difference with Hearing aids versus no/placebo hearing aids (95% CI)
Hearing-specific health-related quality of life assessed with HHIE
(range 0-100, lower is better)
722 (3 studies) 6 weeks to 4 months
MODERATEa
due to risk of bias The mean hearing-specific health-
related quality of life in the control groups was 39
The mean hearing-specific health-related quality of life in the intervention groups was 26 lower (42 to 11 lower)
Health-related QoL
assessed with: WHO-DAS II (range 0 to 100) and the SELF (range 54 to 216)
Lower is better
568
(2 studies)
2 months to 16 weeks
MODERATE
- - SMD 0.38 lower (0.55 lower to 0.21 lower)
Lower score indicates better HRQoL. The SMD corresponds to a small effect size favouring hearing aids, which is equivalent to a 6-point decrease (9- to 3-point decrease) on the 0 to 100 scale of the WHO-DAS II
4.
Listening ability
assessed with: PHAP (range 0 to 1) and APHAB (range 0 to 100)
Lower is better
534
(2 studies)
6 weeks to 2 months
MODERATE
- - SMD 1.88 lower(3.24 lower to 0.52 lower)
Lower score indicates improved listening ability. The SMD corresponds to a large effect size favouring hearing aids, which is equivalent to a 29-point decrease (50- to 8-point decrease) on the 0 to 100 scale of the APHAB
5.
Adverse effect - pain 48
(1 study)
VERY LOW3
No adverse events reported There was too little information to estimate the risk of pain.
Adverse effect - noise-induced hearing loss
48
(1 study)
VERY LOW3
No adverse events reported in There was too little information to estimate the risk of noise-induced hearing loss.
a Downgraded by 1 increment if the majority of the evidence was at high risk of bias, and downgraded by 2 increments if the majority of the evidence was at very high
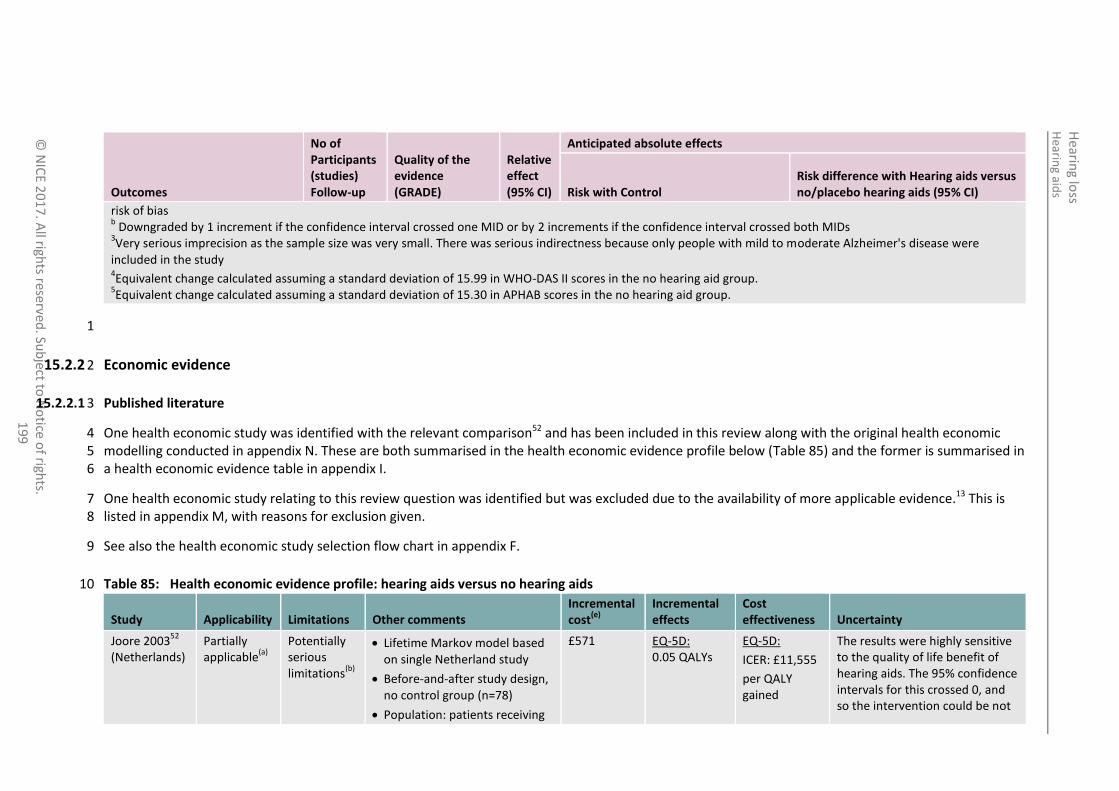
Hearin
g aids
Hearin
g loss
© N
ICE 2
01
7. A
ll rights reserved
. Sub
ject to N
otice o
f rights.
19
9
Outcomes
No of Participants (studies) Follow-up
Quality of the evidence (GRADE)
Relative effect (95% CI)
Anticipated absolute effects
Risk with Control Risk difference with Hearing aids versus no/placebo hearing aids (95% CI)
risk of bias b Downgraded by 1 increment if the confidence interval crossed one MID or by 2 increments if the confidence interval crossed both MIDs
3Very serious imprecision as the sample size was very small. There was serious indirectness because only people with mild to moderate Alzheimer's disease were
included in the study 4Equivalent change calculated assuming a standard deviation of 15.99 in WHO-DAS II scores in the no hearing aid group.
5Equivalent change calculated assuming a standard deviation of 15.30 in APHAB scores in the no hearing aid group.
1
15.2.2 Economic evidence 2
15.2.2.1 Published literature 3
One health economic study was identified with the relevant comparison52 and has been included in this review along with the original health economic 4 modelling conducted in appendix N. These are both summarised in the health economic evidence profile below (Table 85) and the former is summarised in 5 a health economic evidence table in appendix I. 6
One health economic study relating to this review question was identified but was excluded due to the availability of more applicable evidence.13 This is 7 listed in appendix M, with reasons for exclusion given. 8
See also the health economic study selection flow chart in appendix F. 9
Table 85: Health economic evidence profile: hearing aids versus no hearing aids 10
Study Applicability Limitations Other comments Incremental cost
(e)
Incremental effects
Cost effectiveness Uncertainty
Joore 200352
(Netherlands)
Partially applicable
(a)
Potentially serious limitations
(b)
Lifetime Markov model based on single Netherland study
Before-and-after study design, no control group (n=78)
Population: patients receiving
£571 EQ-5D: 0.05 QALYs
EQ-5D:
ICER: £11,555
per QALY gained
The results were highly sensitive to the quality of life benefit of hearing aids. The 95% confidence intervals for this crossed 0, and so the intervention could be not

Hearin
g aids
Hearin
g loss
© N
ICE 2
01
7. A
ll rights reserved
. Sub
ject to N
otice o
f rights.
20
0
Study Applicability Limitations Other comments Incremental cost
(e)
Incremental effects
Cost effectiveness Uncertainty
first hearing aid(s)
Effectiveness: HRQoL measured using EQ-5D (both questionnaire and VAS) before hearing aid fitting and at 4 months. This was used as benefit of hearing aids
EQ-5D VAS: 0.03 QALYs
EQ-5D VAS:
ICER: £17,358 per QALY gained
effective or cost effective, or at the other end of the range the ICER could be £4,339 per QALY gained. Varying other parameters had only a moderate effect on the ICER.
NGC 2017 (UK)
(see appendix N)
Directly applicable
(c)
Minor limitations
(d)
Lifetime Markov model
Population: people reporting hearing problems. Patients offered hearing aids compared to those not offered aids
Effectiveness: HRQoL benefit based on UK before-and-after study using HUI3 (Barton 2004
10)
£1,809 0.37 ICER: £4,912 per QALY gained
The results were most sensitive to the quality of life benefit of hearing aids. When this was halved the ICER doubled to £9,840 per QALY gained, still well below £20,000 per QALY gained. Changing all other parameters had only very small effects on the ICER (below £6,600 per QALY gained in each case).
Abbreviations: EQ-5D: EuroQol 5 dimensions (scale: 0.0 [death] to 1.0 [full health]); HRQoL: health-related quality of life; HSQoL: hearing-specific quality of life; HUI3: health utilities index 1 mark 3; ICER: incremental cost-effectiveness ratio; QALYs: quality-adjusted life years; VAS: visual analogue scale (scale 0.0 to 1.0) 2 Abbreviations: ICER: incremental cost-effectiveness ratio; QALY: quality-adjusted life years 3 (a) Study conducted in Netherlands. Hearing assessment pathway similar but with some differences to UK. Payment methods different (patients responsible for some costs) but analysis 4
includes all costs that would be covered by UK NHS. 5 (b) Costs are based on 1998 Dutch costs, in particular hearing aids were very much more expensive than currently in the UK; however the model also assumes hearing aids are replaced much 6
less frequently (8-15 years) than currently in the UK, and that only 25% of people will have 2 hearing aids fitted and paid for. Benefit of hearing aids was measured by an in-trial analysis 7 of 78 patients, using EQ-5D which is known to be insensitive to the effect of hearing loss of quality of life. This gave a benefit of hearing aids greater than that measured in the UK using 8 EQ-5D but half to a third of the benefit measured in the UK using HUI3. Part-funded by hearing aid manufacturers. 9
(c) Designed for this guideline using a UK NHS setting 10 (d) Some parameters estimated by expert consensus – conservative estimates were used. Model simplifies reality by reducing number of transitions between hearing aid use and non-use, but 11
this has no significant effect on the results. 12 (e) 1998 Euros, presented here as 1998 UK pounds, converted using 1998 purchasing power parities
80 13
14

Hearin
g aids
Hearin
g loss
© N
ICE 2
01
7. A
ll rights reserved
. Sub
ject to N
otice o
f rights.
20
1
15.2.2.2 Original cost-effectiveness analysis – summary 1
An original health economic model was constructed in order to conduct cost–utility analysis for this question and the review question regarding early 2 versus late management of hearing loss (see chapter 8). These questions were agreed by the guideline committee to be the highest priorities for original 3 economic analysis in this guideline due to the very large number of people using or potentially eligible for hearing aids, and the lack of existing health 4 economic research in this area. 5
Full details of the analysis can be found in appendix N. It included a comparison between a cohort of people given a hearing assessment and offered 6 hearing aids, if eligible, immediately after first presenting with hearing difficulties (early treatment) and a cohort who never undertook a hearing 7 assessment and were never offered hearing aids (no treatment). 8
The base case probabilistic results, reflecting the costs and outcomes for men aged 65 at the start of the analysis over a lifetime horizon, are in Table 86. 9
Table 86: Results of hearing aids (early) versus no hearing aids, base case 10
Comparator Cost Incremental cost QALYs Incremental QALYs ICER (£/QALY)
No treatment £36 - 7.59 -
Early treatment £1,845 £1,809 7.96 0.37 £4,912
Sensitivity analysis found these results to be robust to variations in all the parameters investigated in the analysis, including the age of the participants at 11 the start of the analysis, their sex, the proportions not suitable for hearing aids or who decline to use hearing aids, rates at which participants stop using 12 hearing aids, and the magnitude of improvement in quality of life caused by hearing aid use: the ICER was below £10,000 per QALY gained in every case. 13
15.2.3 Evidence statements 14
Clinical 15
There was a clinically important benefit of hearing aids for hearing-specific health-related quality of (HHIE; moderate quality evidence, 3 studies), 16 overall health-related quality of life as measured by the WHO Disability Assessment Schedule II scale and the Self-evaluation of Life Function (moderate 17 quality evidence, 2 studies), for overall listening ability as measured by the profile of hearing aid performance and the APHAB (moderate quality 18 evidence, 2 studies). 19
There was no clinically important difference in health-related quality of life as measured by self-evaluation of life function (low quality evidence, 1 20 study). 21

Hearin
g aids
Hearin
g loss
© N
ICE 2
01
7. A
ll rights reserved
. Sub
ject to N
otice o
f rights.
20
2
No evidence was found comparing hearing aids to an active control (information or education only, listening tactics and communication training; 1 assistive listening devices; or auditory training) or for the outcomes of pain or noise-induced hearing loss. 2
Economic 3
One cost–utility analysis found that hearing aids were cost effective compared to no hearing aids for managing hearing loss (ICER: £11,555 per QALY 4 gained). This analysis was assessed as partially applicable with potentially serious limitations. 5
One original cost–utility analysis found that hearing aids were cost effective compared to no hearing aids for managing hearing loss (ICER: £4,912 per 6 QALY gained). This analysis was assessed as directly applicable with minor limitations. 7
15.2.4 Recommendations and link to evidence 8
Recommendations 27. Offer hearing aids to adults whose hearing loss affects their ability to communicate.
Relative values of different outcomes
The following outcomes were identified as critical outcomes for this review: hearing-specific health-related quality of life (key domain: participation) and the specific adverse event of pain. Important outcomes included health-related quality of life, listening ability and the specific adverse event of noise-induced hearing loss.
Quality of the clinical evidence
The quality of the evidence was moderate for hearing-specific health-related quality of life and for health related quality of life and very low for the outcomes relating to adverse events (pain and noise induced hearing loss). All of the outcomes were downgraded for a high risk of bias. This was mainly due to a high risk of selection, performance or detection biases. These biases are widely acknowledged to be problematic within hearing aid intervention studies as the blinding of patients and outcome assessors can be difficult to achieve.
26 ,27 One of the studies had a follow-
up period of 6 weeks but the committee agreed that the evidence should not be downgraded for indirectness as there is unlikely to be a significant clinical difference between a 6 week follow-up and an 8 week follow up as specified in the protocol.
For the outcome of hearing-specific health-related quality of life where participation is the key domain, moderate quality evidence showed that hearing aids had a large beneficial effect in reducing participation restrictions. There were significant differences in the size of effects across studies. The effects reported by 2 studies in Veterans Administration settings were similar but more than twice the size of the

Hearin
g aids
Hearin
g loss
© N
ICE 2
01
7. A
ll rights reserved
. Sub
ject to N
otice o
f rights.
20
3
effect reported by the third study which was set in a university hospital clinic. However, all 3 studies individually reported large beneficial effects that favoured hearing aids, meaning that while further evidence may change the size of the overall effect on hearing-specific health-related quality of life, there is high confidence in the magnitude and direction of the effect.
For the outcome of health-related quality of life as measured by the WHO Disability Assessment Schedule II (WHO-DAS II) scale 1 study showed a significant benefit of hearing aids compared to placebo or no hearing aids. Using the Self-evaluation of Life Function, another study found no significant beneficial effect of hearing aids. Overall, moderate quality evidence showed a small overall beneficial effect of hearing aids.
For listening ability, moderate quality evidence showed a large beneficial effect of hearing aids compared to unaided/placebo conditions based on 1 study that used the APHAB and another study that used the PHAP.
The planned subgroup analyses (age, sex, and degree of hearing loss) could not be performed as data from these subgroups were not reported.
No evidence was found comparing hearing aids to an active control (information or education only, listening tactics and communication training; assistive listening devices; or auditory training) or for the outcomes of pain or noise-induced hearing loss.
Trade-off between clinical benefits and harms
The committee noted the limitations of the studies but agreed that the evidence demonstrated that people with mild to moderate hearing loss benefitted from having hearing aids as this improved their listening ability and quality of life. The committee acknowledged the difference hearing aids can make by enabling people to participate in everyday situations and the impact this can have in improving the quality of life for people with hearing difficulties.
The committee considered that having hearing aids at an early stage of their hearing loss enables people to adjust more easily to using the aids. There is anecdotal and some study evidence that people are not being referred early enough for further assessment when hearing loss is first suspected (see also chapter 8 on early versus delayed management of hearing loss).
The committee noted that reporting for mild and moderate hearing loss had not been clearly separated in the studies.

Hearin
g aids
Hearin
g loss
© N
ICE 2
01
7. A
ll rights reserved
. Sub
ject to N
otice o
f rights.
20
4
Trade-off between net clinical effects and costs
One published economic evaluation was identified for this question. This measured the benefit to quality of life in 78 patients given hearing aid(s) for the first time and used this benefit in a lifetime model of hearing aid use. It found that hearing aid use was cost effective compared to no hearing aids at a cost-effectiveness threshold of £20,000 per QALY gained (ICER: £11,555 per QALY gained). However, the committee noted that the costs used in the study differed from current UK costs: in particular the cost used for hearing aids was much higher than UK costs. It also assumed a much longer time between replacement of hearing aids (at least 8 years), and a lower rate of fitting of 2 hearing aids (only 25%) than currently expected in the UK. Consequently the results of this analysis cannot be relied upon to relate to the current UK context.
The committee therefore also considered the relevance of the original economic modelling conducted for the early versus delayed management question in this guideline. By comparing both of the intervention arms (‘early’ and ‘delayed’) against the no treatment arm, the benefit of referring for assessment and, where suitable, fitting hearing aids is demonstrated. This analysis showed that either early or delayed fitting of hearing aids would be highly cost effective compared to no treatment at the NICE cost-effectiveness threshold of £20,000 per QALY gained, with ICERs of £4,912 per QALY and £5,172 per QALY respectively.
The original modelling was not able to look into the effect of using different hearing loss thresholds, as there is no comparative evidence on the benefit to quality of life of improving hearing for people with different levels of hearing loss. However, sensitivity analysis which dramatically reduced the benefits of hearing aids for the whole population, and sensitivity analysis that increased the proportion of people either not suitable for hearing aids or dropping out after being fitted with hearing aids indicate that even if those people with lower levels of hearing loss benefit by a smaller amount than the average benefit expected in the model, the intervention would still be very cost effective overall.
In addition, the committee noted that there is no standard universal definition of hearing loss. While the BSA criteria fit best with current understanding and practice in the UK, in the Cochrane review the international WHO classification was used. The committee agreed that decision-making on whether to fit hearing aids should not be based on a threshold measurement alone but on a combination of hearing measurement and communication difficulties. The committee therefore agreed that audiologists should be able to use their expertise to assess whether a person would

Hearin
g aids
Hearin
g loss
© N
ICE 2
01
7. A
ll rights reserved
. Sub
ject to N
otice o
f rights.
20
5
benefit clinically from using hearing aid(s) due to their hearing loss, and if so they should offer hearing aid(s) and discuss this with the person. The committee agreed that provision of hearing aids to all who would benefit from them will be cost effective at a cost-effectiveness threshold of £20,000 per QALY gained.
Other considerations The committee acknowledged that there is variation across the UK in whether people with mild to moderate hearing losses receive hearing aid(s) and consider that the decision to fit should be based on need rather than on hearing thresholds. Furthermore, as amplification has been shown to have benefit and is cost effective, hearing aids should be offered at the first opportunity if the individual is likely to benefit.
The committee expressed concern that not providing hearing aids, and the care needed to use them effectively, to a person with an aidable hearing loss, raises serious questions of inequality of access. Hearing aids can make a difference to the ability of a person with hearing loss to communicate effectively and can thus reduce the impact of their impairment. Their impairment is permanent and even a mild hearing loss can have a significant effect on day-to-day functioning.
Review question: What is the clinical and cost effectiveness of fitting 1 hearing aid compared with 15.3 1
fitting 2 hearing aids for people when both ears have an aidable hearing loss?a 2
For full details see review protocol in appendix C. 3
Table 87: PICO characteristics of review question 4
Population Adults age 18 years and over with bilateral hearing loss, where both ears would be suitable for amplification
Intervention 2 hearing aids (bilateral)
Comparison 1 hearing aid, aid fitted to either the right or left ear (unilateral)
Outcomes Critical outcomes:
a This review was developed in collaboration with Cochrane. 92. Schilder AGM, Chong LY, Ftouh S, Burton MJ. Bilateral versus unilateral hearing aids for bilateral hearing impairment in
adults. Cochrane Database of Systematic Reviews, 2017, Issue 11. Art. No.: CD012665. DOI: 10.1002/14651858.CD012665.
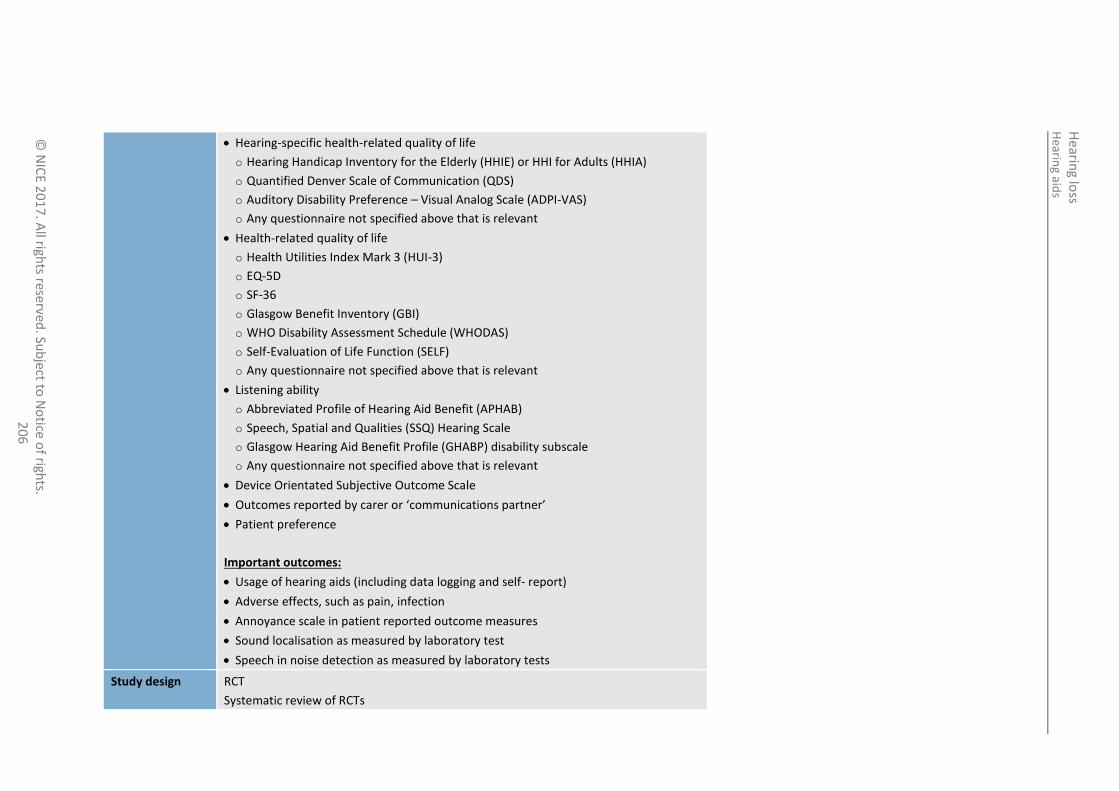
Hearin
g aids
Hearin
g loss
© N
ICE 2
01
7. A
ll rights reserved
. Sub
ject to N
otice o
f rights.
20
6
Hearing-specific health-related quality of life
o Hearing Handicap Inventory for the Elderly (HHIE) or HHI for Adults (HHIA)
o Quantified Denver Scale of Communication (QDS)
o Auditory Disability Preference – Visual Analog Scale (ADPI-VAS)
o Any questionnaire not specified above that is relevant
Health-related quality of life
o Health Utilities Index Mark 3 (HUI-3)
o EQ-5D
o SF-36
o Glasgow Benefit Inventory (GBI)
o WHO Disability Assessment Schedule (WHODAS)
o Self-Evaluation of Life Function (SELF)
o Any questionnaire not specified above that is relevant
Listening ability
o Abbreviated Profile of Hearing Aid Benefit (APHAB)
o Speech, Spatial and Qualities (SSQ) Hearing Scale
o Glasgow Hearing Aid Benefit Profile (GHABP) disability subscale
o Any questionnaire not specified above that is relevant
Device Orientated Subjective Outcome Scale
Outcomes reported by carer or ‘communications partner’
Patient preference
Important outcomes:
Usage of hearing aids (including data logging and self- report)
Adverse effects, such as pain, infection
Annoyance scale in patient reported outcome measures
Sound localisation as measured by laboratory test
Speech in noise detection as measured by laboratory tests
Study design RCT
Systematic review of RCTs

Hearin
g aids
Hearin
g loss
© N
ICE 2
01
7. A
ll rights reserved
. Sub
ject to N
otice o
f rights.
20
7
If no RCTs or systematic reviews of RCTs are identified we will include prospective or retrospective (data bases) cohort studies and case–control studies with multivariate analyses that adjust for the following key confounders:
Age
Hearing (loss) level
Types of devices
Degree of asymmetry
No minimum duration of hearing aid use or follow-up was applied as an inclusion criteria to consider studies for review. However, evidence was 1 downgraded for indirectness of evidence if participants had used the hearing aids for 6 weeks or less. The rationale is a period of adjustment is important 2 before the full effects of hearing aid fitting can be properly observed and evaluated. 3
15.3.1 Clinical evidence 4
Four studies (5 papers) were included in the review22 ,34 ,95 ,106 40 these are summarised in Table 88 below. Evidence from these studies is summarised in the 5 clinical evidence summary below (Table 88). See also the study selection flow chart in appendix E, forest plots in appendix K, study evidence tables in 6 appendix H, GRADE tables in appendix J and excluded studies list in appendix L. 7
Table 88: Summary of studies included in the review 8
Study Population Intervention and comparison Outcomes Comments
Cox 201122
(n=94/100)(a)
Symmetrical bilateral (b)
hearing loss 30–80 dB
No preference, most were new patients
51–83 years old
No exclusion for tinnitus
Bilateral versus unilateral (either side) – digital hearing aids
Preference Crossover study – USA
“subjects were paid for their participation”
Vaughan-Jones1993
106
(n=55/64)
Mean pure tone worse than 25 dB hearing loss
Never used hearing
Bilateral versus unilateral (either side) – “standard range of NHS
Preference Crossover study
UK – Scotland

Hearin
g aids
Hearin
g loss
© N
ICE 2
01
7. A
ll rights reserved
. Sub
ject to N
otice o
f rights.
20
8
Study Population Intervention and comparison Outcomes Comments
aids
45% had tinnitus
40–83 years old
hearing aids”
Stephens1991
95
(n=29/38)
≥30 dB in better ear – Never used hearing aids
50–65 years old
No exclusion for tinnitus
Bilateral versus unilateral (preferred side) – UK NHS BE18 post-aural HA
Preference Crossover study - Wales
Erdman1981
(n=30/30) 34
Noise induced hearing loss
23–58 years old
No exclusion for tinnitus
Bilateral versus unilateral, hearing aids used not described
Preference US Military personnel
Washington DC
Quasi alternation
Crossover study
(a) (n=x/y) denotes that x participants completed/provided data from analysis out of y participants recruited 1 (b) “Symmetric bilateral” not defined in study. The other studies had not excluded patients with asymmetric hearing loss, but it is unclear what percentage of patients had asymmetric 2
hearing loss and the magnitude of asymmetry was not reported. 3
Table 89: Clinical evidence summary: Bilateral versus unilateral hearing aids 4
Outcomes
No of Participants
(studies) Follow-up
Quality of the evidence (GRADE)
Relative effect (95% CI)
Anticipated absolute effects
Risk with one hearing aids Risk difference two hearing aids
Patient preference 178
(4 studies)
1 day to 10 weeks for each phase.
VERY LOWa,b,c
due to risk of bias, indirectness and imprecision
Preference for bilateral HA
Study 1: 54% (51/94) – crossover, 2:1 randomised to monoaural
Study 2: 40% (22/55) – crossover, 2:1 randomised to monoaural
Study 3: 55% (16/29) – crossover
Study 4: 77% (23/30) – crossover
Usage of hearing aids (including 56 VERY LOWa,b,c
“often or all the time”: 84% of “often or all the time”: 28% of responses

Hearin
g aids
Hearin
g loss
© N
ICE 2
01
7. A
ll rights reserved
. Sub
ject to N
otice o
f rights.
20
9
Outcomes
No of Participants
(studies) Follow-up
Quality of the evidence (GRADE)
Relative effect (95% CI)
Anticipated absolute effects
Risk with one hearing aids Risk difference two hearing aids
data logging and self- report) (1 study)
10 weeks in each phase (total 30 weeks)
due to risk of bias, indirectness and imprecision
responses in monoaural hearing aid phase
Sound localisation as measured by patient questionnaire
(improved, no difference, worse)
56
(1 study)
10 weeks in each phase (total 30 weeks)
VERY LOWa,b,c
due to risk of bias, indirectness and imprecision
“better when monoaurally aided” “18% found localisation worse when binaurally aided than when unaided”
Speech in noise detection as measured patient questionnaire (improved, no difference, worse)
56
(1 study)
10 weeks in each phase (total 30 weeks)
VERY LOW a,b,c
due to risk of bias, indirectness and imprecision
65% reported “improvement” in monoaural HA
43% reported “worse than when unaided”
a Downgraded by 1 increment if the majority of the evidence was at high risk of bias, and downgraded by 2 increments if the majority of the evidence was at very high risk of bias
b Downgraded by 1 or 2 increments because the majority of evidence was from an indirect time-point c Downgraded by 1 increment if the confidence interval crossed one MID or by 2 increments if the confidence interval crossed both MIDs
1
2

Hearing loss Hearing aids
© NICE 2017. All rights reserved. Subject to Notice of rights. 210
Table 90: Summary of preferences results 1
Study Prefer bilateral Reasons for preference Comments
Cox 201122
54% (51/94) Bilateral – Balance, quality, comfort (“more capable, secure, relaxed and safe”)
2:1 randomisation to unilateral.
Study investigated predictors using logistic regression. Four factors can predict with 66% accuracy.
Unilateral – Comfort (“feeling more normal and free, not closed in, plugged or cut off”), quality, meets need (good enough);
Vaughan-Jones 1993
106
39% (22/56) Not reported. 2: 1 randomisation to unilateral
No “association” was found between age, sex, pure tone audiometry and tinnitus. Appropriateness of statistical test used and power to detect association uncertain.
Stephens 1991
95
55% (16/29) reported for people for completed study
22/41 (54%) reported in paper of 10 year follow-up among people who had been screened
Bilateral - Acoustical reasons; clarity, localisation, loudness.
Reported worse hearing ability as measured using SHHI and audiometry in both and the worse ear as predictors of binaural choice, but appropriateness of statistical analysis uncertain.
Unilateral – convenience, acoustical, psychological, others
Erdman 198134
77% (23/30) Bilateral – “I can hear better”, “I can hear more easily”.
2

Hearing loss Hearing aids
© NICE 2017. All rights reserved. Subject to Notice of rights. 211
15.3.2 Economic evidence 1
15.3.2.1 Published literature 2
No relevant health economic studies were identified. 3
See also the health economic study selection flow chart in appendix F. 4
15.3.2.2 Original cost-effectiveness analysis 5
Given that this is an important question with a large economic impact for the NHS, but that no 6 published health economic evidence was found, the guideline committee agreed to conduct a 7 threshold analysis. This type of analysis takes into account the fact that the cost of a second hearing 8 aid can be calculated, but the impact of a second hearing aid on quality of life is not known. It 9 therefore calculates the magnitude of benefit to quality of life that would be required for the 10 necessary expenditure to be cost effective. 11
This analysis uses the same costs as used in the cost–utility analysis conducted for this guideline – 12 please see appendix N for sources and further details. The committee agreed that the resources 13 required for a hearing aid for the second ear (above those that would be required for a first hearing 14 aid for 1 ear only) would be the cost of the hearing aid itself, a mould or thin tube and dome and 15 batteries. In addition, the committee cautiously assumed that people with 2 hearing aids would 16 obtain 1 additional aftercare appointment each year for hearing aid repairs and maintenance. There 17 will be no difference in costs for fitting or follow-up appointments, as an individual will have the 18 same number of appointments whether they are having 1 or 2 hearing aids fitted. This analysis 19 considers a period of 3 years, as that is expected to be the shortest length of time hearing aids would 20 usually be kept before an individual’s hearing is reassessed and they may receive new hearing aid(s). 21 The costs are shown in Table 91. 22
Table 91: Additional costs of supplying a second hearing aid for an individual’s second ear 23
Equipment Cost each Cost per 3 years
Hearing aid, average cost £70.96 £70.96
Cost of mould or thin tube and dome, average £2.93 £2.93
Batteries, per year £3.63 £10.89
Aftercare appointment £28.95 £86.85
TOTAL £171.63
To calculate the threshold for the improvement in utility (quality of life) that would be necessary to 24 make this expenditure cost effective at a cost-effectiveness threshold of £20,000 per QALY gained, 25 we need to divide the total cost of £171.63 by £20,000. 26
This gives a utility increment of 0.0086 QALYs (or, alternatively, 3.1 quality-adjusted life days) over a 27 period of 3 years, or 0.0029 QALYs per year. 28
There are no published figures for the improvement in utility to be expected by adding a second 29 hearing aid. However, there are figures for the improvement caused by the adoption of hearing 30 aid(s) by people with hearing loss who previously did not have any hearing aids. As discussed in 31 greater detail in appendix N, the committee has agreed that the most appropriate source for this 32 measurement is the study by Barton 2004 using the HUI3 tool which gave this improvement in utility 33 as 0.060 QALYs.10 34
0.0029 QALYs is 4.8% of 0.060 QALYs. 35

Hearing loss Hearing aids
© NICE 2017. All rights reserved. Subject to Notice of rights. 212
So if we compare the benefit gained by someone with hearing loss who previously had no hearing 1 aids and adopts hearing aids (0.060 QALYs) with the benefit required by someone with hearing loss in 2 both ears who currently has 1 hearing aid and is now adopting a second hearing aid (0.0029 QALYs) 3 we find that the second person would need to benefit by at least 5% (a twentieth) as much from 4 their second hearing aid as the first person benefits from their hearing aids for this to be cost 5 effective at a cost-effectiveness threshold of £20,000 per QALY gained. 6
15.3.3 Evidence statements 7
Clinical 8
There was insufficient evidence to determine if there was a clinically important benefit of using 2 9 hearing aids compared to 1 hearing aid for the outcomes of patient preference (very low quality 10 evidence, 4 studies), usage of hearing aids, sound localisation and speech in noise detection (very 11 low quality evidence, 5 studies). 12
There was no evidence for any of the other outcomes of interest. 13
Economic 14
No relevant economic evaluations were identified. 15
15.3.4 Recommendations and link to evidence 16
Recommendations 28. Offer 2 hearing aids to adults with hearing loss in both ears. Explain that wearing 2 hearing aids can improve sound quality, help to make speech easier to understand when there is background noise, and make it easier to tell where sounds are coming from.
29. For adults with hearing loss in both ears who chose a single hearing aid, consider a second hearing aid at the follow-up appointment.
Relative values of different outcomes
The following outcomes were identified as critical for this review: hearing-specific health-related quality of life, health-related quality of life, listening ability, outcomes reported by carers or ‘communications partner’ and patient preference.
Important outcomes agreed were usage of hearing aids (including from data logging and self-reported), adverse effects (pain, infection), annoyance scale in patient reported outcome measures, sound localisation as measured by laboratory tests and speech in noise detection as measured by laboratory tests.
Quality of the clinical evidence
The quality of evidence for all outcomes reported was very low. This was mainly due to the following:
Risk of bias because none of the studies had described methods of randomisation and allocation concealment methods, and because of lack of blinding of assessors and no indication that outcome measures were validated. One study used alternation (quasi-randomised), whereas 2 other studies did not describe sequence generation method. Risk of detection bias from lack of blinding is high because the outcome was subjective. In addition 3 of these studies did not describe the protocols for fitting.
Imprecision due to small sample sizes.
Indirectness as the largest study randomised participants to 1 week phases of each fitting before asking patients to use the hearing aids as they liked for another 9 weeks, while another study only fitted patients alternately for 1 hour before trialling the other option. It was uncertain if the 1 week period is sufficient for patients to get used to the fitting.
Evidence was available for patient preference and usage. Sound localisation and

Hearing loss Hearing aids
© NICE 2017. All rights reserved. Subject to Notice of rights. 213
speech detection were also reported by 1 study.
For the patient preference data, all studies asked patients which arrangement they preferred at the end of the trial. Two of these studies randomised patients to 3 groups, with 2 groups randomised to either the left ear or the right ear and 1 randomised to both ears. Therefore, the randomisation was 2:1 rather than 1:1. The direction of bias is uncertain.
The third study randomised equal numbers of patients to bilateral and unilateral fitting before crossing these over, but all the participants in the study had chosen to be fitted with hearing aids unilaterally prior to randomisation. This indicates a potential bias favouring unilateral fitting, possibly due to a prior preference of participants or information received. The other study allocated people by alternation to 1 hour of bilateral and unilateral use each.
For usage of hearing aids, although the 3 studies reported this outcome, data from 2 of these cannot be used because they reported the mean daily usage according to the preferred fitting by the participants rather than usage while being allocated to unilateral versus bilateral hearing aids. These results do not tell us whether someone will use hearing aids more when they are allocated 1 or 2 hearing aids.
The information for usage, sound localisation and speech in noise detection was measured using a questionnaire at the end of each 10-week phase. It is uncertain if the questionnaire was validated and how the data were collected. It was impossible to blind outcome reporting, but unclear if the person collecting the data from the patient was a ‘neutral’ party or someone involved in delivery of the intervention.
The potential benefits of speech in noise detection and sound localisation needed to be measured against the overall benefit from using the hearing aids, such as quality of life. However, there were no data for this.
It was noted that the evidence was from very old studies conducted over 20 years ago when most hearing aids were likely to be either analogue or much less technologically advanced. This may have influenced the ability of the patients to use them and may have affected their preferences. In addition, as attitudes and beliefs change over time, this may also influence patient preference and this may impact the applicability of results derived from studies conducted many years ago.
Due to the very low quality of the evidence and the uncertainty around it as well as the lack of evidence for many of the outcomes of interest, it was difficult to ascertain whether there was a clinically important benefit of fitting 2 hearing aids compared to 1 hearing aid.
Trade-off between clinical benefits and harms
Three studies reported that the preference for unilateral versus bilateral fitting of hearing aids was roughly divided equally, while another study suggested more people had a preference for bilateral hearing aid fitting. The only study that provided more information to suggest some benefits of unilateral fitting (in terms of usage, sound localisation and speech in noise detection) was also the study that had a higher preference for unilateral fitting (60%). Of patients with an initial preference for a unilateral hearing aid, 40% changed their mind after trying bilateral hearing aids.
The committee noted that current practice, based on the NHS England commissioning framework,
75 is to fit hearing aids bilaterally when there is a bilateral
hearing loss. The clinical experience of the group corroborates the potential benefit of bilateral fitting of hearing aids for restoring binaural hearing, although no evidence was identified to support this. In the absence of good quality evidence with direct applicability, the committee decided to reinforce current practice in the recommendations, though also highlighting the importance of patient choice. The studies were all of a short duration and the group considered that these timings were not long enough for people to make an informed choice. Adequate time (with appropriate information) needs to be given to enable people to get used to wearing hearing aids, along with a follow-up appointment to provide any adjustments to the devices and support to enable continued usage. The committee agreed that

Hearing loss Hearing aids
© NICE 2017. All rights reserved. Subject to Notice of rights. 214
bilaterally worn hearing aids have the potential to facilitate communication as sound quality may be better than with a unilaterally worn hearing aid. The impact on family and carers’ ability to communicate with the person also needs to be considered.
The committee also considered the balance of benefits and potential disadvantages of binaural stimulation. The benefits include improved: (i) intelligibility of speech in background noise, (ii) sound localisation, and (iii) sound quality. It also has the potential to avoid deficits that may develop over time if only 1 hearing aid is fitted and the unaided ear is deprived of stimulation. On the other hand, potential disadvantages of bilateral fitting include additional cost (to the NHS), 2 devices may be too complex for some people to use, and, for a few, binaural interference (that is, reduced speech intelligibility compared to performance with a single device).
Trade-off between net clinical effects and costs
No published health economic evaluations were identified for this question.
The committee noted a lack of clear clinical evidence, and so the effect on quality of life could not be quantified. However, the committee is aware of the basic scientific research that demonstrates the acoustic advantage of wearing 2 hearing aids and noted that the NHS commissioning framework recommends that providing 2 hearing aids should be standard practice.
An original cost threshold analysis was therefore undertaken to consider the difference in costs between prescribing and fitting hearing aids unilaterally and bilaterally. The number of appointments and time taken to prescribe and fit hearing aids would not differ significantly between the process of fitting a single hearing aid and that for fitting 2 hearing aids bilaterally. There would however be increased costs for a second hearing aid (average £71), associated mould or thin tube and dome (£3) and batteries (£4 per year). For the purpose of this analysis the committee assumed that the hearing aid would be used for 3 years before being replaced, and that the user would seek 1 extra aftercare appointment for hearing aid maintenance (£29) each year. This gives a total additional cost of £172 over 3 years for providing a second hearing aid.
When compared to the NICE cost-effectiveness threshold of £20,000 per QALY gained, this means that to be cost effective the addition of a hearing aid for the second ear would need to lead to an average increase in health-related quality of life of 0.0029 QALYs during the 3 years in which it is in use. This is equivalent to 4.8% of the benefit (0.06 QALYs per year) conferred by hearing aid use compared to no hearing aid use found by Barton 2004,
10 which was used as the basis of the
calculation of quality of life gain in the original economic modelling for this guideline (appendix N). That is, if the benefit of adding the second hearing aid is 5% or more of the benefit found from using hearing aids compared to using none, then it is cost effective to provide 2 hearing aids.
The committee were confident that the benefits of bilateral hearing would be considerably greater than this threshold, and hence bilateral hearing aids would be cost effective. The committee also noted that the original economic modelling for this guideline assumed that all people receiving treatment would have bilateral hearing loss and be provided with 2 hearing aids, and on this basis both early and delayed provision of hearing aids were found to be highly cost effective compared to no hearing aid use at a cost-effectiveness threshold of £20,000 per QALY gained. As a result the committee agreed to recommend that the current practice of offering 2 hearing aids to people with hearing loss in both ears should be continued.
Other considerations In 1 study the population was made up of military personnel and the committee noted that some people would have concerns about any impact hearing loss might have on their employment and career opportunities and may base their choices on these factors.
The committee noted that some people who initially opt to have a unilateral hearing aid would later be willing to undergo a trial of a second hearing aid in the other ear – either due to a change of mind or due to deteriorating hearing. The need for follow-

Hearing loss Hearing aids
© NICE 2017. All rights reserved. Subject to Notice of rights. 215
up was also identified as one of the main findings that is important to people with hearing loss (see section 12.2.4).
The recommendations highlight the importance of follow-up for continued use of hearing aids. People should be offered the opportunity to either add or reject a hearing aid after trying out the option they initially chose.
The committee noted evidence from 1 study following up people 12 years after they first had hearing aids fitted, which found that agreeing to have 2 hearing aids fitted rather than only accepting 1 hearing aid was strongly associated with an increased chance that the person would still be using hearing aids 12 years later.
24
Although the NHS standard contract advocates prescribing and fitting 2 hearing aids for bilateral hearing loss,
75 the committee highlighted anecdotal evidence indicating
variation in practice geographically with some areas of the country routinely initially prescribing 1 hearing aid. The committee did not agree with this approach and emphasised that prescribing 2 hearing aids is cost effective compared to prescribing 1 hearing aid.
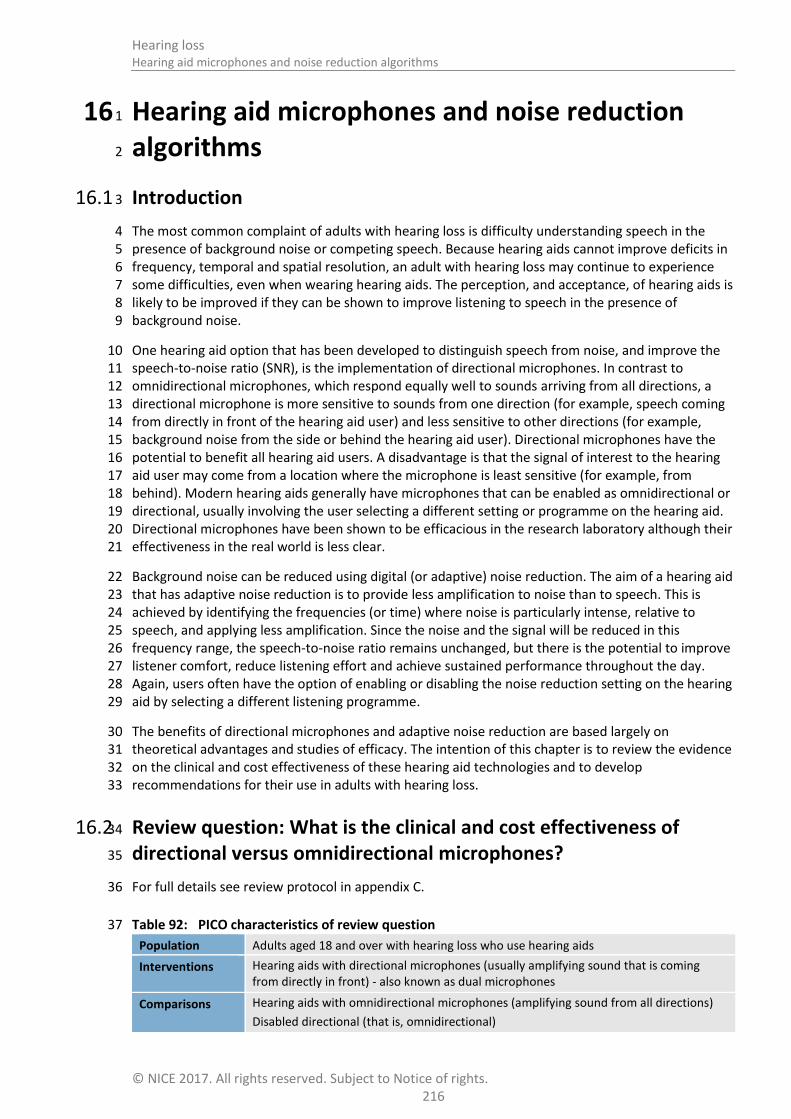
Hearing loss Hearing aid microphones and noise reduction algorithms
© NICE 2017. All rights reserved. Subject to Notice of rights. 216
16 Hearing aid microphones and noise reduction 1
algorithms 2
Introduction 16.1 3
The most common complaint of adults with hearing loss is difficulty understanding speech in the 4 presence of background noise or competing speech. Because hearing aids cannot improve deficits in 5 frequency, temporal and spatial resolution, an adult with hearing loss may continue to experience 6 some difficulties, even when wearing hearing aids. The perception, and acceptance, of hearing aids is 7 likely to be improved if they can be shown to improve listening to speech in the presence of 8 background noise. 9
One hearing aid option that has been developed to distinguish speech from noise, and improve the 10 speech-to-noise ratio (SNR), is the implementation of directional microphones. In contrast to 11 omnidirectional microphones, which respond equally well to sounds arriving from all directions, a 12 directional microphone is more sensitive to sounds from one direction (for example, speech coming 13 from directly in front of the hearing aid user) and less sensitive to other directions (for example, 14 background noise from the side or behind the hearing aid user). Directional microphones have the 15 potential to benefit all hearing aid users. A disadvantage is that the signal of interest to the hearing 16 aid user may come from a location where the microphone is least sensitive (for example, from 17 behind). Modern hearing aids generally have microphones that can be enabled as omnidirectional or 18 directional, usually involving the user selecting a different setting or programme on the hearing aid. 19 Directional microphones have been shown to be efficacious in the research laboratory although their 20 effectiveness in the real world is less clear. 21
Background noise can be reduced using digital (or adaptive) noise reduction. The aim of a hearing aid 22 that has adaptive noise reduction is to provide less amplification to noise than to speech. This is 23 achieved by identifying the frequencies (or time) where noise is particularly intense, relative to 24 speech, and applying less amplification. Since the noise and the signal will be reduced in this 25 frequency range, the speech-to-noise ratio remains unchanged, but there is the potential to improve 26 listener comfort, reduce listening effort and achieve sustained performance throughout the day. 27 Again, users often have the option of enabling or disabling the noise reduction setting on the hearing 28 aid by selecting a different listening programme. 29
The benefits of directional microphones and adaptive noise reduction are based largely on 30 theoretical advantages and studies of efficacy. The intention of this chapter is to review the evidence 31 on the clinical and cost effectiveness of these hearing aid technologies and to develop 32 recommendations for their use in adults with hearing loss. 33
Review question: What is the clinical and cost effectiveness of 16.234
directional versus omnidirectional microphones? 35
For full details see review protocol in appendix C. 36
Table 92: PICO characteristics of review question 37
Population Adults aged 18 and over with hearing loss who use hearing aids
Interventions Hearing aids with directional microphones (usually amplifying sound that is coming from directly in front) - also known as dual microphones
Comparisons Hearing aids with omnidirectional microphones (amplifying sound from all directions)
Disabled directional (that is, omnidirectional)

Hearing loss Hearing aid microphones and noise reduction algorithms
© NICE 2017. All rights reserved. Subject to Notice of rights. 217
Outcomes Critical:
Speech recognition in noise
Ease of listening or listening effort (objective or self-reported)
Hearing-specific health-related QoL
o Hearing Handicap Inventory for the Elderly (HHIE) or HHI for Adults (HHIA)
o Quantified Denver Scale of Communication (QDS)
o Auditory Disability Preference – Visual Analog Scale (ADPI-VAS)
o Device Orientated Subjective Outcome Scale
o Any questionnaire not specified above that is relevant
Important:
Any outcomes reporting:
o Restricted participation or activity limitation
o Social interactions, employment and education
o Health-related quality of life:
- Health Utilities Index Mark 3 (HUI-3)
- EQ-5D
- SF-36
o Glasgow Benefit Inventory (GBI)
o WHO Disability Assessment Schedule (WHODAS)
o Self-Evaluation of Life Function (SELF)
Listening ability
o Abbreviated Profile of Hearing Aid Benefit (APHAB)
o Speech, Spatial and Qualities (SSQ) Hearing Scale
o Glasgow Hearing Aid Benefit Profile (GHABP) disability subscale
o Any questionnaire not specified above that is relevant
Safety for example lack of awareness of environmental noise as an adverse effect
Adherence
Study design Systematic review of RCTs and RCTs
16.2.1 Clinical evidence 1
A search was conducted for systematic reviews and randomised controlled trials comparing the 2 effectiveness of hearing aids with directional microphones versus hearing aids with omnidirectional 3 or disabled microphones to improve listening for adults with hearing loss in the presence of 4 background noise. 5
One study was included in the review;90 and is summarised in Table 93 below. Evidence from this 6 study is summarised in the clinical evidence summary below (Table 94). See also the study selection 7 flow chart in appendix E, forest plots in appendix K, study evidence tables in appendix H, GRADE 8 tables in appendix J and excluded studies list in appendix L. 9
The aim of the study was to determine the impact of hearing aids with directional microphones on 10 self-perceived localisation disability and concurrent handicap among older individuals with impaired 11 hearing. 12
Table 93: Summary of studies included in the review 13
Study Intervention and comparison Population Outcomes Comments
Ruscetta 2007
Hearing aids with directional microphone
n=57
Adjusted mean total scores (and p-values) at 3 months post-fitting (end of
Gender proportions, average age, average duration of hearing

Hearing loss Hearing aid microphones and noise reduction algorithms
© NICE 2017. All rights reserved. Subject to Notice of rights. 218
Study Intervention and comparison Population Outcomes Comments
(DIM)
Hearing aids with omnidirectional microphone (ODM)
60–75 year olds with moderate, symmetrical, bilateral sensorineural hearing loss
intervention period):
Self-perceived level of ability to tell the direction of sounds (localisation disability) (n=19)
(a)
Self-perceived amount of withdrawal from activities of daily living (localisation handicap) (n=19)
(a)
loss and duration of hearing loss range were given for each intervention group but no other baseline characteristics were provided and any differences between the groups were not investigated.
(a)The study applied three intervention groups with hearing aids (n=57 in total; 19 in each group) and one control group with 1
no hearing aids (n=57). Only 2 of the intervention groups were relevant to this review and are therefore presented. 2
3

Hearin
g aid m
icrop
ho
nes an
d n
oise red
uctio
n algo
rithm
s
Hearin
g loss
© N
ICE 2
01
7. A
ll rights reserved
. Sub
ject to N
otice o
f rights.
21
9
Table 94: Clinical evidence summary: Directional microphones compared to Omnidirectional microphones for hearing loss 1
Outcomes
No of Participants (studies) Follow-up
Quality of the evidence (GRADE)
Relative effect (95% CI)
Anticipated absolute effects
Risk with Omnidirectional microphones Risk difference with Directional microphones (95% CI)
Self-perceived level of ability to tell the direction of sounds (localisation disability)
38 (1 study) 3 months
VERY LOWa,b
due to risk of bias, imprecision
The mean self-perceived level of ability to tell the direction of sounds (localisation disability) in the control groups was 3.06
The mean self-perceived level of ability to tell the direction of sounds (localisation disability) in the intervention groups was 0.08 lower (67.97 lower to 67.81 higher)
Self-perceived amount of withdrawal from activities of daily living (localisation handicap)
38 (1 study) 3 months
VERY LOWa,b
due to risk of bias, imprecision
The mean self-perceived amount of withdrawal from activities of daily living (localisation handicap) in the control groups was 3.92
The mean self-perceived amount of withdrawal from activities of daily living (localisation handicap) in the intervention groups was 0.05 higher (12.66 lower to 12.76 higher)
a Downgraded by 1 increment if the majority of the evidence was at high risk of bias or by 2 increments if the majority of the evidence was at very high risk of bias.
b Downgraded by 1 increment if the confidence interval crossed one MID or by 2 increments if the confidence interval crossed both MIDs
2

Hearing loss Hearing aid microphones and noise reduction algorithms
© NICE 2017. All rights reserved. Subject to Notice of rights. 220
16.2.2 Economic evidence 1
No relevant health economic studies were identified. 2
See also the health economic study selection flow chart in appendix F. 3
16.2.3 Evidence statements 4
Clinical 5
Directional compared to omnidirectional microphones 6
There was no clinically important difference in localisation disability and localisation handicap 7 (very low quality evidence, 1 study). 8
Economic 9
No relevant economic evaluations were identified. 10
16.2.4 Recommendations and link to evidence 11
Recommendations 30. When offering hearing aids to adults, explain the features on the hearing aid that can help the person to hear in background noise, such as directional microphone and noise reduction settings.
31. Advise adults with hearing aids about choosing microphone and noise reduction settings that will meet their needs in different environments, and ensure that they know how to use them.
Relative values of different outcomes
The guideline committee agreed that the following critical outcomes should be included in the review: speech recognition in noise, ease of listening, and hearing-specific health-related quality of life including the Hearing Handicap Inventory for the Elderly (HHIE).
The committee agreed that the following important outcomes should be included in the review: outcomes reporting restricted participation or activity limitation and social interactions, employment and education, health-related quality of life including the Health Utilities Index Mark 3 (HUI-3), and other outcomes such as safety, adverse effects and adherence.
Quality of the clinical evidence
One study comparing hearing aids with directional microphones to hearing aids with omnidirectional microphones was included in this review. This study reported on ‘localisation disability’ defined as self-perceived level of ability to tell the direction of sounds, and on ‘localisation handicap’ defined as self-perceived amount of withdrawal from activities of daily living, at 3 months post-fitting. The committee considered the potential for hearing aids, particularly those with directional microphones to reduce localisation skills, relative to the unaided condition.
There was a high risk of bias in the selection of participants, lack of blinding and imprecision. The participants’ gender, average age, average duration of hearing loss and duration of hearing loss range are given. However comparability of these factors between groups has not been analysed and no other potential confounding factors have been explored. Therefore, the evidence for these outcomes was rated as very low.
The committee noted that although the included paper was published in 2007, microphone technology has not improved in a significant way since then apart from some improvements in processors. Therefore, it was agreed that the evidence is still
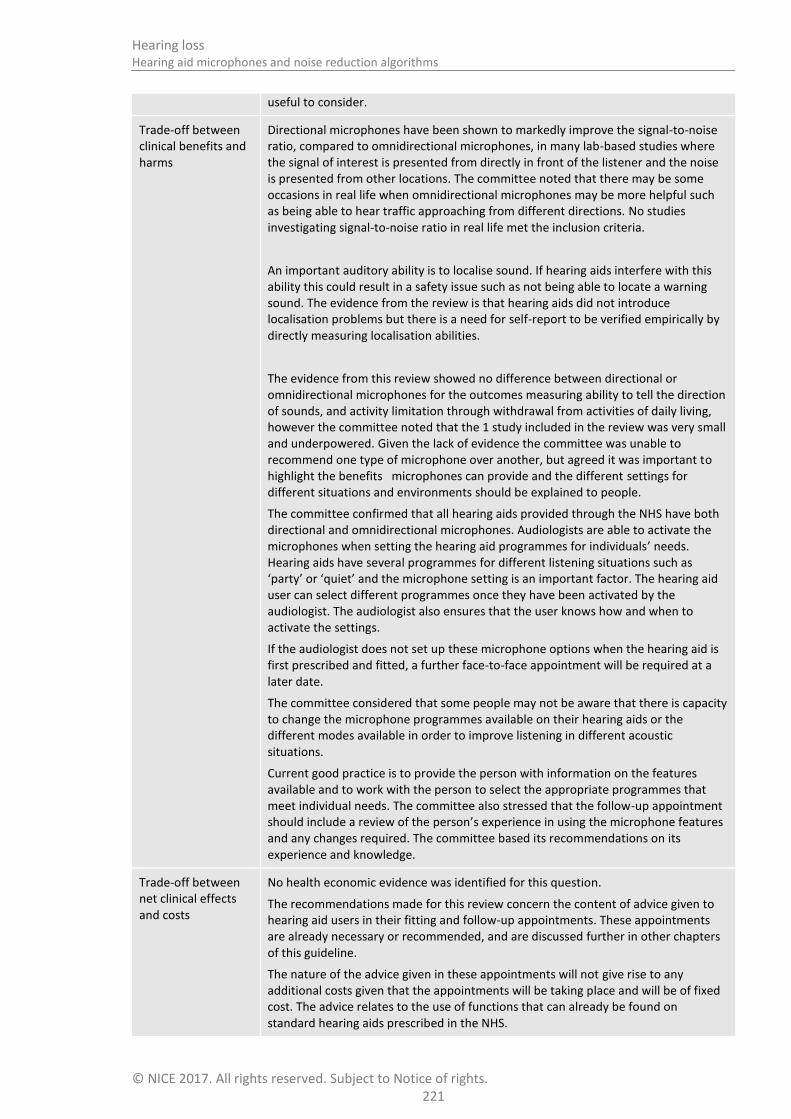
Hearing loss Hearing aid microphones and noise reduction algorithms
© NICE 2017. All rights reserved. Subject to Notice of rights. 221
useful to consider.
Trade-off between clinical benefits and harms
Directional microphones have been shown to markedly improve the signal-to-noise ratio, compared to omnidirectional microphones, in many lab-based studies where the signal of interest is presented from directly in front of the listener and the noise is presented from other locations. The committee noted that there may be some occasions in real life when omnidirectional microphones may be more helpful such as being able to hear traffic approaching from different directions. No studies investigating signal-to-noise ratio in real life met the inclusion criteria.
An important auditory ability is to localise sound. If hearing aids interfere with this ability this could result in a safety issue such as not being able to locate a warning sound. The evidence from the review is that hearing aids did not introduce localisation problems but there is a need for self-report to be verified empirically by directly measuring localisation abilities.
The evidence from this review showed no difference between directional or omnidirectional microphones for the outcomes measuring ability to tell the direction of sounds, and activity limitation through withdrawal from activities of daily living, however the committee noted that the 1 study included in the review was very small and underpowered. Given the lack of evidence the committee was unable to recommend one type of microphone over another, but agreed it was important to highlight the benefits microphones can provide and the different settings for different situations and environments should be explained to people.
The committee confirmed that all hearing aids provided through the NHS have both directional and omnidirectional microphones. Audiologists are able to activate the microphones when setting the hearing aid programmes for individuals’ needs. Hearing aids have several programmes for different listening situations such as ‘party’ or ‘quiet’ and the microphone setting is an important factor. The hearing aid user can select different programmes once they have been activated by the audiologist. The audiologist also ensures that the user knows how and when to activate the settings.
If the audiologist does not set up these microphone options when the hearing aid is first prescribed and fitted, a further face-to-face appointment will be required at a later date.
The committee considered that some people may not be aware that there is capacity to change the microphone programmes available on their hearing aids or the different modes available in order to improve listening in different acoustic situations.
Current good practice is to provide the person with information on the features available and to work with the person to select the appropriate programmes that meet individual needs. The committee also stressed that the follow-up appointment should include a review of the person’s experience in using the microphone features and any changes required. The committee based its recommendations on its experience and knowledge.
Trade-off between net clinical effects and costs
No health economic evidence was identified for this question.
The recommendations made for this review concern the content of advice given to hearing aid users in their fitting and follow-up appointments. These appointments are already necessary or recommended, and are discussed further in other chapters of this guideline.
The nature of the advice given in these appointments will not give rise to any additional costs given that the appointments will be taking place and will be of fixed cost. The advice relates to the use of functions that can already be found on standard hearing aids prescribed in the NHS.

Hearing loss Hearing aid microphones and noise reduction algorithms
© NICE 2017. All rights reserved. Subject to Notice of rights. 222
Giving advice on how hearing aids can be used more effectively will increase the effectiveness of hearing aid use for no additional cost and so will be cost effective compared to not giving such advice, and may be cost saving if it reduces any need for additional subsequent appointments.
Other considerations The committee stressed that directional microphones can be helpful for listening and speaking situations where filtering out sound around the person is needed.
1
Review question: What is the clinical and cost effectiveness of noise 16.3 2
reduction algorithms? 3
For full details see review protocol in appendix C. 4
Table 95: PICO characteristics of review question 5
Population Adults aged 18 and over with hearing loss who use hearing aids
Interventions Digital or adaptive noise reduction algorithms
Comparisons No noise reduction or noise reduction algorithm disabled
Outcomes Critical:
Speech recognition in noise
Ease of listening or listening effort (objective or self-reported). Note: These may be measured by self-report; behavioural measures of reduced processing load (for example, faster responses times when completing a listening task, or improved ability to multitask while listening; physiological measures such as lower skin conductance)
Hearing-specific health-related quality of life
o Hearing Handicap Inventory for the Elderly (HHIE) or HHI for Adults (HHIA)
o Quantified Denver Scale of Communication (QDS)
o Auditory Disability Preference – Visual Analog Scale (ADPI-VAS)
o Device Orientated Subjective Outcome Scale
o Any questionnaire not specified above that is relevant
Important:
Any outcomes reporting:
o Restricted participation or activity limitation
o Social interactions, employment and education
o Listening ability Abbreviated Profile of Hearing Aid Benefit (APHAB)
o Speech, Spatial and Qualities (SSQ) Hearing Scale
o Glasgow Hearing Aid Benefit Profile (GHABP) residual disability subscale
Health-related quality of life
o Health Utilities Index Mark 3 (HUI-3)
o EQ-5D
o SF-36
o Glasgow Benefit Inventory (GBI)
o WHO Disability Assessment Schedule (WHODAS)
o Self-Evaluation of Life Function (SELF)
o Any questionnaire not specified above that is relevant
Safety (for example, lack of awareness of environmental noise as adverse effect)
Adherence
Study design Systematic review of RCTs and RCTs
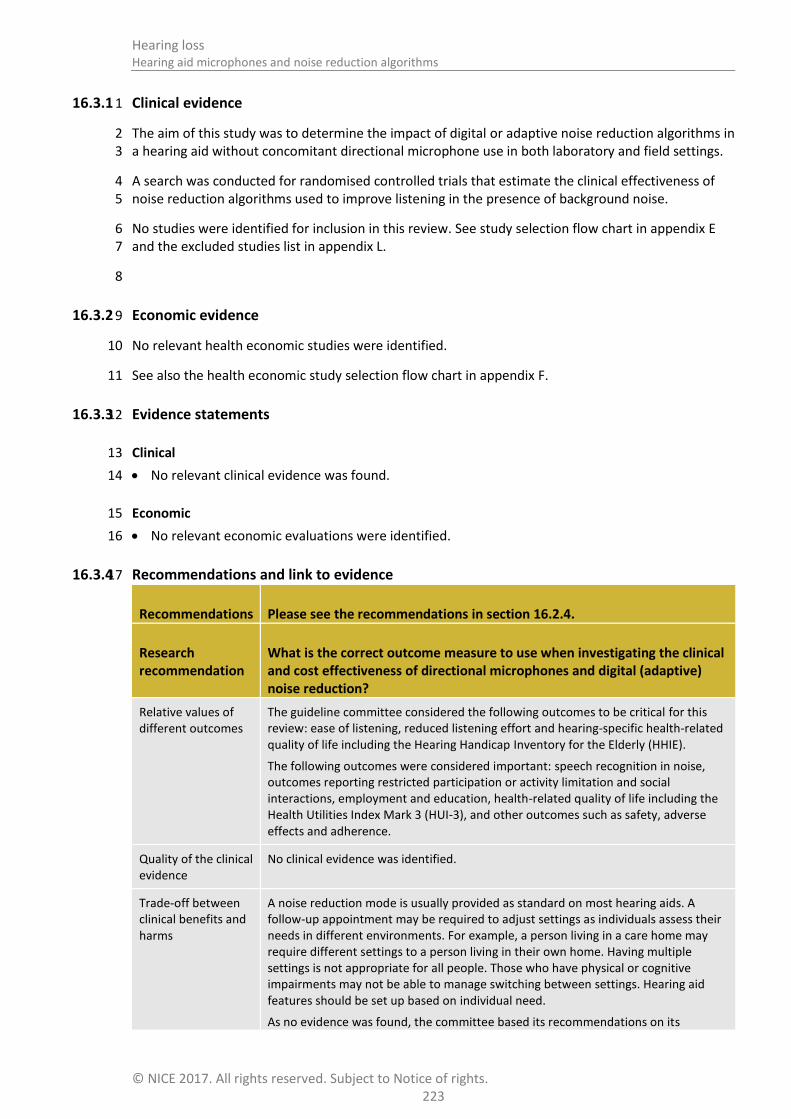
Hearing loss Hearing aid microphones and noise reduction algorithms
© NICE 2017. All rights reserved. Subject to Notice of rights. 223
16.3.1 Clinical evidence 1
The aim of this study was to determine the impact of digital or adaptive noise reduction algorithms in 2 a hearing aid without concomitant directional microphone use in both laboratory and field settings. 3
A search was conducted for randomised controlled trials that estimate the clinical effectiveness of 4 noise reduction algorithms used to improve listening in the presence of background noise. 5
No studies were identified for inclusion in this review. See study selection flow chart in appendix E 6 and the excluded studies list in appendix L. 7
8
16.3.2 Economic evidence 9
No relevant health economic studies were identified. 10
See also the health economic study selection flow chart in appendix F. 11
16.3.3 Evidence statements 12
Clinical 13
No relevant clinical evidence was found. 14
Economic 15
No relevant economic evaluations were identified. 16
16.3.4 Recommendations and link to evidence 17
Recommendations Please see the recommendations in section 16.2.4.
Research recommendation
What is the correct outcome measure to use when investigating the clinical and cost effectiveness of directional microphones and digital (adaptive) noise reduction?
Relative values of different outcomes
The guideline committee considered the following outcomes to be critical for this review: ease of listening, reduced listening effort and hearing-specific health-related quality of life including the Hearing Handicap Inventory for the Elderly (HHIE).
The following outcomes were considered important: speech recognition in noise, outcomes reporting restricted participation or activity limitation and social interactions, employment and education, health-related quality of life including the Health Utilities Index Mark 3 (HUI-3), and other outcomes such as safety, adverse effects and adherence.
Quality of the clinical evidence
No clinical evidence was identified.
Trade-off between clinical benefits and harms
A noise reduction mode is usually provided as standard on most hearing aids. A follow-up appointment may be required to adjust settings as individuals assess their needs in different environments. For example, a person living in a care home may require different settings to a person living in their own home. Having multiple settings is not appropriate for all people. Those who have physical or cognitive impairments may not be able to manage switching between settings. Hearing aid features should be set up based on individual need.
As no evidence was found, the committee based its recommendations on its

Hearing loss Hearing aid microphones and noise reduction algorithms
© NICE 2017. All rights reserved. Subject to Notice of rights. 224
knowledge and experience of noise reduction features being underutilised in some cases. This is due to users not being aware of noise reduction functions available on their devices or not knowing how to use them.
The committee noted that noise reduction algorithms are not helpful for all people. Some do not like the quality of the sound when noise reduction is turned on and therefore there is a trade-off between reducing overall sound level to improve listening comfort but losing other qualities of the sound.
Since no evidence was identified for this clinical question, the committee agreed that further research is needed to assess the benefit of the noise reduction function and decided to make a research recommendation in this area.
Trade-off between net clinical effects and costs
No health economic evidence was identified for this question.
The recommendations made regarding noise reduction algorithms can be found in the reviews regarding the use of microphones (section 16.2.4) and interventions to support the use of hearing aids (section 18.2.4). They concern the content of advice given to hearing aid users in their fitting and follow-up appointments. These appointments are already necessary or recommended, and are discussed further in other chapters of this guideline.
The nature of the advice given in these appointments will not give rise to any additional costs given that the appointments will be taking place and will be of fixed cost. The advice relates to the use of functions that can already be found on standard hearing aids prescribed in the NHS.
Giving advice on how hearing aids can be used more effectively will increase the effectiveness of hearing aid use for no additional cost and so will be cost effective compared to not giving such advice, and may be cost saving if it reduces any need for additional subsequent appointments.
Other considerations The committee agreed that all hearing aids currently provided by the NHS have a noise reduction feature available. However, these need to be enabled by an audiologist. There are different modes of noise reduction available, which the audiologist will programme together with other features, for example directional or omnidirectional microphones. All hearing aid features should be set up with the individual and based on individual needs and preferences. The committee agreed that the option to review these settings following a trial period in the real world is important so that features can be adjusted, added or removed based on user experience .Functionality can be limited because the technology does not allow the user to be able to control or adjust modes themselves, and they need to seek help from audiology services.
1

Hearing loss Monitoring and follow-up
© NICE 2017. All rights reserved. Subject to Notice of rights. 225
17 Monitoring and follow-up 1
Introduction 17.1 2
Many people use hearing aids as part of the management of their hearing and communication needs. 3 Hearing aids are usually fitted in a clinic setting by an audiologist who should also advise on the use 4 and management of the device, as well as aspects of communication specific to the individual. 5 Hearing aids should be programmed and functionality set to meet individual needs and capabilities. 6
Traditionally, after the hearing aid fitting there is a follow-up appointment. This follow-up enables: 7 the individual to share their experience with the audiologist and for adjustments to be made, for the 8 audiologist to provide further advice and support including onward referral to other agencies as 9 required, for the audiologist to observe the correct fitting and handling of the device and for patient-10 reported outcome and experience measures to be obtained. 11
A follow-up appointment as part of the hearing aid fitting pathway is included within current 12 recommended practice documents; for example, within the service model outlined within NHS 13 England’s ‘Commissioning Services for People with Hearing Loss: A framework for clinical 14 commissioning groups’.75 Additional recommendations for good practice appear in the Welsh and 15 Scottish quality standards for adult hearing rehabilitation. 77 16
Despite this guidance, current provision of a follow-up appointment is variable across the UK with 17 some services offering no follow-up appointment and no opportunity to re-access the service 18 following the initial hearing aid fitting. Where a follow-up appointment is offered, these are 19 sometimes face-to-face in clinic and sometimes over the telephone. It is also unclear as to the 20 optimal timing for follow-up and if further long-term monitoring is of value. 21
The current guidance documents also indicate that people should be offered an appointment to 22 reassess their hearing and communication needs 3 years following their previous assessment. 23 However, this invitation for review is rare within current practice and service models and service 24 users are generally unaware that reassessment is an option. Exceptions may include groups of people 25 who are considered suitable for reassessment for a specific reason, for example, people with dual 26 sensory impairment or people with learning disabilities. 27
This chapter aims to explore the benefits of providing follow-up to those people with hearing aids 28 and for the ongoing monitoring of people with identified hearing and communication needs who 29 may or may not have hearing aids. 30
It was thought that most relevant papers are likely to include both the ‘when’ and the ‘how’ aspects 31 of follow up and that the ensuing recommendations would reflect that. Therefore, this chapter 32 includes 2 clinical questions for which a combined search strategy was used to identify relevant 33 papers. 34
Review question 1: What is the most clinically and cost-effective 17.235
method of delivery of monitoring and follow-up of people with 36
hearing-related communication needs (including those with hearing 37
aids)? 38
Table 96: PICO characteristics of review question 1 39
Population Adults aged 18 and over presenting with hearing loss
Interventions and Examples mode of delivery:

Hearing loss Monitoring and follow-up
© NICE 2017. All rights reserved. Subject to Notice of rights. 226
comparators Telephone
face-to-face
questionnaire
online resources
Compared to each other and to no follow-up or usual care
Outcomes Critical outcomes
1. Hearing-specific health-related quality of life
Hearing Handicap Inventory for the Elderly (HHIE) or HHI for Adults (HHIA)
Quantified Denver Scale of Communication (QDS)
Auditory Disability Preference – Visual Analog Scale (ADPI-VAS)
Device Orientated Subjective Outcome Scale
Any questionnaire not specified above that is relevant
2. Health-related quality of life
Health Utilities Index Mark 3 (HUI-3)
EQ-5D
SF-36
Glasgow Benefit Inventory (GBI)
WHO Disability Assessment Schedule (WHODAS)
Self-Evaluation of Life Function (SELF)
HRQoL
Any questionnaire not specified above that is relevant
3. Listening ability
Abbreviated Profile of Hearing Aid Benefit (APHAB)
Speech, Spatial and Qualities (SSQ) Hearing Scale
Glasgow Hearing Aid Benefit Profile (GHABP) residual disability subscale
4. Speech recognition in noise test
5. Usage of hearing aids (including data logging and self-report (if applicable)
Important outcomes
6. Social functioning or employment
Study design RCT and systematic reviews of RCTs
If not enough RCT evidence is found, cohort studies will be considered
Review question 2: When should people with hearing-related 17.3 1
communication needs (including those with hearing aids) be 2
monitored and followed up? 3
For full details see review protocols in appendix C. 4
Table 97: PICO characteristics of review question 2 5
Population Adults aged 18 and over presenting with hearing loss

Hearing loss Monitoring and follow-up
© NICE 2017. All rights reserved. Subject to Notice of rights. 227
Interventions and comparators
Short-term: less than 12 weeks Medium term: 1 year Long-term: 3 years Compared to each other or to no follow-up if appropriate
Outcomes Critical outcomes 1. Hearing-specific health-related quality of life
Hearing Handicap Inventory for the Elderly (HHIE) or HHI for Adults (HHIA)
Quantified Denver Scale of Communication (QDS)
Auditory Disability Preference – Visual Analog Scale (ADPI-VAS)
Device Orientated Subjective Outcome Scale
Any questionnaire not specified above that is relevant
2. Health-related quality of life
Health Utilities Index Mark 3 (HUI-3)
EQ-5D
SF-36
Glasgow Benefit Inventory (GBI)
WHO Disability Assessment Schedule (WHODAS)
Self-Evaluation of Life Function (SELF)
HRQoL
Any questionnaire not specified above that is relevant
3. Listening ability
Abbreviated Profile of Hearing Aid Benefit (APHAB)
Speech, Spatial and Qualities of Hearing (SSQ)
Glasgow Hearing Aid Benefit Profile (GHABP) residual disability subscale
4. Speech recognition in noise test 5. Usage of hearing aids (including data logging and self-report (if applicable) Important outcomes 6. Social functioning or employment
Study design RCT and systematic reviews of RCTs
17.3.1 Clinical evidence 1
No clinical evidence was identified comparing different methods of follow-up and monitoring or 2 different frequencies. See study selection flow chart in appendix E and the excluded studies list in 3 appendix L. 4
17.3.2 Economic evidence 5
No relevant health economic studies were identified for either review question. 6
See also the health economic study selection flow chart in appendix F. 7

Hearing loss Monitoring and follow-up
© NICE 2017. All rights reserved. Subject to Notice of rights. 228
17.3.3 Evidence statements 1
Clinical 2
No relevant clinical evidence was found. 3
Economic 4
No relevant economic evaluations were identified. 5
17.3.4 Recommendations and link to evidence 6
Recommendations 32. Offer adults with hearing aids a face-to-face audiology appointment 6 to 12 weeks after the hearing aids are fitted.
33. For adults with hearing loss who have chosen a management strategy other than hearing aids, such as assistive listening devices or communication strategies, offer a follow-up appointment when the effectiveness of the device or strategy can be evaluated.
34. Tell adults with hearing loss how to contact audiology services in the future if they have chosen not to have a hearing aid or other device.
Research recommendation
5. What is the clinical and cost effectiveness of monitoring and follow-up of adults with hearing loss post-intervention compared with usual care?
Relative values of different outcomes
The following critical outcomes were included in this review: hearing-specific health-related quality of life including HHIE, QDS and Auditory Disability Preference – Visual Analog Scale (ADPI-VAS)., health-related quality of life including HUI-3, EQ-5D, Glasgow Benefit Inventory (GBI) and WHODAS., listening ability including APHAB, SSQ and GHABP, speech recognition in noise test, usage of hearing aids (including data logging and self-report if applicable).
Outcomes reporting social functioning or employment were considered important outcomes.
Quality of the clinical evidence
No evidence was identified for inclusion in this review.
Trade-off between clinical benefits and harms
The committee made consensus recommendations based on its clinical knowledge and expertise. The committee agreed that as no evidence was identified a research recommendation should be made to establish the clinical and cost effectiveness of monitoring and follow-up, and to understand how and when they might best be used in clinical practice.
Method of delivery of follow-up
Current practice is to offer a follow-up appointment 6 to 12 weeks after fitting a hearing device and the committee considered it very important that people have this in order to assess how they are adapting to the hearing device and to resolve any difficulties or problems early. Not providing this service can result in people giving up using their hearing aids and may consequently have a negative impact on their quality of life over time as their ability to communicate and participate in everyday situations declines.
The committee agreed that face-to-face follow-up appointments are the usual
Hearing loss Monitoring and follow-up
© NICE 2017. All rights reserved. Subject to Notice of rights. 229
method of providing this service, however either face-to-face or telephone appointments are currently permitted. The committee noted that for people who have been fitted with hearing aids a face-to-face appointment is preferable in order to check the fitting of the device and make any necessary adjustments (see section 18, interventions to support the use of hearing aids), and a telephone appointment would not be as helpful. The committee further noted that ability to use the telephone is one of the issues that needs to be addressed by this appointment, precisely because many hearing aid users struggle with this, and so some hearing aid users would be unable to use a telephone well at the time of the appointment.
The committee discussed the difficulties some people may have in attending audiology services in person for hearing assessments, fitting of hearing aids, demonstrating other listening devices and ongoing management. The committee acknowledged the inequalities in accessing audiology services for some populations, such as older people, those who live in residential care homes or those with learning disabilities. The committee noted a flexible approach in the delivery of hearing services is desirable to ensure such populations are not disadvantaged .
The committee discussed provision of follow-up appointments for people who opt to have other interventions such as assistive listening devices or other auditory support strategies rather than a hearing aid. It would not be possible to indicate a time frame when this should occur because this would be dependent on the intervention chosen and how long the user would need to use it for before a useful assessment could be made. However the committee agreed that a follow-up appointment should be discussed with the person and offered for a time when an evaluation could be made. This could be arranged over the phone or face-to-face at the clinic dependent on what was appropriate.
Some people may decline all interventions, in which case it was agreed by the committee that information on how to re-access audiology services should be provided to the person in order that they can obtain further advice or reassessment in the future.
Frequency of monitoring
The committee discussed the absence of any evidence on the frequency of monitoring. Currently there is no automatic system to recall people for ongoing monitoring and it is up to the individual to self-refer when they need their hearing reassessed or require assistance with their hearing device. Although the recommended practice provided by the NHS standard contract service model
74 ,75 is
that hearing needs should be reviewed 3 years after fitting a hearing device, the committee considered that there is variation in practice across the country. The committee agreed that it is important that patients are aware of how to re-access audiology services when needed, and that health professionals update and maintain patient records to facilitate follow-up and ongoing monitoring of patients and to improve information sharing between health professionals.
Because no evidence was found the committee agreed a research recommendation should be made to assess the benefits of ongoing monitoring, what this should include and who would benefit.
Trade-off between net clinical effects and costs
No health economic evaluations were identified specifically comparing methods of delivery of follow-up or different timings of follow-up. However, the committee noted that the economic evaluation identified for the review of interventions to support the use of hearing aids (section 18.2.2) addressed the cost effectiveness of implementing a single follow-up appointment after 6 months and suggested that this intervention was effective.
The original economic modelling conducted for this guideline (see appendix N) assumed that a follow-up appointment would be included 6–12 weeks following hearing aid fitting, and the cost of that appointment was included in the modelling, which found the whole pathway, including hearing assessment, hearing aid fitting and follow-up appointment, to be cost-effective. As follow-up appointments are

Hearing loss Monitoring and follow-up
© NICE 2017. All rights reserved. Subject to Notice of rights. 230
expected to increase the benefits gained by hearing aid use, by increasing the proportion of the time hearing aids are used successfully, such appointments are not just cost effective on their own, but are integral to making the whole process of hearing aid fitting and use cost effective.
A follow-up appointment 6–12 weeks after initial hearing aid fitting is current usual practice, and is recommended in the NHS England commissioning framework.
75 This
recommendation should therefore require no more activity than is already expected, although the committee noted that at present it may be that not all follow-up appointments are being undertaken. If this is the case then an increase in planned early follow-up appointments would be required, however, the committee noted that this would reduce the number of later unplanned follow-up appointments booked by the hearing aid users, and also noted the clinical benefits from increasing the number of people able to use their hearing aids effectively, thereby avoiding a waste of money on hearing aids that are not used. The committee also noted the qualitative evidence from the information, support and advice review (see chapter 12) about the importance of follow-up.
The cost to the NHS of a follow-up appointment is dependent on the length of time the audiologist spends conducting the appointment. Hence, whether an appointment is conducted by phone or face-to-face (at an audiology clinic) does not affect the cost of the appointment if both are the same length. Therefore there is no economic reason not to favour face-to-face appointments.
The committee is therefore confident that conducting a face-to-face follow-up appointment 6–12 weeks after hearing aid fitting is either cost saving or cost effective at a cost-effectiveness threshold of £20,000 per QALY gained.
People who have chosen management strategies other than hearing aids would also be expected to benefit from a follow-up appointment, for similar reasons to hearing aid users. A short amount of time spent ensuring that an individual is following the optimum communication strategies, or can use their assistive listening device effectively, could lead to much greater success for the individual, and could reduce future unplanned appointments or other unnecessary use of resources due to problems accessing healthcare. Therefore, the committee expect that a follow-up appointment for people in this group would also be cost effective or cost saving. However, given a lack of evidence or current standard practice, and the diversity of options in this category, the committee chose not to define a time period for the follow-up appointment.
Other considerations None
1

Hearing loss Interventions to support the use of hearing aids
© NICE 2017. All rights reserved. Subject to Notice of rights. 231
18 Interventions to support the use of hearing aids 1
Introduction 18.1 2
Many people choose to use hearing aids as part of the management of their hearing and 3 communication difficulties. Hearing aids have been shown to be effective in reducing the 4 participation restrictions associated with hearing and communication needs, and improving listening 5 abilities and health-related quality of life. 6
While the majority of people go on to use their hearing aids successfully, others stop using their 7 hearing aids. Reported rates of non-use of hearing aids vary widely.36 The reasons for non-use are 8 reported as many and varied including: unrealistic expectations, unsatisfactory sound quality, poor 9 hearing aid handling skills, discomfort, limited knowledge about and access to support, psychosocial 10 factors, poor manual dexterity, low self-efficacy, limited support from family members, and the 11 attitude of healthcare professionals. 12
Clinical practice across the UK is variable. Some services may include assessment of motivation, offer 13 follow-up appointments, peer or volunteer support or self-management courses, or provide more 14 personalised information. However, it is unclear which of these, or other interventions, contribute to 15 continued and effective use of hearing aids. Other services provide no follow-up (or follow-up only if 16 requested), no support and no signposting to other services. 17
This chapter aims to examine which interventions support the continued effective use of hearing aids 18 and which interventions or approaches may reduce the non-use of hearing aids. 19
Review question: What is the clinical and cost effectiveness of 18.220
interventions to support continuing use of hearing aids? 21
For full details see review protocol in appendix C. 22
Table 98: PICO characteristics of review question 23
Population Adults, aged 18 and over, using at least one prescribed hearing aid
Interventions Patient education
Patient activation
Peer support
Self-management resources and tools for example:
o collaborative decision-making
o battery replacement services
Comparisons To each other
Outcomes Critical outcomes
Hearing aid use (measured as adherence or daily hours of use)
Adverse effects (inappropriate advice or clinical practice, or patient complaints)
Patient-reported outcomes including:
o quality of life,
o hearing handicap,
o hearing aid benefit and communication
Restricted participation/activity limitation
Hearing aid benefit and communication
Outcomes reported by carers or relatives

Hearing loss Interventions to support the use of hearing aids
© NICE 2017. All rights reserved. Subject to Notice of rights. 232
Outcomes measured over the short (≤12 weeks), medium (>12 to <52 weeks) and long term (≥1 year).
Study design Randomised control trials (RCT)
Quasi-RCTs
Systematic review of RCTs
Cross-over studies where data are reported prior to cross-over
18.2.1 Clinical evidence 1
A recent Cochrane review8 was identified that addresses our clinical question, and an expanded 2 search was performed to fully cover our protocol and broaden the search, adding terms for aftercare, 3 repairs, maintenance, batteries and peer support. These terms were not specifically excluded from 4 the Cochrane search but were identified by the committee as important terms to include in our 5 search strategy. No further studies were identified for inclusion from this expanded Cochrane search. 6 A further 3 studies were identified 35 ,116;1 from searches on decision tools and were thought to fit 7 better within this review, therefore 4 studies were included in the review; these are summarised in 8 Error! Reference source not found. below. Evidence from these studies is summarised in the clinical 9 vidence summary tables below (Table 99: Summary of studies included in the review 10
Study Intervention and comparison Population Outcomes Comments
Aazh 20161
Intervention (n=19): Motivational interviewing (MI) plus standard care.
Comparison (n=17): Standard care.
Significant other accompanied participant for first visit if they wanted to take part in the study
n=36
Adults fitted with hearing aids who reported using their hearing aids for 4 hours or less per day.
Mean (SD) age: Intervention group 75 (8.8), control group 69 (13.6).
22 males, 15 females
Hearing aid use: daily hours of use by data logging
Hearing-specific health-relate quality of life
International Outcome Inventory for Hearing Aids (IOI-HA)
International Outcome Inventory for Hearing Aids – Significant Other
World Health Organization’s Disability Assessment Schedule II
Hospital Anxiety and Depression Scale)
RCT
Intervention post-fitting
GHABP handicap score at baseline higher in standard care group (46.6 versus 36.6%)
HADS depression score lower at baseline in standard care group (1.8 versus 3.9 on 0-21 scale)
80% of MI group and 53% of standard care group had bilateral hearing aids
Recruitment rate was 17% of those invited
Barker 20168
Systematic review of RCTs and quasi-randomised studies including the following comparisons:
Self-management support interventions versus alternative interventions that control for other elements delivery method/pattern.
Delivery system design interventions versus alternative interventions that control for content.
Combined self-management support/delivery system design interventions versus standard care/control.
Decision support interventions versus standard care.
Clinical information system interventions versus standard care.
Adults with hearing loss who use hearing aids (37 studies; n=4129)
Age: most studies included only those >50 years.
Mean age generally in the 60-70-year age range.
Primary outcomes:
Hearing aid use
Adherence
Daily hours of hearing aid use
Adverse effects
Inappropriate advice/clinical practice
Patient complaints (around physical and psychosocial management of the hearing aid, or about the intervention)
Secondary outcomes:
Quality of life
Hearing handicap
Hearing aid benefit
Communication
All outcomes recorded for short- (≤12 weeks), medium- (>12-<52 weeks), and long-term (≥1 year) time points where
Unclear if all participants of all included trials had adult-onset hearing loss
Outpatient clinic setting
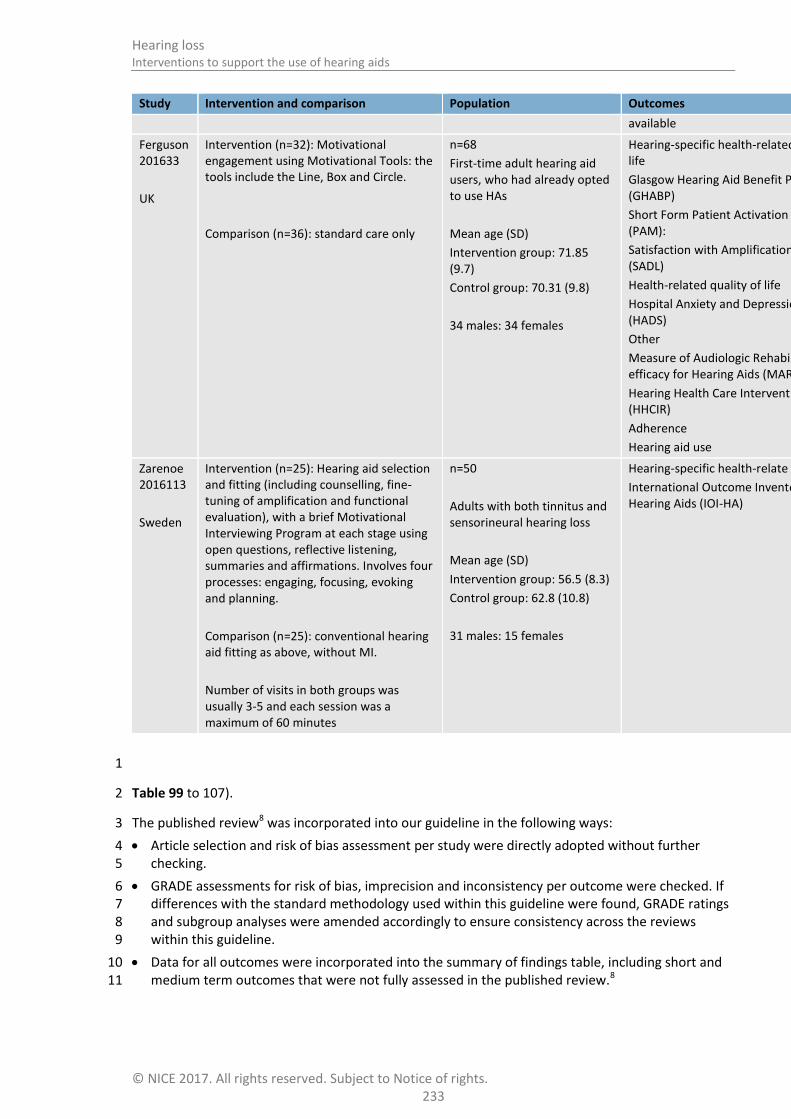
Hearing loss Interventions to support the use of hearing aids
© NICE 2017. All rights reserved. Subject to Notice of rights. 233
Study Intervention and comparison Population Outcomes Comments
available
Ferguson 201633
UK
Intervention (n=32): Motivational engagement using Motivational Tools: the tools include the Line, Box and Circle.
Comparison (n=36): standard care only
n=68
First-time adult hearing aid users, who had already opted to use HAs
Mean age (SD)
Intervention group: 71.85 (9.7)
Control group: 70.31 (9.8)
34 males: 34 females
Hearing-specific health-related quality of life
Glasgow Hearing Aid Benefit Profile (GHABP)
Short Form Patient Activation Measure (PAM):
Satisfaction with Amplification in Daily Life (SADL)
Health-related quality of life
Hospital Anxiety and Depression Scale (HADS)
Other
Measure of Audiologic Rehabilitation Self-efficacy for Hearing Aids (MARS-HA)
Hearing Health Care Intervention Readiness (HHCIR)
Adherence
Hearing aid use
Quasi-RCT
The outcome Hearing Health Care Intervention Readiness (HHCIR) was measured at assessment but not at follow-up
Pre-fitting intervention
Zarenoe 2016113
Sweden
Intervention (n=25): Hearing aid selection and fitting (including counselling, fine-tuning of amplification and functional evaluation), with a brief Motivational Interviewing Program at each stage using open questions, reflective listening, summaries and affirmations. Involves four processes: engaging, focusing, evoking and planning.
Comparison (n=25): conventional hearing aid fitting as above, without MI.
Number of visits in both groups was usually 3-5 and each session was a maximum of 60 minutes
n=50
Adults with both tinnitus and sensorineural hearing loss
Mean age (SD)
Intervention group: 56.5 (8.3)
Control group: 62.8 (10.8)
31 males: 15 females
Hearing-specific health-relate quality of life
International Outcome Inventory for Hearing Aids (IOI-HA)
RCT
Intervention at time of fitting and post-fitting
Patients were primarily presenting for management of their tinnitus
The control group had greater hearing loss in the better ear when measured at follow-up (mean PTA 26.9 versus 17.7 dB in MI group)
The number of visits ranged between 3 and 5 and was on average lower in the MI group (3.3 versus 4.1 in the control group)
1
Table 99 to 107). 2
The published review8 was incorporated into our guideline in the following ways: 3
Article selection and risk of bias assessment per study were directly adopted without further 4 checking. 5
GRADE assessments for risk of bias, imprecision and inconsistency per outcome were checked. If 6 differences with the standard methodology used within this guideline were found, GRADE ratings 7 and subgroup analyses were amended accordingly to ensure consistency across the reviews 8 within this guideline. 9
Data for all outcomes were incorporated into the summary of findings table, including short and 10 medium term outcomes that were not fully assessed in the published review.8 11

Hearing loss Interventions to support the use of hearing aids
© NICE 2017. All rights reserved. Subject to Notice of rights. 234
See also the study selection flow chart in appendix E, forest plots in appendix K, study evidence 1 tables in appendix H, GRADE tables in appendix J and excluded studies list in appendix L. All 2 amendments made to the published review8 are detailed in appendix R. 3
The Cochrane review aimed to identify whether any interventions can improve hearing aid use in 4 adults. This systematic review included RCTs and quasi-randomised studies and reported on 37 5 studies involving 4,129 participants. The interventions included varied widely between studies and 6 were categorised as: 7
Self-management support (SMS) interventions, which aim to enable patients to optimally manage 8 their own health, such as: 9
o training and practice in skills and coping strategies for communication 10
o psychosocial exercises addressing the impact of hearing loss 11
o information on hearing aids and practice/problem-solving opportunities 12
o self-help literature. 13
Delivery system design (DSD) interventions that change the mode, format, timing or follow-up 14 pattern of self-management support. This may include: 15
o remote online fitting versus face-to-face fitting 16
o telephone follow-up versus face-to-face follow-up 17
o group versus individual training session 18
o post-fitting adjustment versus no post-fitting adjustment. 19
Combined self-management support and delivery system design interventions. 20
21

Interven
tion
s to su
pp
ort th
e use o
f hearin
g aids
Hearin
g loss
© N
ICE 2
01
7. A
ll rights reserved
. Sub
ject to N
otice o
f rights.
23
5
Table 99: Summary of studies included in the review 1
Study Intervention and comparison Population Outcomes Comments
Aazh 20161
Intervention (n=19): Motivational interviewing (MI) plus standard care.
Comparison (n=17): Standard care.
Significant other accompanied participant for first visit if they wanted to take part in the study
n=36
Adults fitted with hearing aids who reported using their hearing aids for 4 hours or less per day.
Mean (SD) age: Intervention group 75 (8.8), control group 69 (13.6).
22 males, 15 females
Hearing aid use: daily hours of use by data logging
Hearing-specific health-relate quality of life
International Outcome Inventory for Hearing Aids (IOI-HA)
International Outcome Inventory for Hearing Aids – Significant Other
World Health Organization’s Disability Assessment Schedule II
Hospital Anxiety and Depression Scale)
RCT
Intervention post-fitting
GHABP handicap score at baseline higher in standard care group (46.6 versus 36.6%)
HADS depression score lower at baseline in standard care group (1.8 versus 3.9 on 0-21 scale)
80% of MI group and 53% of standard care group had bilateral hearing aids
Recruitment rate was 17% of those invited
Barker 20168
Systematic review of RCTs and quasi-randomised studies including the following comparisons:
Self-management support interventions versus alternative interventions that control for other elements delivery method/pattern.
Delivery system design interventions versus alternative interventions that control for content.
Combined self-management support/delivery system design interventions versus standard care/control.
Adults with hearing loss who use hearing aids (37 studies; n=4129)
Age: most studies included only those >50 years.
Mean age generally in the 60-70-year age range.
Primary outcomes:
Hearing aid use
Adherence
Daily hours of hearing aid use
Adverse effects
Inappropriate advice/clinical practice
Patient complaints (around physical and psychosocial management of the hearing aid, or about the intervention)
Secondary outcomes:
Quality of life
Hearing handicap
Hearing aid benefit
Communication
Unclear if all participants of all included trials had adult-onset hearing loss
Outpatient clinic setting

Interven
tion
s to su
pp
ort th
e use o
f hearin
g aids
Hearin
g loss
© N
ICE 2
01
7. A
ll rights reserved
. Sub
ject to N
otice o
f rights.
23
6
Study Intervention and comparison Population Outcomes Comments
Decision support interventions versus standard care.
Clinical information system interventions versus standard care.
All outcomes recorded for short- (≤12 weeks), medium- (>12-<52 weeks), and long-term (≥1 year) time points where available
Ferguson 201633
UK
Intervention (n=32): Motivational engagement using Motivational Tools: the tools include the Line, Box and Circle.
Comparison (n=36): standard care only
n=68
First-time adult hearing aid users, who had already opted to use HAs
Mean age (SD)
Intervention group: 71.85 (9.7)
Control group: 70.31 (9.8)
34 males: 34 females
Hearing-specific health-related quality of life
Glasgow Hearing Aid Benefit Profile (GHABP)
Short Form Patient Activation Measure (PAM):
Satisfaction with Amplification in Daily Life (SADL)
Health-related quality of life
Hospital Anxiety and Depression Scale (HADS)
Other
Measure of Audiologic Rehabilitation Self-efficacy for Hearing Aids (MARS-HA)
Hearing Health Care Intervention Readiness (HHCIR)
Adherence
Hearing aid use
Quasi-RCT
The outcome Hearing Health Care Intervention Readiness (HHCIR) was measured at assessment but not at follow-up
Pre-fitting intervention
Zarenoe 2016113
Sweden
Intervention (n=25): Hearing aid selection and fitting (including counselling, fine-tuning of amplification and functional evaluation), with a brief Motivational Interviewing Program at each stage using open questions, reflective listening, summaries and affirmations. Involves four processes: engaging, focusing, evoking and planning.
n=50
Adults with both tinnitus and sensorineural hearing loss
Mean age (SD)
Intervention group: 56.5 (8.3)
Control group: 62.8 (10.8)
Hearing-specific health-relate quality of life
International Outcome Inventory for Hearing Aids (IOI-HA)
RCT
Intervention at time of fitting and post-fitting
Patients were primarily presenting for management of their tinnitus
The control group had greater hearing loss in the better ear when measured at follow-up

Interven
tion
s to su
pp
ort th
e use o
f hearin
g aids
Hearin
g loss
© N
ICE 2
01
7. A
ll rights reserved
. Sub
ject to N
otice o
f rights.
23
7
Study Intervention and comparison Population Outcomes Comments
Comparison (n=25): conventional hearing aid fitting as above, without MI.
Number of visits in both groups was usually 3-5 and each session was a maximum of 60 minutes
31 males: 15 females
(mean PTA 26.9 versus 17.7 dB in MI group)
The number of visits ranged between 3 and 5 and was on average lower in the MI group (3.3 versus 4.1 in the control group)
1
Table 99: Clinical evidence summary: self-management support (SMS) interventions versus control 2
Outcomes
No of Participants (studies) Follow-up
Quality of the evidence (GRADE)
Relative effect (95% CI)
Anticipated absolute effects
Risk with Control
Risk difference with self-management support interventions versus no intervention (95% CI)
Adherence No studies identified
Daily hours of hearing aid use One study reported daily hours of hearing aid use but data could not be analysed
Hearing aid use (>8 h/day) 40
(1 study)
8-10 weeks
VERY LOW a,b
due to risk of bias, imprecision
RR 4.00 (0.49 to 32.72)
50 per 1000 150 more per 1000 (from 25 fewer to 1000 more)
Adverse effects No studies identified
Quality of life (WHODAS 2.0 scale, 0 to 100, 100 worst)
35 (1 study)
0–12 months
VERY LOW a,b
due to risk of bias, imprecision
- The mean WHODAS 2.0 score (scale 0-100) in the control group was
28.6 (SD: 19.3)
The mean WHODAS 2.0 score (scale 0-100) in the intervention group was
9.1 lower (21.33 lower to 3.13 higher)

Interven
tion
s to su
pp
ort th
e use o
f hearin
g aids
Hearin
g loss
© N
ICE 2
01
7. A
ll rights reserved
. Sub
ject to N
otice o
f rights.
23
8
Outcomes
No of Participants (studies) Follow-up
Quality of the evidence (GRADE)
Relative effect (95% CI)
Anticipated absolute effects
Risk with Control
Risk difference with self-management support interventions versus no intervention (95% CI)
Self-reported hearing handicap (HHIE scale, 0 to 100, 100 worst)
87 (2 studies)
0–12 months
LOW a,b
due to risk of bias, imprecision
- The mean self-reported hearing handicap in the control groups ranged from
39.0 to 58.6
The mean self-reported hearing handicap in the intervention groups was
12.80 lower (23.11 lower to 2.48 lower)
Communication
(verbal subscale of the CPHI scale from 0 to 5, 5 best)
52
(1 study)
0–12 months
LOW a,b
due to risk of bias, imprecision
d
- The mean reported use of verbal communication strategy in the control group was
2.89 (SD 0.87)
The mean reported use of verbal communication strategy in the intervention group was
0.72 higher (0.21 higher to 1.23 higher)
a Downgraded by 1 increment if the majority of the evidence was at high risk of bias, and downgraded by 2 increments if the majority of the evidence was at very high risk of bias b Downgraded by 1 increment if the confidence interval crossed one MID or by 2 increments if the confidence interval crossed both MIDs
c The minimal important difference on this scale is reported to be 18.7 for face-to-face administration and 36 for pencil and paper (Weinstein 1986). Both included studies used face-to-face administration.
d The minimal important difference for this subscale of the CPHI is 0.93 at the 0.05 level (Demorest 1988).
1
Table 100: Clinical evidence summary: delivery system design (DSD) interventions versus control 2
Outcomes
No of Participants (studies) Follow-up
Quality of the evidence (GRADE)
Relative effect (95% CI)
Anticipated absolute effects
Risk with Control
Risk difference with Delivery system design interventions versus control (95% CI)
Adherence
Number of people fitted with hearing
686 (2 studies)
HIGH RR 1.02 (0.99 to
928 per 1000 19 more per 1000 (from 9 fewer to 46 more)

Interven
tion
s to su
pp
ort th
e use o
f hearin
g aids
Hearin
g loss
© N
ICE 2
01
7. A
ll rights reserved
. Sub
ject to N
otice o
f rights.
23
9
Outcomes
No of Participants (studies) Follow-up
Quality of the evidence (GRADE)
Relative effect (95% CI)
Anticipated absolute effects
Risk with Control
Risk difference with Delivery system design interventions versus control (95% CI)
aid/number of people who use the aids
0–12 months 1.05)
Daily hours of hearing aid use
Average self-reported or data-logged hours of use per day. Scale from: 0 to 12 hours
700 (4 studies)
0–12 months
HIGH
- The mean daily hours of hearing aid use in the control groups ranged from
6.75 to 10.2
The mean daily hours of hearing aid use in the intervention groups was 0.06 lower (1.06 lower to 0.95 higher)
Adverse effects
Number of outstanding complaints
98 (1 study)
≥1 year
LOW a,b
due to risk of bias, imprecision
RR 0.75 (0.5 to 1.12)
571 per 1000 143 fewer per 1000 (from 285 fewer to 69 more)
Self-reported hearing handicap
(HHIE scale, 0 to 100, 100 worst)
628 (2 studies)
0 to 12 months
HIGH
- The mean self-reported hearing handicap in the control groups ranged from
15 to 24
The mean self-reported hearing handicap in the intervention groups was 0.7 lower (5.22 lower to 3.81 higher)
Hearing aid benefit (Outer EAR scale, 0 to 100, 100 best)
582 (1 study)
Mean 6 months
HIGH
- The mean hearing aid benefit in the control group was 67
The mean hearing aid benefit in the intervention group was 1.8 higher (3.1 lower to 6.7 higher)
Use of verbal communication strategy
(verbal subscale of the CPHI scale, 0 to 5,
588 (1 study)
MODERATEd
due to
- The mean use of verbal
The mean use of verbal communication strategy in the intervention group was
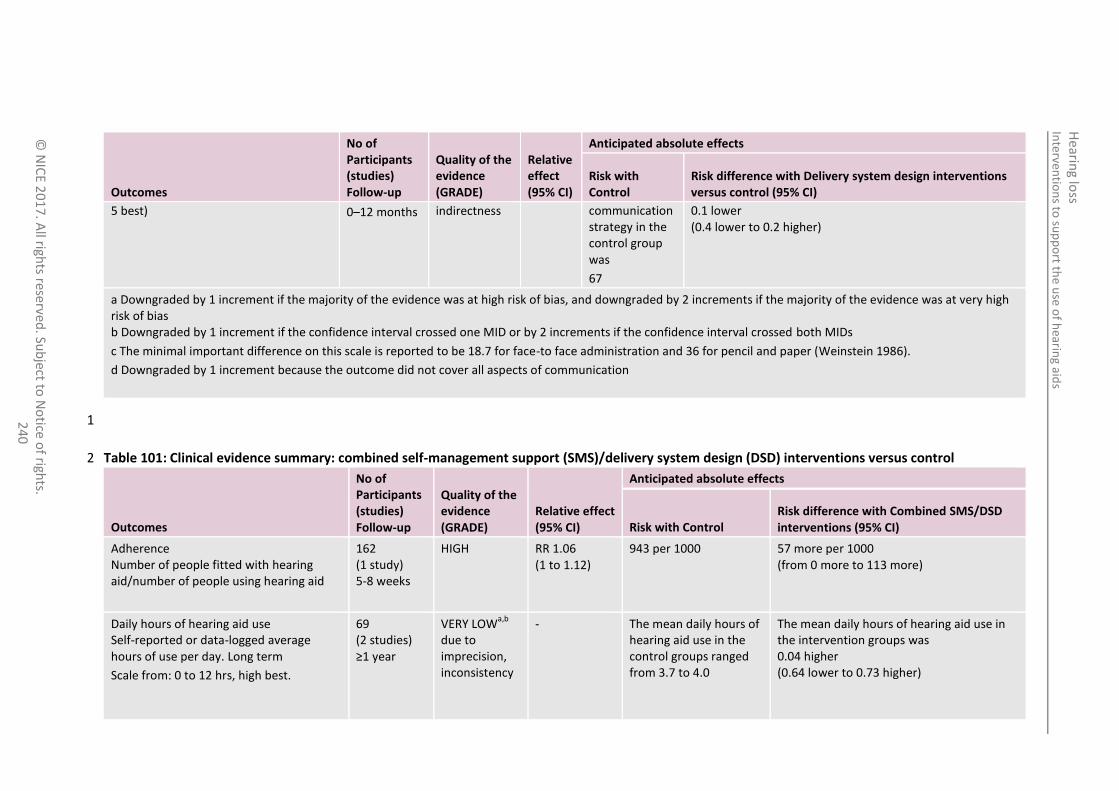
Interven
tion
s to su
pp
ort th
e use o
f hearin
g aids
Hearin
g loss
© N
ICE 2
01
7. A
ll rights reserved
. Sub
ject to N
otice o
f rights.
24
0
Outcomes
No of Participants (studies) Follow-up
Quality of the evidence (GRADE)
Relative effect (95% CI)
Anticipated absolute effects
Risk with Control
Risk difference with Delivery system design interventions versus control (95% CI)
5 best) 0–12 months indirectness communication strategy in the control group was
67
0.1 lower (0.4 lower to 0.2 higher)
a Downgraded by 1 increment if the majority of the evidence was at high risk of bias, and downgraded by 2 increments if the majority of the evidence was at very high risk of bias b Downgraded by 1 increment if the confidence interval crossed one MID or by 2 increments if the confidence interval crossed both MIDs
c The minimal important difference on this scale is reported to be 18.7 for face-to face administration and 36 for pencil and paper (Weinstein 1986).
d Downgraded by 1 increment because the outcome did not cover all aspects of communication
1
Table 101: Clinical evidence summary: combined self-management support (SMS)/delivery system design (DSD) interventions versus control 2
Outcomes
No of Participants (studies) Follow-up
Quality of the evidence (GRADE)
Relative effect (95% CI)
Anticipated absolute effects
Risk with Control Risk difference with Combined SMS/DSD interventions (95% CI)
Adherence Number of people fitted with hearing aid/number of people using hearing aid
162 (1 study) 5-8 weeks
HIGH RR 1.06 (1 to 1.12)
943 per 1000 57 more per 1000 (from 0 more to 113 more)
Daily hours of hearing aid use Self-reported or data-logged average hours of use per day. Long term
Scale from: 0 to 12 hrs, high best.
69 (2 studies) ≥1 year
VERY LOWa,b
due to imprecision, inconsistency
- The mean daily hours of hearing aid use in the control groups ranged from 3.7 to 4.0
The mean daily hours of hearing aid use in the intervention groups was 0.04 higher (0.64 lower to 0.73 higher)

Interven
tion
s to su
pp
ort th
e use o
f hearin
g aids
Hearin
g loss
© N
ICE 2
01
7. A
ll rights reserved
. Sub
ject to N
otice o
f rights.
24
1
Outcomes
No of Participants (studies) Follow-up
Quality of the evidence (GRADE)
Relative effect (95% CI)
Anticipated absolute effects
Risk with Control Risk difference with Combined SMS/DSD interventions (95% CI)
Daily hours of hearing aid use
Self-reported or data-logged average hours of use per day. Short/medium term
Scale from: 0 to 12 hrs, high best.
534
(9 studies)
0–12 months
HIGH The mean daily hours of hearing aid use in the control groups ranged from 4.0 to 11.62
The mean daily hours of hearing aid use in the intervention groups was
0.19 higher
(0.01 lower to 0.4 higher)
Quality of life Validated self-report measures.
Scale from: 0 to 5, 5 best.
69 (2 studies) ≥1 year
MODERATEb
due to imprecision
The mean quality of life in the control groups ranged from 3.6 to 4.1
The mean quality of life in the intervention groups was 0.32 higher (0.17 lower to 0.8 higher)
Quality of life - short/medium-term
(High best)
530 (8 studies) 0–12 months
MODERATEd
due to risk of bias
Unable to summarise as different scales used
The mean quality of life in the intervention groups was 0.02 standard deviations higher (0.15 lower to 0.19 higher)
Self-reported hearing handicap Validated self-report measures (scale 0-100, 0 best)
Activate - symptoms
69 (2 studies) ≥1 year
MODERATEb
due to imprecision
The mean self-reported hearing handicap in the control groups ranged from 14 to 18.2
The mean self-reported hearing handicap in the intervention groups was 0.11 lower (6.02 lower to 5.80 higher)
Self-reported hearing handicap Validated self-report measures (scale 0-63, 0 best)
Activate - psychosocial
19 (1 study) ≥1 year
LOWb,d
due to risk of bias, imprecision
The mean self-reported hearing handicap in the control group was 19.7
The mean self-reported hearing handicap in the intervention group was 8.30 lower (13.72 to 2.88 lower)

Interven
tion
s to su
pp
ort th
e use o
f hearin
g aids
Hearin
g loss
© N
ICE 2
01
7. A
ll rights reserved
. Sub
ject to N
otice o
f rights.
24
2
Outcomes
No of Participants (studies) Follow-up
Quality of the evidence (GRADE)
Relative effect (95% CI)
Anticipated absolute effects
Risk with Control Risk difference with Combined SMS/DSD interventions (95% CI)
Self-reported hearing handicap Validated self-report measures (low best)
728 (15 studies) 0–12 months
LOWa,d
due to risk of bias, inconsistency
Unable to summarise as different scales used, and some change scores
The mean self-reported hearing in the intervention groups was 0.26 standard deviations lower (0.48 to 0.04 lower)
Hearing aid benefit Validated self-report measures (IOI-HA item 4; scale from: 0 to 5, 0 best).
69 (2 studies) ≥1 year
MODERATEb
due to imprecision
The mean hearing aid benefit in the control groups ranged from 4.1 to 4.2
The mean hearing aid benefit in the intervention groups was 0.3 higher (0.02 to 0.58 higher)
Hearing aid benefit - short/medium-term (high best)
361 (7 studies) 0–12 months
HIGH Unable to summarise as different scales used
The mean hearing aid benefit in the intervention groups was 0.1 standard deviations higher (0.15 lower to 0.36 higher)
Use of verbal communication strategy Validated self-report measures (Verbal subscale of the CPHI; scale from: 0 to 5, 5 best).
34 (1 study) ≥1 years
LOWb,f
due to imprecision, indirectness
The mean use of verbal communication strategy in the control group was
2.2
The mean use of verbal communication strategy in the intervention group was 0.3 higher (0.2 lower to 0.8 higher)
Use of verbal communication strategy - short/medium-term
Verbal subscale of the CPHI; scale from: 0 to 5, 5 best.
223 (4 studies) 0–12 months
VERY LOWb,d,f
due to risk of bias, imprecision, indirectness
The mean use of verbal communication strategy in the control group ranged from
2.0 to 3.22
The mean use of verbal communication strategy in the intervention group was 0.45 higher (0.15 higher to 0.74 higher)

Interven
tion
s to su
pp
ort th
e use o
f hearin
g aids
Hearin
g loss
© N
ICE 2
01
7. A
ll rights reserved
. Sub
ject to N
otice o
f rights.
24
3
Outcomes
No of Participants (studies) Follow-up
Quality of the evidence (GRADE)
Relative effect (95% CI)
Anticipated absolute effects
Risk with Control Risk difference with Combined SMS/DSD interventions (95% CI)
a Downgraded by 1 or 2 increments because of heterogeneity b Downgraded by 1 increment if the confidence interval crossed one MID or by 2 increments if the confidence interval crossed both MIDs
c MID for this subscale of the IOI-HA is 0.32 for those with mild-moderate hearing loss and 0.28 for those with moderate to severe hearing loss
d Downgraded by 1 increment if the majority of the evidence was at high risk of bias, and downgraded by 2 increments if the majority of the evidence was at very high risk of bias
e MID for this subscale of the IOI-HA is 0.39 for those with mild-moderate hearing loss and 0.32 for those with moderate to severe hearing loss
f Downgraded 1 increment because of lack of a global measure of communication MID for this subscale of the CPHI in 0.93 at 0.05 level
1
Table 102: Clinical evidence summary: motivational interviewing versus usual care (first time hearing aid users) 2
Outcomes
No of Participants (studies) Follow-up
Quality of the evidence (GRADE)
Relative effect (95% CI)
Anticipated absolute effects
Risk with Control Risk difference with Motivational interviewing versus usual care (95% CI)
International Outcome Inventory for Hearing Aids
Scale: 7-35 (high best)
46 (1 study)
3 months
VERY LOWa,b
due to risk of bias, imprecision
The mean international outcome inventory for hearing aids in the control groups was 27.2
The mean international outcome inventory for hearing aids in the intervention groups was 3.1 higher (0.72 to 5.48 higher)
a Downgraded by 1 increment if the majority of the evidence was at high risk of bias, and downgraded by 2 increments if the majority of the evidence was at very high risk of bias b Downgraded by 1 increment if the confidence interval crossed one MID or by 2 increments if the confidence interval crossed both MIDs
c MID for the IOI-HA is 1.75 for those with mild-moderate hearing loss and 1.62 for those with moderate to severe hearing loss
3

Interven
tion
s to su
pp
ort th
e use o
f hearin
g aids
Hearin
g loss
© N
ICE 2
01
7. A
ll rights reserved
. Sub
ject to N
otice o
f rights.
24
4
Table 103: Clinical evidence summary: motivational interviewing versus usual care (hearing aid users reporting ≤4 hours use per day) 1
Outcomes
No of Participants (studies) Follow-up
Quality of the evidence (GRADE)
Relative effect (95% CI)
Anticipated absolute effects
Risk with usual care Risk difference with Motivational interviewing
Change in hearing aid use (hours/day)
36 (1 study) 1 month
LOWa,b
due to risk of bias, imprecision
The mean change in hearing aid use in the control group was
+2.8 hours/day
The mean change in hearing aid use in the intervention groups was 3.2 higher (1.03 to 5.37 higher)
International Outcome Inventory for Hearing Aids (change score)
Scale: 7-35 (high best)
36 (1 study) 1 month
VERY LOWa,b
due to risk of bias, imprecision
The mean change in IOI-HA in the control group was +7.5
The mean change in IOI-HA in the intervention groups was 0.8 higher (3.61 lower to 5.21 higher)
International Outcome Inventory for Hearing Aids – Significant Other (change score)
Scale: 7-35 (high best)
36 (1 study) 1 month
LOWa,b
due to risk of bias, imprecision
The mean change in IOI-HA-SO in the control group was
+8
The mean change in IOI-HA-SO in the intervention groups was 2.9 higher (4.8 lower to 10.6 higher)
World Health Organization’s Disability Assessment
Schedule II (change score)
Scale: 12-60 (low best)
36 (1 study) 1 month
LOWb,c
due to risk of bias, imprecision
The mean change in WHO DASII in the control groups was
-0.4
The mean change in WHO DASII in the intervention groups was 0.9 lower (3.08 lower to 1.28 higher)
Hospital Anxiety and Depression Scale - Anxiety score (change score)
Scale: 0-21 (low best)
36 (1 study) 1 month
VERY LOWa,b
due to risk of bias, imprecision
The mean change in HADS - anxiety score in the control groups was
-0.9
The mean change in HADS - anxiety score in the intervention groups was 0.27 higher (1.16 lower to 1.7 higher)
Hospital Anxiety and Depression Scale - Depression score (change score)
36 (1 study) 1 month
LOWa,b
due to risk of bias,
The mean change in HADS - depression score in the control groups was
The mean change in HADS - depression score in the intervention groups was 0.1 lower

Interven
tion
s to su
pp
ort th
e use o
f hearin
g aids
Hearin
g loss
© N
ICE 2
01
7. A
ll rights reserved
. Sub
ject to N
otice o
f rights.
24
5
Outcomes
No of Participants (studies) Follow-up
Quality of the evidence (GRADE)
Relative effect (95% CI)
Anticipated absolute effects
Risk with usual care Risk difference with Motivational interviewing
Scale: 0-21 (low best) imprecision -0.5 (1.77 lower to 1.57 higher)
a Downgraded by 1 increment if the majority of the evidence was at high risk of bias, and downgraded by 2 increments if the majority of the evidence was at very high risk of bias b Downgraded by 1 increment if the confidence interval crossed one MID or by 2 increments if the confidence interval crossed both MIDs
c MID for the IOI-HA is 1.75 for those with mild-moderate hearing loss and 1.62 for those with moderate to severe hearing loss
1
Table 104: Clinical evidence summary: motivational engagement versus usual care 2
Outcomes
No of Participants (studies) Follow-up
Quality of the evidence (GRADE)
Relative effect (95% CI)
Anticipated absolute effects
Risk with Control Risk difference with Motivational engagement versus usual care (95% CI)
Hearing aid use (hours/day) 53 (1 study) 10 weeks
VERY LOWa,b
due to risk of bias, imprecision
The mean hearing aid use (hours/day) in the control groups was 8.73 hours
The mean hearing aid use (hours/day) in the intervention groups was 1.28 higher (1.54 lower to 4.1 higher)
Measure of Audiologic Rehabilitation Self-Efficacy for Hearing Aids - Overall Scale from: 0 to 100 (high best)
53 (1 study) 10 weeks
VERY LOWa,b
due to risk of bias, imprecision
The mean measure of audiologic rehabilitation self-efficacy for hearing aids - overall in the control groups was 81.32
The mean measure of audiologic rehabilitation self-efficacy for hearing aids - overall in the intervention groups was 3.93 higher (2.93 lower to 10.79 higher)
Measure of Audiologic Rehabilitation Self-Efficacy for Hearing Aids - Aided listening
53 (1 study) 10 weeks
VERY LOWa,b
due to risk of bias,
The mean measure of audiologic rehabilitation self-efficacy for hearing aids - aided listening in the control
The mean measure of audiologic rehabilitation self-efficacy for hearing aids - aided listening in the intervention

Interven
tion
s to su
pp
ort th
e use o
f hearin
g aids
Hearin
g loss
© N
ICE 2
01
7. A
ll rights reserved
. Sub
ject to N
otice o
f rights.
24
6
Outcomes
No of Participants (studies) Follow-up
Quality of the evidence (GRADE)
Relative effect (95% CI)
Anticipated absolute effects
Risk with Control Risk difference with Motivational engagement versus usual care (95% CI)
Scale from: 0 to 100 (high best). imprecision groups was 85.54
groups was 0.81 higher (7.05 lower to 8.67 higher)
Measure of Audiologic Rehabilitation Self-Efficacy for Hearing Aids - Advanced handling Scale from: 0 to 100 (high best).
53 (1 study) 10 weeks
VERY LOWa,b
due to risk of bias, imprecision
The mean measure of audiologic rehabilitation self-efficacy for hearing aids - advanced handling in the control groups was 56.15
The mean measure of audiologic rehabilitation self-efficacy for hearing aids - advanced handling in the intervention groups was 10.44 higher (4.93 lower to 25.81 higher)
Glasgow Hearing Aid Benefit Profile - Overall Scale from: 0 to 100 (high best).
53 (1 study) 10 weeks
VERY LOWa,b
due to risk of bias, imprecision
The mean Glasgow hearing aid benefit profile - overall in the control groups was 80.49
The mean Glasgow hearing aid benefit profile - overall in the intervention groups was 1.94 lower (11.36 lower to 7.48 higher)
Glasgow Hearing Aid Benefit Profile - Benefit Scale from: 0 to 100 (high best).
53 (1 study) 10 weeks
VERY LOWa,b
due to risk of bias, imprecision
The mean Glasgow hearing aid benefit profile - benefit in the control groups was 68.26
The mean Glasgow hearing aid benefit profile - benefit in the intervention groups was 2.43 lower (14.11 lower to 9.25 higher)
Glasgow Hearing Aid Benefit Profile - Satisfaction Scale from: 0 to 100 (high best).
53 (1 study) 10 weeks
VERY LOWa,b
due to risk of bias, imprecision
The mean Glasgow hearing aid benefit profile - satisfaction in the control groups was 73.41
The mean Glasgow hearing aid benefit profile - satisfaction in the intervention groups was 4.92 higher (6 lower to 15.84 higher)

Interven
tion
s to su
pp
ort th
e use o
f hearin
g aids
Hearin
g loss
© N
ICE 2
01
7. A
ll rights reserved
. Sub
ject to N
otice o
f rights.
24
7
Outcomes
No of Participants (studies) Follow-up
Quality of the evidence (GRADE)
Relative effect (95% CI)
Anticipated absolute effects
Risk with Control Risk difference with Motivational engagement versus usual care (95% CI)
Glasgow Hearing Aid Benefit Profile - Residual disability Scale from: 0 to 100 (high best).
53 (1 study) 10 weeks
VERY LOWa,b
due to risk of bias, imprecision
The mean Glasgow hearing aid benefit profile - residual disability in the control groups was 15.48
The mean Glasgow hearing aid benefit profile - residual disability in the intervention groups was 1.11 higher (6.34 lower to 8.56 higher)
Short form Patient Activation Measure Scale from: 0 to 100 (high best).
53 (1 study) 10 weeks
VERY LOWa,b
due to risk of bias, imprecision
The mean short form patient activation measure in the control groups was 65.55
The mean short form patient activation measure in the intervention groups was 1.84 higher (6.36 lower to 10.04 higher)
Hospital Anxiety and Depression scale - Overall Scale from: 0 to 42 (high worst).
53 (1 study) 10 weeks
VERY LOWa,b
due to risk of bias, imprecision
The mean hospital anxiety and depression scale - overall in the control groups was 5.81
The mean hospital anxiety and depression scale - overall in the intervention groups was 1.01 lower (2.72 lower to 0.7 higher)
Hospital Anxiety and Depression scale - Anxiety Scale from: 0 to 21 (high worst).
53 (1 study) 10 weeks
VERY LOWa,b
due to risk of bias, imprecision
The mean hospital anxiety and depression scale - anxiety in the control groups was 5.41
The mean hospital anxiety and depression scale - anxiety in the intervention groups was 1.08 lower (2.95 lower to 0.79 higher)
Hospital Anxiety and Depression scale - Depression Scale from: 0 to 21 (high worst).
53 (1 study) 10 weeks
VERY LOWa,b
due to risk of bias, imprecision
The mean hospital anxiety and depression scale - depression in the control groups was 6.38
The mean hospital anxiety and depression scale - depression in the intervention groups was 0.5 lower (2.4 lower to 1.4 higher)

Interven
tion
s to su
pp
ort th
e use o
f hearin
g aids
Hearin
g loss
© N
ICE 2
01
7. A
ll rights reserved
. Sub
ject to N
otice o
f rights.
24
8
Outcomes
No of Participants (studies) Follow-up
Quality of the evidence (GRADE)
Relative effect (95% CI)
Anticipated absolute effects
Risk with Control Risk difference with Motivational engagement versus usual care (95% CI)
Satisfaction with Amplification in Daily Life - Overall Scale from: 1 to 7 (high best).
53 (1 study) 10 weeks
VERY LOWa,b
due to risk of bias, imprecision
The mean satisfaction with amplification in daily life - overall in the control groups was 5.31
The mean satisfaction with amplification in daily life - overall in the intervention groups was 0.4 higher (0.01 to 0.79 higher)
Satisfaction with Amplification in Daily Life - Positive effect Scale from: 1 to 7 (high best).
53 (1 study) 10 weeks
VERY LOWa,b
due to risk of bias, imprecision
The mean satisfaction with amplification in daily life - positive effect in the control groups was 5.03
The mean satisfaction with amplification in daily life - positive effect in the intervention groups was 0.3 higher (0.14 lower to 0.74 higher)
Satisfaction with Amplification in Daily Life - Negative features Scale from: 1 to 7 (high best).
53 (1 study) 10 weeks
VERY LOWa,b
due to risk of bias, imprecision
The mean satisfaction with amplification in daily life - negative features in the control groups was 4.84
The mean satisfaction with amplification in daily life - negative features in the intervention groups was 0.72 higher (0.02 to 1.42 higher)
Satisfaction with Amplification in Daily Life - Personal image Scale from: 1 to 7 (high best).
53 (1 study) 1-7
VERY LOWa,b
due to risk of bias, imprecision
The mean satisfaction with amplification in daily life - personal image in the control groups was 5.87
The mean satisfaction with amplification in daily life - personal image in the intervention groups was 0.43 higher (0.18 lower to 1.04 higher)
Satisfaction with Amplification in Daily Life - Service and cost Scale from: 1 to 7 (high best).
53 (1 study) 10 weeks
VERY LOWa,b
due to risk of bias, imprecision
The mean satisfaction with amplification in daily life - service and cost in the control groups was 6.17
The mean satisfaction with amplification in daily life - service and cost in the intervention groups was 0.09 higher (0.33 lower to 0.51 higher)

Interven
tion
s to su
pp
ort th
e use o
f hearin
g aids
Hearin
g loss
© N
ICE 2
01
7. A
ll rights reserved
. Sub
ject to N
otice o
f rights.
24
9
Outcomes
No of Participants (studies) Follow-up
Quality of the evidence (GRADE)
Relative effect (95% CI)
Anticipated absolute effects
Risk with Control Risk difference with Motivational engagement versus usual care (95% CI)
a Downgraded by 1 increment if the majority of the evidence was at high risk of bias, and downgraded by 2 increments if the majority of the evidence was at very high risk of bias b Downgraded by 1 increment if the confidence interval crossed one MID or by 2 increments if the confidence interval crossed both MIDs
1
18.2.2 Economic evidence 2
18.2.2.1 Published literature 3
One health economic study was identified with the relevant comparison and has been included in this review.107 This is summarised in the health economic 4 evidence profile below (Table 105) and the health economic evidence table in appendix I. 5
See also the health economic study selection flow chart in appendix F. 6
Table 105: Health economic evidence profile: before and after additional follow-up visit 7
Study Applicability Limitations Other comments Incremental cost
(c) Incremental effects
Cost effectiveness
(c) Uncertainty
Vuorialho 2006
107
(Finland)
Partially applicable
(a)
Potentially serious limitations
(b)
Based on a single clinical study in Finnish public health service
Before-and-after study design, so no control group (n=98)
All patients were given 1 (monoaural) hearing aid and taught how to use and maintain it
All patients then also received a follow-up appointment after 6 months to check their ability to use the aid and its
£51 per follow-up visit for each patient
[Original fitting of a new hearing aid cost £621]
EQ-5D score:
0.00 [0.68 before and 0.68 after]
Hearing aid use:
Regular: +16%
Occasional: −12%
Non-users: −4%
Handling skills
ICER (cost per QALY):
N/A due to lack of effectiveness
Hearing aid use:
£310(c)
per additional regular hearing aid user
No sensitivity analysis was conducted.

Interven
tion
s to su
pp
ort th
e use o
f hearin
g aids
Hearin
g loss
© N
ICE 2
01
7. A
ll rights reserved
. Sub
ject to N
otice o
f rights.
25
0
Study Applicability Limitations Other comments Incremental cost
(c) Incremental effects
Cost effectiveness
(c) Uncertainty
condition and to advise them further on how to use it
Usage of the hearing aids was measured at 6 months (before additional advice) and 12 months: regular users (>2 hours per day); occasional users (at least once a week); non-users (seldom or never)
(various): all improved
Satisfaction: +9%
Initial + additional appointments: £867 per user compared to £1,015 per user for initial advice only
Abbreviations: ICER: incremental cost-effectiveness ratio; N/A: not applicable; QALY: quality-adjusted life years 1 (a) Study conducted in the Finnish public healthcare system – similar to the UK. Transportation costs were included, but these have been removed for our analysis. Results not given in terms 2
of QALYs. 3 (b) Results are based on a single clinical trial. This was a before-and-after study so there is no independent control group. Sensitivity analysis was not undertaken. 4 (c) Converted from 2006 Euros. Transportation costs subtracted from published results for total costs. 5
6 7

Hearing loss Interventions to support the use of hearing aids
© NICE 2017. All rights reserved. Subject to Notice of rights. 251
18.2.2.2 Unit costs 1
See appendix P. 2
18.2.3 Evidence statements 3
Clinical 4
Self-management support (SMS) interventions versus control 5
There was a clinically important benefit of SMS short term (8–10 weeks) for hearing aid use (>8 h/ 6 day; very low quality evidence, 1 study). 7
There was no clinically important difference in quality of life (World Health Organization’s Disability 8 Assessment Schedule II; very low quality evidence, 1 study), self-reported hearing handicap (HHIE scale; low 9 quality evidence, 1 study) and for communication (verbal subscale of the CPHI; low quality evidence, 1 10 study). 11
There was no evidence for adherence, adverse effects and hearing aid benefit. 12
13
Delivery system design (DSD) interventions versus control 14
There was a clinically important benefit of DSD long term (≥12 months ) for number of 15 outstanding complaints (low quality evidence, 1 study). 16
There was no clinically important difference in adherence (number of people fitted with hearing 17 aid/number of people who use the aids; high quality evidence, 2 studies), daily hours of hearing 18 aid use (high quality evidence, 4 studies), self-reported hearing handicap (HHIE scale; high quality 19 evidence, 2 studies), hearing aid benefit (Outer Ear scale; high quality evidence, 1 study) and use 20 of verbal communication strategy (verbal subscale of the CPHI scale; moderate quality evidence, 1 21 study). 22
No evidence was identified for quality of life scales. 23
24
Combined self-management support (SMS)/delivery system design (DSD) interventions versus 25 control 26
There was a clinically important benefit of combined SMS/DSD for quality of life (moderate quality 27 evidence, 2 studies) and for self-reported hearing handicap in the long term (≥12 months) 28 (activate and psychosocial domains; low quality evidence, 1 study). 29
There was no clinically important difference in adherence (high quality evidence, 1 study), long 30 term daily hours of hearing aid use (very low quality evidence, 2 studies), short to medium term 31 daily hours of use (high quality evidence, 9 studies), short to medium term quality of life 32 (moderate quality evidence, 8 studies), self-reported hearing handicap for symptoms (moderate 33 quality, 2 studies), Hearing aid benefit assessed by validated self-report measures (IOI-HA item 4; 34 moderate quality, 2 studies), short/medium-term hearing aid benefit (high quality evidence, 7 35 studies) and short/medium-term use of verbal communication strategy ( verbal subscale of the 36 CPHI; very low quality evidence, 4 studies). 37
No evidence was identified for adverse events. 38
Motivational interviewing versus usual care (first time hearing aid users) 39
There was a clinically important benefit of motivational interviewing for measures of the 40 International Outcome Inventory for Hearing Aids (very low quality evidence, 1 study). 41
42

Hearing loss Interventions to support the use of hearing aids
© NICE 2017. All rights reserved. Subject to Notice of rights. 252
Motivational interviewing versus usual care (hearing aid users reporting ≤4 hours use per day) 1
There was a clinically important benefit of motivational interviewing for change in hearing aid use 2 and for measures of International Outcome Inventory for Hearing Aids- Significant Other (low 3 quality evidence, 1 study). 4
There was no clinically important difference in quality of life as measured by the World Health 5 Organization’s Disability Assessment Schedule II score (low quality evidence, 1 study, Hospital 6 Anxiety and Depression Scale - Anxiety score (very low quality evidence, 1 study) and Hospital 7 Anxiety and Depression Scale – depression score (low quality evidence, 1 study). 8
9
Motivational engagement versus usual care 10
There was a clinically important benefit of motivational engagement for hearing aid use and 11 Measure of Audiologic Rehabilitation (Self-Efficacy for Hearing Aids - Advanced handling (very low 12 quality evidence, 1 study). 13
There was no clinically important difference in Measure of Audiologic Rehabilitation (Self-Efficacy 14 for Hearing Aids – aided listening and overall), GHABP (benefit, satisfaction, residual disability and 15 overall), Short Form Patient Activation Measure, Hospital Anxiety and Depression Scale (anxiety, 16 depression and overall) and Satisfaction with Amplification in Daily Life (very low quality evidence, 17 1 study). 18
Economic 19
One cost–consequences analysis found that adding a follow-up appointment to fitting a new 20 hearing aid was more costly and more effective than no routine follow-up appointment after 21 fitting a new hearing aid for adults with hearing loss but did not alter quality of life (£51 more per 22 person, 16% increase in proportion of patients using their hearing aid regularly, 0 change in EQ-5D 23 score). This analysis was assessed as partially applicable with potentially serious limitations. 24
18.2.4 Recommendations and link to evidence 25
Recommendations 35. Consider using motivational interviewing or engagement strategies when discussing hearing aids with adults for the first time, to encourage acceptance and use of hearing aids.
36. Demonstrate how to use hearing aids at the time they are first discussed.
37. At the follow-up audiology appointment for adults with hearing aids:
ask the person if they have any concerns or questions
address any difficulties with inserting, removing or maintaining their hearing aids
provide information on communication, social care or rehabilitation support services if needed
tell the person how to contact audiology services in the future
ensure that the person’s hearing aids and other devices meet their needs by checking:
i. the comfort, sound quality and volume of hearing aids, including microphone and noise reduction settings, and fine-tuning them if needed
ii. hearing aid cleaning, battery life and use with a telephone

Hearing loss Interventions to support the use of hearing aids
© NICE 2017. All rights reserved. Subject to Notice of rights. 253
iii. use of assistive listening devices
iv. hours the hearing aid has been used, if shown by automatic data-logging
review the goals identified in the person’s care plan and agree how to address any that have not been met
update the person’s care plan and give them a copy.
38. Give adults with hearing aids information about getting used to hearing aids, cleaning and caring for their hearing aids, and troubleshooting.
Relative values of different outcomes
The following outcomes were identified as critical outcomes for this review: hearing aid use, adverse effects, hearing-specific health-related quality of life, health-related quality of life, restricted participation or activity limitation, hearing aid benefit and communication, outcomes reported by carers or relatives.
Quality of the clinical evidence
The evidence ranged from very low to high quality. Most of the studies had small numbers of participants and were at high risk of bias and this was one of the main reasons for downgrading the evidence. In particular, randomisation and allocation were unclear. Only a few studies adequately described these processes making it difficult to clearly assess the risk of selection bias.
For the outcomes where clinical benefit was found, the quality of the evidence was as follows:
Self-management support (SMS) interventions; short term (8–10 weeks), very low quality evidence of clinical benefit to support hearing aid use for more than 8 hours a day.
Delivery system design (DSD) interventions; long term (≥12 months), low quality evidence of clinical benefit for adverse events (number of outstanding complaints).
Combined interventions (SMS and DSD), moderate quality evidence of clinical benefit for quality of life validated self-report measures in the long term (≥12 months).and low quality evidence of clinical benefit for self-reported hearing handicap in the long term (≥12 months), specifically for interventions targeting the ‘activate –psychosocial’ domain but not the ‘activate – symptoms’ domain
Motivational interviewing or motivational engagement, very low to low quality evidence of clinical benefit for increasing hearing aid use (1 month and 10 weeks) and low quality evidence of clinical benefit for motivational interviewing improving quality of life as experienced by the significant other (according to IOI-HA significant other) (1 month). Very low quality evidence of clinical benefit for motivational interviewing for quality of life (according to IOI-HA) in first time hearing aid users (3 months), but not in experienced users reporting ≤4h use per day (1 month). Very low quality evidence of clinical benefit of motivational engagement for improving hearing aid benefit assessed by MARS-HA advanced handling subscale (10 weeks).
Trade-off between clinical benefits and harms
Two types of interventions were considered in the systematic review: self-management support (SMS) interventions, which aim to enable patients to optimally manage their own health and delivery system design (DSD) interventions that change the mode, format, timing or follow-up pattern of self-management support.
For self-management support alone, there was a clinical benefit for hearing aid use (>8 hours per day). The guideline committee noted that the clinical difference found was based on increased hearing aid use for those who received verbal pre-fitting counselling (during the fitting appointment) plus simulations representing the listening situations they identified as important to them compared to verbal pre-fitting counselling alone. All outcomes for self-management favoured the intervention, even if not reaching clinical importance.
Hearing aid pre-fitting interventions included counselling or awareness training and

Hearing loss Interventions to support the use of hearing aids
© NICE 2017. All rights reserved. Subject to Notice of rights. 254
demonstrations of listening situations. The committee agreed based on the evidence and its experience that providing information about hearing aids, how they work, what they offer, and demonstrating how to use them at the pre-fitting assessment would help improve adherence. The committee noted that hearing aid users may be reluctant or find it difficult to re-access services if their early listening experiences fall short of expectations. Therefore, providing sufficient information at the initial appointments will ensure realistic expectations as well as empower the individual to ask for support and also enable ongoing self-management.
The committee noted the fewer number of outstanding complaints at 1 year follow-up and improved quality of life and self-reported hearing handicap for interventions targeting psychosocial elements of management in the long term.
Methods of delivery of interventions described in the evidence included telephone follow-up post fitting of hearing aids. These were carried out at different time points including 4, 6, 9 and 12 weeks. The committee agreed usual practice would be to follow up at 6 weeks post-fitting and this might be carried out over the phone rather than in person, although it was noted that people with hearing loss find using a telephone difficult due to the narrow bandwidth and lack of visual cues. Follow-up earlier than 6 weeks was felt to be too soon but leaving this longer than 12 weeks could result in people with problems giving up rather than persisting with hearing aid use. It was felt that people would be reluctant to ask for follow-up if it were offered on a request basis only. Other interventions included pre-fitting sessions on how to use a hearing aid and allowing the person to use one at home before fitting a permanent device. Another study reported benefit from providing a post-fitting counselling session on hearing tactics and coping strategies. The committee agreed it is important to demonstrate how to use a hearing aid when first discussing the different management options. At the follow-up appointment an audiologist should check the hearing aid(s) are comfortable and fitted correctly and should make any adjustments or fine tuning required. The audiologist should also ensure the person is able to insert the device and knows how to carry out basic maintenance and care, such as cleaning and replacing batteries. Further recommendations on follow up for patients with hearing loss including those without hearing aids are included in section 17.3.4).
The delivery of information varied between studies and included written information provided as booklets or a DVD to use at home. Some included interactive exercises on listening skills or in hearing aid management. The committee agreed that information formats should be tailored to the person’s needs and individual learning styles.
Motivational interviewing and engagement were found to be of benefit for increasing use of hearing aids, which the committee valued as a key outcome. Therefore, a recommendation was made to encourage the use of these strategies when first discussing the use of hearing aids with patients to assess their readiness and levels of motivation for having a hearing aid. The committee discussed the training requirements necessary for these strategies to be successfully implemented and agreed that training in motivational interviewing and engagement should be included in standard training for audiologists. Although no consistent benefit was seen for the quality of life or hearing benefit outcomes, it was noted that the length of follow-up in the studies may be too short for any benefits in these outcomes to be identified.
No clinical harms were identified for any of the outcomes, but there was no clinical difference for the other outcomes for each type of intervention.
Usual practice is to provide follow-up individually, and the practicalities of providing follow-up appointments to groups of patients was discussed. The committee agreed that organising appointments would be more difficult and parts of what is covered in follow-up appointments, such as fine tuning hearing aids or discussing programming options, needs to be carried out face-to-face with the individual concerned. However
Hearing loss Interventions to support the use of hearing aids
© NICE 2017. All rights reserved. Subject to Notice of rights. 255
other elements such as teaching basic maintenance and cleaning of devices, and information about support services available could be carried out in group situations.
The committee discussed what should be included as part of a follow-up appointment. There is currently variation in practice in how comprehensive this is, but the committee noted that the NHS standard contract gives recommendations on what should be included and the committee agreed that this is what is usually offered in areas delivering a good service to patients, and should form the minimum of what is provided. The committee noted that individual needs and learning styles differ and one size does not fit all people. Group follow-up may not be wanted by some or may not be appropriate, such as for people with cognitive or learning disabilities.
Trade-off between net clinical effects and costs
One health economic study was identified. This found an increase in hearing aid usage between 6 months and 12 months after initial fitting when hearing aid users were given a follow-up appointment at 6 months to help them with the use of their hearing aids (the proportion of people regularly using their hearing aid(s) increased from 61% to 78%). The study showed increases in the ability of hearing aid users to put in their own hearing aid (from 69% to 83%) and to use the hearing aid with telephones (27% to 68%), which supports the hypothesis that the follow-up appointment had led to the increased hearing aid usage. The study was a before-and-after design, so although improvement is shown with the intervention it cannot be proved whether this was due to the intervention or not. However, the committee discussed that it would be expected for hearing aid use to decline between 6 and 12 months, and so an increase strongly suggests effectiveness.
No benefit was shown to quality of life as measured by EQ-5D, however this is not surprising given the limited ability of EQ-5D to detect changes in quality of life, and so it is not clear what benefit, if any, an increase in people using their hearing aids had on quality of life. However, the committee noted the increase in quality of life due to adoption of hearing aids found in other studies, which is discussed in more detail in the original economic modelling for this guideline (see appendix N).
A programme including both initial fitting and follow-up cost £867 for each person subsequently regularly using their hearing aid, whereas a programme of only initial fitting and no follow-up cost £1,015 per regular user. Therefore the programme including follow-up had a greater impact per pound spent, although for the same number of people that programme would of course have a higher total cost.
The committee noted that the NHS reference cost for a face-to-face audiology appointment is £53, whilst the NHS tariff cost for a hearing aid assessment and fitting in 2016 was £268 for 1 hearing aid, or £370 for a pair of hearing aids, and that this tariff included the cost of 1 follow-up appointment [note, NHS England has withdrawn this tariff since the committee first discussed this question]. These costs are lower than those used in the published study. With a follow-up appointment costing £53, this would require a benefit to quality of life of only 0.0027 QALYs to be cost effective, which the committee thought highly plausible given the benefits to hearing shown by follow-up appointments.
The clinical evidence and the committee’s expert opinion did not support a follow-up intervention at 6 months as in that study, the committee instead preferred to keep the current UK practice of following up after 6–12 weeks, as discussed in the review of monitoring and follow-up (section 17.3.4).
Motivational interviewing and engagement were found to be of benefit for increasing hearing aid use. This would therefore be expected to increase health-related quality of life as noted above. These methods can be carried out in a wide variety of ways, and therefore it is not possible to anticipate their possible cost. The committee therefore recommended that they be considered as additional tools, as they may be cost effective.
The other recommendations in this chapter relate to demonstrating hearing aids in the initial appointment and what should be included in a follow-up appointment.

Hearing loss Interventions to support the use of hearing aids
© NICE 2017. All rights reserved. Subject to Notice of rights. 256
These appointments are already necessary or recommended, and are discussed further in other chapters of this guideline.
The nature of the issues covered in these appointments will not give rise to any additional costs given that the appointments will be taking place and will be of fixed cost.
The actions recommended will lead to hearing aids being used more often and more effectively, and so will increase the effectiveness of hearing aid use for no additional cost. Recommending that the appointments contain these actions will therefore be cost effective compared to not specifying the content of the appointments, in which case their quality may vary. This may be cost saving if it also reduces the need for additional subsequent appointments.
Other considerations None.
1

Hearing loss Reference list
© NICE 2017. All rights reserved. Subject to Notice of rights. 257
19 Reference list 1
2
1. Aazh H. Feasibility of conducting a randomized controlled trial to evaluate the effect of 3 motivational interviewing on hearing-aid use. International Journal of Audiology. 2016; 4 55(3):149-156 5
2. Adrait A, Perrot X, Nguyen MF, Gueugnon M, Petitot C, Collet L et al. Do hearing aids 6 influence behavioral and psychological symptoms of dementia and quality of life in hearing 7 impaired Alzheimer's disease patients and their caregivers? Journal of Alzheimer's Disease. 8 2017; 58(1):109-121 9
3. Aguayo MO, Coady NF. The experience of deafened adults: implications for rehabilitative 10 services. Health and Social Work. 2001; 26(4):269-276 268p 11
4. Ahn JH, Yoo MH, Yoon TH, Chung JW. Can intratympanic dexamethasone added to systemic 12 steroids improve hearing outcome in patients with sudden deafness? Laryngoscope. 2008; 13 118(2):279-282 14
5. Al-Shehri AMS. Intratympanic vs. oral steroids for treatment of idiopathic sudden 15 sensorineural hearing loss: a randomized controlled study. British Journal of Medicine and 16 Medical Research. 2016; 11(6):1-6 17
6. Arastou S, Tajedini A, Borghei P. Combined intratympanic and systemic steroid therapy for 18 poor-prognosis sudden sensorineural hearing loss. Iranian Journal of Otorhinolaryngology. 19 2013; 25(70):23-28 20
7. Awad Z, Huins C, Pothier DD. Antivirals for idiopathic sudden sensorineural hearing loss. 21 Cochrane Database of Systematic Reviews 2012, Issue 8. Art. No.: CD006987. DOI: 22 10.1002/14651858.CD006987.pub2. 23
8. Barker F, Mackenzie E, Elliot L, Jones S, de Lusignan S. Interventions to improve hearing aid 24 use in adult auditory rehabilitation 2016, Issue Art. No.: CD010342. DOI: 25 10.1002/14651858.CD010342.pub3. 26
9. Barlow JH, Turner AP, Hammond CL, Gailey L. Living with late deafness: insight from between 27 worlds. International Journal of Audiology. 2007; 46(8):442-448 28
10. Barton GR, Bankart J, Davis AC, Summerfield QA. Comparing utility scores before and after 29 hearing-aid provision : results according to the EQ-5D, HUI3 and SF-6D. Applied Health 30 Economics & Health Policy. 2004; 3(2):103-105 31
11. Battaglia A, Burchette R, Cueva R. Combination therapy (intratympanic dexamethasone + 32 high-dose prednisone taper) for the treatment of idiopathic sudden sensorineural hearing 33 loss. Otology & Neurotology. 2008; 29(4):453-460 34
12. Bennion A, Forshaw MJ. Insights from the experiences of older people with hearing 35 impairment in the United Kingdom: recommendations for nurse-led rehabilitation. 36 International Journal of Older People Nursing. 2013; 8(4):270-278 279p 37
13. Burton MJ, Doree C. Ear drops for the removal of ear wax. Cochrane Database of Systematic 38 Reviews 2009, Issue 1. Art. No.: CD004326. DOI: 10.1002/14651858.CD004326.pub2. 39
14. Caballero M, Navarrete P, Prades E, Domenech J, Bernal-Sprekelsen M. Randomized, 40 placebo-controlled evaluation of chlorobutanol, potassium carbonate, and irrigation in 41 cerumen removal. Annals of Otology, Rhinology and Laryngology. 2009; 118(8):552-555 42

Hearing loss Reference list
© NICE 2017. All rights reserved. Subject to Notice of rights. 258
15. Cheng TC, Wareing MJ. Three-year ear, nose, and throat cross-sectional analysis of 1 audiometric protocols for magnetic resonance imaging screening of acoustic tumors. 2 Otolaryngology - Head & Neck Surgery. 2012; 146(3):438-447 3
16. Cinamon U, Bendet E, Kronenberg J. Steroids, carbogen or placebo for sudden hearing loss: a 4 prospective double-blind study. European Archives of Oto-Rhino-Laryngology. 2001; 5 258(9):477-480 6
17. Claesen E, Pryce H. An exploration of the perspectives of help-seekers prescribed hearing 7 aids. Primary Health Care Research & Development. 2012; 13(3):279-284 8
18. Clegg AJ, Loveman E, Gospodarevskaya E, Harris P, Bird A, Bryant J et al. The safety and 9 effectiveness of different methods of earwax removal: a systematic review and economic 10 evaluation. Health Technology Assessment. 2010; 14(28):1-192 11
19. Coppin R, Wicke D, Little P. Managing earwax in primary care: efficacy of self-treatment using 12 a bulb syringe. British Journal of General Practice. 2008; 58(546):44-49 13
20. Coppin R, Wicke D, Little P. Randomized trial of bulb syringes for earwax: impact on health 14 service utilization. Annals of Family Medicine. 2011; 9(2):110-114 15
21. Cox RM, Schwartz KS, Noe CM, Alexander GC. Preference for one or two hearing aids among 16 adult patients. Ear and Hearing. 2011; 32(2):181-197 17
22. Cueva RA. Auditory brainstem response versus magnetic resonance imaging for the 18 evaluation of asymmetric sensorineural hearing loss. Laryngoscope. 2004; 114(10):1686-19 1692 20
23. Davis A, Smith P, Ferguson M, Stephens D, Gianopoulos I. Acceptability, benefit and costs of 21 early screening for hearing disability: a study of potential screening tests and models. Health 22 Technology Assessment. 2007; 11(42):1-294 23
24. Davis A, Stephens D, Rayment A, Thomas K. Hearing impairments in middle age: the 24 acceptability, benefit and cost of detection (ABCD). British Journal of Audiology. 1992; 25 26(1):1-14 26
25. Department of Health, NHS England. Action plan on hearing loss. 2015. Available from: 27 https://www.england.nhs.uk/wp-content/uploads/2015/03/act-plan-hearing-loss-upd.pdf 28
26. Detaille SI, Haafkens JA, van Dijk FJ. What employees with rheumatoid arthritis, diabetes 29 mellitus and hearing loss need to cope at work. Scandinavian Journal of Work, Environment 30 and Health. 2003; 29(2):134-142 31
27. Dispenza F, Amodio E, De Stefano A, Gallina S, Marchese D, Mathur N et al. Treatment of 32 sudden sensorineural hearing loss with transtympanic injection of steroids as single therapy: 33 a randomized clinical study. European Archives of Oto-Rhino-Laryngology. 2011; 34 268(9):1273-1278 35
28. Eekhof JA, de Bock GH, Le Cessie S, Springer MP. A quasi-randomised controlled trial of water 36 as a quick softening agent of persistent earwax in general practice. British Journal of General 37 Practice. 2001; 51(469):635-637 38
29. Eftekharian A, Amizadeh M. Pulse steroid therapy in idiopathic sudden sensorineural hearing 39 loss: A randomized controlled clinical trial. Laryngoscope. 2016; 126(1):150-155 40
30. Erdman SA, Sedge RK. Subjective comparisons of binaural versus monaural amplification. Ear 41 and Hearing. 1981; 2(5):225-229 42

Hearing loss Reference list
© NICE 2017. All rights reserved. Subject to Notice of rights. 259
31. Ferguson M, Maidment D, Russell N, Gregory M, Nicholson R. Motivational engagement in 1 first-time hearing aid users: A feasibility study. International Journal of Audiology. 2016; 55 2 (Suppl 3):S23-33 3
32. Ferguson MA, Kitterick PT, Edmondson-Jones M, Hoare DJ. Hearing aids for mild to moderate 4 hearing loss in adults. Cochrane Database of Systematic Reviews 2017, Issue 9. Art. No.: 5 CD012023. DOI: 10.1002/14651858.CD012023. 6
33. Filipo R, Attanasio G, Russo FY, Viccaro M, Mancini P, Covelli E. Intratympanic steroid therapy 7 in moderate sudden hearing loss: a randomized, triple-blind, placebo-controlled trial. 8 Laryngoscope. 2013; 123(3):774-778 9
34. Fraser JG. The efficacy of wax solvents: in vitro studies and a clinical trial. Journal of 10 Laryngology and Otology. 1970; 84(10):1055-1064 11
35. Frohlich AM, Sutherland GR. Epidemiology and clinical features of vestibular schwannoma in 12 Manitoba, Canada. Canadian Journal of Neurological Sciences. 1993; 20(2):126-130 13
36. Gianopoulos I, Stephens D. Opting for two hearing aids: a predictor of long-term use among 14 adult patients fitted after screening. International Journal of Audiology. 2002; 41(8):518-526 15
37. GRADE Working Group. The Grading of Recommendations Assessment, Development and 16 Evaluation (GRADE) Working Group website. 2011. Available from: 17 http://www.gradeworkinggroup.org/ Last accessed: 26/09/2017. 18
38. Grenness C, Hickson L, Laplante-Levesque A, Davidson B. Patient-centred audiological 19 rehabilitation: perspectives of older adults who own hearing aids. International Journal of 20 Audiology. 2014; 53 (Suppl 1):S68-75 21
39. Gundogan O, Pinar E, Imre A, Ozturkcan S, Cokmez O, Yigiter AC. Therapeutic efficacy of the 22 combination of intratympanic methylprednisolone and oral steroid for idiopathic sudden 23 deafness. Otolaryngology - Head & Neck Surgery. 2013; 149(5):753-758 24
40. Halpin C, Shi H, Reda D, Antonelli PJ, Babu S, Carey JP et al. Audiology in the sudden hearing 25 loss clinical trial. Otology & Neurotology. 2012; 33(6):907-911 26
41. Harcourt JP, Vijaya-Sekaran S, Loney E, Lennox P. The incidence of symptoms consistent with 27 cerebellopontine angle lesions in a general ENT out-patient clinic. Journal of Laryngology and 28 Otology. 1999; 113(6):518-522 29
42. Hayden JA, van der Windt DA, Cartwright JL, Cote P, Bombardier C. Assessing bias in studies 30 of prognostic factors. Annals of Internal Medicine. 2013; 158(4):280-286 31
43. Health & Social Care Information Centre. Health survey for England 2014: Health, social care 32 and lifestyles. Health & Social Care Information Centre, 2014. Available from: 33 http://content.digital.nhs.uk/catalogue/PUB19295/HSE2014-Sum-bklet.pdf 34
44. Hinchcliffe R. Effect of current cerumenolytics. British Medical Journal. 1955; 2:722 35
45. Humes LE, Rogers SE, Quigley TM, Main AK, Kinney DL, Herring C. The effects of service-36 delivery model and purchase price on hearing-aid outcomes in older adults: A randomized 37 double-blind placebo-controlled clinical trial. American Journal of Audiology. 2017; 26(1):53-38 79 39
46. Jeffery H, Jennings S, Turton L. Guidance for audiologists: onward referral of adults with 40 hearing difficulty directly referred to audiology services. Service Quality Committee of the 41 British Academy of Audiology, 2016. Available from: 42

Hearing loss Reference list
© NICE 2017. All rights reserved. Subject to Notice of rights. 260
http://www.baaudiology.org/files/1014/8092/7606/OD1764_BAA_Guidance_for_Onward_R1 eferral_of_Adults_with_Hearing_Difficulty_Directly_Referred_to_Audiology_2016.pdf 2
47. Jeffery H, Jennings S, Turton L. Guidance for primary care: Direct referral of adults with 3 hearing difficulty to audiology services. Service Quality Committee of the British Academy of 4 Audiology, 2016. Available from: 5 http://www.baaudiology.org/files/3014/8092/7533/OD1763_BAA_Primary_Care_Guidance_6 on_Direct_Referral_of_Adults_with_Hearing_Difficulty_to_Audiology_Services_2016.pdf 7
48. Keane EM, Wilson H, McGrane D, Coakley D, Walsh JB. Use of solvents to disperse ear wax. 8 British Journal of Clinical Practice. 1995; 49(2):71-72 9
49. Kelly TB, Tolson D, Day T, McColgan G, Kroll T, Maclaren W. Older people's views on what 10 they need to successfully adjust to life with a hearing aid. Health & Social Care in the 11 Community. 2013; 21(3):293-302 12
50. Khorsandi Ashtiani MT, Borgheie P, Yazdani N, Maghsoud S. The effect of intratympanic 13 dexamethasone with oral prednisolone as a primary treatment in idiopathic sudden 14 sensorineural hearing loss. Iranian Journal of Otorhinolaryngology. 2012; 24(66):19-22 15
51. Kumar S, Olaitan A, Danino J, Scott A. Magnetic resonance imaging for the diagnosis of 16 vestibular schwannoma - Increasing cost-effectiveness and the diagnostic yield. 17 Otorhinolaryngologist. 2016; 9(1):9-13 18
52. Laplante-Levesque A, Jensen LD, Dawes P, Nielsen C. Optimal hearing aid use: focus groups 19 with hearing aid clients and audiologists. Ear and Hearing. 2013; 34(2):193-202 20
53. Laplante-Levesque A, Knudsen LV, Preminger JE, Jones L, Nielsen C, Oberg M et al. Hearing 21 help-seeking and rehabilitation: perspectives of adults with hearing impairment. 22 International Journal of Audiology. 2012; 51(2):93-102 23
54. Lee JB, Choi SJ, Park K, Park HY, Choo OS, Choung YH. The efficiency of intratympanic 24 dexamethasone injection as a sequential treatment after initial systemic steroid therapy for 25 sudden sensorineural hearing loss. European Archives of Oto-Rhino-Laryngology. 2011; 26 268(6):833-839 27
55. Li P, Zeng XL, Ye J, Yang QT, Zhang GH, Li Y. Intratympanic methylprednisolone improves 28 hearing function in refractory sudden sensorineural hearing loss: a control study. Audiology 29 and Neuro-Otology. 2011; 16(3):198-202 30
56. Lim HJ, Kim YT, Choi SJ. Erratum: Efficacy of 3 different steroid treatments for sudden 31 sensorineural hearing loss: A prospective, randomized trial (Otolaryngology - Head and Neck 32 Surgery (United States) (2013) 148 (121-127) DOI: 10.1177/0194599812464475). 33 Otolaryngology - Head and Neck Surgery. 2013; 148(6):1064 34
57. Lim HJ, Kim YT, Choi SJ, Lee JB, Park HY, Park K et al. Efficacy of 3 different steroid treatments 35 for sudden sensorineural hearing loss: a prospective, randomized trial. Otolaryngology - Head 36 & Neck Surgery. 2013; 148(1):121-127 37
58. Lin FR, Metter EJ, O'Brien RJ, Resnick SM, Zonderman AB, Ferrucci L. Hearing loss and 38 incident dementia. Archives of Neurology. 2011; 68(2):214-220 39
59. Mandala M, Giannuzzi A, Astore S, Trabalzini F, Nuti D. Hyperventilation-induced nystagmus 40 in vestibular schwannoma and unilateral sensorineural hearing loss. European Archives of 41 Oto-Rhino-Laryngology. 2013; 270(7):2007-2011 42

Hearing loss Reference list
© NICE 2017. All rights reserved. Subject to Notice of rights. 261
60. McArdle R, Chisolm TH, Abrams HB, Wilson RH, Doyle PJ. The WHO-DAS II: measuring 1 outcomes of hearing aid intervention for adults. Trends in Amplification. 2005; 9(3):127-143 2
61. McCormack A, Fortnum H. Why do people fitted with hearing aids not wear them? 3 International Journal of Audiology. 2013; 52(5):360-368 4
62. McInerney M, Walden P. Evaluating the use of an assistive listening device for 5 communication efficiency using the Diapix task: a pilot study. Folia Phoniatrica et Logopedica. 6 2013; 65(1):25-31 7
63. Melin L, Scott B, Lindberg P, Lyttkens L. Hearing aids and tinnitus--an experimental group 8 study. British Journal of Audiology. 1987; 21(2):91-97 9
64. Memel D, Langley C, Watkins C, Laue B, Birchall M, Bachmann M. Effectiveness of ear 10 syringing in general practice: a randomised controlled trial and patients' experiences. British 11 Journal of General Practice. 2002; 52(484):906-911 12
65. Mulrow CD, Aguilar C, Endicott JE, Tuley MR, Velez R, Charlip WS et al. Quality-of-life changes 13 and hearing impairment. A randomized trial. Annals of Internal Medicine. 1990; 113(3):188-14 194 15
66. National Institute for Health and Care Excellence. Developing NICE guidelines: the manual. 16 London. National Institute for Health and Care Excellence, 2014. Available from: 17 http://www.nice.org.uk/article/PMG20/chapter/1%20Introduction%20and%20overview 18
67. National Institute for Health and Clinical Excellence. Social value judgements: principles for 19 the development of NICE guidance. London. National Institute for Health and Clinical 20 Excellence, 2008. Available from: https://www.nice.org.uk/media/default/about/what-we-21 do/research-and-development/social-value-judgements-principles-for-the-development-of-22 nice-guidance.pdf 23
68. National Institute for Health and Clinical Excellence. Guide to the methods of technology 24 appraisal 2013. London. National Institute for Health and Clinical Excellence, 2013. Available 25 from: http://publications.nice.org.uk/pmg9 26
69. NHS England. Commissioning services for people with hearing loss: a framework for Clinical 27 Commissioning Groups. 2016. Available from: https://www.england.nhs.uk/wp-28 content/uploads/2016/07/HLCF.pdf 29
70. Nosrati-Zarenoe R, Hultcrantz E. Corticosteroid treatment of idiopathic sudden sensorineural 30 hearing loss: randomized triple-blind placebo-controlled trial. Otology & Neurotology. 2012; 31 33(4):523-531 32
71. O'brien DV. Deafness. InnovAiT. 2013; 6(5):283-290 33
72. Organisation for Economic Co-operation and Development (OECD). Purchasing power 34 parities (PPP). 2017. Available from: http://www.oecd.org/std/ppp Last accessed: 35 08/08/2017. 36
73. Oron Y, Zwecker-Lazar I, Levy D, Kreitler S, Roth Y. Cerumen removal: comparison of 37 cerumenolytic agents and effect on cognition among the elderly. Archives of Gerontology 38 and Geriatrics. 2011; 52(2):228-232 39
74. Pavlidis C, Pickering JA. Water as a fast acting wax softening agent before ear syringing. 40 Australian Family Physician. 2005; 34(4):303-304 41
75. Plontke SK, Lowenheim H, Mertens J, Engel C, Meisner C, Weidner A et al. Randomized, 42 double blind, placebo controlled trial on the safety and efficacy of continuous intratympanic 43

Hearing loss Reference list
© NICE 2017. All rights reserved. Subject to Notice of rights. 262
dexamethasone delivered via a round window catheter for severe to profound sudden 1 idiopathic sensorineural hearing loss after failure of systemic therapy. Laryngoscope. 2009; 2 119(2):359-369 3
76. Pryce H, Gooberman-Hill R. 'There's a hell of a noise': living with a hearing loss in residential 4 care. Age and Ageing. 2012; 41(1):40-46 5
77. Pryce H, Gooberman-Hill R. Foundations of an intervention package to improve 6 communication in residential care settings: A mixed methods study. Hearing, Balance and 7 Communication. 2013; 11(1):30-38 8
78. Rauch SD, Halpin CF, Antonelli PJ, Babu S, Carey JP, Gantz BJ et al. Oral vs intratympanic 9 corticosteroid therapy for idiopathic sudden sensorineural hearing loss: a randomized trial. 10 JAMA. 2011; 305(20):2071-2079 11
79. Review Manager (RevMan) [Computer program]. Version 5. Copenhagen. The Nordic 12 Cochrane Centre, The Cochrane Collaboration, 2015. Available from: 13 http://tech.cochrane.org/Revman 14
80. Roland PS, Eaton DA, Gross RD, Wall GM, Conroy PJ, Garadi R et al. Randomized, placebo-15 controlled evaluation of Cerumenex and Murine earwax removal products. Archives of 16 Otolaryngology -- Head & Neck Surgery. 2004; 130(10):1175-1177 17
81. Rupa V, Job A, George M, Rajshekhar V. Cost-effective initial screening for vestibular 18 schwannoma: auditory brainstem response or magnetic resonance imaging? Otolaryngology 19 - Head and Neck Surgery. 2003; 128(6):823-828 20
82. Ruscetta MN, Palmer CV, Durrant JD, Grayhack J, Ryan C. The impact of listening with 21 directional microphone technology on self-perceived localization disabilities and handicaps. 22 Journal of the American Academy of Audiology. 2007; 18(9):794-808 23
83. Saliba I, Bergeron M, Martineau G, Chagnon M. Rule 3,000: a more reliable precursor to 24 perceive vestibular schwannoma on MRI in screened asymmetric sensorineural hearing loss. 25 European Archives of Oto-Rhino-Laryngology. 2011; 268(2):207-212 26
84. Schilder AGM, Chong LY, Ftouh S, Burton MJ. Bilateral versus unilateral hearing aids for 27 bilateral hearing impairment in adults. Cochrane Database of Systematic Reviews, 2017, 28 Issue 11. Art. No.: CD012665. DOI: 10.1002/14651858.CD012665. 29
85. Stangerup SE, Caye-Thomasen P. Epidemiology and natural history of vestibular 30 schwannomas. Otolaryngologic Clinics of North America. 2012; 45(2):257-268, vii 31
86. Stangerup SE, Tos M, Thomsen J, Caye-Thomasen P. True incidence of vestibular 32 schwannoma? Neurosurgery. 2010; 67(5):1335-1340; discussion 1340 33
87. Stephens SD, Callaghan DE, Hogan S, Meredith R, Rayment A, Davis A. Acceptability of 34 binaural hearing aids: a cross-over study. Journal of the Royal Society of Medicine. 1991; 35 84(5):267-269 36
88. Stephens SD, Callaghan DE, Hogan S, Meredith R, Rayment A, Davis AC. Hearing disability in 37 people aged 50-65: effectiveness and acceptability of rehabilitative intervention. BMJ. 1990; 38 300(6723):508-511 39
89. Stokroos RJ, Albers FW, Tenvergert EM. Antiviral treatment of idiopathic sudden 40 sensorineural hearing loss: a prospective, randomized, double-blind clinical trial. Acta Oto-41 Laryngologica. 1998; 118(4):488-495 42

Hearing loss Reference list
© NICE 2017. All rights reserved. Subject to Notice of rights. 263
90. Suzuki M, Hashimoto S, Kano S, Okitsu T. Prevalence of acoustic neuroma associated with 1 each configuration of pure tone audiogram in patients with asymmetric sensorineural 2 hearing loss. Annals of Otology, Rhinology and Laryngology. 2010; 119(9):615-618 3
91. Swachia K, Sharma D, Singh J. Efficacy of oral vs. intratympanic corticosteroids in sudden 4 sensorineural hearing loss. Journal of Basic and Clinical Physiology and Pharmacology. 2016; 5 27(4):371-377 6
92. Thomson RS, Auduong P, Miller AT, Gurgel RK. Hearing loss as a risk factor for dementia: A 7 systematic review. Laryngoscope Investigative Otolaryngology. 2017; 2(2):69-79 8
93. Tos M, Stangerup SE, Caye-Thomasen P, Tos T, Thomsen J. What is the real incidence of 9 vestibular schwannoma? Archives of Otolaryngology - Head and Neck Surgery. 2004; 10 130(2):216-220 11
94. Tucci DL, Farmer JC, Jr., Kitch RD, Witsell DL. Treatment of sudden sensorineural hearing loss 12 with systemic steroids and valacyclovir. Otology & Neurotology. 2002; 23(3):301-308 13
95. Uri N, Doweck I, Cohen-Kerem R, Greenberg E. Acyclovir in the treatment of idiopathic 14 sudden sensorineural hearing loss. Otolaryngology - Head & Neck Surgery. 2003; 128(4):544-15 549 16
96. Vandervelde C, Connor SE. Diagnostic yield of MRI for audiovestibular dysfunction using 17 contemporary referral criteria: correlation with presenting symptoms and impact on clinical 18 management. Clinical Radiology. 2009; 64(2):156-163 19
97. Vanlierde MJ, Murray JA, Tse E. A study to look at the efficacy of Almond oil and Cerumol ear 20 drops in the removal of ear wax. South African Family Practice. 1991; 12:324-326 21
98. Vaughan-Jones RH, Padgham ND, Christmas HE, Irwin J, Doig MA. One aid or two?--more 22 visits please! Journal of Laryngology and Otology. 1993; 107(4):329-332 23
99. Vuorialho A, Karinen P, Sorri M. Counselling of hearing aid users is highly cost-effective. 24 European Archives of Oto-Rhino-Laryngology. 2006; 263(11):988-995 25
100. Wei BP, Stathopoulos D, O'Leary S. Steroids for idiopathic sudden sensorineural hearing loss. 26 Cochrane Database of Systematic Reviews 2013, Issue 7. Art. No.: CD003998. DOI: 27 10.1002/14651858.CD003998.pub3. 28
101. Westerlaken BO, de Kleine E, van der Laan B, Albers F. The treatment of idiopathic sudden 29 sensorineural hearing loss using pulse therapy: a prospective, randomized, double-blind 30 clinical trial. Laryngoscope. 2007; 117(4):684-690 31
102. Westerlaken BO, Stokroos RJ, Dhooge IJ, Wit HP, Albers FW. Treatment of idiopathic sudden 32 sensorineural hearing loss with antiviral therapy: a prospective, randomized, double-blind 33 clinical trial. Annals of Otology, Rhinology and Laryngology. 2003; 112(11):993-1000 34
103. Wilson WR, Byl FM, Laird N. The efficacy of steroids in the treatment of idiopathic sudden 35 hearing loss. A double-blind clinical study. Archives of Otolaryngology. 1980; 106(12):772-776 36
104. Wu HP, Chou YF, Yu SH, Wang CP, Hsu CJ, Chen PR. Intratympanic steroid injections as a 37 salvage treatment for sudden sensorineural hearing loss: a randomized, double-blind, 38 placebo-controlled study. Otology & Neurotology. 2011; 32(5):774-779 39
105. Xenellis J, Papadimitriou N, Nikolopoulos T, Maragoudakis P, Segas J, Tzagaroulakis A et al. 40 Intratympanic steroid treatment in idiopathic sudden sensorineural hearing loss: a control 41 study. Otolaryngology and Head and Neck Surgery. 2006; 134(6):940-945 42

Hearing loss Reference list
© NICE 2017. All rights reserved. Subject to Notice of rights. 264
106. Zarenoe R, Soderlund LL, Andersson G, Ledin T. Motivational interviewing as an adjunct to 1 hearing rehabilitation for patients with tinnitus: A randomized controlled pilot trial. Journal 2 of the American Academy of Audiology. 2016; 27(8):669-676 3
4
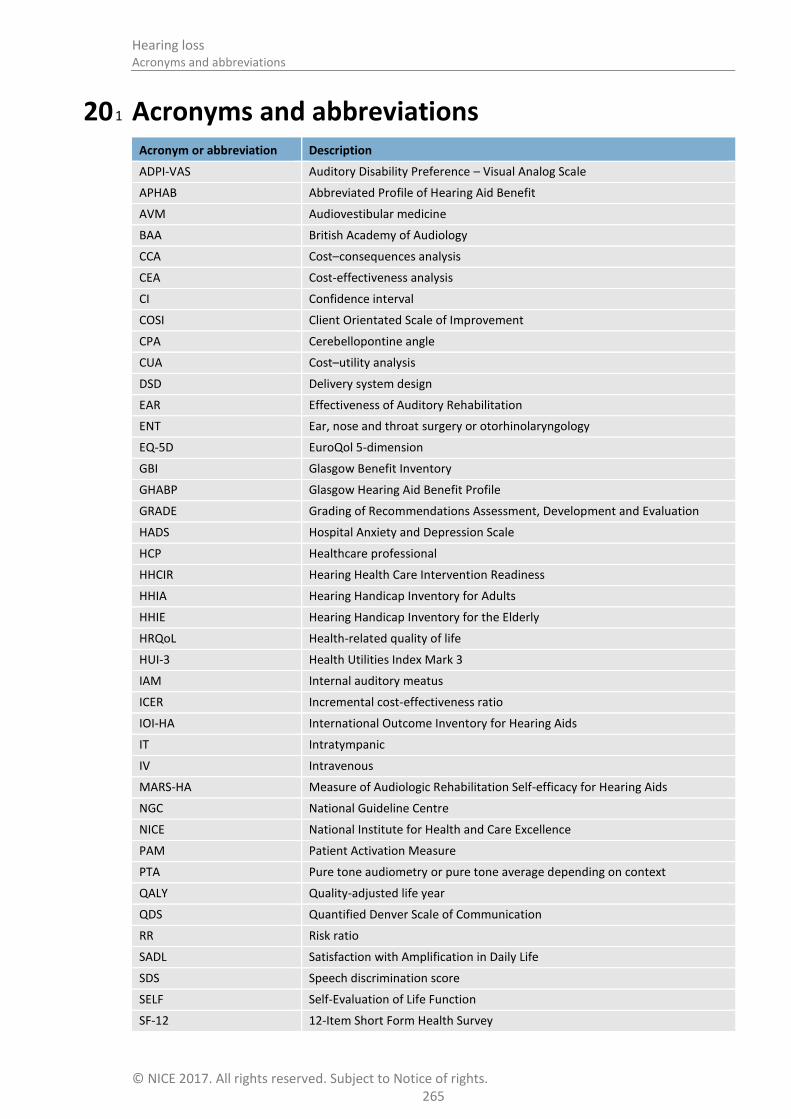
Hearing loss Acronyms and abbreviations
© NICE 2017. All rights reserved. Subject to Notice of rights. 265
20 Acronyms and abbreviations 1
Acronym or abbreviation Description
ADPI-VAS Auditory Disability Preference – Visual Analog Scale
APHAB Abbreviated Profile of Hearing Aid Benefit
AVM Audiovestibular medicine
BAA British Academy of Audiology
CCA Cost–consequences analysis
CEA Cost-effectiveness analysis
CI Confidence interval
COSI Client Orientated Scale of Improvement
CPA Cerebellopontine angle
CUA Cost–utility analysis
DSD Delivery system design
EAR Effectiveness of Auditory Rehabilitation
ENT Ear, nose and throat surgery or otorhinolaryngology
EQ-5D EuroQol 5-dimension
GBI Glasgow Benefit Inventory
GHABP Glasgow Hearing Aid Benefit Profile
GRADE Grading of Recommendations Assessment, Development and Evaluation
HADS Hospital Anxiety and Depression Scale
HCP Healthcare professional
HHCIR Hearing Health Care Intervention Readiness
HHIA Hearing Handicap Inventory for Adults
HHIE Hearing Handicap Inventory for the Elderly
HRQoL Health-related quality of life
HUI-3 Health Utilities Index Mark 3
IAM Internal auditory meatus
ICER Incremental cost-effectiveness ratio
IOI-HA International Outcome Inventory for Hearing Aids
IT Intratympanic
IV Intravenous
MARS-HA Measure of Audiologic Rehabilitation Self-efficacy for Hearing Aids
NGC National Guideline Centre
NICE National Institute for Health and Care Excellence
PAM Patient Activation Measure
PTA Pure tone audiometry or pure tone average depending on context
QALY Quality-adjusted life year
QDS Quantified Denver Scale of Communication
RR Risk ratio
SADL Satisfaction with Amplification in Daily Life
SDS Speech discrimination score
SELF Self-Evaluation of Life Function
SF-12 12-Item Short Form Health Survey

Hearing loss Acronyms and abbreviations
© NICE 2017. All rights reserved. Subject to Notice of rights. 266
Acronym or abbreviation Description
SF-36 36-Item Short Form Health Survey
SMS Self-management support
SSNHL Sudden sensorineural hearing loss
SSQ Speech, Spatial and Qualities of Hearing
VS Vestibular schwannoma
WHODAS WHO Disability Assessment Schedule
WRS World recognition scores

Hearing loss Glossary
© NICE 2017. All rights reserved. Subject to Notice of rights. 267
21 Glossary 1
The NICE Glossary can be found at www.nice.org.uk/glossary. 2
Guideline-specific terms 21.1 3
Term Definition
Assistive listening device A device that transmits, processes or amplifies sound in order to support communication for the person with hearing loss. It does not usually refer to hearing aids.
Audiology A healthcare science encompassing hearing, tinnitus and balance. Audiology services provide assessment, identification, intervention and rehabilitation services for children and adults with suspected or confirmed hearing, tinnitus and balance disorders.
Cochlear implant A small electronic device that may improve hearing in people with severe to profound sensorineural hearing loss in both ears who do not get adequate benefit from the most powerful hearing aids.
Communication partner Someone who communicates with the person with hearing loss, for example a family member or spouse.
Conductive hearing loss Hearing loss caused by a mechanical blockage, damage to, or abnormality in the structure that prevents sound vibrations from passing freely through the outer or middle ear. A conductive hearing loss can either be temporary or permanent.
dB HL Sound levels are measured in dB = decibels. There are several scales of decibels and the one used for measuring hearing using a pure tone audiogram is dB HL (decibel hearing level). Where dB is used alone, as in reviewed papers, it is understood to refer to dB HL.
Ear irrigation The removal of earwax using an electronic ear irrigation machine. The machine pumps water into the ear canal at a controlled pressure, breaking down and flushing out earwax.
Ear syringing A procedure where a metal syringe is used to pump water manually into the ear canal to try to move earwax and clear the ear.
Earwax softeners Preparations used to soften earwax in the ear, for example oil, hydrogen peroxide and sodium bicarbonate. They are either used alone or prior to ear irrigation.
Hearing loss Hearing loss, as defined by the World Health Organization (2008),113
is a hearing threshold level greater than 25 dB HL averaged across 0.5, 1, 2, and 4 kHz .
The British Society of Audiology (2011) describes the levels of hearing loss using a pure tone average of 0.25, 0.5, 1, 2, and 4 kHz as:
20–40 dB HL: Mild hearing loss
41–70 dB HL: Moderate hearing loss
71–95 dB HL: Severe hearing loss
In excess of 95 dB HL: Profound hearing loss
A pure tone audiogram is a crude measure of hearing and there are conditions in which functional hearing is much worse that a PTA would suggest .
Hearing loss can either be sensorineural, or conductive, or mixed (a combination of both types) or central. It can be congenital or acquired and of gradual or sudden onset. It can also be unilateral (affecting one ear) or

Hearing loss Glossary
© NICE 2017. All rights reserved. Subject to Notice of rights. 268
Term Definition
bilateral (affecting both ears). A bilateral hearing loss can either be symmetrical (the hearing loss is about the same in both ears) or asymmetrical (hearing is different but present in both ears).
Hearing loss can also be described by reference to the most affected frequencies for example, high frequency or low frequency. A flat hearing loss means that all hearing thresholds in one ear are about the same level.
Hyperacusis Intolerance to everyday sounds.
Microsuction A procedure where a small device is used to suck earwax out of the ear, under an operating microscope to give good vision.
Otalgia Ear pain or ache.
Otorrhoea Discharge from the ear.
Otoscopy An examination of the ear that involves looking in the ear with an otoscope (or auroscope) which is a torch specially designed to examine the ear.
Pure tone audiometry A test for the hearing of both ears. An audiometer is used to produce sounds at various volumes and pitches. The person listens through headphones and responds when they have heard them.
Pure tone average A method of comparing levels of hearing that takes an average of the pure tone thresholds for a range of frequencies. Some studies use 3 frequencies and others up to 8.
Sensorineural hearing loss Hearing loss caused by damage to the inner ear or nerve of hearing. More than 90% of hearing loss in adults is sensorineural and the leading cause of sensorineural hearing loss is the ageing process, although there are other less common causes
Threshold of hearing This is the quietest sound that a person can hear and is measured over a number of frequencies in dB HL in a pure tone audiogram.
Air conduction thresholds are measured using ear inserts or headphones with sound going down the ear canal.
Bone conduction thresholds are measures that bypass the outer and middle ear and measure the function of the cochlea and nerve of hearing by transmitting sound through bone.
Tinnitus A term for hearing sounds that come from inside the person’s body rather than from an outside source.
Tympanometry A test for the condition of the middle ear and mobility of the eardrum using a machine that changes the pressure within the ear.
Vestibular schwannoma Benign tumour of the cells that form the sheath around the vestibular nerve.
1
General terms 21.2 2
Term Definition
Abstract Summary of a study, which may be published alone or as an introduction to a full scientific paper.
Allocation concealment The process used to prevent advance knowledge of group assignment in an RCT. The allocation process should be impervious to any influence by the individual making the allocation, by being administered by someone who is not responsible for recruiting participants.

Hearing loss Glossary
© NICE 2017. All rights reserved. Subject to Notice of rights. 269
Term Definition
Applicability How well the results of a study or NICE evidence review can answer a clinical question or be applied to the population being considered.
Arm (of a clinical study) Subsection of individuals within a study who receive one particular intervention, for example placebo arm.
Association Statistical relationship between 2 or more events, characteristics or other variables. The relationship may or may not be causal.
Base case analysis In an economic evaluation, this is the main analysis based on the most plausible estimate of each input. In contrast, see Sensitivity analysis.
Baseline The initial set of measurements at the beginning of a study (after run-in period where applicable), with which subsequent results are compared.
Before-and-after study A study that investigates the effects of an intervention by measuring particular characteristics of a population both before and after taking the intervention, and assessing any change that occurs.
Bias Influences on a study that can make the results look better or worse than they really are. (Bias can even make it look as if a treatment works when it does not.) Bias can occur by chance, deliberately or as a result of systematic errors in the design and execution of a study. It can also occur at different stages in the research process, for example, during the collection, analysis, interpretation, publication or review of research data. For examples see selection bias, performance bias, information bias, confounding factor, and publication bias.
Blinding A way to prevent researchers, doctors and patients in a clinical trial from knowing which study group each patient is in so they cannot influence the results. The best way to do this is by sorting patients into study groups randomly. The purpose of ‘blinding’ or ‘masking’ is to protect against bias.
A single-blinded study is one in which patients do not know which study group they are in (for example whether they are taking the experimental drug or a placebo). A double-blinded study is one in which neither patients nor the researchers and doctors know which study group the patients are in. A triple blind study is one in which neither the patients, clinicians or the people carrying out the statistical analysis know which treatment patients received.
Carer (caregiver) Someone who looks after family, partners or friends in need of help because they are ill, frail or have a disability.
Case–control study A study to find out the cause(s) of a disease or condition. This is done by comparing a group of patients who have the disease or condition (cases) with a group of people who do not have it (controls) but who are otherwise as similar as possible (in characteristics thought to be unrelated to the causes of the disease or condition). This means the researcher can look for aspects of their lives that differ to see if they may cause the condition.
For example, a group of people with lung cancer might be compared with a group of people the same age that do not have lung cancer. The researcher could compare how long both groups had been exposed to tobacco smoke. Such studies are retrospective because they look back in time from the outcome to the possible causes of a disease or condition.
Clinical efficacy The extent to which an intervention is active when studied under controlled research conditions.
Clinical effectiveness How well a specific test or treatment works when used in the ‘real world’ (for example, when used by a doctor with a patient at home), rather than in a carefully controlled clinical trial. Trials that assess clinical effectiveness are sometimes called management trials.
Clinical effectiveness is not the same as efficacy.

Hearing loss Glossary
© NICE 2017. All rights reserved. Subject to Notice of rights. 270
Term Definition
Clinician A healthcare professional who provides patient care. For example, a doctor, nurse or physiotherapist.
Cochrane Review The Cochrane Library consists of a regularly updated collection of evidence-based medicine databases including the Cochrane Database of Systematic Reviews (reviews of randomised controlled trials prepared by the Cochrane Collaboration).
Cohort study A study with 2 or more groups of people – cohorts – with similar characteristics. One group receives a treatment, is exposed to a risk factor or has a particular symptom and the other group does not. The study follows their progress over time and records what happens. See also observational study.
Comorbidity A disease or condition that someone has in addition to the health problem being studied or treated.
Comparability Similarity of the groups in characteristics likely to affect the study results (such as health status or age).
Confidence interval (CI) There is always some uncertainty in research. This is because a small group of patients is studied to predict the effects of a treatment on the wider population. The confidence interval is a way of expressing how certain we are about the findings from a study, using statistics. It gives a range of results that is likely to include the ‘true’ value for the population.
The CI is usually stated as ‘95% CI’, which means that the range of values has a 95 in a 100 chance of including the ‘true’ value. For example, a study may state that “based on our sample findings, we are 95% certain that the ‘true’ population blood pressure is not higher than 150 and not lower than 110”. In such a case the 95% CI would be 110 to 150.
A wide confidence interval indicates a lack of certainty about the true effect of the test or treatment – often because a small group of patients has been studied. A narrow confidence interval indicates a more precise estimate (for example, if a large number of patients have been studied).
Confounding factor Something that influences a study and can result in misleading findings if it is not understood or appropriately dealt with.
For example, a study of heart disease may look at a group of people that exercises regularly and a group that does not exercise. If the ages of the people in the 2 groups are different, then any difference in heart disease rates between the 2 groups could be because of age rather than exercise. Therefore age is a confounding factor.
Control group A group of people in a study who do not receive the treatment or test being studied. Instead, they may receive the standard treatment (sometimes called ‘usual care’) or a dummy treatment (placebo). The results for the control group are compared with those for a group receiving the treatment being tested. The aim is to check for any differences.
Ideally, the people in the control group should be as similar as possible to those in the treatment group, to make it as easy as possible to detect any effects due to the treatment.
Cost-effectiveness analysis (CEA)
Cost-effectiveness analysis is one of the tools used to carry out an economic evaluation. The benefits are expressed in non-monetary terms related to health, such as symptom-free days, heart attacks avoided, deaths avoided or life years gained (that is, the number of years by which life is extended as a result of the intervention).
Cost–utility analysis (CUA) Cost–utility analysis is one of the tools used to carry out an economic evaluation. The benefits are assessed in terms of both quality and duration of life, and expressed as quality-adjusted life years (QALYs). See also utility.
Deterministic analysis In economic evaluation, this is an analysis that uses a point estimate for

Hearing loss Glossary
© NICE 2017. All rights reserved. Subject to Notice of rights. 271
Term Definition
each input. In contrast, see Probabilistic analysis
Discounting Costs and perhaps benefits incurred today have a higher value than costs and benefits occurring in the future. Discounting health benefits reflects individual preference for benefits to be experienced in the present rather than the future. Discounting costs reflects individual preference for costs to be experienced in the future rather than the present.
Disutility The loss of quality of life associated with having a disease or condition. See Utility
Dominance A health economics term. When comparing tests or treatments, an option that is both less effective and costs more is said to be ‘dominated’ by the alternative.
Drop-out A participant who withdraws from a trial before the end.
Economic evaluation An economic evaluation is used to assess the cost effectiveness of healthcare interventions (that is, to compare the costs and benefits of a healthcare intervention to assess whether it is worth doing). The aim of an economic evaluation is to maximise the level of benefits – health effects – relative to the resources available. It should be used to inform and support the decision-making process; it is not supposed to replace the judgement of healthcare professionals.
There are several types of economic evaluation: cost–benefit analysis, cost–consequences analysis, cost-effectiveness analysis, cost-minimisation analysis and cost–utility analysis. They use similar methods to define and evaluate costs, but differ in the way they estimate the benefits of a particular drug, programme or intervention.
Effect
(as in effect measure, treatment effect, estimate of effect, effect size)
A measure that shows the magnitude of the outcome in one group compared with that in a control group.
For example, if the absolute risk reduction is shown to be 5% and it is the outcome of interest, the effect size is 5%.
The effect size is usually tested, using statistics, to find out how likely it is that the effect is a result of the treatment and has not just happened by chance (that is, to see if it is statistically significant).
Effectiveness How beneficial a test or treatment is under usual or everyday conditions, compared with doing nothing or opting for another type of care.
Efficacy How beneficial a test, treatment or public health intervention is under ideal conditions (for example, in a laboratory), compared with doing nothing or opting for another type of care.
EQ-5D (EuroQol 5 dimensions)
A standardised instrument used to measure health-related quality of life. It provides a single index value for health status.
Evidence Information on which a decision or guidance is based. Evidence is obtained from a range of sources including randomised controlled trials, observational studies, expert opinion (of clinical professionals or patients).
Exclusion criteria (literature review)
Explicit standards used to decide which studies should be excluded from consideration as potential sources of evidence.
Exclusion criteria (clinical study)
Criteria that define who is not eligible to participate in a clinical study.
Extended dominance If Option A is both more clinically effective than Option B and has a lower cost per unit of effect, when both are compared with a do-nothing alternative then Option A is said to have extended dominance over Option B. Option A is therefore cost effective and should be preferred, other things remaining equal.
Follow-up Observation over a period of time of an individual, group or initially defined population whose appropriate characteristics have been assessed in order

Hearing loss Glossary
© NICE 2017. All rights reserved. Subject to Notice of rights. 272
Term Definition
to observe changes in health status or health-related variables.
Generalisability The extent to which the results of a study hold true for groups that did not participate in the research. See also external validity.
Gold standard A method, procedure or measurement that is widely accepted as being the best available to test for or treat a disease.
GRADE, GRADE profile A system developed by the GRADE Working Group to address the shortcomings of present grading systems in healthcare. The GRADE system uses a common, sensible and transparent approach to grading the quality of evidence. The results of applying the GRADE system to clinical trial data are displayed in a table known as a GRADE profile.
Harms Adverse effects of an intervention.
Health economics Study or analysis of the cost of using and distributing healthcare resources.
Health-related quality of life (HRQoL)
A measure of the effects of an illness to see how it affects someone’s day-to-day life.
Heterogeneity
or Lack of homogeneity
The term is used in meta-analyses and systematic reviews to describe when the results of a test or treatment (or estimates of its effect) differ significantly in different studies. Such differences may occur as a result of differences in the populations studied, the outcome measures used or because of different definitions of the variables involved. It is the opposite of homogeneity.
Imprecision Results are imprecise when studies include relatively few patients and few events and thus have wide confidence intervals around the estimate of effect.
Inclusion criteria (literature review)
Explicit criteria used to decide which studies should be considered as potential sources of evidence.
Incremental analysis The analysis of additional costs and additional clinical outcomes with different interventions.
Incremental cost The extra cost linked to using one test or treatment rather than another. Or the additional cost of doing a test or providing a treatment more frequently.
Incremental cost-effectiveness ratio (ICER)
The difference in the mean costs in the population of interest divided by the differences in the mean outcomes in the population of interest for one treatment compared with another.
Indirectness The available evidence is different to the review question being addressed, in terms of PICO (population, intervention, comparison and outcome).
Intervention In medical terms this could be a drug treatment, surgical procedure, therapy such as psychological therapy, physiotherapy, hearing therapy or provision of a device such as a hearing aid, prosthetic limb, cardioverter. Examples of public health interventions could include action to help someone to be physically active or to eat a more healthy diet.
Licence See ‘Product licence’.
Life years gained Mean average years of life gained per person as a result of the intervention compared with an alternative intervention.
Logistic regression or
Logit model
In statistics, logistic regression is a type of analysis used for predicting the outcome of a binary dependent variable based on one or more predictor variables. It can be used to estimate the log of the odds (known as the ‘logit’).
Loss to follow-up A patient, or the proportion of patients, actively participating in a clinical trial at the beginning, but whom the researchers were unable to trace or contact by the point of follow-up in the trial
Markov model A method for estimating long-term costs and effects for recurrent or chronic conditions, based on health states and the probability of transition between

Hearing loss Glossary
© NICE 2017. All rights reserved. Subject to Notice of rights. 273
Term Definition
them within a given time period (cycle).
Meta-analysis A method often used in systematic reviews. Results from several studies of the same test or treatment are combined to estimate the overall effect of the treatment.
Multivariate model A statistical model for analysis of the relationship between 2 or more predictor (independent) variables and the outcome (dependent) variable.
Negative predictive value (NPV)
In screening or diagnostic tests: A measure of the usefulness of a screening or diagnostic test. It is the proportion of those with a negative test result who do not have the disease, and can be interpreted as the probability that a negative test result is correct. It is calculated as follows: TN/(TN+FN)
Non-randomised intervention study
A quantitative study investigating the effectiveness of an intervention that does not use randomisation to allocate patients (or units) to treatment groups. Non-randomised studies include observational studies, where allocation to groups occurs through usual treatment decisions or people’s preferences. Non-randomised studies can also be experimental, where the investigator has some degree of control over the allocation of treatments.
Non-randomised intervention studies can use a number of different study designs, and include cohort studies, case–control studies, controlled before-and-after studies, interrupted-time-series studies and quasi-randomised controlled trials.
Observational study Individuals or groups are observed or certain factors are measured. No attempt is made to affect the outcome. For example, an observational study of a disease or treatment would allow ‘nature’ or usual medical care to take its course. Changes or differences in one characteristic (for example, whether or not people received a specific treatment or intervention) are studied without intervening.
There is a greater risk of selection bias than in experimental studies.
Odds ratio Odds are a way to represent how likely it is that something will happen (the probability). An odds ratio compares the probability of something in one group with the probability of the same thing in another.
An odds ratio of 1 between 2 groups would show that the probability of the event (for example a person developing a disease, or a treatment working) is the same for both. An odds ratio greater than 1 means the event is more likely in the first group. An odds ratio less than 1 means that the event is less likely in the first group.
Sometimes probability can be compared across more than 2 groups – in this case, one of the groups is chosen as the ‘reference category’, and the odds ratio is calculated for each group compared with the reference category. For example, to compare the risk of dying from lung cancer for non-smokers, occasional smokers and regular smokers, non-smokers could be used as the reference category. Odds ratios would be worked out for occasional smokers compared with non-smokers and for regular smokers compared with non-smokers. See also confidence interval, risk ratio.
Outcome The impact that a test, treatment, policy, programme or other intervention has on a person, group or population. Outcomes from interventions to improve the public’s health could include changes in knowledge and behaviour related to health, societal changes (for example, a reduction in crime rates) and a change in people’s health and wellbeing or health status. In clinical terms, outcomes could include the number of patients who fully recover from an illness or the number of hospital admissions, and an improvement or deterioration in someone’s health, functional ability, symptoms or situation. Researchers should decide what outcomes to measure before a study begins.

Hearing loss Glossary
© NICE 2017. All rights reserved. Subject to Notice of rights. 274
Term Definition
P value The p value is a statistical measure that indicates whether or not an effect is statistically significant.
For example, if a study comparing 2 treatments found that one seems more effective than the other, the p value is the probability of obtaining these results by chance. By convention, if the p value is below 0.05 (that is, there is less than a 5% probability that the results occurred by chance) it is considered that there probably is a real difference between treatments. If the p value is 0.001 or less (less than a 1% probability that the results occurred by chance), the result is seen as highly significant.
If the p value shows that there is likely to be a difference between treatments, the confidence interval describes how big the difference in effect might be.
Placebo A fake (or dummy) treatment given to participants in the control group of a clinical trial. It is indistinguishable from the actual treatment (which is given to participants in the experimental group). The aim is to determine what effect the experimental treatment has had – over and above any placebo effect caused because someone has received (or thinks they have received) care or attention.
Positive predictive value (PPV)
In screening or diagnostic tests: A measure of the usefulness of a screening or diagnostic test. It is the proportion of those with a positive test result who have the disease, and can be interpreted as the probability that a positive test result is correct. It is calculated as follows: TP/(TP+FP)
Power (statistical) The ability to demonstrate an association when one exists. Power is related to sample size; the larger the sample size, the greater the power and the lower the risk that a possible association could be missed.
Pre-test probability In diagnostic tests: The proportion of people with the target disorder in the population at risk at a specific time point or time interval. Prevalence may depend on how a disorder is diagnosed.
Prevalence See Pre-test probability.
Primary care Healthcare delivered outside hospitals. It includes a range of services provided by GPs, nurses, health visitors, midwives and other healthcare professionals and allied health professionals such as dentists, pharmacists and opticians.
Primary outcome The outcome of greatest importance, usually the one in a study that the power calculation is based on.
Probabilistic analysis In economic evaluation, this is an analysis that uses a probability distribution for each input. In contrast, see Deterministic analysis.
Product licence An authorisation from the MHRA to market a medicinal product.
Prognosis A probable course or outcome of a disease. Prognostic factors are patient or disease characteristics that influence the course. Good prognosis is associated with low rate of undesirable outcomes; poor prognosis is associated with a high rate of undesirable outcomes.
Prospective study A research study in which the health or other characteristic of participants is monitored (or ‘followed up’) for a period of time, with events recorded as they happen. This contrasts with retrospective studies.
Publication bias Publication bias occurs when researchers publish the results of studies showing that a treatment works well and don’t publish those showing it did not have any effect. If this happens, analysis of the published results will not give an accurate idea of how well the treatment works. This type of bias can be assessed by a funnel plot.
Quality of life See ‘Health-related quality of life’.
Quality-adjusted life year A measure of the state of health of a person or group in which the benefits,
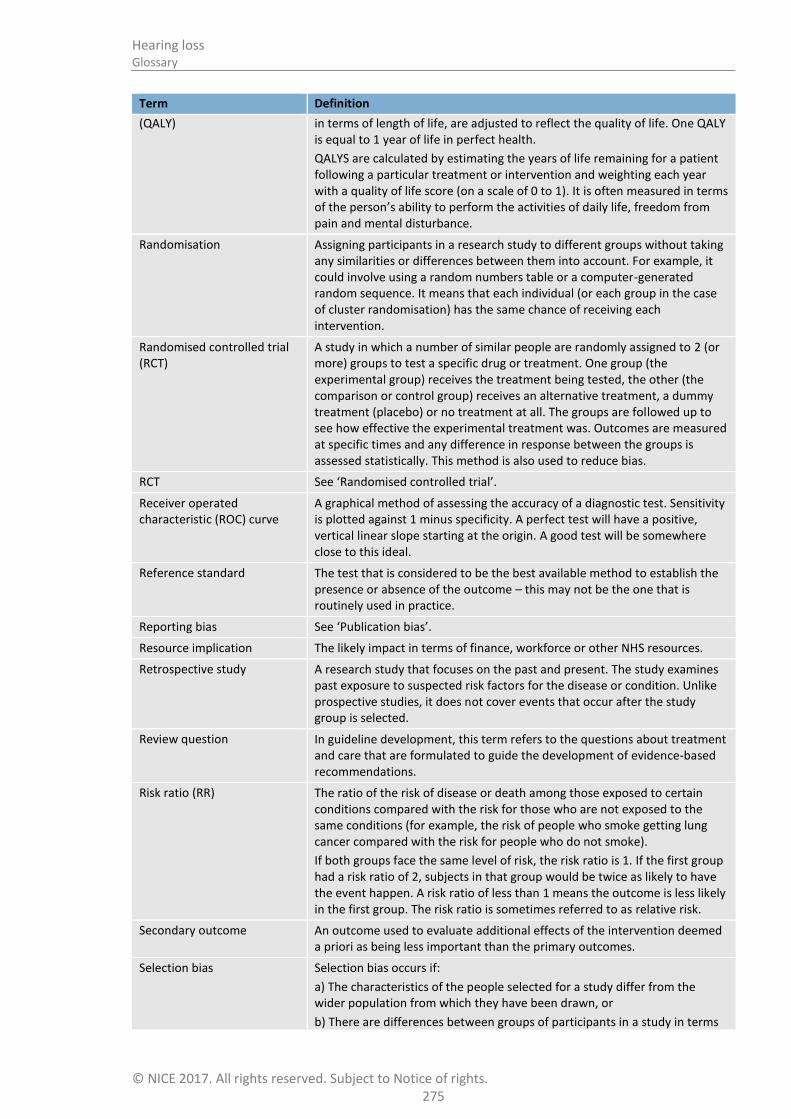
Hearing loss Glossary
© NICE 2017. All rights reserved. Subject to Notice of rights. 275
Term Definition
(QALY) in terms of length of life, are adjusted to reflect the quality of life. One QALY is equal to 1 year of life in perfect health.
QALYS are calculated by estimating the years of life remaining for a patient following a particular treatment or intervention and weighting each year with a quality of life score (on a scale of 0 to 1). It is often measured in terms of the person’s ability to perform the activities of daily life, freedom from pain and mental disturbance.
Randomisation Assigning participants in a research study to different groups without taking any similarities or differences between them into account. For example, it could involve using a random numbers table or a computer-generated random sequence. It means that each individual (or each group in the case of cluster randomisation) has the same chance of receiving each intervention.
Randomised controlled trial (RCT)
A study in which a number of similar people are randomly assigned to 2 (or more) groups to test a specific drug or treatment. One group (the experimental group) receives the treatment being tested, the other (the comparison or control group) receives an alternative treatment, a dummy treatment (placebo) or no treatment at all. The groups are followed up to see how effective the experimental treatment was. Outcomes are measured at specific times and any difference in response between the groups is assessed statistically. This method is also used to reduce bias.
RCT See ‘Randomised controlled trial’.
Receiver operated characteristic (ROC) curve
A graphical method of assessing the accuracy of a diagnostic test. Sensitivity is plotted against 1 minus specificity. A perfect test will have a positive, vertical linear slope starting at the origin. A good test will be somewhere close to this ideal.
Reference standard The test that is considered to be the best available method to establish the presence or absence of the outcome – this may not be the one that is routinely used in practice.
Reporting bias See ‘Publication bias’.
Resource implication The likely impact in terms of finance, workforce or other NHS resources.
Retrospective study A research study that focuses on the past and present. The study examines past exposure to suspected risk factors for the disease or condition. Unlike prospective studies, it does not cover events that occur after the study group is selected.
Review question In guideline development, this term refers to the questions about treatment and care that are formulated to guide the development of evidence-based recommendations.
Risk ratio (RR) The ratio of the risk of disease or death among those exposed to certain conditions compared with the risk for those who are not exposed to the same conditions (for example, the risk of people who smoke getting lung cancer compared with the risk for people who do not smoke).
If both groups face the same level of risk, the risk ratio is 1. If the first group had a risk ratio of 2, subjects in that group would be twice as likely to have the event happen. A risk ratio of less than 1 means the outcome is less likely in the first group. The risk ratio is sometimes referred to as relative risk.
Secondary outcome An outcome used to evaluate additional effects of the intervention deemed a priori as being less important than the primary outcomes.
Selection bias Selection bias occurs if:
a) The characteristics of the people selected for a study differ from the wider population from which they have been drawn, or
b) There are differences between groups of participants in a study in terms

Hearing loss Glossary
© NICE 2017. All rights reserved. Subject to Notice of rights. 276
Term Definition
of how likely they are to get better.
Sensitivity How well a test detects the thing it is testing for.
If a diagnostic test for a disease has high sensitivity, it is likely to pick up all cases of the disease in people who have it (that is, give a ‘true positive’ result). But if a test is too sensitive it will sometimes also give a positive result in people who don’t have the disease (that is, give a ‘false positive’).
For example, if a test were developed to detect if a woman is 6 months pregnant, a very sensitive test would detect everyone who was 6 months pregnant, but would probably also include those who are 5 and 7 months pregnant.
If the same test were more specific (sometimes referred to as having higher specificity), it would detect only those who are 6 months pregnant, and someone who was 5 months pregnant would get a negative result (a ‘true negative’). But it would probably also miss some people who were 6 months pregnant (that is, give a ‘false negative’).
Breast screening is a ‘real-life’ example. The number of women who are recalled for a second breast screening test is relatively high because the test is very sensitive. If it were made more specific, people who don’t have the disease would be less likely to be called back for a second test but more women who have the disease would be missed.
Sensitivity analysis A means of representing uncertainty in the results of economic evaluations. Uncertainty may arise from missing data, imprecise estimates or methodological controversy. Sensitivity analysis also allows for exploring the generalisability of results to other settings. The analysis is repeated using different assumptions to examine the effect on the results.
One-way simple sensitivity analysis (univariate analysis): each parameter is varied individually in order to isolate the consequences of each parameter on the results of the study.
Multi-way simple sensitivity analysis (scenario analysis): 2 or more parameters are varied at the same time and the overall effect on the results is evaluated.
Threshold sensitivity analysis: the critical value of parameters above or below which the conclusions of the study will change are identified.
Probabilistic sensitivity analysis: probability distributions are assigned to the uncertain parameters and are incorporated into evaluation models based on decision analytical techniques (for example, Monte Carlo simulation).
Significance (statistical) A result is deemed statistically significant if the probability of the result occurring by chance is less than 1 in 20 (p<0.05).
Specificity The proportion of true negatives that are correctly identified as such. For example in diagnostic testing the specificity is the proportion of non-cases correctly diagnosed as non-cases.
See related term ‘Sensitivity’.
In terms of literature searching a highly specific search is generally narrow and aimed at picking up the key papers in a field and avoiding a wide range of papers.
Stakeholder An organisation with an interest in a topic that NICE is developing a guideline or piece of public health guidance on. Organisations that register as stakeholders can comment on the draft scope and the draft guidance. Stakeholders may be:
manufacturers of drugs or equipment
national patient and carer organisations
NHS organisations

Hearing loss Glossary
© NICE 2017. All rights reserved. Subject to Notice of rights. 277
Term Definition
organisations representing healthcare professionals.
State transition model See Markov model
Systematic review A review in which evidence from scientific studies has been identified, appraised and synthesised in a methodical way according to predetermined criteria. It may include a meta-analysis.
Time horizon The time span over which costs and health outcomes are considered in a decision analysis or economic evaluation.
Transition probability In a state transition model (Markov model), this is the probability of moving from one health state to another over a specific period of time.
Treatment allocation Assigning a participant to a particular arm of a trial.
Univariate Analysis which separately explores each variable in a data set.
Utility In health economics, a 'utility' is the measure of the preference or value that an individual or society places upon a particular health state. It is generally a number between 0 (representing death) and 1 (perfect health). The most widely used measure of benefit in cost–utility analysis is the quality-adjusted life year, but other measures include disability-adjusted life years (DALYs) and healthy year equivalents (HYEs).
1
2
3
4