Hearing in Glires: Domestic Rabbit, Cotton Rat, Feral House Mouse
16
Hearing in Glires: Domestic rabbit, cotton rat, feral house mouse, and kangaroo rat Henry Heffner Bureau of Child Research. i/niversity of Kansas. P.O. Box 738.Parsons, Kansas 67357 Bruce Masterton Department of Psychology. Florida StateUniversity. Tallahassee, Florida $2506 (Received 28 August 1979; accepted for publication 16May 1980) ß Behavioral audiograms were determined for four species of Glires: one Iagomorph (domestic rabbit, Oryctolagus cuniculus) andthree feralrodents (cotton rat, Sigmodon hispidus; house mouse, Mus rnuseulus; and kangaroo rat, Dipodomys rnerrlarni).Considerable variationin hearingability was found amongthe four species with low-frequency hearing limitsranging over5-1/2 octaves from 50 (kangaroo rat) to 2300 Hz (fetal mouse) and high-frequency hearing limits ranging from 49 (rabbit) to 90 kHz (fetal mouse). Comparison of the ebaracteristies of each audiogram with the audiograms of other animals of the same Order, Cohort,and Classprovide further evidence for the validity of two relationships: (I) interaural distance is strongly and inversely correlated with high-frequency hearing ability, and (2) good high-frequency hearing is apparently incompatible with good low-frequency hearing in most, if not all, land mammals. Furthermore, it is shown that cotton rats and ferai micc passess the ability to perform frequency discriminations even at very high frequencies, indicating thatthere is probably no difference about thewayin which they perceive high andlow- frequency sounds. Finally, it is shown that kangaroo rats are not unusual in their ability to localize brief sounds, indicating that these animals havenot compromised this ability in their acquistion of their unusual low-frequency sensitivity. PACS numbers: 43.80.Lb, 43.66.Of INTRODUCTION Although audiograms of various animals may be useful for experimental or clinical purposes, a collection of mammalian audiograms, when viewed as a sample of the population of all mammalian audiograms, gives rise to an additional kind of information. Through strict statistical analyses of the between-species vari- ation in hearing in combination with the study of various morphological, ecological, apA phylogenic features of the animals involved, it has become possible to identify some of the selective pressures which have played a role in the adaptation and evolution of the ear and audi- tory system. This information, in turn, has engen- dered an additional approach to experimentation on the mechanisms of hearing--one emphasizing its adaptive or psychobiotogical role instead of merely its psycho- physics. t'2 However, the sample of mammals on which past populational analyses of hearing have been based is far from a random or representative one. Among other things, Glires, s the cohort containing the orders Lago- morpha and Rodentia, have been underrepresented. As a result, certain conclusions regarding the adaptation and evolution of hearing have had to be weakened or somewhat restricted in their generality. t In recent years, we have had the opportunity to test the hearing of four species of Glires: the domestic rab- bit (a Iagomorph); andthe cotton rat, house mouse, and kangaroo rat (each a fetal rodent). Although the pur- pose of this testing was to balance as well as to en- large the sample of nmmmalian audiograms, each of the four species was chosen for reasons intrinsic to it- self. Specifically, the domestic rabbit was chosen be- cause it is the most ubiquitous Iagomorph; the cotton rat because it is a common New World feral rat; the feral house mouse because it is the most ubiquitous small rodent and because it is conveniently compared with laboratory strains of mice; and finally, the kanga- roo rat because its unusually large bullae and central auditory system indicate that it may possess unique hearing abilities. Once the hearing capacities of these animals had been obtained, they were compared with the capacities of previously tested species in order to obtain information relevant to the understanding of the wide variation in two of the most fundamental parameters of hearing: high-frequency and low-frequency hearing limits. Thus, the purpose of this report is to present the results of hearing tests conducted on these four species and thereby expandthe available sample of com- plete mamnmlian audiograms,to update the sample further by inclusion of the audiograms of other species which have recently become available, and finally, to apply these results to the analysis of the selective pres- sures involved in the evolution of high-frequency and low-frequency hearing. I. GENERAL METHOD The hearing abilities of the four species were deter- mined through use of either of two behavioral techni- ques: the technique of conditioned suppression or a two- choice positive reward technique. Because the experi- ments using the conditioned suppression techniquehave .many features in common, a description of this pro- cedure is presented here. For reasons described be- low, the standard conditioned suppression procedure could not be used with the kangaroo rat. The two- 'choice procedure which was used instead is described in a later section. A. Conditioned suppression The rabbit, cotton rat, and house mouse were tested in,cages constructed with thin brass rods. A water - 1584 J. Acoust. Soc. Am. 68(6), Dec.1980 0001-4966/80/121584-16500,80 ¸ 1980 Acoustical Society of America 1584
Transcript of Hearing in Glires: Domestic Rabbit, Cotton Rat, Feral House Mouse

Hearing in Glires: Domestic rabbit, cotton rat, feral house mouse, and kangaroo rat
Henry Heffner
Bureau of Child Research. i/niversity of Kansas. P.O. Box 738. Parsons, Kansas 67357
Bruce Masterton
Department of Psychology. Florida State University. Tallahassee, Florida $2506 (Received 28 August 1979; accepted for publication 16 May 1980)
ß Behavioral audiograms were determined for four species of Glires: one Iagomorph (domestic rabbit, Oryctolagus cuniculus) and three feral rodents (cotton rat, Sigmodon hispidus; house mouse, Mus rnuseulus; and kangaroo rat, Dipodomys rnerrlarni). Considerable variation in hearing ability was found among the four species with low-frequency hearing limits ranging over 5-1/2 octaves from 50 (kangaroo rat) to 2300 Hz (fetal mouse) and high-frequency hearing limits ranging from 49 (rabbit) to 90 kHz (fetal mouse). Comparison of the ebaracteristies of each audiogram with the audiograms of other animals of the same Order, Cohort, and Class provide further evidence for the validity of two relationships: (I) interaural distance is strongly and inversely correlated with high-frequency hearing ability, and (2) good high-frequency hearing is apparently incompatible with good low-frequency hearing in most, if not all, land mammals. Furthermore, it is shown that cotton rats and ferai micc passess the ability to perform frequency discriminations even at very high frequencies, indicating that there is probably no difference about the way in which they perceive high and low- frequency sounds. Finally, it is shown that kangaroo rats are not unusual in their ability to localize brief sounds, indicating that these animals have not compromised this ability in their acquistion of their unusual low-frequency sensitivity.
PACS numbers: 43.80.Lb, 43.66.Of
INTRODUCTION
Although audiograms of various animals may be useful for experimental or clinical purposes, a collection of mammalian audiograms, when viewed as a sample of the population of all mammalian audiograms, gives rise to an additional kind of information. Through strict statistical analyses of the between-species vari- ation in hearing in combination with the study of various morphological, ecological, apA phylogenic features of the animals involved, it has become possible to identify some of the selective pressures which have played a role in the adaptation and evolution of the ear and audi- tory system. This information, in turn, has engen- dered an additional approach to experimentation on the mechanisms of hearing--one emphasizing its adaptive or psychobiotogical role instead of merely its psycho- physics. t'2 However, the sample of mammals on which past populational analyses of hearing have been based is far from a random or representative one. Among other things, Glires, s the cohort containing the orders Lago- morpha and Rodentia, have been underrepresented. As a result, certain conclusions regarding the adaptation and evolution of hearing have had to be weakened or somewhat restricted in their generality. t
In recent years, we have had the opportunity to test the hearing of four species of Glires: the domestic rab- bit (a Iagomorph); and the cotton rat, house mouse, and kangaroo rat (each a fetal rodent). Although the pur- pose of this testing was to balance as well as to en- large the sample of nmmmalian audiograms, each of the four species was chosen for reasons intrinsic to it- self. Specifically, the domestic rabbit was chosen be- cause it is the most ubiquitous Iagomorph; the cotton rat because it is a common New World feral rat; the feral house mouse because it is the most ubiquitous
small rodent a nd because it is conveniently compared with laboratory strains of mice; and finally, the kanga- roo rat because its unusually large bullae and central auditory system indicate that it may possess unique hearing abilities. Once the hearing capacities of these animals had been obtained, they were compared with the capacities of previously tested species in order to obtain information relevant to the understanding of the wide variation in two of the most fundamental parameters of hearing: high-frequency and low-frequency hearing limits. Thus, the purpose of this report is to present the results of hearing tests conducted on these four species and thereby expand the available sample of com- plete mamnmlian audiograms, to update the sample further by inclusion of the audiograms of other species which have recently become available, and finally, to apply these results to the analysis of the selective pres- sures involved in the evolution of high-frequency and low-frequency hearing.
I. GENERAL METHOD
The hearing abilities of the four species were deter- mined through use of either of two behavioral techni- ques: the technique of conditioned suppression or a two- choice positive reward technique. Because the experi- ments using the conditioned suppression technique have .many features in common, a description of this pro- cedure is presented here. For reasons described be- low, the standard conditioned suppression procedure could not be used with the kangaroo rat. The two-
'choice procedure which was used instead is described in a later section.
A. Conditioned suppression
The rabbit, cotton rat, and house mouse were tested in,cages constructed with thin brass rods. A water -
1584 J. Acoust. Soc. Am. 68(6), Dec. 1980 0001-4966/80/121584-16500,80 ¸ 1980 Acoustical Society of America 1584

spout, located at one end of the cage, was connected by rubber tubing to a constant?pressure water reservoir via a solenoid-operated water valve. The two sides of a contact circuit were connected to the spout and to the floor bars of the cage in order to record the number of times the animal licked the spout. A shock-generating apparatus was connected to alternate bars in the walls and floor of the cage. The cage itself was mounted on Fiberglas pads and placed in a burlap-draped double- wall acoustical chamber.
1. Stimulus generetion
The details of the stimulus-generation and calibration have been described in detail elsewhere. 4's Briefly, sine waves were produced by an oscillator, connected to an electronic switch, then to an' attenuator, and finally via an impedence-matcning transformer to a wide-rangeloudspeaker (University, 312). For fre- quencies above 64 kHz, a power amplifier (Mcintosh, MC-30) and an ionic speaker (Ionofane, model 601) were used. In either case, the loudspeaker was located 50 to 75 cm in front of the cage and oriented directly towards the animal's head. In order to avoid switching transients, the onset and offset of the tone were slowed to allow at least 10 full cycles of the stimulus to occur during rise and fall of the wave. Thus, a rise-decay time of 25 ms was used for frequencies of 1 kHz and nigher while 50 ms was used for 250 and 500 Hz, 100 ms for 125 Hz, and 250 ms for 63 Hz.
Sound pressure levels (i.e., dB SPL re 20 •N/M 2) were measured with a microphone amplifier (Bruel and Kjaer, 2604), a «-in. or ¬-in. (1.28 or 0.64 cm) conden- ser microphone (4133 or 4136), and an octave filter (1612). Sound measurements were taken in the positio• occupied by the animal's head while it was being tested. Great care was taken to ensure that the sound field
around the animal's ears was homogeneous.
2. Procedure
In all important respects, the conditioned suppression procedure was the same as that described in previous studies. 4'• Briefly, the animals were water deprived in their home cage and then trained to lick a spout for a water reward in the test cage. Once steady licking had been established on a variable ratio schedule (10-20%), the animals were given further training in which the off- set of a 10-s tone was paired with a brief shock to the feet. After a few tone-shock pairings, the onset of the tone elicited a freezing response incompatible with licking. Thereafter, the cessation or suppression of licking was used as an indication of the animal's ability to hear tee tone.
l•ure-tone thresholds were first estimated by a meth- od of limits in wnich the tone intensity was lowered in 5-dB steps until no suppression occurred and then raised until obvious suppression occurred once more. Final threshold values were obtained by the method of constant stimuli in which a series of five intensities 5
dB apart was selected to Cover the range from 10 dB above to.10 dB below the animal's estimated threshold.
To check for .possible artifacts in the sound system
to which the animal might be responding, sham trials were administered in wnich the signal was attenuated at the oscillator to at least 50 dB below the animal's
suspected threshold.
Frequency-difference limens were also determined for the cotton rat and house mouse using a similar pro- cedure. 4 For tnis test the animal was habituated to licking the spout in the presence of a "safe" pulsing tone (0.? s on, 0.3 s off). A trial consisted of a 10-s "warning' stimulus in which the tone pulses alternated between low and nigh frequencies (i.e., 17, F + AF, 17,17 + AF .... ). At the end of the 10-s warning sigr•l, a shock was delivered and the "safe" stimulus was re-
stored (i.e., 17, 17, 17,... ). After a few pairings' with shock, the animal ceased licking whenever there was a large frequency difference in the pulsing tones and this suppression of licking was used as an indication of the animal's ability to discriminate the two frequencies. The tones were presented at an intensity of 30 dB above absolute threshold (i.e., 30 dB SL) as determined in the previous procedure. In addition, sham trials were given in which the alternating tones produced by the two sine wave generators were set to the same frequency, but with the intensities varied by 1-6 dB. No shock was delivered following a sham trial.
For the purpose of quantifying suppression of licking, the number of licks during the 10-s warning period (W), was compared with the number of licks during the 10-s safe period ($) immediately prior to the tone presenta- tion. A measure of suppression could then be expres- sed in the form of a ratio (S-; W)/S. In trained animals this measure varies from near zero (no suppression) tu unity (perfect suppression). For present purposes, the 0.5 suppression ratio was arbitrarily Chosen as the definition of threshold. The use of other definitions of
thresholds (e.g., the 0.2 and 0.8 ratios) have no sub- stantial effect ou the chief conclusions.
B. Two choice '
Because the two-choice procedure was used only with the kangaroo rats, it is described in detail in the sec- tion concerning the kangaroo rat.
II. RABBIT (ORYCTOLAGUS CUNICULUS)
Despite the large increase in the number of mamma- lian audiograms in recent years, there exists no rep- resentative behavioral audiograms for the order Lago- morpha, an order consisting of two families and ten genera including pikas, rabbits, and hares. TM Of the members comprising this order, the domestic rabbit is probably the most common species: they are a common food source for humans and have been widely used in biological research? For these reasons, domestic rabbits appeared to be a good choice for expanding the sample of mammalian audiograms to include Lago- morphs.
A. Method
1. Subjects The domestic rabbits chosen for this experiment were
New Zealand Whites approximately one year of age.
1585 J. Acoust. Soc. Am., Vol. 68, No. 6, December 1980 H. Heffner and B. Masterton: Hearing in Glires 1985
Each animal received routine otoløgical examination during the course of behavioral testing with special attention given to the possible presence of ear mites. The animals were maintained on a diet of commercial
rabbit food supplemented with occasional greens.
2. Apparatus and procedure
The rabbits were tested in an oval cage (91 x 46 x 61 cm) with floors and walls constructed of •-in. (0.48 cm) brass rods and the ceiling constructed of screen mesh. A rat drinking tube was located at one end of the cage.
The conditioned suppression technique was used to assess absolute thresholds (see Sec. I).
B. Results and discussion
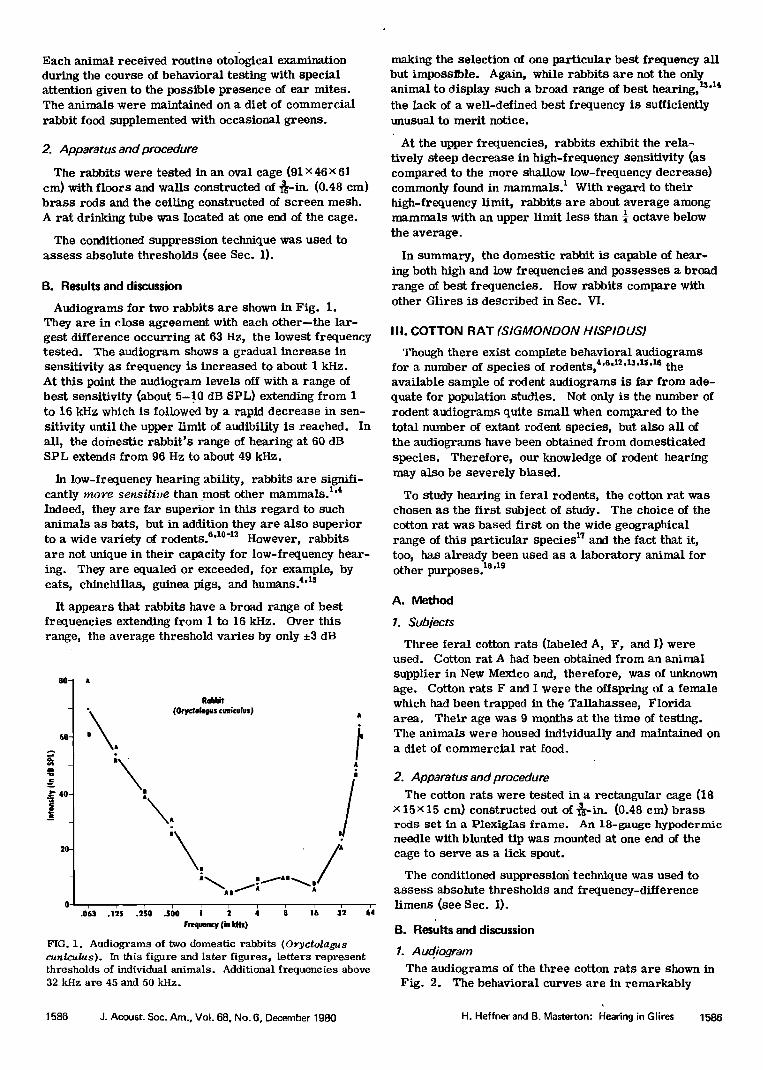
Audiograms for two rabbits are shown in Fig. 1. They are in close agreement with each other--the iar- gest difference occurring at 63 Hz, the lowest frequency tested. The audiogram shows a gradual increase in sensitivity as frequency is increased to about 1 kHz. At this point the audiogram levels off with a range of best sensitivity (about 5-10 dB SPL) extending from 1 to 16 kHz which is followed by a rapid decrease in sen- sitivity until the upper limit of audibility is reached. In all, the domestic rabbit's range of hearing at 60 dB SPL extends from 96 Hz to about 49 kHz.
In low-frequency hearing ability, rabbits are signifi- cantly more sensitive than most other mammals. TM Indeed, they are far superior in this regard to such animals as bats, but in addition they are also superior to a wide variety of rodentsfi '•ø-x2 However, rabbits are not unique in their capacity for low-frequency hear- ing. They are equaled or exceeded, for example, by cats, chinchillas, guinea pigs, and humans. 4'rs
It appears that rabbits have a broad range of best frequencies extending from I to 16 kHz. Over this range, the average threshoId varies by only ñ3 dB
SO- A
• 4C I
2O
Rabb•
A
/ .0•3 .1•5 .2•0 .5•0 i '• '• • 1'6 3'2 6'4
Frequency (ia kHz)
FIG. 1. Audiograms of two domestic rabbits (O•ryctolagus cuniculus). In this figure and later figures, letters represent thresholds of individual animals. Additional frequencies above 32 kHz are 45 and 50 kHz.
making the selection of one particular best frequency aH but impossible. Again, while rabbits are not the only animal to display such a broad range of best hearing, •'aa the lack of a well-defined best frequency is sufficiently unusual to merit notice.
At the upper frequencies, rabbits exhibit the rela- tively steep decrease in high-frequency Sensitivity (as compared to the more shallow low-frequency decrease) commonly found in mammals. • With regard to their high-frequency limit, rabbits are about average among mammals with an upper limit less than ¬ octave below the average.
In summary, the domestic rabbit is capable of hear- ing both high and low frequencies and possesses a broad range of best frequencies. How rabbits compare with other Glires is described in Sec. VI.
III. COTTON RAT (SIGMONDON HISPIOUS)
Though there exist complete behavioral audiograms for a number of species of rodents, •'a'-•-'•s'ls'•a the available sample of rodent audiograms is far from ade- quate for population studies. Not only is the number of rodent audiograms quite small when compared to the total number of extant rodent species, but also all of the audiograms have been obtained from domesticated species. Therefore, our knowledge of rodent hearing may also be severely biased.
To study hearing in fetal rodents, the cotton rat was chosen as the first subject of studyß The choice of the cotton rat was based first on the wide geographical range of this particular species • and the fact that it, too, has already been used as a laboratory animal for other purposes. ta'•9
A. Method
1. Subjects
Three feral cotton rats (iabeled A, F, and I) were used. Cotton rat A had been obtained from an animal
supplier in New Mexico and, therefore, was of unknown age. Cotton rats F and I were the offspring of a female which had been trapped in the Tallahassee, Florida area. Their age was 9 months at the time of testing.. The animals were housed individually and maintained on a diet of commercial rat food.
2. Apparatus and procedure The cotton rats were tested in a rectangular cage (18
x 15x 15 cm) constructed out of •-in. (0.48 cm) brass rods set in a l•lexigias frame. An 18-gauge hypodermic needle with blunted tip was mounted at one end of the cage to serve as a lick spout.
The conditioned suppressio• technique was used to assess absolute thresholds and frequency-difference limens (see Sec. I).
B. Res'ults and discussion
1. Audiogram The andiog•ams of the three cotton rats are show• in
Fig. 2. The behavioral curves are in remarkabty
3586 J. Acoust. Soc. Am., Vol. 68, No. 6, December 1980 H. Heffner and B. Masterton: Hearing in Glires 1586

!00 -
• 40-
- 20
FIG. 2.
Cotton get
Frequency(in kHz)
Audiograms of three cotton rats (Sigmodon hisp•us).
close agreement with each other with little variation occurring at any of the frequencies tested. The audio- gram shows a gradual increase in sensitivity as fre- quency is increased until the best sensitivity is reached at 8 kHz. Above 8 kHz, the audiogram at first shows a gradual decrease in sensitivity then a sharp decrease above 64 kHz. All three of the cotton rats were able
to respond to 76 kHz at 80 dB SPL, but none showed a response to 91 kHz at the same intensity. In all, the cotton rat's range of hearing at 60 dB SPL extends from 1 to 72 kHz.
In low-frequency hearing, the cotton rat is much less sensitive than most other mammals which have been
tested. In a comparison with 29 other species of mam- mals, the cotton rat ranks seventh from the bottom in terms of low-frequency hearing and is surpassed even by the laboratory rak e Indeed, the lack of low-frequen- cy sensitivity in the cotton rat will be seen (in Sec. VI) to serve as an important clue to understanding the in- terrelationships between several descriptive parame- ters of,hearing.
Turning to the midrange of the cotton rat audiogram, it can be seen that the animals have a relatively well- defined best frequency at 8 kHz. The average sensiti- vity at this point is -6 dB SPL and though it is possible that the animals might have been more sensitive to some frequency lying between 4 and 16 kHz, the 8-kHz point is the best of those frequencies tested.
The 60-dB high-frequency limit of the cotton rat, at 72 kHz, is considerably higher than that of other mam- mals and one quite similar to the high-frequency limit of albino rats. a We will return to this point in Sec. VI.
2. Frequency I/mens
It has been suggested that while some animals possess the ability to detect very high frequencies (i.e., in ex- cess of 60 kHz) they may lack the ability to discriminate such high frequencies. 2ø'22 Alternatively, it has been argued that the usefulness of high-frequency hearing
lies in the necessity of using the spectral differences between sounds arriving at the two ears as a cue for sound localization--an ability requiring frequency analy- sis throughout the frequency range of hearing. •'2'• Therefore, it was of some interest to determine if the cotton rat could indeed discriminate high frequencies as weli as merely detect them.
Table I shows the frequency difference thresholds for cotton rat A at 2, 8, 32, and 64 kHz. Note that the animal was able to discriminate frequencies at 64 kHz at a level at least as weli (in terms of AF/F) as at low- er frequencies. Thus, there does not appear to be any discontinuity in mode of transduction or in the ability of the cotton rat to make spectral analyses even at very high frequencies.
In summary, the cotton rat is able to hear high fre- quencies, but has relatively poor low-frequency hear- ing. How the cotton rat compares with other Glires is' described in Sec. VI.
IV. FERAL HOUSE MOUSE (MUS MUSCULUS)
Partly as a result of the current interest in the ultra- sonic vocalizations of mice, 24-2a the hearing abilities of house mice have been the subject of numerous studies. Estimates of mouse hearing have been derived from studies which have employed techniques ranging from the pinna (or Preyer) reflex, 27'28 or electrophysiological recording, 29'aø to behavioral conditioning tech- niques.?,e,n,a•,a2
In reviewing the major behavioral audiograms for mice, two facts soon become apparent. First, there are significant differences between the various pub- lished audiograms both in frequency range and in abso- lute sensitivity. For example, estimates of high-fre- quency hearing range from 40 ax to 90 kHz x2 while esti- mates of peak sensitivity differ by more than 20 dB. 12'S1'S2 Thus, mouse audiograms vary over too broad a range to allow even their average to be used as a reasonable estimate. Second, previous measure- ments of mouse hearing are based invariably on domes- ticated varieties. Though most, if not all, of the ani- mals tested seemed to be normal-hearing animals, it is well-known that many laboratory varieties of mice have genetic hearing defects. 29"•ø As a result, the audiogram of feral house mice provides a baseline to which the hearing abilities of the domesticated varie- ties can be compared as well as enlarges the sample of rodent audiograms.
TABLE I. Frequency difference thresholds (AF/F).
Frequency of standard (in kHz) Species 2 4 8 16 32 64
Cotton rat 0.015 '" 0.020 '" 0.0i9 0.010 Feral mouse ß ' ' 0.056 ß" 0.031 ß ß ' 0.023
1587 J. Acoust. Soc, Am., Vol. 68, No. 6, December 1980 H. Heffner and 8. Masterton: Hearing in Glires 1587

A. Method
1. Sub/ects
Three feral house mice (labeled A, B, and C) were used. Mice A and B were the offspring of a pregnant female which had been trapped in the Tallahassee, Florida area and were one year of age at the time of testing. Mouse C was also trapped locally and, there- fore, its age was unknown. The animals were main- rained on a diet of commercial rat food.
2. Apparatus and procedure
The mice were tested in a small rectangular cage (10x8x 5 cm). The walls, ceiling, and floor of the cage were constructed of 0.2-cm brass rods. A blunted 21- gauge hypodermic needle was placed at one end and served as the water spout. The cage was placed on a stand 12 cm high and the entire testing apparatus was . placed on a burlap-covered surface in the sound cham- ber.
The conditioned suppression technique was used to assess absolute thresholds as well as frequency-differ- ence limens (see Sec. I).
B. Results and discussion
I. Audiogram
The audiograms of the three feral mice are shown in Fig. 3. The behavioral curves are in close agreement with each other for aU but the very lowest frequencies. The audiograms show a gradual increase in sensitivity as frequency is increased to a well-defined best fre- quency near 16 kHz. Indeed, the mice appear to be quite sensitive at this frequency with an average thresh- old of -10 dB SPL. Above 16 kHz, the sensitivity of the animals begins to decrease gradually with a steeper decline above 64 kHz. Mice A and B responded to 91 kHz at 58 dB SPL, but failed to respond to 128 kHz at 74 dB SPL. In all, the range of hearing in the feral
80- Fetal House Meuse
( Mus musc•bs)
(c?)
AC•cJB 2 4 8 • 3'2 6• 9'•
Froquincy (ia kNz)
A!
FIG. 3. Audiograms of three feral house mice(Mus musculus). Query indicates incomplete estimation of threshold for mouse C at 2 kHz. Mouse C was also tested at 3.3 kHz.
mouse, at an intensity of 60 dB SPL, extends from 2.3 to 92 kHz.
Returning to the low-frequency end of the audiogram, it can be seen that the animals probably could not hear much below 2 kHz. In spite of repeated attempts it was not possible to obtain a response from any of the ani- mals to frequencies between 1 and 2 kHz (SPL ?0-80 dB) in the absence of a marked onset transient. Fur- thermore, mouse C could barely respond reliably to 2 kHz at a level of 70 dB SPL (higher intensity levels at this frequency produced significant distortion with no- ticeable overtones). Such a lack of sensitivity to low- frequency sounds is unusual among mammals and, in- deed, bats are the only other mammals known to have poorer low-frequency sensitivity. •ø'•
That the poor low-frequ•ency sensitivity of fetal mice is not due to a generally lower sensitivity to sounds is demonstrated by their thresholds in the mid-frequency range of their audiograms. With thresholds at 16 kHz ranging from -7 to -11 dB SPL it is clear that the mice can perceive low intensity sounds and, indeed, their best sensitivity exceeds that of the majority of mam- mals yet tested. Furthermore, the mice are excep- tionally sensitive to high-frequency sounds and among terrestrial mammals are exceeded in this capacity only
by bats. Indeed, it appears as though the audiograms of th e mice have been shifted, with a decrease in low- frequency sensitivity occurring along with an increase in high-frequency sensitivity. This apparent relation- ship between low-frequency and high-frequency hearing will be returned to in Sec. VI.
2. Frequency limens
'Because of the argument surrounding the discrimina- tion of very high frequencies previously mentioned, the frequency discrimination thresholds of two of the mice were also determined (Table I). These results show that the mice were also able to discriminate high frequencies as well as or better than frequencies in the middle or low range of their audiogram. Thus, these data support the conclusion of Ehret •4 that mice are able to discriminate frequencies throughout their range of hearing. Since no discontinuity in absolute or fre- quency threshold is evident, it can be concluded that there seems to be no great or obvious difference be- tween their perception of high-frequency and low-fre- quency sounds.
3. Comparison with laboratory house mice
Figure 4 presents the average audiogram of the fetal mice along with three behavioral audi0grams of labora- tory mice which used either the CBA-J strain •'•2 or the NMRI strain. x2 The figure shows that there are notable differences among the laboratory mouse audio- grams, especially in high-frequency and low-frequency hearing. Indeed, given the large methodological differ- ences between the studies, it seems premature to n•ke any final conclusions concerning the hearing capacities of the house mouse. However, when all four audio- grams are viewed together, three general features can be observed. First, the house mouse appears relative-
1588 J. Acoust. Soc. Am., Vol. 68, No. 6, December 1980 H. Heffner and 8. Masterton: Hearing in Glires 1588

100-
80-
60-
•m•,40- 20-
O-
- 2O
Mice
Frequency (in kHz)
FIG. 4. Average audiograms of fetal and laboratory strains of Mus musculus from the present and three previous studies. H, present results; B, Ber- l[n3i; Bt, Birch •t a/.32; M, Mark[ and Ehret. 12
ly insensitive to low frequencies as most of the audio- grams indicate a lack of sensitivity to frequencies be- low I kHz. Second, the house mouse appears to have relatively good high-frequency hearing as all but one of the audiograms indicate that its upper limit of hear- ing lies beyond 64 kHz. Finally, the best frequency of hearing for this species appears to Lie around 16 kHz.
ß Though it may be tempting to conclude that the fetal house mouse possesses better absolute sensitivity than the domestic strains, such a conclusion is precluded by the methodological differences and small number of 3x•i- m•ls involved in each of the studies. Just how house
mice compare with other Glires is described in Sec. VI.
V. KANGAROO RAT (DIPODOMYS MœRRIAMI)
Because the kangaroo rat possesses several unusual morphological features in its auditory system, it has been of special interest in auditory research. n'3• Of particular interest is the greatly enlarged middle ear cavity, the combined volumes of which exceed that of the brain itself. 16 Recently, it has been demonstrated that the hypertrophied bulla of the kangaroo rat serves to increase the sensitivity of the animal to low-fre- quency sounds. •6 In addition, kangaroo rats possess a roedial superior olive greatly enlarged over that of other mammals of the same size .37 in sum, kangaroo rats ap- pear to have evolved unusual low-frequency hearing sensit/- vity not found in most rodents, or for that matter, in most other mammals. l'x•
The remarkable low-frequency sensitivity of the kangaroo rat raises a number of general issues con- cerning mammalian hearing. One such issue concerns the inability of most mammals to hear both very low- and very high-frequency sounds. Because lowofrequen- cy and high-frequency sensitivity are negatively cor- related among mammals, 1 it would seem to follow that the l•mgaroo rat might have had to sacrifice high-fre- quency sensitivity in return for its exceptional low-fre- quency sensitivity. A separate issue concerns the abi- lity of the kangaroo rat to localize sound. Because small animals appear to rely heavily on the perception
of high frequencies in order to localize sounds accu- rately, 1"• the question arises as to whether the in- creased low-frequency sensitivity of the kangaroo rat has affected its ability to localize sound or whether the binaural analyzing mechanisms of its brainstem have also adapted to low-frequency hearing.
In previous estimates of the auditory abilities of the kangaroo rat, neither its very high- or very low- frequency hearing abilities, nor its ability for sound localization have been completely determined. •e'z9 To answer these questions, a somewhat longer series of auditory tests were carried out. These experiments consisted of the determination of high-frequency and low-frequency hearing thresholds and the determination of threshold and performance curves for the localiza- tion of brief sounds.
A. Methods
Because kangaroo rats are adapted to arid habitats (the ones used here were collected in the Sonora desert of Arizona) and normally obtain water only from seeds, they do not find water to be a reward. For this reason our standard procedure could not be used for testing. Given that a different procedure was necessary and wishing to include tests of sound localization, the con- ditioned suppression technique was replaced by a more compatible two-choice technique using millet seed as a reward. In general, the animals were trained first to enter an observing compartment which faced a loud- speaker (Fig. 5). Having triggered a trial by their entry, the animals were then trained to enter a com- partment to the left of the observing compartment if a tone was presented and to enter a compartment to the right if no tone was preseeted. 4ø
1. Subiects
Two feral kangaroo rats were used in this study. The animals had been wild-trapped in the Tucson, Arizona area and their ages were unknown. The animals were maintained on a diet of seeds supplemented with occas- sional greens.
1589 J. Acoust. Soc. Am., Vol. 68, No. 6, December 1980 H. Heffner and B. Masterton: Hearing in Glires 1589

Speaker
Food Cu
Ught Ugh•
Food Cup
Seed Dispenser
FIG. 5. Test cage used •o assess thresholds in kangaroo rats. Note center "observing" compartment and two side "response" com- partments. Absolute thresholds were determined with a single speaker mounted as shown. Lo- calization thresholds were de-
termined with two moveable
speakers.
2. Details of behavioral apparatus
The kangaroo rats were tested in a 20x 15 x 10-cm cage constructed of «-in. (1.27-cm) hardware cloth (see Fig. 5). The test cage had three compartments attached to it: an observing compartment (4x 6x7 cm) and two side compartments (7x 6x 7 cm). A photocell mounted above and a light mounted below the entrance of each compartment served to detect the entry of an animal into the compartment. Stainless steel 30-ml measuring cups mounted in the two side compartments served to receive cleaned and hulled millet seeds which were dis-
pensed from modified rat-pellet dispensers. Additional cue lights mounted on the side compartments and in front of the observing compartment were used as visual stimuli in the early stages of training. The entire test apparatus was mounted on a stand 30 cm high and placed on a burlap-covered surface located in a burlap-draped acoustical chamber.
3. Details of stimulus generation
For the pure-tone tests, sine waves were produced, keyed, attenuated, and measured in the usual manner and led to one of two loudspeakers, either a University T202 tweeter (for frequencies from 8 to 64 kHz) or an Acoustic Research 3a speaker system (for frequencies from 50 Hz to 8 kHz). The loudspeakers were placed in front of and slightly above the observing compart- ment and directed toward it.
For sound-localization tests, the cage was placed in a carpeted room (3 x 3 m), the wails and ceiling of which were draped with burlap. For click-localization tests, clicks were produced by 0.1-ms square waves,
ß amplified by a power amplifier and led to two 1.5-in. (3.8 cm) dome tweeters (Long Engineering, L15F). These speakers were located 5 ft (1.52 m) in front of the cage on either side of the animal's midline when it entered the "observing" compartment. Testing was conducted at speaker separation angles of 180 ø, 90 ø, 60 ø, 30 ø, 20 ø, 15 ø, 10 ø , 5 ø, and 0 ø.
For tone-pip localization tests, the same sine-wave generating equipment was used except for frequencies below 500 Hz for which 6-in. (15 cm) paper cone speak- ers were used. The stimuli for this test were purpose- ly set to match as closely as possible those used in the study of Masterton and his colleagues. '•8 First, the tone-pips were electronically keyed with rise times of 40 ms, remained at their peak amplitude for 60 ms, and then decayed over 40 ms. Seco nd , the speakers were placed 3.7 ft (1.13 m) from the animal and the intensity of the tone adjusted to 40 dB above the ani- mal's threshold. Finally, the tone-pip testing was done at a constant angie of 60 ø separation (i. e., 30ø left versus 30 ø right).
4. Training procedure
A food-deprived kangaroo rat was placed in the test cage and accustomed to receiving millet seeds dispen- sed into the side compartments. After several sessions of acclimatization, the animal was trained to make a two-choice discrimination using visual cues. In this procedure, entry into the center or "observing" com- partment initiated a trial which was signaled by turning off the cue light adjacent to the center compartment and by turning on the cue light adjacent to one of the side compartments. Entry into the illuminated side compartment was rewarded by dispensing a millet seed into that compartment while entry into the unillumin- ated compartment was not rewarded and was followed by a short time-out (signaled by dimming the room lights) before the next trial could be begun. This train- ing served only to accustom the animal to the response requirements of the task.
Once the animal had learned to make the two-choice
discrimination using visual cues, auditory traim,'ng was begun. In this training, entry into the center compar•- merit initiated a trial and turned off the center cue
light as before. However, now a pulsed tone (0.2 s on, 0.1 s off) was presented randomly on half of the trials. The animal was required to wait in the obserV-
1590 J. Acoust. Soc. Am., Vol. 68, No. 6, December 1980 H. Heffner and B. Masterton: Hearing in Glires 1590

ing compartment for at least 1 s before making a re- sponse to one or the other side compartments. The end of this observing period was signaled by illuminat- ing both of the side compartments. The animal was then rewarded for entry into the left compartment in the presence of a tone or for entry into the right com- partment in the absence of a tone. Incorrect responses were followed by a time-out as in the previous visual training. Thus, entry into the left compartment was used as an indication that a tons had been heard while
entry into the right compartment was' used as an indi- cation that no tone had been heard.
To reduce the possibility of a side preference, a modified correction procedure was used in which the correct side was not changed following an error. These correction trials were not used in the calculation
of the animal's performance.
For sound localization tests, the same procedure was used except that now the animal was required to ' enter the left compartment when a sound emanated from the speaker on the left side and to enter the right com- partment when a sound emanated from the speaker on the right side. The procedure of indicating the direc- tion of the sound source by moving left or right (in- stead of approaching the sound source itself) is the only departure from the localization procedure used by Mas- terton et al. as
5. Testing procedure
As in the Previous audiogram testing, threshold de- termination for pure tones was conducted in two ways. First, the threshold for a particular frequency was es- timated by reducing the intensity of the tone in steps of 5 or 10 dB, with blocks of 10 or 20 trials given at each intensity, until the animal could no longer distinguish the tone and no-tone trials. Once an estimate of thresh-
old had been obtained, a second threshold determination was conducted by presenting tones with. intensity levels
in 5-dB increments extending from 10 dB below to 10 dB above the estimated threshohi. At least 50 trials were given at intensities just above and below threshold with threshold defined in terms of the 0.01 one-tailed level of significance (binomial distribution). In addi- tion, each frequency was retested in a subsequent ses- sion and testing was judged complete only if the two thresholds were within 3 dB of each other. If the thresholds differed by more than 3 dB, testing was con- tinued until a stable threshold value was determined.
Click-localization thresholds were determined by testing the animal at successively smaller angles until performance dropped to chance levels. A minimum of 200 trials were given at each angle.
Inthe tone-pip localization tests, no thresholds were determined, but instead, the animal was tested at each frequency to the criterion used by Masterton et al. The criterion was a performance level of 90% or better for four successive blocks of 10 trials each. If the
animal failed to reach this criterion after 2000 trials, testing was discontinued and the animal's highest score for four successive blocks of 10 trials was used as the final measure of performance. Thus, the scores ob- tained from this test are a comparative measure of the ability to localize tones of differing frequencies at an angle of, 60 ø and are directly comparable with previous results on other animals.
B. Results and discussion
1. Audiogram
The pure-tone thresholds for two kangaroo rats are shown along with the average of Webster and Webster's results x8 in Fig. 6. Because the results of preliminary testing at the middle frequencies did not differ signifi- cantly from the results of the Websters, detailed test- ing was carried out only at the very high and very low frequencies which they had not tested. Additional de-
Kangaroo Rat 80- ( Dipodomys rnerrienli )
60
.250 .500
•requency (in kHz)
FIG. 6. Composite audiogram of kangaroo rata (Dipodomys mer- riami). Letters B and C repr e- sent •hresholds of individual ani-
mals in present study. W indi- cates thresholds obtained by Web- ster and Webster. is
1591 J. Acoust. Soc. Am., Vol. 68, No. 8, December 1980 H. Heffner and B. Masterton: Hearing in Glires 1591

tailed testing of the two kangaroo rats was, however, conducted at 8 kHz where it was again shown that the results for these animals did not differ significantly from those of the Websters (Fig. 6).
Beginning at the low-frequency end of the audiogram, the present results indicate that the kangaroo rat pos- sesses good 10w-frequency hearing with a threshold at ' 50 Hz of 55 dB SPL. Indeed, this unusual ability to hear low-frequency tones made it impossible to deter- mine the lowest frequency which could be perceived at 60 dB, since below 50 Hz,higher intensities produced unavoidable overtones. Thus, this result confirms the earlier finding that kangaroo rats have unusually good low-frequency hearing. 16
According to the results of the Websters, the kanga- roo rat sensitivity gradually increases to a best fre- quency at about 1 kHz with a small and gradual decline in sensitivity at 4 and 8 kHz. With the addition of the present results for frequencies from 8 to 64 kHz, it can be-seen that the sensitivity is relatively flat up to 16 kHz. Above 16 kHz, sensitivity begins to decrease sharply. However, the animals were able to hear 62 kHzat70dBSPLand 52kHzat 60dB SPL. From
these results, then, it appears that the kangaroo rat has the ability to hear high-frequency sounds as well as very low-frequency sounds.
Though the kangaroo rat has retained the ability to hear high frequencies, despite its excellent low-fre- quency hearing, the question arises whether or not it can hear as high as would be expected on the basis of known relationships between high-frequency sensitivity and other biological characteristics. Specifically, the relationship between high-frequency hearing and the functional distance between the two ears (i.e., the max- imum binaural time disparity, At) was used to calcu- late an expected value for the high-frequency limit. x The value for the kangaroo rat predicted by this cal- culation is 74 kHz at 60 dB. This value is more than
one standard deviation higher than the obtained value of 52 kHz, although this difference is not large enough to be statistically reliable (z =1.38, p >0.05). Thus, while it appears that the kangaroo rat may have given up some of its ancestral high-frequency hearing for good low-frequency hearing, it is not unusually deviant in its high-frequency hearing ability. We will return to the possible trade-off between high-frequency and low-
. frequency hearing in Sec. VI.
2. Sound localization
Although the main purpose of studying the kangaroo rat was to determine its audiogram, the unusual audio- gram prompted a further question: namely, can the kangaroo rat use its entire frequency range for sound localization or, alternatively, was the extension of its hearing into low frequencies solely for the detection of sound. To obtain a first approximation to the answer of this further question, the most cooperative animal, KR-C, was chosen for testing of its sound localization abilities.
The kangaroo rat was tested first for its ability to
localize the source of a 2/s click train and then a single click. In Fig. 7(a) it can be seen that the animat was able to perform at a level between 83% and 93% cor- rect for angles from 30 ø to 180 ø . In no case did the animal consistently perform above 95% correct for an entire session of 50 or more trials. Below 30 ø the
animal's performance dropped markedly, falling be- low chance at about 7 ø . As determined by an arbi- trary 75% correct criterion, localization thresholds were 20 ø for the click train and 23 ø for a single click.
- The results of the click localization test indicate t•t
the kangaroo rat was clearly able to localize sounds. Indeed, the animal transferred easily from the absolute- threshold task to the sound-localization task and was
performing well above change on the first session in which the locus of the sound source was the relevant
cue. Therefore, it seems safe to conclude that kanga- roo rats can localize brief sounds and are readily able to learn a sound-•localization task. However, it must be noted that the lmngaroo rat appears to be less able to localize sounds than many other mammals. For ex- ample, cats, 41 dogs, 42 monkeys, 43 opossums, &• seals, 4'• and humans, •6 each have localization thresholds ranging from 1 to 6 degrees--far superior to the kangaroo rat thresholds. However, the kangaroo rat is also not uni- que in its relatively poor localization performance for it appears that the laboratory rat is similarly unable to localize sounds at small angles of separation?
70. 60.
5O
Angle of Separation (in degrees)
25 5 1 2 4 8 16 32
Frequency of Tone (in kHz)
FIG. 7. Sound localization in kangaroo rat. A: LocaIization of a 2/s click train, T, and a single click, S, by animal KR-C. B: Localization performance for brief tone pips at 60 ø separa-' tion. Note 'dip in performance at 4 kHz. Hatched area indi- cates chance level of performance.
1592 J. Acoust. Soc. Am., Vol. 68, No. 6, December 1980 H. Heffner and B. Masterton: Hearing in Glires 1592

To further explore the ability of the kangaroo rat to discriminate differences in the direction of a sound
source, the animal was tested for its ability to localize brief tone-pips of various frequencies. This test is of physiological significance because the ability to localize low frequencies suggests that the animal can use bi- naural time or phase-difference cues for sound local- ization, while the ability to localize high frequencies suggests the ability to use binaural spectrum difference
38,48 CUES.
The results of this test are shown in Fig. 7(b). The figure illustrates three main points. First, since the kangaroo rat reached a 90% correct criterion on low frequencies ranging from 250 Hz to 2 kHz, it is prob- ably capable of using binaural phase-difference cues to localize the direction of a sound source? Second, since the animal also reached criterion at high fre- quencies of 16 and 32 kHz, it can also use binaural spectrum difference cues to localize sound. Third, the kangaroo rat showed the same marked decrease in performance in its midrange that many other small- headed animals do. '•8 Apparently, near 4 kHz for the kangaroo rat, neither cue is sufficient for the animal to localize at high levels of performance.
The results of the tone localization test demonstrate
once more that the kangaroo rat is not unusual in its ability to localize sounds. In its ability to localize tone' pips, at least, it appears quite similar to the laboratory rat, '•s Specifically, both animals are able to localize low-frequency and high-frequency tones and both ani- mals show a distinct decrement in performance in the mid-frequency range corresponding to the decrements in the two binaural cues in this frequency range. The only major difference between the two species is that performance is lowest around 4 kHz in the kangaroo rat while the white rat's lowest performance is at 8 kHz. Since the. theoretical upper limt of the phase-difference cue for the kangaroo rat under the testing conditions used here is 12 kHz while the white rat's is 8 kHz, "a (for the formula for calculating the upper limit for the phase cue, see Refs. 48 or 49)'this result would seem to mean that the kangaroo rat, unlike the white rat, cannot use the binaural time cue throughout its available range.
In summary, the kangaroo rat does n øt seem to have sacrificed much of its ability to hear high frequencies in order to hear low-frequency sounds. Nor does the animal lack the ability to localize sounds of either high or low frequencies. However, as Webster and Web- ster la have shown, the kangaroo rat is certainly well- adapted to perceiving low-frequency sounds and it does not appear to be as accurate at sound localization 'as most other (larger) animals. How the kangaroo rat compares with other animals will be considered further in Sec. VI.
Vl. GENERAL DISCUSSION
With the inclusion of the rabbit, cotton rat, fetal mouse, and kangaroo rat, the sample of audiograms for the Taxon Glires is increased to the po int where com- parisons within the cohort may be readily made. The
1593 J. Acoust. Soc. Am., Vol. 68, No. 6, December 1980
first part of the following discussion compares hearing abilities within Glires and then between Glires and other mammals. The second part is directed to some of the systematic sources of variation in high-frequency and low-frequency hearing throughout mammals, Glires included.
A. Auditor• characteristics of Glires and their comparison with other mammals
This discussion is divided into four sections corre-
sponding to four fundamental descriptive parameters of hearing: (1) low-frequency limit--the lowest fre- quency audible at an intensity level of 60 dB SPL; (2) high-frequency limit--the highest frequency audible at 60 dB SPL; (3) best frequency--the frequency with the lowest threshold; and (4) lowest threshold--the sound pressure level of the lowest audible intensity of the audiogram. These four parameters have been discus- sed elsewhere 1's and differ from previous comparisons only in that 60 dB SPL is used to define the first two parameters instead of 70 dB SPL. Though perhaps not as accurate in defining limits as 70 dB SPL, 60 dB SPL allows the inclusion of the audiograms of several animals for which 70-dB SPL limits are not available.
1. Low-frequency hearing
The low-frequency limit of hearing in nine species of Glires is shown in Fig. 8(a). (Averages and standard deviations are given in Table II.) The low-frequency limits range from 42 in the kangaroo rat to 2300 Itz in the feral mouse with an average value of 198 Hz. This average value is somewhat lower than the mammalian average of 255 Hz (Tabte II), but with the wide varia- tion in low-frequency limits, this difference is not statistically reliable (p > 0.05).
It should be noted, however, that the low-frequency limits shown in Fig. 8(a) appear to fall into two dis- parate groups. One group contains animals able to hear below 100 Hz; the other group contains animals unable to hear much below 500 Hz. Indeed, in the sec- ond group are the cotton rat and feral mouse whose low- frequency limits are in the kilohertz range. It can be noted further that the four Glires with the highest low- frequency limit also are the four species with the high- est high-frequency limit [cf. Figs. 8(a) and 8(b)]. Thus, Glires evidence wide variation in low-frequency hearing and this variation appears to be related to the variation in high-frequency limit. (We return to this point below.)
2. High-frequency hearing
High-frequency limits for nine species of Glires are shown in Fig. 8(b). Once more, the distribution of limits covers a wide range, from 33 (chinchilla) • to 92 kHz (fetal mouse) with an average near 60 kHz. Thus, it appears that Glires as a group are able to hear fre- quencies far above the 19 kHz upper limit of human hearing--though, on average, they hear only slightly higher than the mammalian average (Table II).
Close inspection of Fig. 8(b), however, reveals that
H. Heffner and 8. Masterton: Hearing in Glires 1593

•G
A •
' .o35 .o3 , I
128
20-
•+10- ell ia
• GP M(I) • I, • + • ,' • 0- .500 I 2 • 8 16 32 Best r. Nquincy (in kilt) ß
• -io-
iu
ii M(I)
ICR •
I
- 2O
FIG. 8. Auditory characteristics of nine species of Glires. A: Distribution of low-frequency limits (at 60 dB SPL). B: Distribu- tion of high-frequency limits (at 60 dB SPL). C: Distribution of best frequencies. D: Distribution of lowest thresholds. Ch0 chinchilla, Miller13• M(f), fetal house mouse, present study; M(l), laboratory mouse, averaged from Berlinat; Birch et a/.32; ' and Mark[ and EhretZ2; Go gerbil, HymulS• GP, guinea pig t Heffner ½t a/.4; KRt kangaroo rat, present study: H, rabbit, present study; Hi(l), laboratory rat. G Dotted lines in A indicate extrapolated values.
not'all Glires possess exceptional high-frequency hear- ing. In particular, the chinchilla with an upper limit of about 33 kHz appears to deviate significantly from the rest of the group (p < 0.05). This unusual feature of chinchilla hearing is of significance in the selection of the chinchilla as an experimental animal for auditory research. That is, the chinchilla more closely approx- imates human high-frequency hearing ability than any other Glires and would seem to be an appropriate choice for auditory research when a correspondence with at least this one feature of human hearing is de- sired.5ø
3. Best frequeny
The best frequencies for the nine species of Oilres are shown in Fig. 8(c). These frequencies range from 1 for the kangaroo rat to 16 kHz in the ferai mouse with an average of 5 kHz (Table II). Not surprisingly, the distribution of best frequencies parallels the previous two parameters. That is, species which have good high-frequency hearing have higher best frequencies than species with good low-frequency hearing.
Overall, the average best frequency of Glires is low- er than the average mammalian value (p < 0.05). This
difference is somewhat surprising in view of the fact that Glires have slightly better than average high-fre- quency hearing. However, this difference may be due to a sampling bias--the sample of mammals is not a truly random sample, being overweighted with large primates and underweighted with small rodents. For this reason, we are restrained from concluding that Glires might have a lower best frequency than the mam- malian average.
4. Lowest threshold
The average lowest threshold for Glires is 0.3 dB SPL, a value similar to the mammalian average (Table II). As Fig. 8(d) shows, lowest threshold varies from +7 dB to -10 dB SPL. Therefore, the Glires do not appear to be unusual among mammais in their lowest threshold.
5. Summary
The hearing characteristics of Glires show marked variation. Some species such as mice, are capable of perceiving very high frequencies while others, such as the chinchilla, lack this ability. On the other hand, chinchillas, kangaroo rats, and gerbils have exception-
TABLE II. Auditory characteristics of glires compared with mammals.
Taxon
Low- High- frequency frequency Best Lowest
limit limit frequency threshold (in kHz) (in kHz) (in kHz) (in dB)
Glires: Average 198 Hz 59.3 kHz 5.0 kHz --0.3 dB SD 2.4 oct. 0.4 oct. 1.3 oct. 5.5 dB
Mammalia a: Average 255 Hz 55.4 kHz 9.8 kHz --1.5 dB SD 2.4 oct. 0.7 oct. 1.4 oct. 9.7 dB
The mammalian average and standard deviations are based on samples that are within 5% of the true distribution of mammalian genera per order except for primates (overweighted with ten gen- era instead of two) and rodentis (underweighted with eight genera instead of twelve).
1594 J. Acoust. Soc. Am., Vol. 68, No. 6, December 1980 H. Heffner and B. Masterton: Hearing in Glires 1594

ally good low-frequency hearing. •'%•5 These findings demonstrate that the auditory characteristics of the members of a widely varied taxonomic group cannot be very accurately inferred from the characteristics of
other members of the same group. Or, in other terms, habitus is as important a determinant as heritage for the auditory characters of Glires. However, the varia- tions present are not wholly random. It is possible to show relationships between some of the auditory charac- teristics and other morphological and ecological charac- teristics. The purpose of the final section is to de- scribe those relationships which appear to account for some of the systematic variation in high-frequency and low-frequency hearing.
B. Systematic variation in the limits of mammalian hearing
1. High-frequency hearing As previously noted, Glires show wide-spread varia-
tion in high-frequency hearing ability with high-fre- quency limits ranging from 33 to 92 kHz [Fig. 8(b)]. Such variation in high-frequency hearing is not uncom- mon among mammals and has been ascribed to selec- tive pressure for accurate sound localization. •'2'•
Briefly, the two primary binaural cues for sound localization, the difference in time of arrival of a sound at the two ears (•t) and the difference in frequen- cy-intensity spectra of the sound reaching the two ears (•Xfi), are closely dependent on the functional distance
and the sound shadow of the head and pinna between the two ears. That is, the further apart the ears, the lar- ger will be the •t for any given direction of a sound source. Similarly, the /•fi cue is greater for animals with wide-set ears both because the sound attenuation
is greater over the longer distance between the ears and because animals with wide-set ears usually have large heads or large pinnae which effectively block the high-frequency content of a sound cue (i.e., a head- shadow and piunae-shadow effect). While these two bi- naural sound localization cues are readily available to animals with large heads, the effectiveness of either cue is greatly diminished in animals with small heads and small or close-set ears. In the case of zXt, the available time differences may be so small that the nervous system can resolve only gross changes in sound direction or, as is apparently the case in the hedgehog, the nervous system may have lost entirely its mechanism for analyzing the zXt cue. '•s
However, an animal with a small head always has a •fi cue available, providing only that it is able to per- ceive frequencies which are high enough to be effective- ly shadowed by its head and pinnae. Therefore, given the ecological importance for animals to localize brief sounds, animals with functionally close-set ears are subjected to more selective pressure to hear higher frequencies than animals with more widely set 'ears. This inverse relationship between functional interaural distance and high-frequency hearing has already been
60-
40-
20-
21
27 i5 •
25 13 ' 14
4'0 8'0 1(•0 3•0 6•0 12'80 Maximum At (in ps )
FIG. 9. Relationship between maximum At and high-frequency hearin• limit. (Numbers indicate values for 28 species and letters indicate values obtained in present study.) CR, cotton rat; KR, Kangaroo rat; M(f), Feral house mouse; R, rabbit. 1, Opossum (Didelphis virginiana)Sl; 2, Hedgehog(Hemtechinus au•tus)52; 3, Tree shrew (Tupaiaglis)53; 4, Horseshoe bat (Rhi•olophusfe•mequinum)lt; 5, Little brown bat (Myotis lucifugus)tø; 6, Big brown bat(Eptesicusfuscus)•ø; 7, Slow loris (l•ycticcbus couca•)5; 8, Potte (Pe•,odicticus potto)5 ; 9, Bushbaby (Galago senegale•sis)54; 10, Owl ' 5• ß monkey (Aotus t•iwrgatus) ;
1 56, 57 58,59 1 , Squirrel monkey(Saimi•i sciu•eus) ; 12, Mae•que (Macaca sp.) ; 13, Chimps_nzee (Pa• t•oglod•tes)6ø; 14, HumanG•& 15, Gerbil (Me•iones unguiculatis)is; 16, Laboratory rat (Rattus •ozvegicus)G; 17, Laboratory mouse (Mus musculus), see Fig. 8; 18, Guinea pig(Caviapozcellus)4; 19, Chtnchilla (Chinchilla sp.)•3; 20, Dolphin (underwater)(lnia geoffze•sis)52; 21, Porpoise (underwater) (•rsiops truncatus)G3; 22, Killer whale (underwater) (Ozcinus orca)G4; 23, Dog (Ca•is familiazis)GS; 24, Sealion (Zalophus califoz•iarms)GG; 25, Common seal (Phoca vit•lina)4ø; 26, Common seal (underwater)(t•hoca vitulina)4ø; 27, lq[nged seal (underwater) (Pusa hispida)G?; 28, Harl• seal (underwater) (Pagophilus g•oenla•dicus)G•; 29, Sheep (Ovis a•'ies).•
1595 J. Acoust. Soc. Am., Vol. 68, No. 6, December 1980 H. Heffner and B. Masterton: Hearing in Glires 1595

demonstrated on a restricted sample of mammals. •
The data relevant for this relationship is up-dated to 32 different species of mammals in Fig. 9. In this fig- ure, interaural distance is expressed in terms of the maximum At that the animal can experience--that is, the time it takes for sound to travel around the head
from one ear to the other; and high-frequency limit is expressed as the highest frequency the animal can de- tect at an intensity of 60 dB SPL. The correlation be- tween these measures is -0.84, which, with 32 indepen- dent points, is highly reliable (p < 0.01). Thus, as in previous surveys based on smaller numbers of mam- mals 1'2'• maximum At and high-frequency hearing are found to be highly and inversely correlated.
Though maximum At and high-frequency limit are correlated in mammals, the same does not appear to hold true for nonmammalian vertebrates. For example, the audiograms of fish, 7ø as well as behavioral and electrophysiological data from amphibians and rep- tiles 7•-•4 do not reveal any systematic variation in high- frequency hearing which is correlated with maximum At. In birds, despite occasional claims to the con- trary, there does not appear to be much variation in high-frequency hearing at all and none dependent on head size: small-headed birds, such as canaries, and larger-headed birds such as pigeons and blackbirds, each have nearly the same upper limit of hearing at 8 to 10 kHz. 7s Therefore, the close relationship between high-frequency hearing and maximum At appears to be a uniquely mammalian trait as is the ability to hear frequencies above 10 kHz.
2. Low-frequency hearing in mammals
In previous surveys of mammalian hearing, it has been noted that low-frequency hearing shows a good deal of variation from one species to another. z'2'• For example, the kangaroo rat and guinea pig have low- frequency limits of less than 0.05 kHz, and the cotton rat and feral house mouse have limits of 1 and 2.3 kHz, respectively [cf., Fig. 8(a)]. Even more extreme com- parisons have been noted: humans have a limit of about 0.03 kHz 6• and the bat, Myotis lucif•gus, has a limit of 10.3 kHz. •ø Thus, the range of low-frequency limits in mammals spans a range of more than 9 octaves--dwarf- ing the 3-octave range in the distribution of high-fre- quency limits.
In an attempt to explain this wide variation, a number of parameters have been analyzed. Of these, three
have shown particularly persistent correlations with low-frequency limit: high-frequency limit; maximum At; and body weight. Table IH lists the correlation coefficients between each of these three parameters and low-frequency limit. As can be seen, each of the three parameters is reliably corm lated with low-fre- quency limit: (1) low-frequency limit varies directly with high-frequency limit (r=0.87, p < 0.01) indicating that mammals which have a high high-frequency limit also have a high (poor) low-frequency limit; (2) low- ' frequency limit varies inversely with maximum At =-0.77, p < 0.01) indicating that low-frequency hearing ability increases as interaural distance increases; and (3) low-frequency Umit varies inversely with body weight (r=-0.71,p < 0.05) indicating that large mam- mals have better low-frequency hearing than small mamnmls.
However, while each of the three parameters is reli- ably correlated with low-frequency limit, analysis using partial correlations shows that each of these three re- lationships is adequately explained by only one of the three parameters. When the partial correlation be- tween maximum •t and low-frequency limit or between body weight and low-frequency limit are calculated with high-frequency limit held constant, both correlations drop to insignificance (•---0.09, r= 0.11, respectively). Yet, when either maximum At or body weight are held constant, the correlation between high-frequency and low-frequency limits remains reliably high (z=0.64, 0.72,p< 0.05, see Table III). This analysis suggests that of the three parameters, variation in high-fre- quency limit has the closest relation to, and may be the key to understanding, the variation in low-frequency limit.
The correlation between high-frequency and low-fre- quency limits is illustrated in Fig. 10. The slope of the regression line in Fig. 10 shows that each octave change in high-frequency hearing is associated with more than a 3-octave change in low-frequency hearing. Though the relationship shown here appears quite strong, (r = 0.87, p < 0.01) there is reason to believe that it does not hold for the extreme lower end of the
scales. In particular, humans, who have the lowest high-frequency limit yet known, would be expected to have a low-frequency limit of about 4 Hz--a value sev- eral octaves below the actual limit of about 30 Hz (see point labeled H in Fig. 10). Thus, as indicated by the dotted line in Fig. 10, there may be a"floor effect" that prevents the hearing of frequencies below some
TABLE III. Correlations and partial correlations of three parameters with low-frequency limit.
60-dB high- Maximum Body Variable removed frequency limit At weight
None 0.87 a -0.77 a -0.71 60-dB high-frequency limit .... 0.09 0.11 Maximum At 0.64 a ß ß ß 0.11 Body weight 0.72 a -0.43 ß ß ß
ap < 0.05.
1596 J. Acoust. Soc. Am., Vot. 68, No. 6, December 1980 H. Heftnet and B. Masterton: Hearing in Glires 1596

10.24-
5.12
2.S6
1.28-
.08-
.04-
& s
/1218
ß
.02-
io 25 8'o High-Frequeficy Limit (ifi kHz)
FIG. 10. Relationship between high-frequency and low-frequen- cy limits of hearing in 21 species of land mammals. See Fig. 9 for key to numbers and letters. Value for humans indicated by H. Heiression calculated with human value excluded (see text). Excluding humans raises correlation coefficient from 0.87 to 0.93. C indicates estimated values for cat and P indi-
cates values for porpoise (underwater).
particular very low value.
In seeking an explanation of the inverse relationship between high-frequency and low-frequency hearing, one possibility is that the size of the auditory apparatus (e.g., the meatus, ear drum, ossicles, and basilar membrane) may in part determine the frequency re- sponse characteristics of the ear. For example, it has been argued that while a small ear may be well-suited for good high-frequency reception, good low-frequency reception may only be possible with a large ear? '• In- deed, the possibility that the size of the middle ear may •ffect an animal's hearing range is suggested by two additional lines of evidence. First, it has been demon- strated that the enlarged bullae of the kangaroo rat ap- parently serves to increase low-frequency sensitivity in the sense that experimentally reducing the volume of the b-ll•e results in a decrement in low-frequency hear- ing. 16 Thus, the enormous middle-ear cavity in kanga- roo rats may explain their ability to hear lower than predicted (p < 0.05) on the basis of their high-frequency limit (see point labeled KR in Fig. 10). Second, it ap- pears that some marine mammals such as the porpoise
ß (see point P in Fig. 10) have excellent high-frequency d•/excellent low-frequency hearing. a• Since most ani- mals are transparent to sound in water, with sound di- rectly stimulating their cochleae through their body tissues, • this observation suggests that good high- and
low-frequency hearing are more easily obtained when the ear drum and middle ear are not a factor.
For these reasons, it is tempting to conclude that good high-frequency hearing is incompatible with good low-frequency hearing as a result of limitations of the middle ear, yet we are reluctant to reach such a con- clusion until more specxes have been tested and the universality of the relationship between high-frequency and low-frequency hearing is more fully determined. Indeed, there is one mammal which seems to strain if- not contradict this relationship--namely, the cat. Though the high-frequency and low-frequency limits for the cat have not yet been established, extrapolation of existing data suggests that the cat may possess unusu- ally_good high-frequency and good low-frequency hear- ing (see point C in Fig. 10). 79 Therefore, it may not be impossible for a mammal to evolve an ear capable of transducing both very high and very low frequencies. However, the apparent rarity of these two characters in combination suggests that the selective pressures involved must be both strong and persistent.
ACKNOWLEDGMENTS
This research was supported by Grants NS12992 and HD02528, Bureau of Child Research, University of Kan- sas, and Grants NS7726 and MHl1218, Department of Psychology, Florida State University. We thank Ron- ald VanOeveren for his help in these experiments.
IB. Masterton, H. Heffner, and R. Ravizza, "The Evolution of Human Hearing," J. Aeoust. Sec. Am. 45, 966--985 (1969).
21•. B. Masterton, "Adaptation for Sound Localization in the Ear and Brainstem of Mammals," Fed. Proc. 33, 1904-1910 (1974).
3The cohort GLires consists of two orders: Lagomorpha (pikas, rabbits, and hares) and Hodentia [G. G. Simpson, "The Prin- ciples of Classification and a Classif[cation of Mammals," Bull. Am. Mus. Nat. His. 85, 1-350 (1945)].
4H. Heffner, H. Heffner, and B. Masterton, "]3ehavioral Mea- surements of Absolute and Frequency Difference Thresholds in Guinea Pig," J. Acoust. Sec. Am. 49, 1888-1895 (1971).
•-I. Heffner and B. Masterton, "Hearing in Primitive Pri- mates: Slow loris •Vycticebus coucang) and potto (Perodicti- cus porto)," J. Comp. Physiol. Psychol. 71, 175--182 (1970).
6j. B. Kelly and B. Masterton, "Auditory Sensitivity of the Al- bino Hat," J. Comp. Physiol. Psychol. 91, 930-936 (1977).
?R. L. Francis, "Behavioral Audiomerry in Mammals: HeyJew and Evaluation of Techniques," in Sound Reception in Mam- r•als, edited by H. J. Bench, A. l•e, and J. D. Pye (Aca- demic, London, 1975), pp. 187-289.
SD. Warfield, "The Study of Hearing in Animals," in Meteteds ofAnirna! •xpe•irnentation, edited by W. I. Gay (Academic, New York, 1973), Vol. 4, Chap. 2, pp. 43-141.
SS. H. Weisbroth, R. E. Flatt, and A. L. Kraus, The Biolog• of the Laboratory Rabbit (Academic, New York, 1974).
10j. I. Dalland, "Hearing Sensitivity in Bats," Science 150• 1185-1186 (1965).
11G. H. Lon{• and H. U. Schnitzler, "Behavioral Audiograms from the Bat Rl•inoloplus fe•r•rne•i•rn, "J. Comp. Physiol. 100, 211--219 (1975).
•H. Markl and G. Ehret, "Die HSrschwelle der Maus r•uscul•s)," Z. Tierpsychol. 33, 274-286 (1973).
laJ. D. Miller, "Audibility Curve of the Chinchilla," J. Acoust.
1597 J. Acoust. Soc. Am., Vol. 68, No. 6, December 1980 H. Heffner and B. Masterton: Hearing in Glires 1597

Soc. Am. 48, 513--523 (1970). 14C. H. Wollack, "Auditory Thresholds in the Raccoon (Pro-
cyon lotor)," J. Aud. Res. 5, 139-144 (1965). 15A. Ryan, "Hearing Sensitivity of the Mongolian Gerbil, Meri-
ones unguiculatis," J. Aeons,. Soc. Am. 59, 1222--1226 (1976).
16D. B. Webster and M. Webster, "Kangaroo Rat Auditory Thresholds Before •md After Middle Ear Reduction," Brain, Behar. Evol. 5, 41--53 (1972).
l?E. P. Walker, Mammals of the World (Johns Hopkins Press, Bait,more, MD, 1968), Vol. H, p. 802.
laD. A. Dewsbury, "The Use of Muriod Rodents in the Psycho- logy Laboratory," Behav. Res. Meth. Instrum. 6, 301-308 (1974).
lSF. B. Golley, Mammals of Geo•'gia (University of Athens, Athens, GA, 1962), pp. 134-141.
2øB. Mold, "Frequency Discrimination in the Common Seal," in Underwater Acoustics, edited by V. M. Albers (Plenum, New York, 1967), VoL 2, Chap. 4, pp. 43-54.
•-lj. M. Terhune and K, Ronald, "The Upper Frequency Limit of Ringed Seal Hearing," Can. J. Zool. 7, 1226--1229 (1976).
•-2j. F. Corso, "Bone-Conduction Thresholds for Sonic and Ultrasonic Frequencies," J. Acoust. Soc. Am. 35, 1738--1743 (1963).
2ZB. Masterton and L T. Diamond, "Hearing: Central Neural Mechanisms," in Handbook of Perception, edited by E. L. Carterette and M.P. Freedman (Academic, New York, 1973), Vol. HI, Chap. 18, pp. 407-448.
24G. Sales and D. Pye, Ultrasonic Communication by Animals (Chapman and Hall, London, 1974), Chap. 7, pp. 149-201.
25j. C. Smith, "Sound Communication in Rodents," in Sound Reception in Mammals, edited by R. J. Bench, A. Pye, and J. D. Pye (Academic, London, 1975), pp. 317--330.
26G. Whitney, J. R. Coble, M. D. Stockton, and E. F. Titson, "Ultrasonic Emissions: Do They Facilitate Courtship of Mice?," J. Comp. Physiol. Psychol. 34, 445--452 (1973).
27M. H. Hack, "•he Developmen'tal Preyer Befiex in the Sh-1 Mouse," J. And. Res. 8, 449-457 (1968).
laW. M. Schleidt, "Reaktionen auf TSne Hoher Freqnenz bei Nagern," Naturwissenschaften 39, 69-70 (1952).
2SK. Rails, "Auditory Sensitivity in Mice: Peromyscus and Mus musc•lus," Anita. Behav. 15, 123-128 (1967).
3øG. D. Sales, "Auditory Evoked Responses in Small Mam- mals," in Sound Reception in Mammals, edited by R. J. Bench, A. Pye, and J. D. Pye (Academic, London, 1975), pp. 187-203.
SiC. I. Berlin, "Hearing in Mice via GSR Audiometry," J. Speech Hear. Hes. 6, 359-363 (1963).
32L. M. Birch, D. Warfield, R. J. Ruben, and D. O. Mikaelian, "Behavioral Measurements of Pure Tone Thresholds in Nor-
mal CBA-J Mice," J. And. Bes. 8, 459-463 (1963). 3•R. L. Sidman, M. C. Green, and S. H. Appel, Catalog of the
Neurological Mutunts of the Mouse (Harvard U.P., Cam- bridge, MA, 1965).
•4G. Ehret, "Frequency and intensity Difference Limens and Noalinearities in the Ear of the Housemouse (Mus muscu- lus)," J. Comp. Physio1. 102, 321--336 (1975).
aSD. M. Lay, "The Anatomy, Physiology, Functional Signifi- cance and Evolution of Specialized Hearing Organs of Ger- billine Rodents," J. Morphol. 138, 41--120 (1972).
aSD. B. Webster, "A Function of the Enlarged Middle-Ear Cavi- ties of the Kangaroo Rat, Dipodomys," Physiol. Zool. 35, 248--255 (1962).
a7D. B. Webster, R. F. Aekermann, and G. C. Longs, "Central Auditory System of the Kangaroo Rat, Dipodomys me•iami," J. Comp. Neurol. 133, 477-494 (1968).
•B. Master,on, G. C. Thompson, J. K. Bechtold, and M. J. Robaras, "Neuroanatemical Basis of Binaural Phase. Dif- ference Analysis for Sound ic•calization: A Comparative Study," J. Comp. Physiol. Psy•hol. 89, 379-386 (1975).
ssK. D. McCleHand and G. D. Schlafman, "Behavioral [nvesti-
gation of Low-Frequency Sound Localization in the Kangaroo Rat," J. Aud. Res. 15, 282-288 (1975).
4øB. Mob_l, "Auditory Sensitivity of the Common Seal in Air and Water, "J. Aud. Res. 8, 27-38 (1968).
41W. D. Neff, "Localization and Lateralization of Sound in Space•" in Ciba Foundation Symposium on Hearing Mecha- nisms in Vertebra,as, edited by A. V. S. deRenck and J. Knight (Churchill, London, 1968), pp. 207--231.
42H. Heffner, "Effect of Auditory Cortex Ablation on the Lo- calization and Discrimination of Brief Sound," Neuroeci. Abstr. 2, 17(A) (1976).
4all. Heffner and B. Master,on, "Contribution of Auditory Cor- tex to Sound Localization in the Monkey (Macsea mulatta)," J. Neurophysiol. 38, 1340-1358 (1975).
44R. J. Ravizza and B. Master,on, "Contribution of Neocortex to Sound Localization in Opossum (Didelphis virginians)," J. Neurophysiol. 35, 344--356 (1972).
4sj. M. Terhane, "Directional Hearing of a Harbor Seal in Air and Water," J. Acoust. Sec. Am. 56, 1862-1865 (1974).
45A. M. Mills, "On the Minimum Audible Angie," J. Acoust. Sne. Am. 30, 237-246 (1958).
47j. B. Kelly and S. J. Glazier, "Auditory Cortex Lesions and Discrimination of Spatial Location by the Rat," Brain Res. 145, 315--321 (1978).
4SC. H. Brown, M.D. Beechef, D. B. Moody, and W. C. Steb- bins, "Localization of Pure Tones by Old World Monkeys," J. Aeons,. SOc. Am. 65, 1484-1492 (1978).
4•G. F. Kuhn, "Model for the Interaural Time Differences in the Azimuthal Plane," J. Aeons,. Sec. Am. 62• 157-167 (1977).
õ0p. K. Kuhl and J. D. Miller, "Speech Perception by the Chin- chilla: Voiced-Voiceless Distinction in Alveolar Plosive
Consonants," Science 190, 69-72 (1975). siR. J. Ravizza, H. E. Heffner, and B. Masterten, "Hearing in
Primitive Mammals, I: Opossum (Didelphis virginianus)," J. Aud. Res. 9, 1-7 (1969).
S•-R. J. Ravizza, H. E. Heftnet, and B. Master,on, "Hearing in Primitive Mammals, Ih Hedgehog (Hemiechinus auritus)," J. And. Res. 9, 8-11 (1969).
S•H. Hefiner, R. J. Ravizza, and B. Master,on, "Hearing in Primitive Mammals, IH: Tree Shrew (Tupaia glis)," J. Aud. Res. 9, 12--18 0969).
S4H. Heffner, R. J. Ravizza, and B. Master,on, "Hearing in Primitive Mammals, IV: Bushbaby (Galago senegalcrisis)," J. And. Res. 9, 19-23 (1969).
5SM. D. Beechef, "Hearing in the Owl Monkey (Aotus trivlr- gatus)," J. Comp. Physiol. Psychol. 86, 898-901 (1974).
S•M. D. Beechef, "Pure-Tone Thresholds of the Squirrel Mon- key (S•imi•'i sciureus)," J. Acoust. Sec. Am. 55, 196-198 (1974).
57S. Green, "Auditory Sensitivity and Equal Loudness in the Squirrel Monkey (Saimi•i s½iureus)," J. Exp. Anal. Behar. 23, 255--264 (1975).
5•I. Behar. J. N. Cronholm, and M. Loeb, "Auditory Sensitivi- ty of the Rhesus Monkey," J. Comp. Physiol. Psychol. 59, 426--428 (1965).
59W. C. Stebbins, S. Green, and F. L. Miller, "Auditory Sensi- tivity of the Monkey," Science 153, 1646-1647 (1966).
SOD. N. Fatter and M. M. lVrim, "A l•reliminary Report on Auditory Frequency Threshold Comparisons of Human and Pre-adoleseent Chimpanzees (Report No. 65--6)," Holloman Air Force Base, NM, U.S. Air Force 6571 Aeromedical Re- search Laboratory (1965).
•lH. Davis, "Physics and Psychology of Hearing,"' in Hearing and Deafness, edited by H. Davis and S. R. Silverman (Holt, Rinehart, and Winston, New York, X960), Chap. 2, pp. 29- 60.
•20. W. Jacobs and J. O. Hall, "Auditory Thresholds of a Fresh Water. Dolphin, Inia geoffreysis, Blainville," J. Acoust. SOc. Am. 51, 530-533 (1972).
•3C. S. Johnson, "Sound Detection Thresholds in Marine Main-
1598 J. Acoust. Soc. Am., Vol. 68, No. 6, December 1980 H. Heffner and B. Masterton: Hearing in Glires 1598

reals," in Mmrine Bio-•coustics, edited by W. N. Tavolga (Pergamon, New York, 1967), Vol. 2, pp. 247-260.
•4j. D. Hall and C. S. Johnson, "Auditory Thresholds of a Kil- ler Whale Orci•us orca Linnaeus," J. Acoust. Sec. Am. 51, 515-517 (1972).
•I. Heffner, "Hearing in Large and Small Dogs (Canisfa- milia•is)," J. Aeoust. See. Am. 58, 124(A) (1975).
6;H. J. Schusterman, R. F. BaHlet, and 1t. Nixon, "Underwater Audiogram of the California Sea Lion by the Conditioned Voealization Technique," J. Exp. Anal. Behar. 17, 339-350 0972).
z?J. M. Terhune and K. Honald, "Underwater Hearing Sensit[v- ity of Two Hinged Seals (Puss hispirie)," Can. J. Zool. 53, 227--231 (1975).
6sj. M. Terhune and K. Hona10, "The Harpseal, Pagophilus groenlandicus (Exrleben, 1777), HI. The Underwater Audio- gram," Can. J. Zoo1.50, 565-569 (1972).
•C. H. Wollack, "The Auditory Acuity of the Sheep (Ovis arizs), '* J. Aud. ties. 3, 121-132 (1963).
?øA. N. Pepper and li. B. Fay, "Sound Detection and Process- ing by Telcost Fishes: A Critical lieview," J. Acoust. So•. Am. 53, 1515--1529 (1973).
rlj. j. Loftus-Hills and B. M. Johnstone, "Auditory Function,
Communication, and Brain Evoked Response in Anuran Am- phibians," J. Acoust. See. Am. 45, 1131-1133 0-969).
raW. C. Patterson, "Hearing in the Turtle," J. Aud. lies. 6, 453-464 (1966).
?aB. A. Weiss and W. F. Strother, "Hearing in the Green Tree- frog (Hy/a ciderda ci•e•ea)," J. Aud. Res. 5, 297--305 (1965).
r4E. G. Wever, The Reptile Ear (Princeton U.P., PrinCeton, NJ, 1978).
rSM. B. Sachs, J. M. S/nnott, and R. D. Hienz, -"Behavioral and Physiological Studies of Hearing in Birds," Fed. Proc. 37, 2329--2335 (1978).
r6G. yon Bekesy, Experiments i• Hea•i•g (McGraw-Hill, New York, 1960), Chap. 12, p. 510.
rrS. Mo Khanna and J. Tonndorf, "Middle Ear Power Trans- fer," Arch. Klin. Exp. Ohrcn-Nasen-Kehlkopfheikd. 193, 78-
.88 (1969).
?aj. G. McCormick, E. G. Wever, J. Palin, and S. H. Ridgway, "Sound Conduction in the Dolphin Ear," J. Acoust. Sos. Am. 48, 1418-1428 (1970).
r•j. D. Miller, C. $. Watson, and W. P. Covert, "Deafening Effects of Noise on the Cat," Acta Ote-Laryngol. •uppl. 176, 1-91 (1963).
1599 J. Acoust. Soc. Am., VoL 68, No. 6, December 1980 H. Hefther and B. Masterton: Hearing in Glires 1599