Who's Leading the Leading Health Indicators? Webinar: Maternal ...
Healthy People 2020 Leading Health Indicators:
Progress Update
American Samoa
Federated States of Micronesia
Republic ofMarshall Islands
Commonwealth of Northern Mariana Islands
U.S. Virgin Islands
Palau
Puerto Rico
Guam
AlaskaHawaii
www.healthypeople.gov
2
Healthy People 2020 Leading Health Indicators: Progress Update
March 2014
Executive Summary
Healthy People 2020 (HP2020) provides a comprehensive set of 10-year, national goals and objectives for improving the health of all Americans. The initiative tracks the nation’s health through over 1,200 objectives that span 42 distinct public health topic areas. The HP2020 Leading Health Indicators (LHIs) are a select subset of Healthy People objectives chosen to communicate high-priority health issues and actions that can be taken to address them. There are 26 LHIs organized into 12 topics.
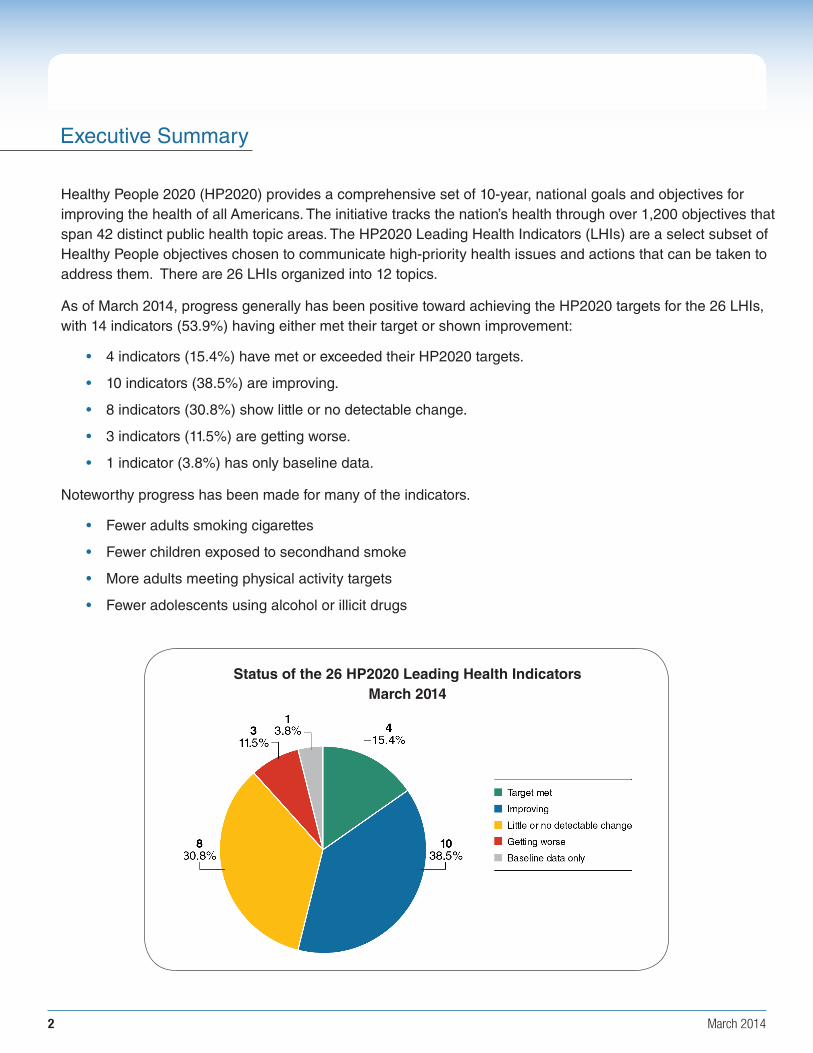
As of March 2014, progress generally has been positive toward achieving the HP2020 targets for the 26 LHIs, with 14 indicators (53.9%) having either met their target or shown improvement:
• 4 indicators (15.4%) have met or exceeded their HP2020 targets.
• 10 indicators (38.5%) are improving.
• 8 indicators (30.8%) show little or no detectable change.
• 3 indicators (11.5%) are getting worse.
• 1 indicator (3.8%) has only baseline data.
Noteworthy progress has been made for many of the indicators.
• Fewer adults smoking cigarettes
• Fewer children exposed to secondhand smoke
• More adults meeting physical activity targets
• Fewer adolescents using alcohol or illicit drugs
Status of the 26 HP2020 Leading Health IndicatorsMarch 2014
March 2014 3
Healthy People 2020 Leading Health Indicators: Progress Update
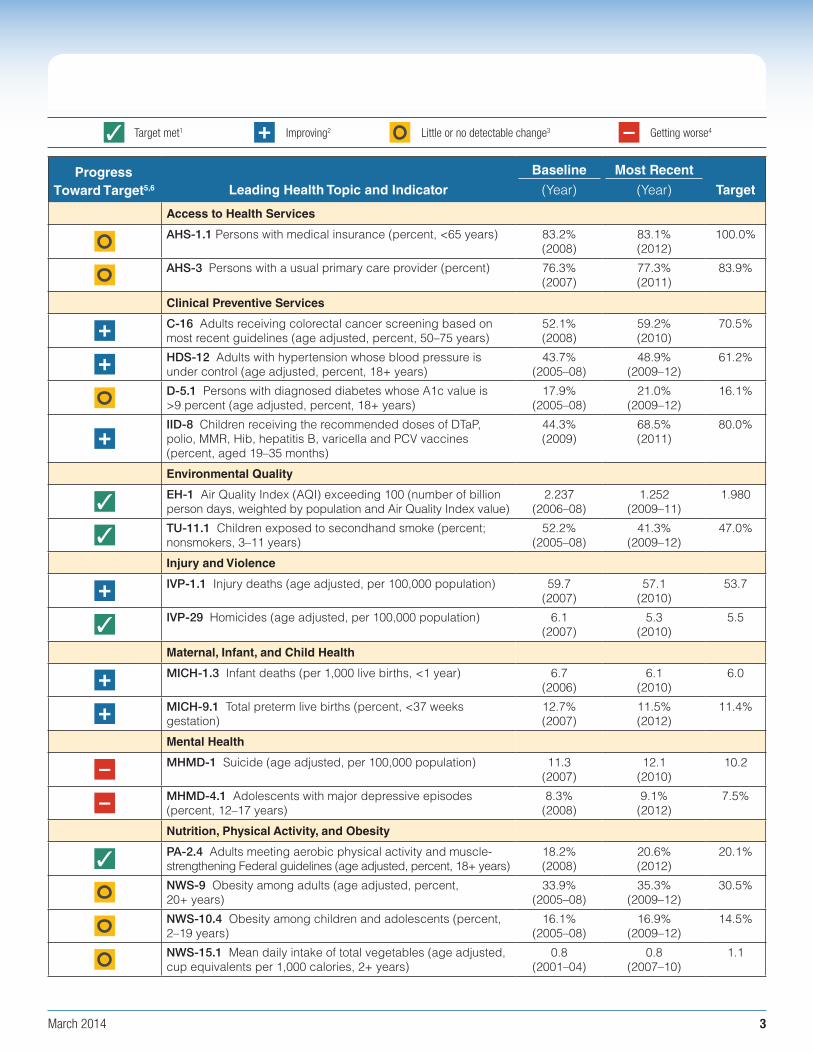
✓ Target met1 + Improving2 Little or no detectable change3 – Getting worse4
Leading Health Topic and Indicator
Baseline
(Year)Most Recent
(Year) Target
Access to Health Services blank blank blankAHS-1.1 Persons with medical insurance (percent, <65 years) 83.2%
(2008)83.1%(2012)
100.0%
AHS-3 Persons with a usual primary care provider (percent) 76.3%(2007)
77.3%(2011)
83.9%
Blank Clinical Preventive Services blank blank blank
+ C-16 Adults receiving colorectal cancer screening based on most recent guidelines (age adjusted, percent, 50–75 years)
52.1%(2008)
59.2%(2010)
70.5%
+ HDS-12 Adults with hypertension whose blood pressure is under control (age adjusted, percent, 18+ years)
43.7%(2005–08)
48.9%(2009–12)
61.2%
D-5.1 Persons with diagnosed diabetes whose A1c value is >9 percent (age adjusted, percent, 18+ years)
17.9%(2005–08)
21.0%(2009–12)
16.1%
+IID-8 Children receiving the recommended doses of DTaP, polio, MMR, Hib, hepatitis B, varicella and PCV vaccines (percent, aged 19–35 months)
44.3%(2009)
68.5%(2011)
80.0%
Blank Environmental Quality blank blank blank
✓EH-1 Air Quality Index (AQI) exceeding 100 (number of billion person days, weighted by population and Air Quality Index value)
2.237(2006–08)
1.252(2009–11)
1.980
✓TU-11.1 Children exposed to secondhand smoke (percent; nonsmokers, 3–11 years)
52.2%(2005–08)
41.3%(2009–12)
47.0%
Blank Injury and Violence blank blank blank
+ IVP-1.1 Injury deaths (age adjusted, per 100,000 population) 59.7(2007)
57.1(2010)
53.7
✓IVP-29 Homicides (age adjusted, per 100,000 population) 6.1
(2007)5.3
(2010)5.5
Blank Maternal, Infant, and Child Health blank blank blank
+ MICH-1.3 Infant deaths (per 1,000 live births, <1 year) 6.7(2006)
6.1(2010)
6.0
+ MICH-9.1 Total preterm live births (percent, <37 weeks gestation)
12.7%(2007)
11.5%(2012)
11.4%
Blank Mental Health blank blank blank
– MHMD-1 Suicide (age adjusted, per 100,000 population) 11.3(2007)
12.1(2010)
10.2
– MHMD-4.1 Adolescents with major depressive episodes (percent, 12–17 years)
8.3%(2008)
9.1%(2012)
7.5%
Blank Nutrition, Physical Activity, and Obesity blank blank blank
✓PA-2.4 Adults meeting aerobic physical activity and muscle- strengthening Federal guidelines (age adjusted, percent, 18+ years)
18.2%(2008)
20.6%(2012)
20.1%
NWS-9 Obesity among adults (age adjusted, percent, 20+ years)
33.9%(2005–08)
35.3%(2009–12)
30.5%
NWS-10.4 Obesity among children and adolescents (percent, 2–19 years)
16.1%(2005–08)
16.9%(2009–12)
14.5%
NWS-15.1 Mean daily intake of total vegetables (age adjusted, cup equivalents per 1,000 calories, 2+ years)
0.8(2001–04)
0.8(2007–10)
1.1
Blank
Progress
Toward Target5,6
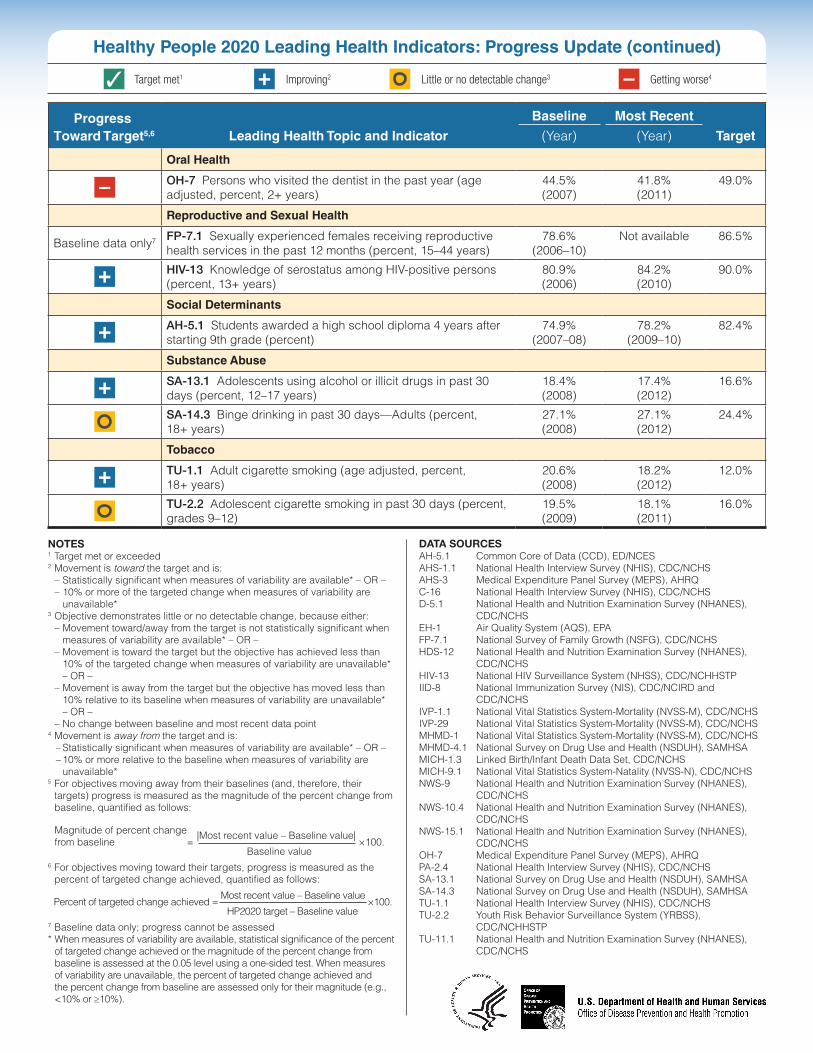
✓ Target met1 + Improving2 Little or no detectable change3 – Getting worse4
Leading Health Topic and Indicator
Baseline
(Year)Most Recent
(Year) Target
Blank Oral Health blank blank blank
– OH-7 Persons who visited the dentist in the past year (age adjusted, percent, 2+ years)
44.5%(2007)
41.8%(2011)
49.0%
Blank Reproductive and Sexual Health blank blank blank
Baseline data only7 FP-7.1 Sexually experienced females receiving reproductive health services in the past 12 months (percent, 15–44 years)
78.6%(2006–10)
Not available 86.5%
+ HIV-13 Knowledge of serostatus among HIV-positive persons (percent, 13+ years)
80.9%(2006)
84.2%(2010)
90.0%
Blank Social Determinants blank blank blank
+ AH-5.1 Students awarded a high school diploma 4 years after starting 9th grade (percent)
74.9%(2007–08)
78.2%(2009–10)
82.4%
Blank Substance Abuse blank blank blank
+ SA-13.1 Adolescents using alcohol or illicit drugs in past 30 days (percent, 12–17 years)
18.4%(2008)
17.4%(2012)
16.6%
SA-14.3 Binge drinking in past 30 days—Adults (percent, 18+ years)
27.1%(2008)
27.1%(2012)
24.4%
Blank Tobacco blank blank blank
+ TU-1.1 Adult cigarette smoking (age adjusted, percent, 18+ years)
20.6%(2008)
18.2%(2012)
12.0%
TU-2.2 Adolescent cigarette smoking in past 30 days (percent, grades 9–12)
19.5%(2009)
18.1%(2011)
16.0%
Healthy People 2020 Leading Health Indicators: Progress Update (continued)
Progress Toward Target5,6
NOTES1 Target met or exceeded2 Movement is toward the target and is:
– Statistically significant when measures of variability are available* – OR – – 10% or more of the targeted change when measures of variability are unavailable*
3 Objective demonstrates little or no detectable change, because either: – Movement toward/away from the target is not statistically significant when measures of variability are available* – OR –
– Movement is toward the target but the objective has achieved less than 10% of the targeted change when measures of variability are unavailable* – OR –
– Movement is away from the target but the objective has moved less than 10% relative to its baseline when measures of variability are unavailable* – OR –
– No change between baseline and most recent data point4 Movement is away from the target and is:
– Statistically significant when measures of variability are available* – OR – – 10% or more relative to the baseline when measures of variability are unavailable*
5 For objectives moving away from their baselines (and, therefore, their targets) progress is measured as the magnitude of the percent change from baseline, quantified as follows:
Magnitude of percent change from baseline =
|Most recent value – Baseline value| ×100.
Baseline value 6 For objectives moving toward their targets, progress is measured as the
percent of targeted change achieved, quantified as follows:
Percent of targeted change achieved = Most recent value – Baseline value
×100. HP2020 target – Baseline value
7 Baseline data only; progress cannot be assessed* When measures of variability are available, statistical significance of the percent
of targeted change achieved or the magnitude of the percent change from baseline is assessed at the 0.05 level using a one-sided test. When measures of variability are unavailable, the percent of targeted change achieved and the percent change from baseline are assessed only for their magnitude (e.g., <10% or ≥10%).
DATA SOURCESAH-5.1 Common Core of Data (CCD), ED/NCESAHS-1.1 National Health Interview Survey (NHIS), CDC/NCHSAHS-3 Medical Expenditure Panel Survey (MEPS), AHRQC-16 National Health Interview Survey (NHIS), CDC/NCHS D-5.1 National Health and Nutrition Examination Survey (NHANES),
CDC/NCHSEH-1 Air Quality System (AQS), EPA FP-7.1 National Survey of Family Growth (NSFG), CDC/NCHSHDS-12 National Health and Nutrition Examination Survey (NHANES),
CDC/NCHSHIV-13 National HIV Surveillance System (NHSS), CDC/NCHHSTPIID-8 National Immunization Survey (NIS), CDC/NCIRD and
CDC/NCHSIVP-1.1 National Vital Statistics System-Mortality (NVSS-M), CDC/NCHSIVP-29 National Vital Statistics System-Mortality (NVSS-M), CDC/NCHSMHMD-1 National Vital Statistics System-Mortality (NVSS-M), CDC/NCHS MHMD-4.1 National Survey on Drug Use and Health (NSDUH), SAMHSAMICH-1.3 Linked Birth/Infant Death Data Set, CDC/NCHSMICH-9.1 National Vital Statistics System-Natality (NVSS-N), CDC/NCHSNWS-9 National Health and Nutrition Examination Survey (NHANES),
CDC/NCHSNWS-10.4 National Health and Nutrition Examination Survey (NHANES),
CDC/NCHSNWS-15.1 National Health and Nutrition Examination Survey (NHANES),
CDC/NCHSOH-7 Medical Expenditure Panel Survey (MEPS), AHRQPA-2.4 National Health Interview Survey (NHIS), CDC/NCHSSA-13.1 National Survey on Drug Use and Health (NSDUH), SAMHSASA-14.3 National Survey on Drug Use and Health (NSDUH), SAMHSATU-1.1 National Health Interview Survey (NHIS), CDC/NCHSTU-2.2 Youth Risk Behavior Surveillance System (YRBSS),
CDC/NCHHSTP TU-11.1 National Health and Nutrition Examination Survey (NHANES),
CDC/NCHS